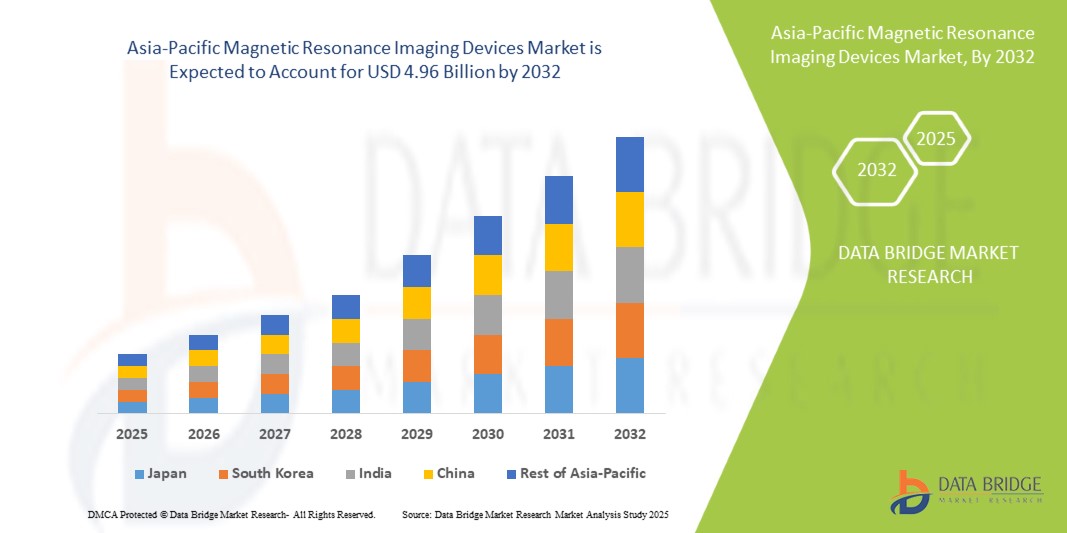
Image

Mercado de dispositivos de imágenes por resonancia magnética de Asia y el Pacífico: tendencias de la industria y pronóstico para 2029

Dispositivos médicos

Image

Mercado de dispositivos de imágenes por resonancia magnética de Asia y el Pacífico: tendencias de la industria y pronóstico para 2029

  • Dispositivos médicos
  • Próximo informe
  • mayo 2022
  • Asia-Pacífico
  • 350 páginas
  • Número de mesas: 220
  • Número de figuras: 60

Mercado de dispositivos de imágenes por resonancia magnética de Asia y el Pacífico: tendencias de la industria y pronóstico para 2029

Tamaño del mercado en miles de millones de dólares

CAGR: % Diagram

Diagram Período de pronóstico 2021-2029
Diagram Tamaño del mercado (año base) 3,43 mil millones de dólares
Diagram Tamaño del mercado (año previsto) 4,49 mil millones de dólares
Diagram CAGR %

Mercado de dispositivos de imágenes por resonancia magnética de Asia y el Pacífico por intensidad de campo (sistemas de resonancia magnética de campo alto, sistemas de resonancia magnética de campo medio, sistemas de resonancia magnética de campo bajo y otros), tipo (sistemas de resonancia magnética cerrados, sistemas de resonancia magnética de calibre ancho y sistemas de resonancia magnética abiertos), modalidad ( Sistema estacionario, sistema portátil/móvil y sistema de punto de atención (POC), indicación (cerebro y neurológica, musculoesquelética, cardiología, mamografía, oncología, pélvica y abdominal, ginecología, urología, odontología y otros), usuario final ( Hospitales, centros de diagnóstico, centros de imágenes, clínicas especializadas, centros de cirugía ambulatoria e institutos académicos y de investigación), canal de distribución (licitación directa y ventas minoristas): tendencias de la industria y pronóstico para 2029

Asia-Pacific Magnetic Resonance Imaging Devices Market

Análisis y tamaño del mercado

Según el Instituto Australiano de Salud y Bienestar, alrededor de 459.000 australianos vivirán con demencia en 2020, y casi 1,6 millones de personas necesitarán atención. Según estimaciones, el número de personas con demencia Se prevé que aumente a 1,1 millones en 2058. La mejor herramienta para el diagnóstico por imágenes y la investigación en neurociencia es la resonancia magnética (MRI). Proporciona imágenes morfológicas de alta resolución con un contraste inigualable de los tejidos blandos e información funcional única sobre el sistema nervioso central (SNC). La resonancia magnética también se puede utilizar para diagnosticar anomalías y controlar enfermedades degenerativas como la esclerosis múltiple, la enfermedad de Alzheimer y la demencia, y documentar lesiones cerebrales por traumatismos.

Data Bridge Market Research analiza que la resonancia magnética de Asia-Pacífico mercado de dispositivos de imagen estaba valorado en 3,43 mil millones de dólares en 2021, se dispararía hasta 4,49 mil millones de dólares para 2029 y se espera que experimente una tasa compuesta anual del 3,41% durante el período de pronóstico de 2022 a 2029. El informe de mercado elaborado por el equipo de investigación de mercado de Data Bridge incluye en -análisis de expertos en profundidad, epidemiología de pacientes, análisis de tuberías, análisis de precios y marco regulatorio.

Definición de mercado

Las máquinas de dispositivos de imágenes por resonancia magnética utilizan procedimientos que se utilizan principalmente en radiología para tomar fotografías de los procesos fisiológicos y la anatomía del cuerpo del paciente. Los tumores cerebrales, la esclerosis múltiple, los accidentes cerebrovasculares, las lesiones cerebrales, las anomalías del desarrollo, la demencia, las infecciones y las causas del dolor de cabeza se diagnostican con imágenes de resonancia magnética. El método de exploración por imágenes por resonancia magnética es una herramienta de diagnóstico no invasiva que se utiliza para diagnosticar diversos trastornos médicos.

Alcance del informe y segmentación del mercado

Métrica de informe

Detalles

Período de pronóstico

2022 a 2029

Año base

2021

Años históricos

2020 (Personalizable para 2019 - 2014)

Unidades Cuantitativas

Ingresos en miles de millones de dólares, volúmenes en unidades, precios en dólares

Segmentos cubiertos

Intensidad de campo (sistemas de resonancia magnética de campo alto, sistemas de resonancia magnética de campo medio, sistemas de resonancia magnética de campo bajo y otros), tipo (sistemas de resonancia magnética cerrados, sistemas de resonancia magnética de calibre ancho y sistemas abiertos de resonancia magnética), modalidad (sistema estacionario, sistema portátil/móvil y punto Sistema de atención (POC), indicación (cerebro y neurológica, musculoesquelética, cardiología, mamografía, oncología, pélvica y abdominal, ginecología, urología, odontología y otros), usuario final (hospitales, centros de diagnóstico, centros de imágenes, clínicas especializadas , Centros de Cirugía Ambulatoria e Institutos de Investigación Académica), Canal de Distribución (Licitación Directa y Venta Minorista)

Países cubiertos

China, Japón, India, Corea del Sur, Singapur, Malasia, Australia, Tailandia, Indonesia, Filipinas, Resto de Asia-Pacífico (APAC) en Asia-Pacífico (APAC)

Actores del mercado cubiertos

Aspect Imaging Ltd. (EE.UU.), CANON MEDICAL SYSTEMS CORPORATION (Japón), Siemens Healthcare GmbH (Alemania), GE Healthcare (EE.UU.), Hitachi, Ltd. (Japón), Koninklijke Philips NV (Países Bajos), Neusoft Corporation (China), ESAOTE SPA (Italia), AllTech Medical Systems (China), Shanghai United Imaging Medical Technology Co., Ltd (China), United Imaging Intelligence (China), Medonica Co. LTD (China), IMRIS (EE. UU.), SG HealthCare (China) ), Elekta AB (Suecia), Beijing Wandong Medical Technology Co.,Ltd, (China), FONAR Corp. (EE.UU.), Synaptive Medical (Canada)

Oportunidades de mercado

  • Aumento del gasto sanitario
  • Aumento de la incidencia de enfermedades.

Dispositivos de imágenes por resonancia magnética Dinámica del mercado

Conductores

  • Auge de las técnicas de Imagen por Resonancia Magnética (MRI)

Los principales impulsores de la demanda de dispositivos de resonancia magnética son un mayor interés en sustituir los sistemas de resonancia magnética de bajo nivel por resonancia magnética de alto nivel, el aumento de la edad de las personas mayores, el aumento de la conciencia sobre el diagnóstico precoz, la introducción de las técnicas de resonancia magnética y un aumento de la incidencia de enfermedades crónicas.

  • Aumento de la enfermedad pulmonar obstructiva crónica (EPOC)

El aumento del consumo de tabaco, la inactividad física, la contaminación del aire, la presión laboral y los cambios en la dieta son las principales causas de enfermedades cardiovasculares y EPOC. El aumento de la aparición de enfermedades ha llevado a las organizaciones a tomar medidas para combatir el problema aumentando la conciencia sobre la importancia de la detección temprana.

  • Una mayor conciencia mejoraría el mercado de Dispositivos de imágenes por resonancia magnética Sistemas

Según una investigación de la Organización Mundial de la Salud (OMS), se prevé que algunos problemas de salud como la demencia, el cáncer, el aumento de las caídas, la obesidad y la diabetes aumenten a medida que la población envejece. Como resultado, crecerá en el mercado la necesidad de exploraciones por resonancia magnética para la detección y exploración de enfermedades.

Oportunidades

Aumento de la población envejecida y enfermedades crónicas, el mercado de imágenes por resonancia magnética en Asia Pacífico está en auge. Además, durante el período de proyección de 2022 a 2029, el aumento del gasto sanitario está impulsando el crecimiento del mercado. Además, el aumento de las actividades de investigación en la región APAC brindará oportunidades de expansión del mercado durante el período de proyección y más allá. Se prevé que la población de mayor edad crecerá en un futuro próximo, haciéndolas más susceptibles a dolencias crónicas como enfermedades cardiovasculares y neurológicas, impulsando el mercado durante el período previsto.

Como resultado de los factores antes mencionados y de la economía de más rápido crecimiento de la región de Asia y el Pacífico, los sectores de atención médica y los avances en la investigación médica, se prevé que la industria de la salud crezca significativamente en el futuro cercano.

Restricciones/Desafíos

La principal queja de los investigadores es que las imágenes por resonancia magnética sólo pueden observar el flujo sanguíneo en el cerebro. No puede centrarse en la actividad de las células nerviosas individuales (neuronas), que son esenciales para la función mental. Cada área del cerebro estudiada por resonancia magnética está formada por miles de neuronas individuales, cada una con su propia historia que contar. Es difícil decir exactamente qué tipo de actividad cerebral se refleja en una exploración por resonancia magnética funcional porque partes específicas del cerebro que se "iluminan" en la exploración podrían representar una variedad de tareas. Además, interpretar los resultados de una resonancia magnética funcional puede resultar complicado.

Sin embargo, durante el período de pronóstico, se prevé que el alto costo de los sistemas de imágenes por resonancia magnética, las retiradas de productos y el creciente uso de equipos de imágenes por resonancia magnética reacondicionados y reciclados sofoquen el crecimiento de los equipos de imágenes por resonancia magnética.

Este informe de mercado de Dispositivos de imágenes por resonancia magnética proporciona detalles de nuevos desarrollos recientes, regulaciones comerciales, análisis de importación y exportación, análisis de producción, optimización de la cadena de valor, participación de mercado, impacto de los actores del mercado nacional y localizado, analiza oportunidades en términos de bolsillos de ingresos emergentes, cambios. en regulaciones de mercado, análisis estratégico de crecimiento del mercado, tamaño del mercado, crecimientos del mercado de categorías, nichos de aplicación y dominio, aprobaciones de productos, lanzamientos de productos, expansiones geográficas, innovaciones tecnológicas en el mercado. Para obtener más información sobre el mercado de dispositivos de imágenes por resonancia magnética, comuníquese con Data Bridge Market Research para obtener un resumen del analista; nuestro equipo lo ayudará a tomar una decisión de mercado informada para lograr el crecimiento del mercado.

Impacto de COVID-19 en el mercado de dispositivos de imágenes por resonancia magnética

Se prevé que el mayor número de casos de COVID-19 influya negativamente en el mercado de resonancia magnética en América del Norte. COVID-19 tuvo un impacto significativo en el negocio de servicios de diagnóstico de rutina. Los gobiernos de todo el mundo han restringido el uso de imágenes por resonancia magnética debido al considerable riesgo de contaminación asociado con equipos tan masivos. Para evitar que el virus infecte los equipos de diagnóstico, la recomendación recomendaba suspender temporalmente el uso de equipos como las resonancias magnéticas y las tomografías computarizadas. Sin embargo, dado que las herramientas de diagnóstico por imágenes, como la resonancia magnética, representan un componente vital de los servicios de atención médica, no es probable que el impacto sea a largo plazo.

Alcance del mercado de dispositivos de imágenes por resonancia magnética de Asia y el Pacífico

El mercado de dispositivos de imágenes por resonancia magnética está segmentado según la arquitectura, la intensidad del campo, la modalidad, la indicación, la aplicación, el canal de distribución y el usuario final. El crecimiento entre estos segmentos lo ayudará a analizar los segmentos de escaso crecimiento en las industrias y brindará a los usuarios una valiosa descripción general del mercado e información sobre el mercado para ayudarlos a tomar decisiones estratégicas para identificar las aplicaciones principales del mercado.

Arquitectura

  • Sistemas cerrados de resonancia magnética
  • Sistemas abiertos de resonancia magnética

Campo de fuerza

  • Sistemas de resonancia magnética de campo bajo
  • Sistemas de resonancia magnética de alto campo
  • Sistemas de resonancia magnética de campo muy alto y sistemas de resonancia magnética de campo ultraalto

Solicitud

  • Oncología
  • Neurología
  • Cardiología
  • Gastroenterología
  • musculoesquelético
  • Otras aplicaciones

Modalidad

Indicación

  • Cerebro
  • Neurológico
  • musculoesquelético
  • Cardiología
  • Mamografía
  • Oncología
  • Pélvica y Abdominal
  • Ginecología
  • Urología
  • Dentales y otros

Usuario final

  • hospitales
  • Centros de Diagnóstico
  • Centros de Imagenología
  • Clínicas especializadas
  • Centros de cirugía ambulatoria
  • Institutos de investigación académica

Canal de distribución

  • Licitación directa
  • Ventas al por menor

Dispositivos de imágenes por resonancia magnética Análisis/perspectivas regionales del mercado

Se analiza el mercado de dispositivos de imágenes por resonancia magnética y se proporcionan conocimientos y tendencias sobre el tamaño del mercado por país, arquitectura, intensidad de campo, modalidad, indicación, aplicación, canal de distribución y usuario final como se mencionó anteriormente.

Los países cubiertos en el informe del mercado de dispositivos de imágenes por resonancia magnética son China, Japón, India, Corea del Sur, Singapur, Malasia, Australia, Tailandia, Indonesia, Filipinas, el resto de Asia-Pacífico (APAC) en Asia-Pacífico (APAC).

La sección de países del informe también proporciona factores que impactan el mercado individual y cambios en la regulación del mercado que impactan las tendencias actuales y futuras del mercado. Puntos de datos como el análisis de la cadena de valor ascendente y descendente, las tendencias técnicas y el análisis de las cinco fuerzas de Porter y los estudios de casos son algunos de los indicadores utilizados para pronosticar el escenario del mercado para países individuales. Además, se consideran la presencia y disponibilidad de marcas globales y los desafíos que enfrentan debido a la competencia grande o escasa de marcas locales y nacionales, el impacto de los aranceles internos y las rutas comerciales, al tiempo que se proporciona un análisis de pronóstico de los datos del país.

Crecimiento de la infraestructura sanitaria Base instalada y penetración de nuevas tecnologías

El mercado de dispositivos de imágenes por resonancia magnética también le proporciona un análisis de mercado detallado para cada país, el crecimiento del gasto en atención médica para equipos de capital, la base instalada de diferentes tipos de productos para el mercado de dispositivos de imágenes por resonancia magnética, el impacto de la tecnología que utiliza curvas de línea de vida y los cambios en la regulación de la atención médica. Escenarios y su impacto en el mercado de dispositivos de imágenes por resonancia magnética. Los datos están disponibles para el período histórico 2010-2020.

Panorama competitivo y cuota de mercado Análisis Dispositivos de imágenes por resonancia magnética

El panorama competitivo del mercado de dispositivos de imágenes por resonancia magnética proporciona detalles por competidor. Los detalles incluidos son descripción general de la empresa, finanzas de la empresa, ingresos generados, potencial de mercado, inversión en investigación y desarrollo, nuevas iniciativas de mercado, presencia global, sitios e instalaciones de producción, capacidades de producción, fortalezas y debilidades de la empresa, lanzamiento de producto, ancho y amplitud del producto, aplicación. dominio. Los puntos de datos anteriores proporcionados sólo están relacionados con el enfoque de las empresas en el mercado de dispositivos de imágenes por resonancia magnética.

Algunos de los principales actores que operan en el mercado de dispositivos de imágenes por resonancia magnética son:

  • Aspect Imaging Ltd. (EE. UU.)
  • CORPORACIÓN DE SISTEMAS MÉDICOS CANON (Japón)
  • Siemens Healthcare GmbH (Alemania)
  • GE Healthcare (EE. UU.)
  • Hitachi, Ltd. (Japón)
  • Koninklijke Philips NV (Países Bajos)
  • Corporación Neusoft (China)
  • ESAOTE SPA (Italia)
  • Sistemas médicos AllTech (China)
  • Shanghai United Imaging Medical Technology Co., Ltd (China)
  • Inteligencia de imágenes unidas (China)
  • Medonica Co. LTD (China)
  • IMRIS (Estados Unidos)
  • SG HealthCare (China)
  • Elekta AB (Suecia)
  • Tecnología médica Co., Ltd de Beijing Wandong. (Porcelana)
  • FONAR Corp. (Estados Unidos)
  • Médico sinaptivo (Canada)


SKU-

LISTA DE TABLAS

TABLA 1 PRODUCTOS DE DISPOSITIVOS DE IMAGEN POR RESONANCIA MAGNÉTICA REACONDICIONADOS

TABLA 2 COSTO DE LOS DISPOSITIVOS DE IMAGEN POR RESONANCIA MAGNÉTICA DE DIFERENTES MODELOS

TABLA 3 PRODUCTO DEL RETIRADO DE LA FDA

CUADRO 4 GASTO EN SALUD EN ASIA-PACÍFICO

TABLA 5 GASTO FEDERAL Y GASTO TRIBUTARIO EN ATENCIÓN MÉDICA EN 2018

TABLA 6 COMPOSICIÓN DEL GASTO FEDERAL EN ATENCIÓN MÉDICA EN EE.UU.

TABLA 7 MERCADO DE DISPOSITIVOS DE IMAGEN POR RESONANCIA MAGNÉTICA DE ASIA Y EL PACÍFICO, POR INTENSIDAD DE CAMPO, 2018 – 2027, (MILLONES DE USD)

TABLA 8 SISTEMAS DE MRI DE CAMPO ALTO EN EL MERCADO DE DISPOSITIVOS DE IMAGEN POR RESONANCIA MAGNÉTICA DE ASIA Y EL PACÍFICO, POR REGIÓN, 2018-2027 (MILLONES DE USD)

TABLA 9 SISTEMAS DE MRI DE CAMPO MEDIO EN EL MERCADO DE DISPOSITIVOS DE IMAGEN POR RESONANCIA MAGNÉTICA DE ASIA Y EL PACÍFICO, POR REGIÓN, 2018-2027 (MILLONES DE USD)

TABLA 10 SISTEMAS DE MRI DE CAMPO BAJO EN EL MERCADO DE DISPOSITIVOS DE IMAGEN POR RESONANCIA MAGNÉTICA DE ASIA Y EL PACÍFICO, POR REGIÓN, 2018-2027 (MILLONES DE USD)

TABLA 11 ASIA Y EL PACÍFICO OTROS EN EL MERCADO DE DISPOSITIVOS DE IMAGEN POR RESONANCIA MAGNÉTICA, POR REGIÓN, 2018-2027 (MILLONES DE USD)

TABLA 12 MERCADO DE DISPOSITIVOS DE IMAGEN POR RESONANCIA MAGNÉTICA DE ASIA Y EL PACÍFICO, POR TIPO, 2018-2027 (MILLONES DE USD)

TABLA 13 MERCADO DE DISPOSITIVOS DE IMAGEN POR RESONANCIA MAGNÉTICA DE ASIA Y EL PACÍFICO, POR TIPO, 2018-2027 (UNIDADES)

TABLA 14 SISTEMAS DE MRI CERRADOS DE ASIA Y EL PACÍFICO EN EL MERCADO DE DISPOSITIVOS DE IMAGEN POR RESONANCIA MAGNÉTICA, POR REGIÓN, 2018-2027 (MILLONES DE USD)

TABLA 15 SISTEMAS DE MRI CERRADOS DE ASIA Y EL PACÍFICO EN EL MERCADO DE DISPOSITIVOS DE IMAGEN POR RESONANCIA MAGNÉTICA, POR TIPO, 2018-2027 (MILLONES DE USD)

TABLA 16 MERCADO DE DISPOSITIVOS DE IMÁGENES DE RESONANCIA MAGNÉTICA DE MRI DE ANCHO ANCHO DE ASIA Y EL PACÍFICO, POR REGIÓN, 2018-2027 (MILLONES DE USD)

TABLA 17 MERCADO DE DISPOSITIVOS DE IMAGEN POR RESONANCIA MAGNÉTICA DE MRI DE ANCHO ANCHO DE ASIA Y EL PACÍFICO, POR TIPO, 2018-2027 (MILLONES DE USD)

TABLA 18 SISTEMAS ABIERTOS DE MRI EN EL MERCADO DE DISPOSITIVOS DE IMAGEN POR RESONANCIA MAGNÉTICA DE ASIA Y EL PACÍFICO, POR REGIÓN, 2018-2027 (MILLONES DE USD)

TABLA 19 SISTEMAS ABIERTOS DE MRI EN EL MERCADO DE DISPOSITIVOS DE IMAGEN POR RESONANCIA MAGNÉTICA DE ASIA Y EL PACÍFICO, POR TIPO, 2018-2027 (MILLONES DE USD)

TABLA 20 MERCADO DE DISPOSITIVOS DE IMAGEN POR RESONANCIA MAGNÉTICA DE ASIA Y EL PACÍFICO, POR MODALIDAD, 2018-2027 (MILLONES DE USD)

TABLA 21 SISTEMA ESTACIONARIO DE ASIA Y EL PACÍFICO EN EL MERCADO DE DISPOSITIVOS DE IMAGEN POR RESONANCIA MAGNÉTICA, POR REGIÓN, 2018-2027 (MILLONES DE USD)

TABLA 22 MERCADO DE SISTEMA PORTÁTIL/MÓVIL DE ASIA Y EL PACÍFICO EN DISPOSITIVOS DE IMAGEN POR RESONANCIA MAGNÉTICA, POR REGIÓN, 2018-2027 (MILLONES DE USD)

TABLA 23 SISTEMA DE PUNTO DE ATENCIÓN (POC) DE ASIA Y EL PACÍFICO EN EL MERCADO DE DISPOSITIVOS DE IMAGEN POR RESONANCIA MAGNÉTICA, POR REGIÓN, 2018-2027 (MILLONES DE USD)

TABLA 24 MERCADO DE DISPOSITIVOS DE IMAGEN POR RESONANCIA MAGNÉTICA DE ASIA Y EL PACÍFICO, POR INDICACIÓN, 2018-2027 (MILLONES DE USD)

TABLA 25 MERCADO DE DISPOSITIVOS DE IMAGEN POR RESONANCIA MAGNÉTICA DEL CEREBRO Y NEUROLÓGICO DE ASIA Y EL PACÍFICO, POR REGIÓN, 2018-2027 (MILLONES DE USD)

TABLA 26 MERCADO DE DISPOSITIVOS DE IMAGEN POR RESONANCIA MAGNÉTICA DEL CEREBRO Y NEUROLÓGICO DE ASIA Y EL PACÍFICO, POR INDICACIÓN, 2018-2027 (MILLONES DE USD)

TABLA 27 MERCADO DE DISPOSITIVOS DE IMAGEN POR RESONANCIA MAGNÉTICA MUSCULOESQUELÉTICO DE ASIA Y EL PACÍFICO, POR REGIÓN, 2018-2027 (MILLONES DE USD)

TABLA 28 MERCADO MUSCULOESQUELÉTICO DE ASIA Y PACÍFICO EN DISPOSITIVOS DE IMAGEN POR RESONANCIA MAGNÉTICA, POR INDICACIÓN, 2018-2027 (MILLONES DE USD)

TABLA 29 MERCADO DE DISPOSITIVOS DE IMAGEN POR RESONANCIA MAGNÉTICA EN CARDIOLOGÍA DE ASIA Y EL PACÍFICO, POR REGIÓN, 2018-2027 (MILLONES DE USD)

TABLA 30 MERCADO DE DISPOSITIVOS DE IMAGEN POR RESONANCIA MAGNÉTICA EN CARDIOLOGÍA DE ASIA Y EL PACÍFICO, POR INDICACIÓN, 2018-2027 (MILLONES DE USD)

TABLA 31 MERCADO DE MAMOGRAFÍA EN DISPOSITIVOS DE IMAGEN POR RESONANCIA MAGNÉTICA DE ASIA Y EL PACÍFICO, POR REGIÓN, 2018-2027 (MILLONES DE USD)

TABLA 32 MERCADO DE DISPOSITIVOS DE IMAGEN POR RESONANCIA MAGNÉTICA EN ASIA Y PACÍFICO, POR INDICACIÓN, 2018-2027 (MILLONES DE USD)

TABLA 33 MERCADO DE DISPOSITIVOS DE IMAGEN POR RESONANCIA MAGNÉTICA DE ONCOLOGÍA DE ASIA Y EL PACÍFICO, POR REGIÓN, 2018-2027 (MILLONES DE USD)

TABLA 34 MERCADO DE DISPOSITIVOS DE IMAGEN POR RESONANCIA MAGNÉTICA DE ONCOLOGÍA EN ASIA Y EL PACÍFICO, POR INDICACIÓN, 2018-2027 (MILLONES DE USD)

TABLA 35 MERCADO DE DISPOSITIVOS DE IMAGEN POR RESONANCIA MAGNÉTICA PÉLVICA Y ABDOMINAL DE ASIA Y PACÍFICO, POR REGIÓN, 2018-2027 (MILLONES DE USD)

TABLA 36 MERCADO DE DISPOSITIVOS DE IMAGEN POR RESONANCIA MAGNÉTICA PÉLVICA Y ABDOMINAL DE ASIA Y PACÍFICO, POR INDICACIÓN, 2018-2027 (MILLONES DE USD)

TABLA 37 MERCADO DE DISPOSITIVOS DE IMAGEN POR RESONANCIA MAGNÉTICA DE ASIA Y PACÍFICO, POR REGIÓN, 2018-2027 (MILLONES DE USD)

TABLA 38 MERCADO DE DISPOSITIVOS DE IMAGEN POR RESONANCIA MAGNÉTICA DE ASIA Y PACÍFICO, POR INDICACIÓN, 2018-2027 (MILLONES DE USD)

TABLA 39 MERCADO DE UROLOGÍA EN DISPOSITIVOS DE IMAGEN POR RESONANCIA MAGNÉTICA DE ASIA Y PACÍFICO, POR REGIÓN, 2018-2027 (MILLONES DE USD)

TABLA 40 MERCADO DE UROLOGÍA EN DISPOSITIVOS DE IMAGEN POR RESONANCIA MAGNÉTICA DE ASIA Y PACÍFICO, POR INDICACIÓN, 2018-2027 (MILLONES DE USD)

TABLA 41 MERCADO DE DISPOSITIVOS DE IMAGEN POR RESONANCIA MAGNÉTICA DENTAL DE ASIA Y EL PACÍFICO, POR REGIÓN, 2018-2027 (MILLONES DE USD)

TABLA 42 MERCADO DE DISPOSITIVOS DE IMAGEN POR RESONANCIA MAGNÉTICA DENTAL DE ASIA Y EL PACÍFICO, POR INDICACIÓN, 2018-2027 (MILLONES DE USD)

TABLA 43 ASIA Y EL PACÍFICO OTROS EN EL MERCADO DE DISPOSITIVOS DE IMAGEN POR RESONANCIA MAGNÉTICA, POR REGIÓN, 2018-2027 (MILLONES DE USD)

TABLA 44 MERCADO DE DISPOSITIVOS DE IMAGEN POR RESONANCIA MAGNÉTICA DE ASIA Y EL PACÍFICO, POR USUARIO FINAL, 2018-2027 (MILLONES DE USD)

TABLA 45 HOSPITALES DE ASIA Y EL PACÍFICO EN EL MERCADO DE DISPOSITIVOS DE IMAGEN POR RESONANCIA MAGNÉTICA, POR REGIÓN, 2018-2027 (MILLONES DE USD)

TABLA 46 CENTROS DE DIAGNÓSTICO DE ASIA Y EL PACÍFICO EN EL MERCADO DE DISPOSITIVOS DE IMAGEN POR RESONANCIA MAGNÉTICA, POR REGIÓN, 2018-2027 (MILLONES DE USD)

TABLA 47 CENTROS DE IMAGEN DE ASIA Y EL PACÍFICO EN EL MERCADO DE DISPOSITIVOS DE IMAGEN POR RESONANCIA MAGNÉTICA, POR REGIÓN, 2018-2027 (MILLONES DE USD)

TABLA 48 CLÍNICAS ESPECIALIZADAS EN EL MERCADO DE DISPOSITIVOS DE IMAGEN POR RESONANCIA MAGNÉTICA DE ASIA Y EL PACÍFICO, POR REGIÓN, 2018-2027 (MILLONES DE USD)

TABLA 49 CENTROS QUIRÚRGICOS AMBULATORIOS DE ASIA Y EL PACÍFICO EN EL MERCADO DE DISPOSITIVOS DE IMAGEN POR RESONANCIA MAGNÉTICA, POR REGIÓN, 2018-2027 (MILLONES DE USD)

TABLA 50 INSTITUTOS ACADÉMICOS E DE INVESTIGACIÓN DE ASIA Y EL PACÍFICO EN EL MERCADO DE DISPOSITIVOS DE IMAGEN POR RESONANCIA MAGNÉTICA, POR REGIÓN, 2018-2027 (MILLONES DE USD)

TABLA 51 MERCADO DE DISPOSITIVOS DE IMAGEN POR RESONANCIA MAGNÉTICA DE ASIA Y EL PACÍFICO, POR CANAL DE DISTRIBUCIÓN, 2018-2027 (MILLONES DE USD)

TABLA 52 LICITACIÓN DIRECTA DE ASIA-PACÍFICO EN EL MERCADO DE DISPOSITIVOS DE IMAGEN POR RESONANCIA MAGNÉTICA, POR REGIÓN, 2018-2027 (MILLONES DE USD)

TABLA 53 VENTAS MINORISTAS DE ASIA Y EL PACÍFICO EN EL MERCADO DE DISPOSITIVOS DE IMAGEN POR RESONANCIA MAGNÉTICA, POR REGIÓN, 2018-2027 (MILLONES DE USD)

TABLA 54 MERCADO DE DISPOSITIVOS DE IMAGEN POR RESONANCIA MAGNÉTICA DE ASIA Y EL PACÍFICO, POR PAÍS, 2018-2027 (MILLONES DE USD)

TABLA 55 MERCADO DE DISPOSITIVOS DE IMAGEN POR RESONANCIA MAGNÉTICA DE ASIA Y EL PACÍFICO, POR INTENSIDAD DE CAMPO, 2018-2027 (MILLONES DE USD)

TABLA 56 MERCADO DE DISPOSITIVOS DE IMAGEN POR RESONANCIA MAGNÉTICA DE ASIA Y EL PACÍFICO, POR TIPO, 2018-2027 (MILLONES DE USD)

TABLA 57 MERCADO DE DISPOSITIVOS DE IMAGEN POR RESONANCIA MAGNÉTICA DE ASIA Y EL PACÍFICO, POR TIPO, 2018-2027 (UNIDADES)

TABLA 58 SISTEMAS DE MRI CERRADOS DE ASIA Y EL PACÍFICO EN EL MERCADO DE DISPOSITIVOS DE IMAGEN POR RESONANCIA MAGNÉTICA, POR TIPO, 2018-2027 (MILLONES DE USD)

TABLA 59 MERCADO DE DISPOSITIVOS DE IMAGEN POR RESONANCIA MAGNÉTICA DE MRI DE ANCHO ANCHO DE ASIA Y EL PACÍFICO, POR TIPO, 2018-2027 (MILLONES DE USD)

TABLA 60 SISTEMAS ABIERTOS DE MRI EN EL MERCADO DE DISPOSITIVOS DE IMAGEN POR RESONANCIA MAGNÉTICA DE ASIA Y EL PACÍFICO, POR TIPO, 2018-2027 (MILLONES DE USD)

TABLA 61 MERCADO DE DISPOSITIVOS DE IMAGEN POR RESONANCIA MAGNÉTICA DE ASIA Y EL PACÍFICO, POR MODALIDAD, 2018-2027 (MILLONES DE USD)

TABLA 62 MERCADO DE DISPOSITIVOS DE IMAGEN POR RESONANCIA MAGNÉTICA DE ASIA Y EL PACÍFICO, POR INDICACIÓN, 2018-2027 (MILLONES DE USD)

TABLA 63 MERCADO DE DISPOSITIVOS DE IMAGEN POR RESONANCIA MAGNÉTICA DEL CEREBRO Y NEUROLÓGICO DE ASIA Y EL PACÍFICO, POR INDICACIÓN, 2018-2027 (MILLONES DE USD)

TABLA 64 MERCADO MUSCULOESQUELÉTICO DE ASIA Y PACÍFICO EN DISPOSITIVOS DE IMAGEN POR RESONANCIA MAGNÉTICA, POR INDICACIÓN, 2018-2027 (MILLONES DE USD)

TABLA 65 MERCADO DE DISPOSITIVOS DE IMAGEN POR RESONANCIA MAGNÉTICA EN CARDIOLOGÍA DE ASIA Y EL PACÍFICO, POR INDICACIÓN, 2018-2027 (MILLONES DE USD)

TABLA 66 MERCADO DE DISPOSITIVOS DE IMAGEN POR RESONANCIA MAGNÉTICA EN ASIA Y EL PACÍFICO, POR INDICACIÓN, 2018-2027 (MILLONES DE USD)

TABLA 67 MERCADO DE DISPOSITIVOS DE IMAGEN POR RESONANCIA MAGNÉTICA DE ONCOLOGÍA EN ASIA Y EL PACÍFICO, POR INDICACIÓN, 2018-2027 (MILLONES DE USD)

TABLA 68 MERCADO DE DISPOSITIVOS DE IMAGEN POR RESONANCIA MAGNÉTICA PÉLVICA Y ABDOMINAL DE ASIA Y PACÍFICO, POR INDICACIÓN, 2018-2027 (MILLONES DE USD)

TABLA 69 MERCADO DE DISPOSITIVOS DE IMAGEN POR RESONANCIA MAGNÉTICA DE ASIA Y PACÍFICO, POR INDICACIÓN, 2018-2027 (MILLONES DE USD)

TABLA 70 MERCADO DE UROLOGÍA EN DISPOSITIVOS DE IMAGEN POR RESONANCIA MAGNÉTICA DE ASIA Y PACÍFICO, POR INDICACIÓN, 2018-2027 (MILLONES DE USD)

TABLA 71 MERCADO DE DISPOSITIVOS DE IMAGEN POR RESONANCIA MAGNÉTICA DENTAL DE ASIA Y EL PACÍFICO, POR INDICACIÓN, 2018-2027 (MILLONES DE USD)

TABLA 72 MERCADO DE DISPOSITIVOS DE IMAGEN POR RESONANCIA MAGNÉTICA DE ASIA Y EL PACÍFICO, POR USUARIO FINAL, 2018-2027 (MILLONES DE USD)

TABLA 73 MERCADO DE DISPOSITIVOS DE IMAGEN POR RESONANCIA MAGNÉTICA DE ASIA Y EL PACÍFICO, POR CANAL DE DISTRIBUCIÓN, 2018-2027 (MILLONES DE USD)

TABLA 74 MERCADO DE DISPOSITIVOS DE IMAGEN POR RESONANCIA MAGNÉTICA DE JAPÓN, POR INTENSIDAD DE CAMPO, 2018-2027 (MILLONES DE USD)

TABLA 75 MERCADO DE DISPOSITIVOS DE IMAGEN POR RESONANCIA MAGNÉTICA DE JAPÓN, POR TIPO, 2018-2027 (MILLONES DE USD)

TABLA 76 MERCADO DE DISPOSITIVOS DE IMAGEN POR RESONANCIA MAGNÉTICA DE JAPÓN, POR TIPO, 2018-2027 (UNIDADES)

TABLA 77 SISTEMAS DE MRI CERRADOS EN EL MERCADO DE DISPOSITIVOS DE IMAGEN POR RESONANCIA MAGNÉTICA DE JAPÓN, POR TIPO, 2018-2027 (MILLONES DE USD)

TABLA 78 MERCADO DE DISPOSITIVOS DE IMAGEN POR RESONANCIA MAGNÉTICA EN JAPÓN, POR TIPO, 2018-2027 (MILLONES DE USD)

TABLA 79 SISTEMAS ABIERTOS DE MRI EN EL MERCADO DE DISPOSITIVOS DE IMAGEN POR RESONANCIA MAGNÉTICA DE JAPÓN, POR TIPO, 2018-2027 (MILLONES DE USD)

TABLA 80 MERCADO DE DISPOSITIVOS DE IMAGEN POR RESONANCIA MAGNÉTICA DE JAPÓN, POR MODALIDAD, 2018-2027 (MILLONES DE USD)

TABLA 81 MERCADO DE DISPOSITIVOS DE IMAGEN POR RESONANCIA MAGNÉTICA DE JAPÓN, POR INDICACIÓN, 2018-2027 (MILLONES DE USD)

TABLA 82 MERCADO DE DISPOSITIVOS DE IMAGEN POR RESONANCIA MAGNÉTICA DEL CEREBRO Y NEUROLÓGICO DE JAPÓN, POR INDICACIÓN, 2018-2027 (MILLONES DE USD)

TABLA 83 MERCADO MUSCULOESQUELÉTICO DE JAPÓN EN DISPOSITIVOS DE IMAGEN POR RESONANCIA MAGNÉTICA, POR INDICACIÓN, 2018-2027 (MILLONES DE USD)

TABLA 84 MERCADO JAPÓN DE CARDIOLOGÍA EN DISPOSITIVOS DE IMAGEN POR RESONANCIA MAGNÉTICA, POR INDICACIÓN, 2018-2027 (MILLONES DE USD)

TABLA 85 MERCADO JAPÓN DE MAMOGRAFÍA EN DISPOSITIVOS DE IMAGEN POR RESONANCIA MAGNÉTICA, POR INDICACIÓN, 2018-2027 (MILLONES DE USD)

TABLA 86 MERCADO JAPÓN DE ONCOLOGÍA EN DISPOSITIVOS DE IMAGEN POR RESONANCIA MAGNÉTICA, POR INDICACIÓN, 2018-2027 (MILLONES DE USD)

TABLA 87 MERCADO JAPÓN DE DISPOSITIVOS DE IMAGEN POR RESONANCIA MAGNÉTICA PÉLVICA Y ABDOMINAL, POR INDICACIÓN, 2018-2027 (MILLONES DE USD)

TABLA 88 MERCADO JAPÓN DE DISPOSITIVOS DE IMAGEN POR RESONANCIA MAGNÉTICA, POR INDICACIÓN, 2018-2027 (MILLONES DE USD)

TABLA 89 MERCADO DE UROLOGÍA EN DISPOSITIVOS DE IMAGEN POR RESONANCIA MAGNÉTICA DE JAPÓN, POR INDICACIÓN, 2018-2027 (MILLONES DE USD)

TABLA 90 MERCADO DE DISPOSITIVOS DE IMAGEN POR RESONANCIA MAGNÉTICA DENTAL DE JAPÓN, POR INDICACIÓN, 2018-2027 (MILLONES DE USD)

TABLA 91 MERCADO DE DISPOSITIVOS DE IMAGEN POR RESONANCIA MAGNÉTICA DE JAPÓN, POR USUARIO FINAL, 2018-2027 (MILLONES DE USD)

TABLA 92 MERCADO DE DISPOSITIVOS DE IMAGEN POR RESONANCIA MAGNÉTICA DE JAPÓN, POR CANAL DE DISTRIBUCIÓN, 2018-2027 (MILLONES DE USD)

TABLA 93 MERCADO DE DISPOSITIVOS DE IMAGEN POR RESONANCIA MAGNÉTICA DE CHINA, POR INTENSIDAD DE CAMPO, 2018-2027 (MILLONES DE USD)

TABLA 94 MERCADO DE DISPOSITIVOS DE IMAGEN POR RESONANCIA MAGNÉTICA DE CHINA, POR TIPO, 2018-2027 (MILLONES DE USD)

TABLA 95 MERCADO DE DISPOSITIVOS DE IMAGEN POR RESONANCIA MAGNÉTICA DE CHINA, POR TIPO, 2018-2027 (UNIDADES)

TABLA 96 MERCADO DE SISTEMAS DE MRI CERRADOS DE CHINA EN DISPOSITIVOS DE IMAGEN POR RESONANCIA MAGNÉTICA, POR TIPO, 2018-2027 (MILLONES DE USD)

TABLA 97 MERCADO CHINA DE DISPOSITIVOS DE IMAGEN POR RESONANCIA MAGNÉTICA, POR TIPO, 2018-2027 (MILLONES DE USD)

TABLA 98 SISTEMAS ABIERTOS DE MRI EN EL MERCADO DE DISPOSITIVOS DE IMAGEN POR RESONANCIA MAGNÉTICA DE CHINA, POR TIPO, 2018-2027 (MILLONES DE USD)

TABLA 99 MERCADO DE DISPOSITIVOS DE IMAGEN POR RESONANCIA MAGNÉTICA DE CHINA, POR MODALIDAD, 2018-2027 (MILLONES DE USD)

TABLA 100 MERCADO DE DISPOSITIVOS DE IMAGEN POR RESONANCIA MAGNÉTICA DE CHINA, POR INDICACIÓN, 2018-2027 (MILLONES DE USD)

TABLA 101 MERCADO DE DISPOSITIVOS DE IMAGEN POR RESONANCIA MAGNÉTICA DEL CEREBRO Y NEUROLÓGICO DE CHINA, POR INDICACIÓN, 2018-2027 (MILLONES DE USD)

TABLA 102 MERCADO MUSCOLOESQUELÉTICO DE CHINA EN DISPOSITIVOS DE IMAGEN POR RESONANCIA MAGNÉTICA, POR INDICACIÓN, 2018-2027 (MILLONES DE USD)

TABLA 103 MERCADO CHINA DE CARDIOLOGÍA EN DISPOSITIVOS DE IMAGEN POR RESONANCIA MAGNÉTICA, POR INDICACIÓN, 2018-2027 (MILLONES DE USD)

TABLA 104 MERCADO CHINA DE MAMOGRAFÍA EN DISPOSITIVOS DE IMAGEN POR RESONANCIA MAGNÉTICA, POR INDICACIÓN, 2018-2027 (MILLONES DE USD)

TABLA 105 MERCADO CHINA DE DISPOSITIVOS DE IMAGEN POR RESONANCIA MAGNÉTICA, POR INDICACIÓN, 2018-2027 (MILLONES DE USD)

TABLA 106 MERCADO CHINA DE DISPOSITIVOS DE IMAGEN POR RESONANCIA MAGNÉTICA PÉLVICA Y ABDOMINAL, POR INDICACIÓN, 2018-2027 (MILLONES DE USD)

TABLA 107 MERCADO CHINA DE DISPOSITIVOS DE IMAGEN POR RESONANCIA MAGNÉTICA, POR INDICACIÓN, 2018-2027 (MILLONES DE USD)

TABLA 108 MERCADO CHINA DE UROLOGÍA EN DISPOSITIVOS DE IMAGEN POR RESONANCIA MAGNÉTICA, POR INDICACIÓN, 2018-2027 (MILLONES DE USD)

TABLA 109 MERCADO DE DISPOSITIVOS DE IMAGEN POR RESONANCIA MAGNÉTICA DENTAL DE CHINA, POR INDICACIÓN, 2018-2027 (MILLONES DE USD)

TABLA 110 MERCADO DE DISPOSITIVOS DE IMAGEN POR RESONANCIA MAGNÉTICA DE CHINA, POR USUARIO FINAL, 2018-2027 (MILLONES DE USD)

TABLA 111 MERCADO DE DISPOSITIVOS DE IMAGEN POR RESONANCIA MAGNÉTICA DE CHINA, POR CANAL DE DISTRIBUCIÓN, 2018-2027 (MILLONES DE USD)

TABLA 112 MERCADO DE DISPOSITIVOS DE IMAGEN POR RESONANCIA MAGNÉTICA DE COREA DEL SUR, POR INTENSIDAD DE CAMPO, 2018-2027 (MILLONES DE USD)

TABLA 113 MERCADO DE DISPOSITIVOS DE IMAGEN POR RESONANCIA MAGNÉTICA DE COREA DEL SUR, POR TIPO, 2018-2027 (MILLONES DE USD)

TABLA 114 MERCADO DE DISPOSITIVOS DE IMAGEN POR RESONANCIA MAGNÉTICA DE COREA DEL SUR, POR TIPO, 2018-2027 (UNIDADES)

TABLA 115 SISTEMAS DE MRI CERRADOS DE COREA DEL SUR EN EL MERCADO DE DISPOSITIVOS DE IMAGEN POR RESONANCIA MAGNÉTICA, POR TIPO, 2018-2027 (MILLONES DE USD)

TABLA 116 MERCADO DE DISPOSITIVOS DE IMÁGENES DE RESONANCIA MAGNÉTICA DE MRI DE ANCHO ANCHO DE COREA DEL SUR, POR TIPO, 2018-2027 (MILLONES DE USD)

TABLA 117 SISTEMAS DE MRI ABIERTOS DE COREA DEL SUR EN EL MERCADO DE DISPOSITIVOS DE IMAGEN POR RESONANCIA MAGNÉTICA, POR TIPO, 2018-2027 (MILLONES DE USD)

TABLA 118 MERCADO DE DISPOSITIVOS DE IMAGEN POR RESONANCIA MAGNÉTICA DE COREA DEL SUR, POR MODALIDAD, 2018-2027 (MILLONES DE USD)

TABLA 119 MERCADO DE DISPOSITIVOS DE IMAGEN POR RESONANCIA MAGNÉTICA DE COREA DEL SUR, POR INDICACIÓN, 2018-2027 (MILLONES DE USD)

TABLA 120 MERCADO DE DISPOSITIVOS DE IMAGEN POR RESONANCIA MAGNÉTICA DEL CEREBRO Y NEUROLÓGICO DE COREA DEL SUR, POR INDICACIÓN, 2018-2027 (MILLONES DE USD)

TABLA 121 MERCADO DE DISPOSITIVOS MUSCULOESQUELÉTICOS DE IMÁGENES DE RESONANCIA MAGNÉTICA DE COREA DEL SUR, POR INDICACIÓN, 2018-2027 (MILLONES DE USD)

TABLA 122 MERCADO DE CARDIOLOGÍA DE COREA DEL SUR EN DISPOSITIVOS DE IMAGEN POR RESONANCIA MAGNÉTICA, POR INDICACIÓN, 2018-2027 (MILLONES DE USD)

TABLA 123 MERCADO DE MAMOGRAFÍA EN DISPOSITIVOS DE IMAGEN POR RESONANCIA MAGNÉTICA DE COREA DEL SUR, POR INDICACIÓN, 2018-2027 (MILLONES DE USD)

TABLA 124 MERCADO DE DISPOSITIVOS DE IMAGEN POR RESONANCIA MAGNÉTICA DE COREA DEL SUR, POR INDICACIÓN, 2018-2027 (MILLONES DE USD)

TABLA 125 MERCADO DE DISPOSITIVOS DE IMAGEN POR RESONANCIA MAGNÉTICA PÉLVICA Y ABDOMINAL DE COREA DEL SUR, POR INDICACIÓN, 2018-2027 (MILLONES DE USD)

TABLA 126 MERCADO DE DISPOSITIVOS DE IMAGEN POR RESONANCIA MAGNÉTICA DE COREA DEL SUR, POR INDICACIÓN, 2018-2027 (MILLONES DE USD)

TABLA 127 MERCADO DE UROLOGÍA EN DISPOSITIVOS DE IMAGEN POR RESONANCIA MAGNÉTICA DE COREA DEL SUR, POR INDICACIÓN, 2018-2027 (MILLONES DE USD)

TABLA 128 MERCADO DE DISPOSITIVOS DE IMAGEN POR RESONANCIA MAGNÉTICA DENTAL DE COREA DEL SUR, POR INDICACIÓN, 2018-2027 (MILLONES DE USD)

TABLA 129 MERCADO DE DISPOSITIVOS DE IMAGEN POR RESONANCIA MAGNÉTICA DE COREA DEL SUR, POR USUARIO FINAL, 2018-2027 (MILLONES DE USD)

TABLA 130 MERCADO DE DISPOSITIVOS DE IMAGEN POR RESONANCIA MAGNÉTICA DE COREA DEL SUR, POR CANAL DE DISTRIBUCIÓN, 2018-2027 (MILLONES DE USD)

TABLA 131 MERCADO DE DISPOSITIVOS DE IMAGEN POR RESONANCIA MAGNÉTICA DE AUSTRALIA, POR INTENSIDAD DE CAMPO, 2018-2027 (MILLONES DE USD)

TABLA 132 MERCADO DE DISPOSITIVOS DE IMAGEN POR RESONANCIA MAGNÉTICA DE AUSTRALIA, POR TIPO, 2018-2027 (MILLONES DE USD)

TABLA 133 MERCADO DE DISPOSITIVOS DE IMAGEN POR RESONANCIA MAGNÉTICA DE AUSTRALIA, POR TIPO, 2018-2027 (UNIDADES)

TABLA 134 MERCADO DE SISTEMAS DE MRI CERRADOS DE AUSTRALIA EN DISPOSITIVOS DE IMAGEN POR RESONANCIA MAGNÉTICA, POR TIPO, 2018-2027 (MILLONES DE USD)

TABLA 135 MERCADO DE DISPOSITIVOS DE IMAGEN POR RESONANCIA MAGNÉTICA EN AUSTRALIA, POR TIPO, 2018-2027 (MILLONES DE USD)

TABLA 136 SISTEMAS ABIERTOS DE MRI EN EL MERCADO DE DISPOSITIVOS DE IMAGEN POR RESONANCIA MAGNÉTICA DE AUSTRALIA, POR TIPO, 2018-2027 (MILLONES DE USD)

TABLA 137 MERCADO DE DISPOSITIVOS DE IMAGEN POR RESONANCIA MAGNÉTICA DE AUSTRALIA, POR MODALIDAD, 2018-2027 (MILLONES DE USD)

TABLA 138 MERCADO DE DISPOSITIVOS DE IMAGEN POR RESONANCIA MAGNÉTICA DE AUSTRALIA, POR INDICACIÓN, 2018-2027 (MILLONES DE USD)

TABLA 139 MERCADO DE DISPOSITIVOS DE IMAGEN POR RESONANCIA MAGNÉTICA DEL CEREBRO Y NEUROLÓGICO DE AUSTRALIA, POR INDICACIÓN, 2018-2027 (MILLONES DE USD)

TABLA 140 MERCADO DE DISPOSITIVOS DE IMAGEN POR RESONANCIA MAGNÉTICA DE AUSTRALIA, POR INDICACIÓN, 2018-2027 (MILLONES DE USD)

TABLA 141 MERCADO DE CARDIOLOGÍA EN AUSTRALIA EN DISPOSITIVOS DE IMAGEN POR RESONANCIA MAGNÉTICA, POR INDICACIÓN, 2018-2027 (MILLONES DE USD)

TABLA 142 MERCADO DE MAMOGRAFÍA EN DISPOSITIVOS DE IMAGEN POR RESONANCIA MAGNÉTICA DE AUSTRALIA, POR INDICACIÓN, 2018-2027 (MILLONES DE USD)

TABLA 143 MERCADO DE ONCOLOGÍA EN DISPOSITIVOS DE IMAGEN POR RESONANCIA MAGNÉTICA DE AUSTRALIA, POR INDICACIÓN, 2018-2027 (MILLONES DE USD)

TABLA 144 MERCADO DE DISPOSITIVOS DE IMAGEN POR RESONANCIA MAGNÉTICA PÉLVICA Y ABDOMINAL DE AUSTRALIA, POR INDICACIÓN, 2018-2027 (MILLONES DE USD)

TABLA 145 MERCADO DE DISPOSITIVOS DE IMAGEN POR RESONANCIA MAGNÉTICA DE AUSTRALIA, POR INDICACIÓN, 2018-2027 (MILLONES DE USD)

TABLA 146 MERCADO DE UROLOGÍA EN DISPOSITIVOS DE IMAGEN POR RESONANCIA MAGNÉTICA DE AUSTRALIA, POR INDICACIÓN, 2018-2027 (MILLONES DE USD)

TABLA 147 AUSTRALIA DENTAL EN EL MERCADO DE DISPOSITIVOS DE IMAGEN POR RESONANCIA MAGNÉTICA, POR INDICACIÓN, 2018-2027 (MILLONES DE USD)

TABLA 148 MERCADO DE DISPOSITIVOS DE IMAGEN POR RESONANCIA MAGNÉTICA DE AUSTRALIA, POR USUARIO FINAL, 2018-2027 (MILLONES DE USD)

TABLA 149 MERCADO DE DISPOSITIVOS DE IMAGEN POR RESONANCIA MAGNÉTICA DE AUSTRALIA, POR CANAL DE DISTRIBUCIÓN, 2018-2027 (MILLONES DE USD)

TABLA 150 MERCADO DE DISPOSITIVOS DE IMAGEN POR RESONANCIA MAGNÉTICA DE LA INDIA, POR INTENSIDAD DE CAMPO, 2018-2027 (MILLONES DE USD)

TABLA 151 MERCADO DE DISPOSITIVOS DE IMAGEN POR RESONANCIA MAGNÉTICA DE LA INDIA, POR TIPO, 2018-2027 (MILLONES DE USD)

TABLA 152 MERCADO DE DISPOSITIVOS DE IMAGEN POR RESONANCIA MAGNÉTICA DE LA INDIA, POR TIPO, 2018-2027 (UNIDADES)

TABLA 153 SISTEMAS DE MRI CERRADOS DE LA INDIA EN EL MERCADO DE DISPOSITIVOS DE IMAGEN POR RESONANCIA MAGNÉTICA, POR TIPO, 2018-2027 (MILLONES DE USD)

TABLA 154 MERCADO DE DISPOSITIVOS DE IMAGEN POR RESONANCIA MAGNÉTICA DE MRI DE ANCHO ANCHO DE LA INDIA, POR TIPO, 2018-2027 (MILLONES DE USD)

TABLA 155 SISTEMAS DE MRI ABIERTOS DE LA INDIA EN EL MERCADO DE DISPOSITIVOS DE IMAGEN POR RESONANCIA MAGNÉTICA, POR TIPO, 2018-2027 (MILLONES DE USD)

TABLA 156 MERCADO DE DISPOSITIVOS DE IMAGEN POR RESONANCIA MAGNÉTICA DE LA INDIA, POR MODALIDAD, 2018-2027 (MILLONES DE USD)

TABLA 157 MERCADO DE DISPOSITIVOS DE IMAGEN POR RESONANCIA MAGNÉTICA DE LA INDIA, POR INDICACIÓN, 2018-2027 (MILLONES DE USD)

TABLA 158 MERCADO DE DISPOSITIVOS DE IMAGEN POR RESONANCIA MAGNÉTICA DEL CEREBRO Y NEUROLÓGICO DE LA INDIA, POR INDICACIÓN, 2018-2027 (MILLONES DE USD)

TABLA 159 MERCADO DE DISPOSITIVOS DE IMAGEN POR RESONANCIA MAGNÉTICA DE LA INDIA, POR INDICACIÓN, 2018-2027 (MILLONES DE USD)

TABLA 160 MERCADO DE CARDIOLOGÍA DE LA INDIA EN DISPOSITIVOS DE IMAGEN POR RESONANCIA MAGNÉTICA, POR INDICACIÓN, 2018-2027 (MILLONES DE USD)

TABLA 161 MERCADO DE MAMOGRAFÍA EN DISPOSITIVOS DE IMAGEN POR RESONANCIA MAGNÉTICA DE LA INDIA, POR INDICACIÓN, 2018-2027 (MILLONES DE USD)

TABLA 162 MERCADO DE DISPOSITIVOS DE IMAGEN POR RESONANCIA MAGNÉTICA DE LA INDIA, POR INDICACIÓN, 2018-2027 (MILLONES DE USD)

TABLA 163 MERCADO DE DISPOSITIVOS DE IMAGEN POR RESONANCIA MAGNÉTICA PÉLVICA Y ABDOMINAL DE LA INDIA, POR INDICACIÓN, 2018-2027 (MILLONES DE USD)

TABLA 164 INDIA GINECOLOGÍA EN EL MERCADO DE DISPOSITIVOS DE IMAGEN POR RESONANCIA MAGNÉTICA, POR INDICACIÓN, 2018-2027 (MILLONES DE USD)

TABLA 165 MERCADO DE UROLOGÍA EN DISPOSITIVOS DE IMAGEN POR RESONANCIA MAGNÉTICA DE LA INDIA, POR INDICACIÓN, 2018-2027 (MILLONES DE USD)

TABLA 166 MERCADO DE DISPOSITIVOS DE IMÁGENES DE RESONANCIA MAGNÉTICA DENTAL DE LA INDIA, POR INDICACIÓN, 2018-2027 (MILLONES DE USD)

TABLA 167 MERCADO DE DISPOSITIVOS DE IMAGEN POR RESONANCIA MAGNÉTICA DE LA INDIA, POR USUARIO FINAL, 2018-2027 (MILLONES DE USD)

TABLA 168 MERCADO DE DISPOSITIVOS DE IMAGEN POR RESONANCIA MAGNÉTICA DE LA INDIA, POR CANAL DE DISTRIBUCIÓN, 2018-2027 (MILLONES DE USD)

TABLA 169 MERCADO DE DISPOSITIVOS DE IMAGEN POR RESONANCIA MAGNÉTICA DE SINGAPUR, POR INTENSIDAD DE CAMPO, 2018-2027 (MILLONES DE USD)

TABLA 170 MERCADO DE DISPOSITIVOS DE IMAGEN POR RESONANCIA MAGNÉTICA DE SINGAPUR, POR TIPO, 2018-2027 (MILLONES DE USD)

TABLA 171 MERCADO DE DISPOSITIVOS DE IMAGEN POR RESONANCIA MAGNÉTICA DE SINGAPUR, POR TIPO, 2018-2027 (UNIDADES)

TABLA 172 SISTEMAS DE MRI CERRADOS DE SINGAPUR EN EL MERCADO DE DISPOSITIVOS DE IMAGEN POR RESONANCIA MAGNÉTICA, POR TIPO, 2018-2027 (MILLONES DE USD)

TABLA 173 MERCADO DE DISPOSITIVOS DE IMÁGENES DE RESONANCIA MAGNÉTICA DE MRI DE ANCHO ANCHO DE SINGAPUR, POR TIPO, 2018-2027 (MILLONES DE USD)

TABLA 174 SISTEMAS ABIERTOS DE MRI DE SINGAPUR EN EL MERCADO DE DISPOSITIVOS DE IMAGEN POR RESONANCIA MAGNÉTICA, POR TIPO, 2018-2027 (MILLONES DE USD)

TABLA 175 MERCADO DE DISPOSITIVOS DE IMAGEN POR RESONANCIA MAGNÉTICA DE SINGAPUR, POR MODALIDAD, 2018-2027 (MILLONES DE USD)

TABLA 176 MERCADO DE DISPOSITIVOS DE IMAGEN POR RESONANCIA MAGNÉTICA DE SINGAPUR, POR INDICACIÓN, 2018-2027 (MILLONES DE USD)

TABLA 177 MERCADO DE DISPOSITIVOS DE IMAGEN POR RESONANCIA MAGNÉTICA DEL CEREBRO Y NEUROLÓGICO DE SINGAPUR, POR INDICACIÓN, 2018-2027 (MILLONES DE USD)

TABLA 178 MERCADO DE DISPOSITIVOS DE IMAGEN POR RESONANCIA MAGNÉTICA DE SINGAPUR, POR INDICACIÓN, 2018-2027 (MILLONES DE USD)

TABLA 179 MERCADO DE DISPOSITIVOS DE IMAGEN POR RESONANCIA MAGNÉTICA DE SINGAPUR, POR INDICACIÓN, 2018-2027 (MILLONES DE USD)

TABLA 180 MERCADO DE DISPOSITIVOS DE IMAGEN POR RESONANCIA MAGNÉTICA DE SINGAPUR, POR INDICACIÓN, 2018-2027 (MILLONES DE USD)

TABLA 181 MERCADO DE DISPOSITIVOS DE IMAGEN POR RESONANCIA MAGNÉTICA DE ONCOLOGÍA DE SINGAPUR, POR INDICACIÓN, 2018-2027 (MILLONES DE USD)

TABLA 182 MERCADO DE DISPOSITIVOS DE IMAGEN POR RESONANCIA MAGNÉTICA PÉLVICA Y ABDOMINAL DE SINGAPUR, POR INDICACIÓN, 2018-2027 (MILLONES DE USD)

TABLA 183 MERCADO DE DISPOSITIVOS DE IMAGEN POR RESONANCIA MAGNÉTICA DE SINGAPUR, POR INDICACIÓN, 2018-2027 (MILLONES DE USD)

TABLA 184 MERCADO DE UROLOGÍA EN DISPOSITIVOS DE IMAGEN POR RESONANCIA MAGNÉTICA DE SINGAPUR, POR INDICACIÓN, 2018-2027 (MILLONES DE USD)

TABLA 185 MERCADO DENTAL DE SINGAPUR EN DISPOSITIVOS DE IMAGEN POR RESONANCIA MAGNÉTICA, POR INDICACIÓN, 2018-2027 (MILLONES DE USD)

TABLA 186 MERCADO DE DISPOSITIVOS DE IMAGEN POR RESONANCIA MAGNÉTICA DE SINGAPUR, POR USUARIO FINAL, 2018-2027 (MILLONES DE USD)

TABLA 187 MERCADO DE DISPOSITIVOS DE IMAGEN POR RESONANCIA MAGNÉTICA DE SINGAPUR, POR CANAL DE DISTRIBUCIÓN, 2018-2027 (MILLONES DE USD)

TABLA 188 MERCADO DE DISPOSITIVOS DE IMAGEN POR RESONANCIA MAGNÉTICA DE TAILANDIA, POR INTENSIDAD DE CAMPO, 2018-2027 (MILLONES DE USD)

TABLA 189 MERCADO DE DISPOSITIVOS DE IMAGEN POR RESONANCIA MAGNÉTICA DE TAILANDIA, POR TIPO, 2018-2027 (MILLONES DE USD)

TABLA 190 MERCADO DE DISPOSITIVOS DE IMAGEN POR RESONANCIA MAGNÉTICA DE TAILANDIA, POR TIPO, 2018-2027 (UNIDADES)

TABLA 191 MERCADO DE SISTEMAS DE MRI CERRADOS DE TAILANDIA EN DISPOSITIVOS DE IMAGEN POR RESONANCIA MAGNÉTICA, POR TIPO, 2018-2027 (MILLONES DE USD)

TABLA 192 MERCADO DE DISPOSITIVOS DE IMÁGENES DE RESONANCIA MAGNÉTICA DE MRI DE ANCHO ANCHO DE TAILANDIA, POR TIPO, 2018-2027 (MILLONES DE USD)

TABLA 193 SISTEMAS ABIERTOS DE MRI EN EL MERCADO DE DISPOSITIVOS DE IMAGEN POR RESONANCIA MAGNÉTICA DE TAILANDIA, POR TIPO, 2018-2027 (MILLONES DE USD)

TABLA 194 MERCADO DE DISPOSITIVOS DE IMAGEN POR RESONANCIA MAGNÉTICA DE TAILANDIA, POR MODALIDAD, 2018-2027 (MILLONES DE USD)

TABLA 195 MERCADO DE DISPOSITIVOS DE IMAGEN POR RESONANCIA MAGNÉTICA DE TAILANDIA, POR INDICACIÓN, 2018-2027 (MILLONES DE USD)

TABLA 196 MERCADO DE DISPOSITIVOS DE IMAGEN POR RESONANCIA MAGNÉTICA DEL CEREBRO Y NEUROLÓGICO DE TAILANDIA, POR INDICACIÓN, 2018-2027 (MILLONES DE USD)

TABLA 197 MERCADO MUSCULOESQUELÉTICO DE TAILANDIA EN DISPOSITIVOS DE IMAGEN POR RESONANCIA MAGNÉTICA, POR INDICACIÓN, 2018-2027 (MILLONES DE USD)

TABLA 198 CARDIOLOGÍA DE TAILANDIA EN EL MERCADO DE DISPOSITIVOS DE IMAGEN POR RESONANCIA MAGNÉTICA, POR INDICACIÓN, 2018-2027 (MILLONES DE USD)

TABLA 199 MAMOGRAFÍA DE TAILANDIA EN EL MERCADO DE DISPOSITIVOS DE IMAGEN POR RESONANCIA MAGNÉTICA, POR INDICACIÓN, 2018-2027 (MILLONES DE USD)

TABLA 200 ONCOLOGÍA DE TAILANDIA EN EL MERCADO DE DISPOSITIVOS DE IMAGEN POR RESONANCIA MAGNÉTICA, POR INDICACIÓN, 2018-2027 (MILLONES DE USD)

TABLA 201 MERCADO DE DISPOSITIVOS DE IMAGEN POR RESONANCIA MAGNÉTICA PÉLVICA Y ABDOMINAL DE TAILANDIA, POR INDICACIÓN, 2018-2027 (MILLONES DE USD)

TABLA 202 MERCADO DE DISPOSITIVOS DE IMAGEN POR RESONANCIA MAGNÉTICA DE TAILANDIA, POR INDICACIÓN, 2018-2027 (MILLONES DE USD)

TABLA 203 MERCADO DE UROLOGÍA EN DISPOSITIVOS DE IMAGEN POR RESONANCIA MAGNÉTICA DE TAILANDIA, POR INDICACIÓN, 2018-2027 (MILLONES DE USD)

TABLA 204 MERCADO DENTAL EN TAILANDIA DE DISPOSITIVOS DE IMAGEN POR RESONANCIA MAGNÉTICA, POR INDICACIÓN, 2018-2027 (MILLONES DE USD)

TABLA 205 MERCADO DE DISPOSITIVOS DE IMAGEN POR RESONANCIA MAGNÉTICA DE TAILANDIA, POR USUARIO FINAL, 2018-2027 (MILLONES DE USD)

TABLA 206 MERCADO DE DISPOSITIVOS DE IMAGEN POR RESONANCIA MAGNÉTICA DE TAILANDIA, POR CANAL DE DISTRIBUCIÓN, 2018-2027 (MILLONES DE USD)

TABLA 207 MERCADO DE DISPOSITIVOS DE IMAGEN POR RESONANCIA MAGNÉTICA DE MALASIA, POR INTENSIDAD DE CAMPO, 2018-2027 (MILLONES DE USD)

TABLA 208 MERCADO DE DISPOSITIVOS DE IMAGEN POR RESONANCIA MAGNÉTICA DE MALASIA, POR TIPO, 2018-2027 (MILLONES DE USD)

TABLA 209 MERCADO DE DISPOSITIVOS DE IMAGEN POR RESONANCIA MAGNÉTICA DE MALASIA, POR TIPO, 2018-2027 (UNIDADES)

TABLA 210 MERCADO DE SISTEMAS DE MRI CERRADOS DE MALASIA EN DISPOSITIVOS DE IMAGEN POR RESONANCIA MAGNÉTICA, POR TIPO, 2018-2027 (MILLONES DE USD)

TABLA 211 MERCADO DE DISPOSITIVOS DE IMAGEN POR RESONANCIA MAGNÉTICA DE MRI DE ANCHO ANCHO DE MALASIA, POR TIPO, 2018-2027 (MILLONES DE USD)

TABLA 212 SISTEMAS ABIERTOS DE MRI DE MALASIA EN EL MERCADO DE DISPOSITIVOS DE IMAGEN POR RESONANCIA MAGNÉTICA, POR TIPO, 2018-2027 (MILLONES DE USD)

TABLA 213 MERCADO DE DISPOSITIVOS DE IMAGEN POR RESONANCIA MAGNÉTICA DE MALASIA, POR MODALIDAD, 2018-2027 (MILLONES DE USD)

TABLA 214 MERCADO DE DISPOSITIVOS DE IMAGEN POR RESONANCIA MAGNÉTICA DE MALASIA, POR INDICACIÓN, 2018-2027 (MILLONES DE USD)

TABLA 215 MERCADO DE DISPOSITIVOS DE IMAGEN POR RESONANCIA MAGNÉTICA CEREBRAL Y NEUROLÓGICO DE MALASIA, POR INDICACIÓN, 2018-2027 (MILLONES DE USD)

TABLA 216 MERCADO MUSCULOESQUELÉTICO DE MALASIA EN DISPOSITIVOS DE IMAGEN POR RESONANCIA MAGNÉTICA, POR INDICACIÓN, 2018-2027 (MILLONES DE USD)

TABLA 217 MALASIA CARDIOLOGÍA EN EL MERCADO DE DISPOSITIVOS DE IMAGEN POR RESONANCIA MAGNÉTICA, POR INDICACIÓN, 2018-2027 (MILLONES DE USD)

TABLA 218 MERCADO DE MAMOGRAFÍA EN DISPOSITIVOS DE IMAGEN POR RESONANCIA MAGNÉTICA DE MALASIA, POR INDICACIÓN, 2018-2027 (MILLONES DE USD)

TABLA 219 MERCADO DE DISPOSITIVOS DE IMAGEN POR RESONANCIA MAGNÉTICA DE ONCOLOGÍA DE MALASIA, POR INDICACIÓN, 2018-2027 (MILLONES DE USD)

TABLA 220 MERCADO DE DISPOSITIVOS DE IMAGEN POR RESONANCIA MAGNÉTICA PÉLVICA Y ABDOMINAL DE MALASIA, POR INDICACIÓN, 2018-2027 (MILLONES DE USD)

TABLA 221 MERCADO DE DISPOSITIVOS DE IMAGEN POR RESONANCIA MAGNÉTICA DE MALASIA, POR INDICACIÓN, 2018-2027 (MILLONES DE USD)

TABLA 222 MERCADO DE UROLOGÍA EN DISPOSITIVOS DE IMAGEN POR RESONANCIA MAGNÉTICA DE MALASIA, POR INDICACIÓN, 2018-2027 (MILLONES DE USD)

TABLA 223 MERCADO DENTAL EN MALASIA DE DISPOSITIVOS DE IMAGEN POR RESONANCIA MAGNÉTICA, POR INDICACIÓN, 2018-2027 (MILLONES DE USD)

TABLA 224 MERCADO DE DISPOSITIVOS DE IMAGEN POR RESONANCIA MAGNÉTICA DE MALASIA, POR USUARIO FINAL, 2018-2027 (MILLONES DE USD)

TABLA 225 MERCADO DE DISPOSITIVOS DE IMAGEN POR RESONANCIA MAGNÉTICA DE MALASIA, POR CANAL DE DISTRIBUCIÓN, 2018-2027 (MILLONES DE USD)

TABLA 226 MERCADO DE DISPOSITIVOS DE IMAGEN POR RESONANCIA MAGNÉTICA DE INDONESIA, POR INTENSIDAD DE CAMPO, 2018-2027 (MILLONES DE USD)

TABLA 227 MERCADO DE DISPOSITIVOS DE IMAGEN POR RESONANCIA MAGNÉTICA DE INDONESIA, POR TIPO, 2018-2027 (MILLONES DE USD)

TABLA 228 MERCADO DE DISPOSITIVOS DE IMAGEN POR RESONANCIA MAGNÉTICA DE INDONESIA, POR TIPO, 2018-2027 (UNIDADES)

TABLA 229 SISTEMAS CERRADOS DE MRI EN EL MERCADO DE DISPOSITIVOS DE IMAGEN POR RESONANCIA MAGNÉTICA DE INDONESIA, POR TIPO, 2018-2027 (MILLONES DE USD)

TABLA 230 MERCADO DE DISPOSITIVOS DE IMAGEN POR RESONANCIA MAGNÉTICA DE MRI DE ANCHO ANCHO DE INDONESIA, POR TIPO, 2018-2027 (MILLONES DE USD)

TABLA 231 SISTEMAS ABIERTOS DE MRI EN EL MERCADO DE DISPOSITIVOS DE IMAGEN POR RESONANCIA MAGNÉTICA DE INDONESIA, POR TIPO, 2018-2027 (MILLONES DE USD)

TABLA 232 MERCADO DE DISPOSITIVOS DE IMAGEN POR RESONANCIA MAGNÉTICA DE INDONESIA, POR MODALIDAD, 2018-2027 (MILLONES DE USD)

TABLA 233 MERCADO DE DISPOSITIVOS DE IMAGEN POR RESONANCIA MAGNÉTICA DE INDONESIA, POR INDICACIÓN, 2018-2027 (MILLONES DE USD)

TABLA 234 MERCADO DE DISPOSITIVOS DE IMAGEN POR RESONANCIA MAGNÉTICA DEL CEREBRO Y NEUROLÓGICO DE INDONESIA, POR INDICACIÓN, 2018-2027 (MILLONES DE USD)

TABLA 235 MERCADO DE DISPOSITIVOS DE IMAGEN POR RESONANCIA MAGNÉTICA DE INDONESIA, POR INDICACIÓN, 2018-2027 (MILLONES DE USD)

TABLA 236 MERCADO DE DISPOSITIVOS DE IMAGEN POR RESONANCIA MAGNÉTICA DE CARDIOLOGÍA DE INDONESIA, POR INDICACIÓN, 2018-2027 (MILLONES DE USD)

TABLA 237 MERCADO DE MAMOGRAFÍA EN DISPOSITIVOS DE IMAGEN POR RESONANCIA MAGNÉTICA DE INDONESIA, POR INDICACIÓN, 2018-2027 (MILLONES DE USD)

TABLA 238 MERCADO DE DISPOSITIVOS DE IMAGEN POR RESONANCIA MAGNÉTICA DE ONCOLOGÍA DE INDONESIA, POR INDICACIÓN, 2018-2027 (MILLONES DE USD)

TABLA 239 MERCADO DE DISPOSITIVOS DE IMAGEN POR RESONANCIA MAGNÉTICA PÉLVICA Y ABDOMINAL DE INDONESIA, POR INDICACIÓN, 2018-2027 (MILLONES DE USD)

TABLA 240 MERCADO DE DISPOSITIVOS DE IMAGEN POR RESONANCIA MAGNÉTICA DE INDONESIA, POR INDICACIÓN, 2018-2027 (MILLONES DE USD)

TABLA 241 MERCADO DE UROLOGÍA EN DISPOSITIVOS DE IMAGEN POR RESONANCIA MAGNÉTICA DE INDONESIA, POR INDICACIÓN, 2018-2027 (MILLONES DE USD)

TABLA 242 MERCADO INDONESIA DE DISPOSITIVOS DE IMAGEN POR RESONANCIA MAGNÉTICA, POR INDICACIÓN, 2018-2027 (MILLONES DE USD)

TABLA 243 MERCADO DE DISPOSITIVOS DE IMAGEN POR RESONANCIA MAGNÉTICA DE INDONESIA, POR USUARIO FINAL, 2018-2027 (MILLONES DE USD)

TABLA 244 MERCADO DE DISPOSITIVOS DE IMAGEN POR RESONANCIA MAGNÉTICA DE INDONESIA, POR CANAL DE DISTRIBUCIÓN, 2018-2027 (MILLONES DE USD)

TABLA 245 MERCADO DE DISPOSITIVOS DE IMAGEN POR RESONANCIA MAGNÉTICA DE FILIPINAS, POR INTENSIDAD DE CAMPO, 2018-2027 (MILLONES DE USD)

TABLA 246 MERCADO DE DISPOSITIVOS DE IMAGEN POR RESONANCIA MAGNÉTICA DE FILIPINAS, POR TIPO, 2018-2027 (MILLONES DE USD)

TABLA 247 MERCADO DE DISPOSITIVOS DE IMAGEN POR RESONANCIA MAGNÉTICA DE FILIPINAS, POR TIPO, 2018-2027 (UNIDADES)

TABLA 248 SISTEMAS CERRADOS DE MRI EN EL MERCADO DE DISPOSITIVOS DE IMAGEN POR RESONANCIA MAGNÉTICA DE FILIPINAS, POR TIPO, 2018-2027 (MILLONES DE USD)

TABLA 249 MERCADO DE DISPOSITIVOS DE IMÁGENES DE RESONANCIA MAGNÉTICA DE MRI DE ANCHO ANCHO DE FILIPINAS, POR TIPO, 2018-2027 (MILLONES DE USD)

TABLA 250 SISTEMAS ABIERTOS DE MRI EN EL MERCADO DE DISPOSITIVOS DE IMAGEN POR RESONANCIA MAGNÉTICA DE FILIPINAS, POR TIPO, 2018-2027 (MILLONES DE USD)

TABLA 251 MERCADO DE DISPOSITIVOS DE IMAGEN POR RESONANCIA MAGNÉTICA DE FILIPINAS, POR MODALIDAD, 2018-2027 (MILLONES DE USD)

TABLA 252 MERCADO DE DISPOSITIVOS DE IMAGEN POR RESONANCIA MAGNÉTICA DE FILIPINAS, POR INDICACIÓN, 2018-2027 (MILLONES DE USD)

TABLA 253 MERCADO DE DISPOSITIVOS DE IMAGEN POR RESONANCIA MAGNÉTICA DEL CEREBRO Y NEUROLÓGICO DE FILIPINAS, POR INDICACIÓN, 2018-2027 (MILLONES DE USD)

TABLA 254 MERCADO DE DISPOSITIVOS MUSCULOESQUELÉTICOS DE IMAGEN POR RESONANCIA MAGNÉTICA DE FILIPINAS, POR INDICACIÓN, 2018-2027 (MILLONES DE USD)

TABLA 255 MERCADO DE DISPOSITIVOS DE IMAGEN POR RESONANCIA MAGNÉTICA EN FILIPINAS, POR INDICACIÓN, 2018-2027 (MILLONES DE USD)

TABLA 256 MERCADO DE DISPOSITIVOS DE IMAGEN POR RESONANCIA MAGNÉTICA EN FILIPINAS, POR INDICACIÓN, 2018-2027 (MILLONES DE USD)

TABLA 257 MERCADO DE DISPOSITIVOS DE IMAGEN POR RESONANCIA MAGNÉTICA EN FILIPINAS, POR INDICACIÓN, 2018-2027 (MILLONES DE USD)

TABLA 258 MERCADO DE DISPOSITIVOS DE IMAGEN POR RESONANCIA MAGNÉTICA PÉLVICA Y ABDOMINAL DE FILIPINAS, POR INDICACIÓN, 2018-2027 (MILLONES DE USD)

TABLA 259 MERCADO DE DISPOSITIVOS DE IMAGEN POR RESONANCIA MAGNÉTICA DE FILIPINAS, POR INDICACIÓN, 2018-2027 (MILLONES DE USD)

TABLA 260 MERCADO DE UROLOGÍA EN DISPOSITIVOS DE IMAGEN POR RESONANCIA MAGNÉTICA DE FILIPINAS, POR INDICACIÓN, 2018-2027 (MILLONES DE USD)

TABLA 261 MERCADO DE DISPOSITIVOS DE IMAGEN POR RESONANCIA MAGNÉTICA DENTAL DE FILIPINAS, POR INDICACIÓN, 2018-2027 (MILLONES DE USD)

TABLA 262 MERCADO DE DISPOSITIVOS DE IMAGEN POR RESONANCIA MAGNÉTICA DE FILIPINAS, POR USUARIO FINAL, 2018-2027 (MILLONES DE USD)

TABLA 263 MERCADO DE DISPOSITIVOS DE IMAGEN POR RESONANCIA MAGNÉTICA DE FILIPINAS, POR CANAL DE DISTRIBUCIÓN, 2018-2027 (MILLONES DE USD)

TABLA 264 RESTO DEL MERCADO DE DISPOSITIVOS DE IMAGEN POR RESONANCIA MAGNÉTICA DE ASIA Y EL PACÍFICO, POR INTENSIDAD DE CAMPO, 2018-2027 (MILLONES DE USD)


Por favor complete el siguiente formulario para Infografías

Al hacer clic en el botón "Enviar", usted acepta la investigación de mercado de Data Bridge. política de privacidad y Términos y condiciones

Metodología de investigación:

La recopilación de datos y el análisis del año base se realizan mediante módulos de recopilación de datos con muestras de gran tamaño. La etapa incluye la obtención de información de mercado o datos relacionados a través de diversas fuentes y estrategias. Incluye examinar y planificar de antemano todos los datos adquiridos del pasado. Asimismo, abarca el examen de las inconsistencias de la información observadas en diferentes fuentes de información. Los datos de mercado se analizan y estiman utilizando modelos estadísticos y coherentes de mercado. Además, el análisis de la cuota de mercado y el análisis de tendencias clave son los principales factores de éxito en el informe de mercado. Para saber más, solicite una llamada de analista o envíe su consulta.

La metodología de investigación clave utilizada por el equipo de investigación de DBMR es la triangulación de datos, que implica extracción de datos, análisis del impacto de las variables de datos en el mercado y validación primaria (experto de la industria). Los modelos de datos incluyen cuadrícula de posicionamiento de proveedores, análisis de la línea de tiempo del mercado, descripción general y guía del mercado, cuadrícula de posicionamiento de la empresa, análisis de patentes, análisis de precios, análisis de participación de mercado de la empresa, estándares de medición, análisis global versus regional y de participación de proveedores. Para saber más sobre la metodología de investigación, envíe una consulta para hablar con nuestros expertos de la industria.

Por favor complete el siguiente formulario para Metodología de Investigación

Al hacer clic en el botón "Enviar", usted acepta la investigación de mercado de Data Bridge. política de privacidad y Términos y condiciones

Personalización disponible:

Data Bridge Market Research es líder en investigación formativa avanzada. Estamos orgullosos de brindar servicios a nuestros clientes nuevos y existentes con datos y análisis que coinciden y se adaptan a sus objetivos. El informe se puede personalizar para incluir análisis de tendencias de precios de marcas objetivo que comprendan el mercado de países adicionales (solicite la lista de países), datos de resultados de ensayos clínicos, revisión de la literatura, mercado renovado y análisis de la base de productos. El análisis de mercado de los competidores objetivo se puede analizar desde análisis basados ​​en tecnología hasta estrategias de cartera de mercado. Podemos agregar tantos competidores sobre los que necesite datos en el formato y estilo de datos que esté buscando. Nuestro equipo de analistas también puede proporcionarle datos en tablas dinámicas de archivos de Excel sin procesar (libro de datos) o puede ayudarlo a crear presentaciones a partir de los conjuntos de datos disponibles en el informe.

Complete el siguiente formulario para personalizar disponible

Al hacer clic en el botón "Enviar", usted acepta la investigación de mercado de Data Bridge. política de privacidad y Términos y condiciones

HAGA PREGUNTAS FRECUENTES

Se espera que el valor de mercado de imágenes por resonancia magnética sea de 4,49 mil millones de dólares para 2029.
Se proyecta que el mercado de Imágenes por resonancia magnética crecerá a una tasa compuesta anual del 3,41% durante el pronóstico para 2029.
Los principales actores que operan en el mercado de dispositivos de imágenes por resonancia magnética de Asia y el Pacífico son Aspect Imaging Ltd. (EE. UU.), CANON MEDICAL SYSTEMS CORPORATION (Japón), Siemens Healthcare GmbH (Alemania), GE Healthcare (EE. UU.), Hitachi, Ltd. (Japón ), Koninklijke Philips NV (Países Bajos), Neusoft Corporation (China), ESAOTE SPA (Italia), AllTech Medical Systems (China), Shanghai United Imaging Medical Technology Co., Ltd (China), United Imaging Intelligence (China), Medonica Co. LTD (China), IMRIS (EE. UU.), SG HealthCare (China), Elekta AB (Suecia), Beijing Wandong Medical Technology Co.,Ltd, (China), FONAR Corp. (EE. UU.), Synaptive Medical (Canadá).
Las ubicaciones geográficas cubiertas en el mercado de dispositivos de imágenes por resonancia magnética de Asia y el Pacífico son China, Japón, India, Corea del Sur, Singapur, Malasia, Australia, Tailandia, Indonesia, Filipinas, el resto de Asia y el Pacífico (APAC) en Asia y el Pacífico ( Asia Pacífico).
Informe de muestra gratuito

ELEGIR TIPO DE LICENCIA

  • 4200.00
  • 3500.00
  • 2000.00
  • 5500.00
  • 7500.00

Por qué elegirnos

Cobertura de la industria

DBMR trabaja en todo el mundo en múltiples industrias, lo que nos brinda conocimiento en todos los sectores verticales y brinda a nuestros clientes información no solo de su industria sino también de cómo otras industrias afectarán su ecosistema.

Cobertura Regional

La cobertura de Data Bridge no se limita a las economías desarrolladas o emergentes. Trabajamos en todo el mundo cubriendo la mayor variedad de países donde ninguna otra firma de investigación de mercado o consultoría de negocios ha realizado investigaciones; creando oportunidades de crecimiento para nuestros clientes en áreas aún desconocidas.

Cobertura Tecnológica

En el mundo actual, la tecnología impulsa el sentimiento del mercado, por lo que nuestra visión es brindar a nuestros clientes información no solo sobre las tecnologías desarrolladas, sino también sobre los cambios tecnológicos futuros e disruptivos a lo largo del ciclo de vida del producto, brindándoles oportunidades imprevistas en el mercado que crearán disrupciones en su industria. . Esto lleva a la innovación y a que nuestros clientes salgan ganadores.

Soluciones orientadas a objetivos

El objetivo de DBMR es ayudar a nuestros clientes a alcanzar sus objetivos a través de nuestras soluciones; por lo tanto, creamos de manera formativa las soluciones más adecuadas para las necesidades de nuestros clientes, ahorrándoles tiempo y esfuerzos para impulsar sus grandes estrategias.

Soporte de analista incomparable

Nuestros analistas se enorgullecen del éxito de nuestros clientes. A diferencia de otros, creemos en trabajar junto a nuestros clientes para lograr sus objetivos con soporte de analistas las 24 horas para determinar las necesidades correctas e inspirar la innovación a través del servicio.

Banner

testimonios de clientes