Asia Pacific Lyophilized Injectable Drugs Market
Tamaño del mercado en miles de millones de dólares
Tasa de crecimiento anual compuesta (CAGR) :
% 
 USD
1.00 Billion
USD
1.81 Billion
2024
2032
USD
1.00 Billion
USD
1.81 Billion
2024
2032
| 2025 –2032 | |
| USD 1.00 Billion | |
| USD 1.81 Billion | |
| % | |
|
Segmentación del mercado de fármacos inyectables liofilizados en Asia-Pacífico por tipo de envase (viales, jeringas de doble cámara, cartuchos de doble cámara y otros), clase de fármaco (antiinfecciosos, antineoplásicos, diuréticos, inhibidores de la bomba de protones, anestésicos, anticoagulantes, AINE, corticosteroides y otros), forma (polvo y líquido), indicación (oncología, enfermedades autoinmunes, trastornos hormonales, enfermedades respiratorias, trastornos gastrointestinales, trastornos dermatológicos, enfermedades oftálmicas y otras), vía de administración (intravenosa/infusión, intramuscular y otras), usuario final (hospitales, clínicas, atención domiciliaria y otros), canal de distribución (licitación directa, venta minorista y otros): tendencias del sector y previsiones hasta 2032.
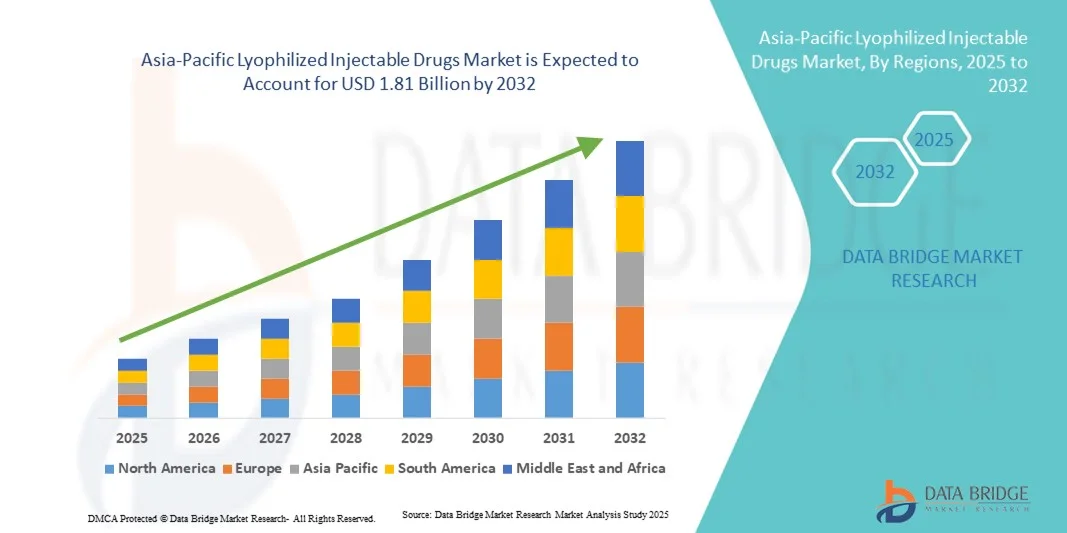
Tamaño del mercado de fármacos inyectables liofilizados de Asia-Pacífico
- El tamaño del mercado de medicamentos inyectables liofilizados de Asia-Pacífico se valoró en 1.000 millones de dólares en 2024 y se espera que alcance los 1.810 millones de dólares en 2032 , con una tasa de crecimiento anual compuesta (TCAC) del 7,7% durante el período de pronóstico.
- El crecimiento del mercado se debe principalmente a la creciente prevalencia de enfermedades crónicas, la mayor demanda de formulaciones estables y de acción prolongada, y la expansión de la producción de productos biológicos y biosimilares en toda la región.
- Además, los avances en las tecnologías de liofilización, el aumento de las inversiones de las empresas farmacéuticas y el crecimiento de la infraestructura sanitaria en economías emergentes como China, India y Japón están impulsando su adopción. Estos factores, en conjunto, aceleran la adopción de medicamentos inyectables liofilizados, lo que impulsa significativamente la expansión del mercado en toda la región de Asia-Pacífico.
Análisis del mercado de fármacos inyectables liofilizados en Asia-Pacífico
- Los fármacos inyectables liofilizados, que se someten a liofilización para mejorar su estabilidad y prolongar su vida útil, son cada vez más importantes en las formulaciones farmacéuticas de diversas áreas terapéuticas, como la oncología, las enfermedades infecciosas y los trastornos autoinmunitarios, debido a sus mejores características de almacenamiento, transporte y reconstitución.
- La creciente demanda de medicamentos inyectables liofilizados en Asia-Pacífico se debe principalmente al aumento de la prevalencia de enfermedades crónicas e infecciosas, la expansión de la fabricación biofarmacéutica y la creciente adopción de servicios de liofilización por contrato por parte de las empresas farmacéuticas y biotecnológicas.
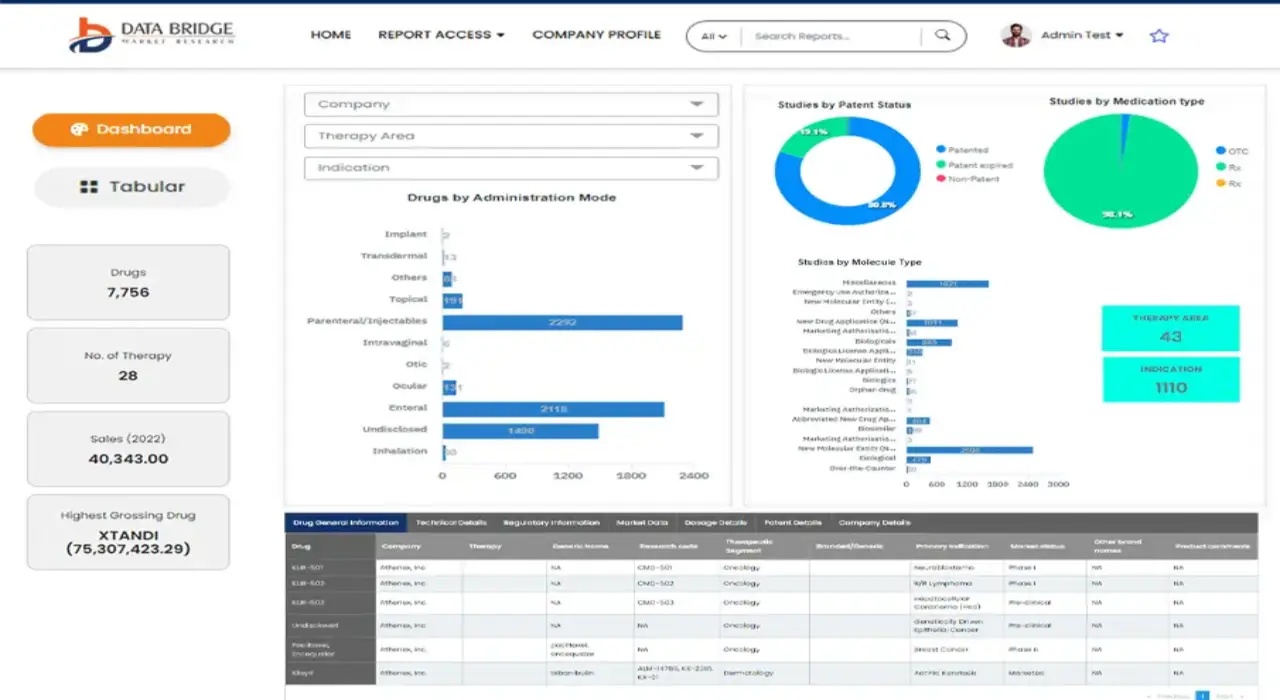
- China dominó el mercado de medicamentos inyectables liofilizados de Asia-Pacífico con una cuota de ingresos del 38,5 % en 2024, gracias a las sólidas iniciativas gubernamentales en I+D farmacéutica, la creciente producción de productos biológicos y la presencia de importantes fabricantes nacionales de medicamentos que invierten en tecnologías avanzadas de liofilización.
- Se prevé que India sea el mercado de mayor crecimiento en la región durante el período de pronóstico, impulsado por el aumento del gasto en atención médica, una base de fabricación farmacéutica en rápida expansión, reformas regulatorias favorables y una creciente demanda de formulaciones inyectables rentables y estables en hospitales y clínicas.
- El segmento de viales dominó el mercado de medicamentos inyectables liofilizados de Asia-Pacífico con una cuota de mercado del 46,7 % en 2024, debido a su rentabilidad, facilidad de almacenamiento y compatibilidad con diversas formulaciones terapéuticas, lo que lo convierte en el formato de envasado preferido entre los fabricantes de medicamentos de la región.
Alcance del informe y segmentación del mercado de fármacos inyectables liofilizados de Asia-Pacífico
|
Atributos |
Información clave del mercado de fármacos inyectables liofilizados en Asia-Pacífico |
|
Segmentos cubiertos |
|
|
Países cubiertos |
Asia-Pacífico
|
|
Principales actores del mercado |
|
|
Oportunidades de mercado |
|
|
Conjuntos de datos de valor añadido |
Además de información sobre escenarios de mercado como el valor de mercado, la tasa de crecimiento, la segmentación, la cobertura geográfica y los principales actores, los informes de mercado elaborados por Data Bridge Market Research también incluyen análisis exhaustivos de expertos, epidemiología de pacientes, análisis de proyectos en desarrollo, análisis de precios y marco regulatorio. |
Tendencias del mercado de fármacos inyectables liofilizados en Asia-Pacífico
Adopción creciente de tecnologías avanzadas de liofilización y fabricación por contrato
- Una tendencia significativa y en aceleración en el mercado de medicamentos inyectables liofilizados de Asia-Pacífico es la creciente adopción de tecnologías avanzadas de liofilización y la expansión de las organizaciones de fabricación por contrato (CMO) que ofrecen servicios especializados de liofilización a empresas farmacéuticas y biotecnológicas.
- Por ejemplo, en marzo de 2024, Recipharm amplió su capacidad de llenado, acabado y liofilización estéril en India para satisfacer la creciente demanda regional de productos biológicos y formulaciones inyectables, reforzando así su presencia en Asia-Pacífico.
- La integración de la tecnología analítica de procesos (PAT) y la automatización en la liofilización mejora la eficiencia del ciclo, garantiza la consistencia del producto y minimiza la intervención humana, lo que se traduce en un mejor control de la calidad del producto y una reducción de los costes de fabricación. Por ejemplo, empresas como Tofflon e IMA Life están desarrollando sistemas de liofilización automatizados que mejoran la escalabilidad del proceso y la fiabilidad operativa.
- Además, la creciente tendencia a externalizar los servicios de liofilización a organizaciones de fabricación por contrato (CMO) con instalaciones avanzadas está permitiendo a las pequeñas y medianas empresas farmacéuticas lanzar productos al mercado más rápidamente sin grandes inversiones de capital en infraestructura.
- La creciente colaboración entre las organizaciones regionales de fabricación por contrato (CMO) y las multinacionales farmacéuticas favorece la transferencia de tecnología, el cumplimiento normativo y la producción a gran escala de productos biológicos e inyectables, reforzando el papel de Asia-Pacífico como centro mundial de fabricación.
- Esta tendencia hacia la modernización, la externalización y la integración tecnológica está transformando el panorama del mercado regional, impulsando una mayor eficiencia, la expansión de la capacidad y la innovación en la producción de fármacos inyectables liofilizados.
Dinámica del mercado de fármacos inyectables liofilizados en Asia-Pacífico
Conductor
Creciente demanda de productos biológicos y expansión de la capacidad de fabricación farmacéutica
- El rápido crecimiento de la producción de productos biológicos y biosimilares, junto con la expansión de las instalaciones de fabricación farmacéutica en toda la región, es un factor clave que impulsa la demanda de medicamentos inyectables liofilizados en Asia-Pacífico.
- Por ejemplo, en febrero de 2024, WuXi Biologics anunció la incorporación de nuevas líneas de liofilización en China para respaldar la producción a gran escala de productos biológicos, respondiendo así a la creciente necesidad de formulaciones estables. Se prevé que estas inversiones impulsen el crecimiento del mercado durante el período de pronóstico.
- A medida que aumentan las enfermedades crónicas y los casos de cáncer, los medicamentos liofilizados ofrecen ventajas como una mayor vida útil, una mayor estabilidad y una mayor facilidad de transporte, lo que los convierte en elementos esenciales para los sistemas de salud en las economías emergentes.
- Además, la creciente base exportadora de productos farmacéuticos de la región y las iniciativas gubernamentales de apoyo a la fabricación nacional de medicamentos están contribuyendo significativamente al aumento de la demanda de capacidades de liofilización.
- El desarrollo de nuevas plantas de producción, la mayor adopción de la liofilización en la formulación de productos biológicos y el aumento de las colaboraciones entre empresas farmacéuticas nacionales e internacionales están acelerando la expansión de la industria en países clave como China, India y Japón.
- La sólida cartera de productos biofarmacéuticos en desarrollo y la creciente preferencia por formulaciones inyectables de alta calidad y larga duración son factores clave que impulsan el crecimiento de los fármacos inyectables liofilizados en el mercado de Asia-Pacífico.
Restricción/Desafío
Altos costos de los equipos y complejidad del cumplimiento normativo
- La elevada inversión de capital necesaria para los equipos e instalaciones de liofilización sigue siendo un desafío importante para las pequeñas y medianas empresas farmacéuticas de toda la región de Asia-Pacífico.
- Por ejemplo, la instalación y validación de sistemas avanzados de liofilización con tecnologías de automatización y monitorización aumentan sustancialmente los costes generales de producción, lo que limita el acceso a los fabricantes emergentes.
- Además, los complejos requisitos normativos para el procesamiento aséptico, la garantía de esterilidad y la validación de los ciclos de liofilización crean obstáculos operativos, especialmente para las empresas que se expanden a mercados internacionales. Por ejemplo, la inconsistencia de las normas normativas en países como India, China y Japón puede retrasar la aprobación de productos y aumentar la carga administrativa.
- La falta de programas de capacitación estandarizados y de personal cualificado para operar y mantener sistemas de liofilización sofisticados limita aún más la eficiencia y la consistencia de la producción.
- Además, las auditorías frecuentes, las exigencias de documentación y la necesidad de actualizaciones continuas de los equipos para cumplir con las normas de calidad globales en constante evolución aumentan la complejidad operativa y el costo.
- Superar estos desafíos mediante la armonización normativa, la capacitación de la fuerza laboral y la inversión en soluciones de liofilización rentables será crucial para lograr un crecimiento sostenido del mercado en la región de Asia-Pacífico.
Alcance del mercado de fármacos inyectables liofilizados de Asia-Pacífico
El mercado está segmentado en función del envase, la clase de fármaco, la forma farmacéutica, la indicación, la vía de administración, el usuario final y el canal de distribución.
- Por embalaje
Según el tipo de envase, el mercado de medicamentos inyectables liofilizados de Asia-Pacífico se segmenta en viales, jeringas de doble cámara, cartuchos de doble cámara y otros. El segmento de viales dominó el mercado con la mayor cuota de ingresos (46,7 %) en 2024, impulsado por su uso generalizado en hospitales, laboratorios y la industria farmacéutica debido a su alta capacidad de barrera y facilidad de esterilización. Los viales siguen siendo la opción de envasado preferida para formulaciones de fármacos a granel y productos biológicos, ya que mantienen la estabilidad y permiten una vida útil prolongada en diversas condiciones de almacenamiento. Su compatibilidad con múltiples clases de fármacos, su rentabilidad y su reutilización refuerzan aún más su posición en el mercado. Además, los viales de vidrio se consideran el estándar de oro en el envasado aséptico debido a su inercia química y resistencia a la humedad, lo que garantiza la integridad del producto. La creciente demanda de antibióticos y vacunas inyectables en toda la región también contribuye a su continuo dominio.
Se prevé que el segmento de jeringas de doble cámara experimente el crecimiento más rápido durante el período de pronóstico, impulsado por la creciente tendencia hacia las formulaciones listas para usar y fáciles de reconstituir. Estas jeringas mejoran la comodidad del paciente al separar el diluyente del fármaco hasta el momento de la administración, minimizando así los riesgos de contaminación. El auge de la autoadministración y el tratamiento en el punto de atención está aumentando el atractivo de los sistemas de doble cámara entre los profesionales sanitarios. Además, su creciente adopción en hospitales y en el ámbito de la atención domiciliaria, junto con los avances en el diseño de jeringas para productos biológicos, está impulsando la expansión del segmento. Los fabricantes también se están centrando en diseños de jeringas ergonómicos y con mayor seguridad para satisfacer las demandas de los pacientes y las normativas en toda la región de Asia-Pacífico.
- Por clase de fármaco
Según su clase farmacológica, el mercado se clasifica en antiinfecciosos, antineoplásicos, diuréticos, inhibidores de la bomba de protones, anestésicos, anticoagulantes, AINE, corticosteroides y otros. El segmento de antineoplásicos dominó el mercado de Asia-Pacífico en 2024, impulsado por la creciente prevalencia del cáncer y el aumento en el número de aprobaciones de fármacos oncológicos. La liofilización proporciona estabilidad y potencia a largo plazo a las formulaciones antineoplásicas sensibles al calor y la humedad, lo que garantiza su administración eficaz en entornos clínicos. El auge de las terapias oncológicas biológicas, como los anticuerpos monoclonales y los fármacos dirigidos, también impulsa el crecimiento del segmento. Además, la expansión de los centros de tratamiento oncológico y las inversiones gubernamentales en infraestructura para la atención del cáncer fortalecen la demanda. Países como China y Japón están invirtiendo fuertemente en productos oncológicos liofilizados para mejorar el acceso a los fármacos y su vida útil. Este dominio se ve reforzado por la continua I+D en terapias oncológicas personalizadas y combinadas que requieren soluciones de estabilidad liofilizadas.
Se prevé que el segmento de antiinfecciosos registre el crecimiento más rápido durante el período de pronóstico, impulsado por la alta incidencia de infecciones bacterianas y virales en las economías en desarrollo. Los medicamentos antiinfecciosos liofilizados son la opción preferida en regiones con infraestructura limitada de cadena de frío, ya que ofrecen una mayor vida útil y mejor estabilidad durante el transporte. La pandemia de COVID-19 aceleró aún más la producción de antivirales y antibióticos liofilizados, generando una demanda sostenida. Por ejemplo, los fabricantes locales en India y el sudeste asiático están ampliando sus líneas de liofilización para la producción de antibióticos a gran escala. El creciente esfuerzo gubernamental por fortalecer los programas de control de enfermedades infecciosas seguirá impulsando el crecimiento del segmento. Además, la creciente necesidad de terapias inyectables de respuesta rápida en entornos hospitalarios impulsa su adopción.
- Por formulario
Según su presentación, el mercado se divide en polvo y líquido. El segmento de polvo dominó el mercado en 2024, gracias a su mayor estabilidad, larga vida útil e idoneidad para formulaciones complejas de productos biológicos y péptidos. Las presentaciones en polvo liofilizado son las preferidas para vacunas, fármacos oncológicos y antibióticos que requieren conservación a diferentes temperaturas. La menor dependencia de la cadena de frío reduce los costos de transporte, lo que las hace ideales para los mercados emergentes. Los fabricantes también se benefician de una reconstitución más sencilla y una mayor flexibilidad en la dosificación que ofrecen las formulaciones en polvo. Además, la capacidad de mantener la potencia del fármaco durante períodos prolongados aumenta su demanda en las instituciones sanitarias. Se prevé que el dominio de este segmento se mantenga con el aumento de la producción de productos biológicos y la adopción de inyectables personalizados.
Se prevé que el segmento de líquidos experimente el crecimiento más rápido durante el período de pronóstico, impulsado por la creciente preferencia por las formulaciones listas para usar (RTU) y precargadas. Los hospitales y clínicas prefieren cada vez más los inyectables líquidos liofilizados por su facilidad de administración y menor tiempo de preparación. El crecimiento de este segmento también está vinculado a los avances tecnológicos en el mantenimiento de la estabilidad de los líquidos mediante técnicas de formulación optimizadas. Además, el uso cada vez mayor de formulaciones líquidas en atención de urgencias y terapias de infusión favorece la expansión del mercado. El auge de la autoadministración en la atención domiciliaria refuerza aún más la demanda de estas soluciones fáciles de usar.
- Por indicación
Según la indicación, el mercado se segmenta en oncología, enfermedades autoinmunes, trastornos hormonales, enfermedades respiratorias, trastornos gastrointestinales, trastornos dermatológicos, enfermedades oftalmológicas y otras. El segmento de oncología dominó el mercado de Asia-Pacífico con la mayor cuota de ingresos en 2024, debido a la creciente prevalencia del cáncer y al uso extensivo de formulaciones liofilizadas en quimioterapia y terapias dirigidas. La liofilización garantiza la estabilidad química de los fármacos oncológicos sensibles y previene su degradación durante el almacenamiento o transporte prolongados. La expansión de los centros regionales de tratamiento oncológico y la capacidad de fabricación de fármacos oncológicos, especialmente en China y Japón, impulsa aún más la demanda. Las crecientes inversiones de las empresas multinacionales en la producción de productos biológicos oncológicos en toda la región de Asia-Pacífico fortalecen este segmento. Además, la disponibilidad de financiación gubernamental para el desarrollo de fármacos oncológicos favorece el crecimiento continuo. El segmento se beneficia del creciente número de fármacos oncológicos inyectables en desarrollo que requieren una estabilización avanzada.
Se prevé que el segmento de enfermedades autoinmunes experimente el mayor crecimiento anual compuesto (CAGR) durante el período de pronóstico, impulsado por la creciente prevalencia de afecciones como la artritis reumatoide, el lupus y la psoriasis. Los productos biológicos liofilizados y los anticuerpos monoclonales se utilizan cada vez más para la terapia a largo plazo de enfermedades autoinmunes debido a su estabilidad y menor degradación. La ampliación de las capacidades de diagnóstico y la mayor concienciación sobre los trastornos autoinmunes están impulsando mayores tasas de tratamiento en la región. Además, las empresas farmacéuticas se están centrando en la producción de productos biológicos liofilizados aptos para sistemas de inyección domiciliaria. Las reformas sanitarias gubernamentales que mejoran el acceso de los pacientes a las terapias para enfermedades crónicas también contribuyen a este crecimiento. La adopción de formatos de envasado convenientes para los inyectables de enfermedades autoinmunes favorece un mayor uso clínico y por parte de los pacientes.
- Por vía administrativa
Según la vía de administración, el mercado se clasifica en intravenosa/infusión, intramuscular y otras. El segmento de administración intravenosa/infusión dominó el mercado en 2024, impulsado por su amplio uso en hospitales para cuidados críticos y de urgencias. La administración intravenosa garantiza una respuesta terapéutica rápida y una dosificación precisa para fármacos complejos como los biológicos y los agentes quimioterapéuticos. La fortaleza de este segmento radica en su integración con los sistemas de infusión hospitalarios y su idoneidad para grandes volúmenes de fármacos reconstituidos. La creciente adopción de inyectables liofilizados para tratamientos oncológicos, antiinfecciosos y de cuidados intensivos aumenta la demanda. Además, la preferencia por las formulaciones intravenosas estériles debido a los estándares de seguridad y eficacia respalda su dominio. La presencia de una infraestructura hospitalaria avanzada en países como Japón y Corea del Sur consolida aún más su liderazgo.
Se prevé que el segmento intramuscular experimente el crecimiento más rápido durante el período de pronóstico, impulsado por la creciente demanda de formulaciones de autoadministración y de acción prolongada. La administración intramuscular permite una absorción gradual del fármaco, lo que la hace idónea para tratamientos crónicos y preventivos. El creciente interés en soluciones de atención médica domiciliaria y procedimientos de administración simplificados impulsa su adopción en las zonas urbanas de Asia-Pacífico. Las formulaciones intramusculares liofilizadas son especialmente beneficiosas para vacunas y terapias hormonales que requieren estabilidad y liberación controlada. Además, las innovaciones en dispositivos precargados y de doble cámara hacen que las inyecciones intramusculares sean más seguras y convenientes. Se espera que el mayor acceso a la atención médica en las regiones rurales estimule aún más el crecimiento de este segmento.
- Por usuario final
Según el usuario final, el mercado se segmenta en hospitales, clínicas, atención domiciliaria y otros. El segmento hospitalario dominó el mercado en 2024, con la mayor cuota debido al elevado volumen de pacientes y a la infraestructura avanzada para la reconstitución y administración de medicamentos. Los hospitales siguen siendo los principales centros para los tratamientos oncológicos, de enfermedades infecciosas y de cuidados intensivos, que dependen en gran medida de inyectables liofilizados. La disponibilidad de profesionales sanitarios cualificados y entornos asépticos mejora la eficiencia en la manipulación de los productos. El aumento de la inversión pública en hospitales de China, India y el Sudeste Asiático impulsa la demanda. Además, los sistemas de adquisición hospitalarios permiten la compra al por mayor de medicamentos liofilizados mediante licitaciones, lo que fortalece aún más este segmento. La creciente prevalencia de enfermedades crónicas y agudas sigue consolidando a los hospitales como la principal categoría de usuarios finales.
Se prevé que el segmento de atención médica domiciliaria registre el crecimiento más rápido durante el período de pronóstico, impulsado por la creciente preferencia por los tratamientos en el hogar y las tendencias de autoadministración. Los avances en la tecnología de reconstitución y los envases fáciles de usar permiten a los pacientes preparar e inyectarse medicamentos de forma segura en casa. Este cambio reduce las visitas al hospital y los costos de atención médica para el manejo de enfermedades crónicas. Además, la expansión de la telemedicina y los servicios de enfermería a domicilio en los centros urbanos respalda esta tendencia. Los fabricantes están desarrollando cada vez más inyectables liofilizados precargados y listos para usar para facilitar su uso en el hogar. El creciente conocimiento y la mayor accesibilidad a las terapias biológicas impulsarán aún más la expansión del segmento en toda la región.
- Por canal de distribución
Según el canal de distribución, el mercado se divide en licitación directa, venta minorista y otros. El segmento de licitación directa dominó el mercado en 2024, impulsado por las compras a gran escala realizadas por hospitales públicos y agencias de salud pública. La compra al por mayor mediante licitaciones garantiza la eficiencia en costos y el suministro constante de medicamentos liofilizados esenciales para oncología, control de infecciones y programas de inmunización. Este canal se beneficia de redes de distribución estructuradas y acuerdos de precios preferenciales con los principales proveedores farmacéuticos. El predominio de la distribución por licitación directa es particularmente evidente en China e India, donde los hospitales del sector público representan la mayor parte del consumo de medicamentos inyectables. Además, los organismos reguladores fomentan las licitaciones centralizadas para mantener la transparencia en la calidad y los precios. El aumento de la capacidad de producción entre los fabricantes locales refuerza aún más el liderazgo de este segmento.
Se prevé que el segmento de ventas minoristas experimente el crecimiento más rápido durante el período de pronóstico, impulsado por la rápida expansión de las cadenas de farmacias y las plataformas de venta de medicamentos en línea en la región de Asia-Pacífico. La creciente preferencia de los pacientes por la comodidad y el fácil acceso a las formulaciones liofilizadas está transformando el panorama de la distribución. Los canales minoristas ofrecen cada vez más medicamentos liofilizados, tanto de marca como genéricos, para afecciones crónicas y el autocuidado. Además, la penetración del comercio electrónico y los servicios de recetas digitales en las zonas urbanas están simplificando las compras minoristas. El auge del consumo de servicios de salud privados y los modelos de entrega directa al paciente también favorecen este crecimiento. Las compañías farmacéuticas se están asociando con redes minoristas para ampliar el alcance y la disponibilidad de sus productos en los mercados emergentes.
Análisis regional del mercado de fármacos inyectables liofilizados en Asia-Pacífico
- China dominó el mercado de medicamentos inyectables liofilizados de Asia-Pacífico con una cuota de ingresos del 38,5 % en 2024, gracias a las sólidas iniciativas gubernamentales en I+D farmacéutica, la creciente producción de productos biológicos y la presencia de importantes fabricantes nacionales de medicamentos que invierten en tecnologías avanzadas de liofilización.
- La gran población de pacientes en China, junto con el aumento de la prevalencia de enfermedades crónicas, sigue impulsando la necesidad de terapias inyectables eficaces y de larga duración.
- Además, la presencia de importantes empresas farmacéuticas nacionales y multinacionales, junto con el creciente número de organizaciones de fabricación por contrato (CMO), refuerza el papel fundamental de China en el suministro regional y la capacidad de exportación.
Análisis del mercado chino de fármacos inyectables liofilizados
China dominó el mercado de medicamentos inyectables liofilizados de Asia-Pacífico en 2024, con la mayor cuota de ingresos, gracias a su sólida capacidad de fabricación farmacéutica, su vasta población de pacientes y las reformas sanitarias impulsadas por el gobierno. El aumento de las inversiones del país en productos biológicos, vacunas e inyectables oncológicos ha consolidado su posición como líder regional. Además, la expansión de las organizaciones de fabricación por contrato (CMO) y la adopción de tecnologías de liofilización de vanguardia permiten a los fabricantes chinos mejorar la estabilidad de los medicamentos y prolongar su vida útil. El enfoque de China en la autosuficiencia en la producción de medicamentos y su potencial exportador sigue reforzando su dominio del mercado.
Perspectivas del mercado indio de fármacos inyectables liofilizados
Se prevé que India sea el mercado de mayor crecimiento en la industria de medicamentos inyectables liofilizados de Asia-Pacífico, impulsado por su base de fabricación farmacéutica en rápida expansión y una sólida producción orientada a la exportación. El aumento de las inversiones del país en instalaciones para inyectables estériles y la iniciativa gubernamental «Hecho en India» están acelerando la expansión del mercado. La creciente demanda de productos biológicos asequibles, junto con el aumento del consumo interno de formulaciones inyectables para enfermedades crónicas, impulsa aún más el crecimiento. Además, la presencia de empresas farmacéuticas líderes, los avances en equipos de liofilización y marcos regulatorios favorables están fortaleciendo la posición de India en el panorama regional.
Perspectivas del mercado japonés de fármacos inyectables liofilizados
El mercado japonés de medicamentos inyectables liofilizados experimenta un crecimiento sostenido, impulsado por un sistema sanitario consolidado, una población de edad avanzada en aumento y una alta adopción de productos biológicos para enfermedades crónicas y degenerativas. Las empresas farmacéuticas japonesas se centran cada vez más en las formulaciones liofilizadas para garantizar la estabilidad y eficacia a largo plazo de los fármacos. La innovación en las tecnologías de liofilización y el apoyo gubernamental a la I+D biofarmacéutica impulsan el desarrollo del mercado. Además, los rigurosos estándares de calidad de Japón y su preferencia por la fabricación de precisión lo convierten en un centro clave para la producción de medicamentos inyectables de alta calidad en la región Asia-Pacífico.
Perspectivas del mercado de fármacos inyectables liofilizados en Corea del Sur
El mercado surcoreano de medicamentos inyectables liofilizados está experimentando una rápida expansión, impulsada por el aumento de las inversiones en biotecnología, biosimilares y producción de vacunas. La avanzada infraestructura de I+D del país, los incentivos gubernamentales para la innovación farmacéutica y las crecientes alianzas con empresas biofarmacéuticas multinacionales están acelerando la adopción de la liofilización. Las empresas surcoreanas están aprovechando la automatización y la digitalización en los procesos de liofilización para mejorar la calidad y la eficiencia. Además, la creciente prevalencia del cáncer y las enfermedades autoinmunes está impulsando la demanda de medicamentos inyectables de alta estabilidad, lo que posiciona a Corea del Sur como un actor clave emergente en el mercado de Asia-Pacífico.
Cuota de mercado de fármacos inyectables liofilizados en Asia-Pacífico
La industria de medicamentos inyectables liofilizados de Asia-Pacífico está liderada principalmente por empresas bien establecidas, entre las que se incluyen:
- Pfizer Inc. (EE. UU.)
- Merck & Co., Inc., (EE. UU.)
- F. Hoffmann-La Roche Ltd (Suiza)
- GSK plc. (Reino Unido)
- AstraZeneca (Reino Unido)
- Johnson & Johnson Services, Inc. (EE. UU.)
- Compañía Farmacéutica Takeda Limited (Japón)
- Baxter (EE. UU.)
- Sanofi (Francia)
- Novartis AG (Suiza)
- Boehringer Ingelheim International GmbH (Alemania)
- Fresenius Kabi AG (Alemania)
- Laboratorios Dr. Reddy's Ltd. (India)
- Sun Pharmaceutical Industries Ltd. (India)
- Piramal Enterprises Limited (India)
- Biocon Ltd. (India)
- WuXi Biologics Co., Ltd. (China)
- CSL Limited (Australia)
- Lonza (Suiza)
- Samsung Biologics (República de Corea)
¿Cuáles son los últimos avances en el mercado de fármacos inyectables liofilizados de Asia-Pacífico?
- En noviembre de 2024, la OMS publicó documentos de evaluación (EUL/materiales de evaluación) para la vacuna contra la viruela/mpox LC16m8 de KM Biologics. La evaluación de la OMS destacó las características programáticas y el manejo operativo de la presentación liofilizada, un ejemplo de productos de vacunas liofilizadas fabricados recientemente en la región Asia-Pacífico que se sometieron a una revisión global de uso de emergencia/calidad.
- En noviembre de 2022, WuXi STA puso en marcha una línea adicional de formulación/llenado parenteral en su planta de Wuxi (una segunda línea de alta flexibilidad con liofilizador incorporado y manipulación automática de viales), lo que incrementó aún más su capacidad para fabricar productos inyectables liofilizados a escala comercial y redujo los plazos de entrega para los clientes que buscan viales de polvo liofilizado en la región de Asia-Pacífico.
- En septiembre de 2023, Henlius (grupo Fosun Pharma) informó que su capacidad de fabricación ahora incluía una línea dedicada a la preparación de productos liofilizados (junto con las líneas de llenado de líquidos), destacando la capacidad de producción de productos liofilizados en su informe provisional/de instalaciones, un ejemplo de empresas biofarmacéuticas de APAC que invierten en capacidad de liofilización nacional para respaldar los productos biológicos y biosimilares.
- En mayo de 2023, un desarrollador/fabricante chino anunció la aprobación por parte de la NMPA de una formulación inyectable de polvo liofilizado (un anticuerpo monoclonal desarrollado en el país y presentado en viales liofilizados), lo que representa otro caso de aprobación por parte de China de inyectables biológicos liofilizados de producción local y amplía el suministro nacional de productos terapéuticos liofilizados.
- En enero de 2022, WuXi STA puso en marcha su primera línea de fabricación de formulaciones parenterales en su planta de Wuxi, China. Se trata de una línea de llenado estéril totalmente automatizada, equipada con un liofilizador integrado capaz de producir polvos liofilizados (viales, jeringas, cartuchos) y de alternar rápidamente entre los modos de llenado para respaldar la producción de grandes volúmenes de inyectables liofilizados. Esto amplió la capacidad local de CMC y de llenado/acabado para productos biológicos y ayudó a los clientes globales a acelerar el suministro de medicamentos liofilizados desde China.
SKU-
Obtenga acceso en línea al informe sobre la primera nube de inteligencia de mercado del mundo
- Panel de análisis de datos interactivo
- Panel de análisis de empresas para oportunidades con alto potencial de crecimiento
- Acceso de analista de investigación para personalización y consultas
- Análisis de la competencia con panel interactivo
- Últimas noticias, actualizaciones y análisis de tendencias
- Aproveche el poder del análisis de referencia para un seguimiento integral de la competencia
Metodología de investigación
La recopilación de datos y el análisis del año base se realizan utilizando módulos de recopilación de datos con muestras de gran tamaño. La etapa incluye la obtención de información de mercado o datos relacionados a través de varias fuentes y estrategias. Incluye el examen y la planificación de todos los datos adquiridos del pasado con antelación. Asimismo, abarca el examen de las inconsistencias de información observadas en diferentes fuentes de información. Los datos de mercado se analizan y estiman utilizando modelos estadísticos y coherentes de mercado. Además, el análisis de la participación de mercado y el análisis de tendencias clave son los principales factores de éxito en el informe de mercado. Para obtener más información, solicite una llamada de un analista o envíe su consulta.
La metodología de investigación clave utilizada por el equipo de investigación de DBMR es la triangulación de datos, que implica la extracción de datos, el análisis del impacto de las variables de datos en el mercado y la validación primaria (experto en la industria). Los modelos de datos incluyen cuadrícula de posicionamiento de proveedores, análisis de línea de tiempo de mercado, descripción general y guía del mercado, cuadrícula de posicionamiento de la empresa, análisis de patentes, análisis de precios, análisis de participación de mercado de la empresa, estándares de medición, análisis global versus regional y de participación de proveedores. Para obtener más información sobre la metodología de investigación, envíe una consulta para hablar con nuestros expertos de la industria.
Personalización disponible
Data Bridge Market Research es líder en investigación formativa avanzada. Nos enorgullecemos de brindar servicios a nuestros clientes existentes y nuevos con datos y análisis que coinciden y se adaptan a sus objetivos. El informe se puede personalizar para incluir análisis de tendencias de precios de marcas objetivo, comprensión del mercado de países adicionales (solicite la lista de países), datos de resultados de ensayos clínicos, revisión de literatura, análisis de mercado renovado y base de productos. El análisis de mercado de competidores objetivo se puede analizar desde análisis basados en tecnología hasta estrategias de cartera de mercado. Podemos agregar tantos competidores sobre los que necesite datos en el formato y estilo de datos que esté buscando. Nuestro equipo de analistas también puede proporcionarle datos en archivos de Excel sin procesar, tablas dinámicas (libro de datos) o puede ayudarlo a crear presentaciones a partir de los conjuntos de datos disponibles en el informe.