

Asia Pacific Lumber Pallet Market
Tamaño del mercado en miles de millones de dólares
Tasa de crecimiento anual compuesta (CAGR) :
% 
 USD
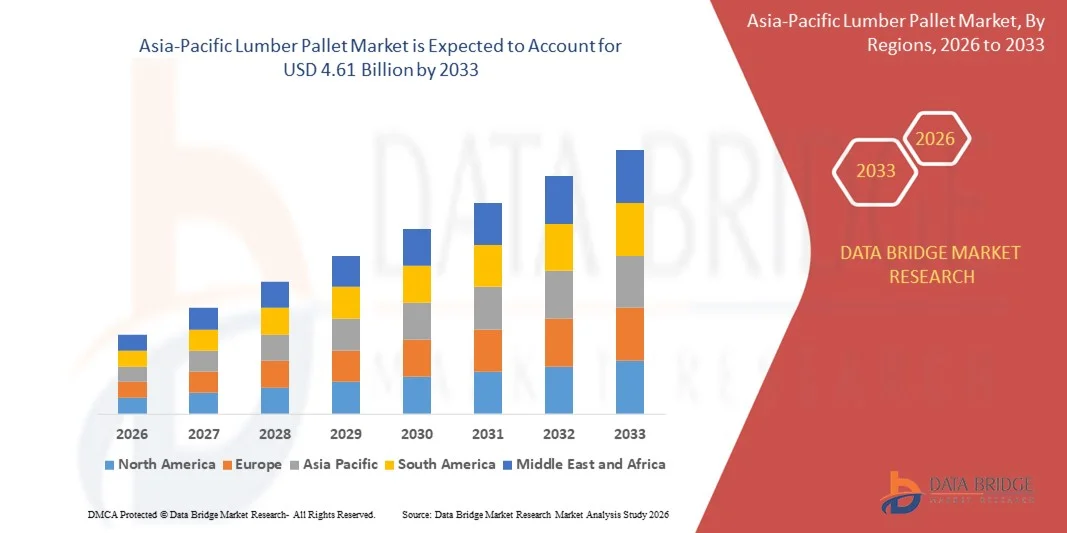
2.89 Billion
USD
4.61 Billion
2025
2033
USD
2.89 Billion
USD
4.61 Billion
2025
2033
| 2026 –2033 | |
| USD 2.89 Billion | |
| USD 4.61 Billion | |
| % | |
|
Segmentación del mercado de tarimas de madera en Asia-Pacífico, por tipo de producto (tarimas de madera con largueros, tarimas de madera en bloque, tarimas de doble cara, tarimas de doble ala y otros), tipo de madera (madera blanda y madera dura), tamaño (800 x 1200 mm, 1000 x 1200 mm, 800 x 600 mm, 914 x 914 mm, 1118 x 1118 mm, 1200 x 1000 mm y otros), canal de distribución (presencial y en línea), usuario final (alimentos y bebidas, productos farmacéuticos, productos químicos, comercio minorista, automoción y otros): tendencias y pronóstico del sector hasta 2033.
Tamaño del mercado de palets de madera en Asia-Pacífico
- El tamaño del mercado de pallets de madera de Asia-Pacífico se valoró en USD 2.89 mil millones en 2025 y se espera que alcance los USD 4.61 mil millones para 2033 , con una CAGR del 6,0% durante el período de pronóstico.
- El crecimiento del mercado está impulsado en gran medida por la expansión constante de las actividades de comercio, almacenamiento y logística globales, que continúa aumentando la demanda de soluciones de manejo de materiales confiables y rentables en múltiples industrias.
- Además, el creciente uso de pallets en alimentos y bebidas, comercio minorista y manufactura para el almacenamiento y transporte seguro de mercancías está fortaleciendo la demanda del mercado. Estos factores combinados impulsan el consumo constante de pallets de madera e influyen positivamente en el crecimiento general del mercado.
Análisis del mercado de palets de madera en Asia-Pacífico
- Los pallets de madera, que sirven como plataformas de carga esenciales para el almacenamiento y el transporte, siguen siendo fundamentales para las operaciones de la cadena de suministro en la logística nacional e internacional debido a su durabilidad, reutilización y compatibilidad con equipos de manipulación estándar.
- La creciente necesidad de un manejo eficiente de cargas a granel, el énfasis creciente en el embalaje estandarizado y el movimiento continuo de mercancías a través de las cadenas de suministro industriales sostienen colectivamente la demanda de pallets de madera y refuerzan su importancia dentro del ecosistema logístico global.
- China dominó el mercado de pallets de madera en 2025, debido a su vasta base manufacturera, altos volúmenes de exportación y extensas redes nacionales de logística y almacenamiento que respaldan la distribución de bienes industriales y de consumo.
- Se espera que India sea el país de más rápido crecimiento en el mercado de pallets de madera durante el período de pronóstico debido a la rápida expansión de los sectores de fabricación, venta minorista y comercio electrónico junto con un crecimiento significativo en el almacenamiento organizado.
- El segmento de pallets de madera con largueros dominó el mercado con una cuota de mercado del 58,5 % en 2025, gracias a su bajo coste, su sencilla construcción y su amplio uso en almacenamiento y logística nacional. Estos pallets son fáciles de reparar y aptos para envíos de gran volumen con requisitos de carga moderados. Su ligereza facilita una manipulación y un transporte eficientes. Los diseños estandarizados mejoran aún más la eficiencia operativa. La alta disponibilidad de materias primas de madera blanda impulsa la producción a gran escala. Esta demanda sostenida consolida su liderazgo en el mercado.
Alcance del informe y segmentación del mercado de tarimas de madera
|
Atributos |
Perspectivas clave del mercado de palés de madera |
|
Segmentos cubiertos |
|
|
Países cubiertos |
Asia-Pacífico
|
|
Actores clave del mercado |
|
|
Oportunidades de mercado |
|
|
Conjuntos de información de datos de valor añadido |
Además de los conocimientos sobre escenarios de mercado como valor de mercado, tasa de crecimiento, segmentación, cobertura geográfica y actores principales, los informes de mercado seleccionados por Data Bridge Market Research también incluyen análisis de importación y exportación, descripción general de la capacidad de producción, análisis del consumo de producción, análisis de tendencias de precios, escenario de cambio climático, análisis de la cadena de suministro, análisis de la cadena de valor, descripción general de materias primas/consumibles, criterios de selección de proveedores, análisis PESTLE, análisis de Porter y marco regulatorio. |
Tendencias del mercado de palets de madera en Asia-Pacífico
Creciente adopción de pallets de madera sostenibles y reciclados
- Una tendencia clave en el mercado de pallets de madera es la creciente adopción de pallets de madera sostenible y reciclada, impulsada por el aumento de las regulaciones ambientales y los compromisos corporativos de sostenibilidad en las cadenas de suministro globales. Las empresas priorizan los pallets fabricados con madera reciclada y madera de origen responsable para reducir la generación de residuos y la huella de carbono asociada a las operaciones logísticas.
- Por ejemplo, UFP Industries ha ampliado su cartera de pallets fabricados con materiales de madera reciclada y recuperada, apoyando así los objetivos de sostenibilidad de los clientes de la gran distribución y la alimentación. Estas iniciativas están fortaleciendo las prácticas de economía circular en la industria de pallets y fomentando una mayor adopción de soluciones de pallets ecológicas.
- Las principales empresas de pooling y gestión de pallets están integrando activamente pallets de madera reciclada en sistemas de circuito cerrado para prolongar su vida útil y minimizar el consumo de materia prima. Este enfoque favorece la optimización de costes, a la vez que cumple con los requisitos de informes de sostenibilidad impuestos por las marcas globales.
- El sector de alimentación y bebidas prioriza cada vez más los pallets de madera reciclada que cumplen con las normas de higiene y seguridad, a la vez que cumplen los objetivos de sostenibilidad. Este cambio refuerza la demanda de pallets que equilibren durabilidad, cumplimiento normativo y responsabilidad ambiental.
- Los fabricantes también están invirtiendo en soluciones de palets de madera de ingeniería y compuesta que aprovechan residuos y subproductos de la madera. Esta tendencia está mejorando la eficiencia de los materiales y reduciendo la dependencia de los recursos de madera virgen.
- En general, el creciente énfasis en el abastecimiento sostenible, la reducción de residuos y el cumplimiento normativo está transformando las prácticas de fabricación de pallets. Esta tendencia está impulsando la transición del mercado hacia soluciones de pallets de madera ambientalmente responsables en todos los sectores.
Dinámica del mercado de palets de madera en Asia-Pacífico
Conductor
Expansión de las actividades globales de logística, almacenamiento y comercio electrónico
- La rápida expansión de las redes logísticas globales, la infraestructura de almacenamiento y las operaciones de comercio electrónico es un factor clave del mercado de palés de madera, ya que estos siguen siendo esenciales para el almacenamiento y transporte eficiente de mercancías. El creciente movimiento de bienes de consumo, productos industriales y materias primas sustenta una alta demanda de soluciones estandarizadas para palés.
- Por ejemplo, CHEP continúa expandiendo sus servicios de pooling de pallets y logística para apoyar las cadenas de suministro de comercio minorista y comercio electrónico a gran escala, lo que permite una gestión eficiente de materiales en los centros de distribución. Esta expansión destaca el papel crucial de los pallets en entornos logísticos de alto rendimiento.
- El crecimiento del comercio minorista organizado y de los proveedores de logística externos impulsa aún más el consumo de palés, ya que los almacenes centralizados dependen en gran medida de ellos para la gestión del inventario y el cumplimiento de pedidos. Esta dependencia facilita el uso constante de palés en el comercio nacional e internacional.
- Las industrias manufactureras también están ampliando sus capacidades de producción y distribución, lo que aumenta la necesidad de soportes de carga fiables que resistan la manipulación repetida. Los pallets de madera ofrecen durabilidad y compatibilidad con los sistemas de manipulación automatizados, lo que favorece su adopción generalizada.
- En conjunto, la expansión de la infraestructura de logística, almacenamiento y comercio electrónico está reforzando el papel fundamental de los pallets de madera dentro de las cadenas de suministro globales e impulsando un crecimiento sostenido del mercado.
Restricción/Desafío
Volatilidad en los precios de la madera y disponibilidad de materia prima
- El mercado de pallets de madera se enfrenta a importantes desafíos debido a la volatilidad de los precios de la madera y las fluctuaciones en la disponibilidad de materia prima, que impactan directamente los costos de producción y los márgenes de ganancia. Los cambios en la oferta de madera, las restricciones regulatorias y la demanda del mercado generan incertidumbre para los fabricantes de pallets.
- Por ejemplo, empresas como Greif han experimentado presiones de costos asociadas a la fluctuación de los precios de la madera, lo que ha requerido ajustes de precios y medidas de eficiencia operativa para mantener los márgenes. Estas variaciones de costos complican los acuerdos de precios a largo plazo con los clientes.
- Los fabricantes también deben gestionar la creciente competencia por la madera en las industrias de la construcción y el mueble, lo que intensifica los desafíos para el abastecimiento de materias primas. Esta competencia ejerce una presión adicional sobre las estrategias de abastecimiento.
- Los esfuerzos para mitigar la volatilidad de los precios mediante soluciones de madera reciclada y pallets compuestos requieren inversión en nuevas capacidades de procesamiento, lo que incrementa la carga de los gastos de capital. Equilibrar el control de costos con las iniciativas de sostenibilidad sigue siendo complejo.
- En general, la inestabilidad de los precios de la madera y los problemas de suministro de materias primas siguen limitando la flexibilidad del mercado. Estos factores obligan a los fabricantes a optimizar el abastecimiento, diversificar los materiales y ajustar sus estrategias de precios para mantener sus operaciones en un entorno de costos fluctuantes.
Análisis del mercado de palets de madera en Asia-Pacífico
El mercado está segmentado según el tipo de producto, tipo de madera, tamaño, canal de distribución y usuario final.
- Por tipo de producto
Según el tipo de producto, el mercado de palets de madera se segmenta en palets de madera con largueros, palets de madera en bloque, palets de doble cara, palets de doble ala, entre otros. El segmento de palets de madera con largueros dominó el mercado con la mayor participación, un 58,5 %, en 2025 gracias a su bajo coste, su construcción sencilla y su amplio uso en almacenamiento y logística nacional. Estos palets son fáciles de reparar y aptos para envíos de gran volumen con requisitos de carga moderados. Su ligereza facilita su manipulación y transporte. Los diseños estandarizados mejoran aún más la eficiencia operativa. La alta disponibilidad de materias primas de madera blanda facilita la producción a gran escala. Esta demanda sostenida consolida su liderazgo en el mercado.
Se prevé que el segmento de pallets de madera en bloque experimente el mayor crecimiento entre 2026 y 2033, impulsado por la creciente demanda de aplicaciones para cargas pesadas y exportación. Los pallets en bloque ofrecen cuatro entradas, lo que mejora la manipulación de materiales en almacenes automatizados. Su mayor resistencia y estabilidad se adaptan a las necesidades de envíos internacionales. El creciente uso en la logística farmacéutica y alimentaria impulsa su adopción. El crecimiento de la automatización de almacenes impulsa aún más la demanda. Estos factores posicionan a los pallets en bloque como un segmento clave de crecimiento.
- Por tipo de madera
Según el tipo de madera, el mercado de palets de madera se segmenta en madera blanda y madera dura. El segmento de madera blanda dominó el mercado en 2025, gracias a sus menores costos, menor peso y fácil disponibilidad. Los palets de madera blanda permiten una producción más rápida y se utilizan ampliamente en la logística minorista y de bienes de consumo de alta rotación (FMCG). Su adecuada capacidad de carga cumple con la mayoría de las aplicaciones estándar. Las certificaciones de sostenibilidad fomentan aún más su adopción. Los altos ciclos de reemplazo impulsan una demanda constante. Estos factores mantienen el dominio del segmento.
Se proyecta que el segmento de madera dura crecerá al ritmo más rápido durante el período de pronóstico, impulsado por la demanda de pallets duraderos y de larga duración. La madera dura ofrece mayor resistencia y resistencia al impacto para la industria pesada. Su mayor vida útil reduce los costos generales de reemplazo. El crecimiento de los envíos orientados a la exportación impulsa su adopción. Los sectores automotriz e industrial prefieren cada vez más los pallets de madera dura. Esto impulsa un crecimiento más rápido del segmento.
- Por tamaño
Según el tamaño, el mercado de palets de madera se segmenta en 800 x 1200 mm, 1000 x 1200 mm, 800 x 600 mm, 914 x 914 mm, 1118 x 1118 mm, 1200 x 1000 mm, entre otros. El segmento de 1200 x 1000 mm dominó el mercado en 2025 gracias a su compatibilidad con los estándares globales de envío y contenedores. Este tamaño facilita la utilización eficiente del espacio en almacenes y sistemas de transporte. Se utiliza ampliamente en la distribución de alimentos, bebidas y comercio minorista. La estandarización reduce la complejidad de la manipulación. Su alta aceptación regional impulsa la demanda por volumen. Estos factores respaldan su liderazgo.
Se prevé que el segmento de 800 x 1200 mm registre el mayor crecimiento entre 2026 y 2033, impulsado por el auge del comercio europeo y la logística transfronteriza. La adaptación a los estándares de europalets facilita una integración fluida. El crecimiento del comercio minorista organizado y el comercio electrónico impulsa la demanda. La distribución eficiente de la carga mejora la seguridad. El aumento de las exportaciones impulsa su adopción. Esto posiciona al segmento para un fuerte crecimiento.
- Por canal de distribución
Según el canal de distribución, el mercado de palets de madera se segmenta en presencial y en línea. El segmento presencial tuvo la mayor participación en 2025, gracias a las relaciones consolidadas con los proveedores y a las prácticas de compra a granel. El abastecimiento presencial facilita la personalización y la inspección de calidad. Los grandes fabricantes prefieren la compra directa por su fiabilidad en el suministro. La disponibilidad inmediata facilita la continuidad de las operaciones. Los contratos a largo plazo estabilizan los precios. Estos factores sustentan el dominio del mercado presencial.
Se prevé que el segmento online crezca al ritmo más rápido durante el período de pronóstico, impulsado por la contratación digital y la expansión del comercio electrónico B2B. Las plataformas online ofrecen precios transparentes y un mayor acceso a proveedores. Las pymes adoptan cada vez más el abastecimiento digital para ahorrar tiempo. La mejora de la fiabilidad logística genera confianza. La digitalización de la cadena de suministro acelera la adopción, lo que impulsa un rápido crecimiento online.
- Por el usuario final
Según el usuario final, el mercado de pallets de madera se segmenta en alimentos y bebidas, productos farmacéuticos, productos químicos, comercio minorista, automoción y otros. El segmento de alimentos y bebidas dominó el mercado en 2025 debido al alto volumen de movimiento de productos envasados y perecederos. Los pallets son fundamentales para el almacenamiento y el transporte a través de las cadenas de frío. La demanda continua de los centros de procesamiento y distribución sustenta los volúmenes. El cumplimiento de las normas de higiene impulsa la sustitución frecuente. El fuerte consumo minorista sustenta el uso. Estos factores refuerzan el liderazgo del mercado.
Se prevé que el segmento farmacéutico crezca a su ritmo más rápido entre 2026 y 2033, impulsado por la expansión de la fabricación de productos sanitarios y la distribución global de medicamentos. Las cadenas de suministro reguladas requieren palés estandarizados y duraderos. El crecimiento de la logística con control de temperatura impulsa la demanda. El aumento de las exportaciones de productos médicos impulsa aún más su adopción. La importancia de la manipulación segura acelera el uso. Esto posiciona a los productos farmacéuticos como el segmento de usuario final de mayor crecimiento.
Análisis regional del mercado de palets de madera en Asia-Pacífico
- China dominó el mercado de pallets de madera con la mayor participación en los ingresos en 2025, impulsada por su vasta base manufacturera, altos volúmenes de exportación y extensas redes nacionales de logística y almacenamiento que respaldan la distribución de bienes industriales y de consumo.
- El fuerte crecimiento del comercio electrónico, la expansión de los servicios logísticos de terceros y el movimiento continuo de mercancías a través de puertos y sistemas de transporte interior refuerzan el liderazgo de China en la demanda de pallets en múltiples industrias.
- La presencia de grandes fabricantes nacionales de palés, la amplia actividad de reciclaje de palés y la sólida adopción por parte de los sectores de alimentación y bebidas, comercio minorista y manufactura continúan consolidando la posición dominante de China. Las inversiones continuas en parques logísticos inteligentes y soluciones estandarizadas de manejo de materiales fortalecen aún más la penetración en el mercado de los clústeres industriales.
Análisis del mercado de palets de madera en Japón
Se prevé que el mercado japonés de palets de madera crezca de forma sostenida entre 2026 y 2033, gracias a su infraestructura logística altamente organizada y a su gran énfasis en la eficiencia y los estándares de calidad. Los fabricantes y distribuidores japoneses confían en palets duraderos y estandarizados para facilitar la fabricación justo a tiempo y las operaciones de almacenamiento automatizadas. La creciente demanda de las industrias alimentaria, farmacéutica y electrónica mantiene un uso constante de palets. Las mejoras continuas en los sistemas de reutilización de palets y la optimización logística refuerzan el crecimiento estable del mercado. El enfoque de Japón en la precisión operativa y la fiabilidad de la cadena de suministro sustenta su sólido posicionamiento regional.
Perspectivas del mercado de palets de madera en India
Se proyecta que India registrará la tasa de crecimiento anual compuesta (TCAC) más rápida en el mercado de pallets de madera de Asia Pacífico durante el período 2026-2033, impulsada por la rápida expansión de los sectores manufacturero, minorista y de comercio electrónico, junto con un crecimiento significativo del almacenamiento organizado. La creciente adopción del transporte paletizado en las cadenas de suministro de alimentos y bebidas, productos farmacéuticos y automotrices está acelerando la demanda del mercado. Las inversiones en parques logísticos, infraestructura de cadena de frío y servicios logísticos de terceros están mejorando la penetración de pallets en todas las regiones. El aumento de las exportaciones y el creciente énfasis en la estandarización de la cadena de suministro impulsan aún más su adopción. Estos factores posicionan a India como el mercado de pallets de madera de más rápido crecimiento en la región de Asia Pacífico.
Cuota de mercado de palets de madera en Asia-Pacífico
La industria de palets de madera está liderada principalmente por empresas bien establecidas, entre las que se incluyen:
- Greif (Estados Unidos)
- UFP Industries, Inc. (EE. UU.)
- PALLETBIZ (Alemania)
- Grupo PGS (Francia)
- Paquete Vigidas de la UAB (Lituania)
- LOSCAM (Australia)
- Paletas JGD (Reino Unido)
- Palcon LLC (EE. UU.)
- Falkenhahn AG (Alemania)
- Carpintería Conquest (Reino Unido)
- Fabricantes de cajas y palets SandS (EE. UU.)
- Imperial Timber (Reino Unido)
- HG Timber Ltd. (Reino Unido)
- Johannesburg Timber and Box (Sudáfrica)
- Premier Pallets, Inc. (EE. UU.)
- Rowlinsons Packaging Ltd. (Reino Unido)
- Christies Industries (Reino Unido)
Últimos avances en el mercado de paletas de madera en Asia-Pacífico
- En julio de 2024, WestRock amplió su cartera de embalajes sostenibles al aumentar su capacidad de producción de pallets de madera con fibra reciclada, consolidando así su posición en soluciones logísticas ecológicas. Este desarrollo responde a la creciente demanda de las cadenas de suministro minoristas y alimentarias que buscan un menor impacto ambiental, a la vez que refuerza la competencia en torno a la oferta de pallets sostenibles e influye en las decisiones de compra de los grandes compradores.
- En septiembre de 2023, CHEP amplió su presencia en Asia con la apertura de un nuevo centro de distribución en Vietnam, lo que mejoró su capacidad para atender el creciente mercado logístico del Sudeste Asiático. Esta operación mejora la disponibilidad regional de pallets y reduce los plazos de transporte, lo que permite a CHEP fortalecer las relaciones con los clientes y obtener una ventaja competitiva en un centro logístico de alto crecimiento.
- En agosto de 2023, UFP Industries anunció el lanzamiento de una nueva gama de pallets ecológicos fabricados con materiales reciclados, que aborda directamente los crecientes requisitos de sostenibilidad en las cadenas de suministro industriales. Esta iniciativa posiciona a la empresa como líder en soluciones de pallets ambientalmente responsables, lo que ayuda a atraer clientes comprometidos con la sostenibilidad y apoya la expansión de su cuota de mercado a largo plazo.
- En julio de 2023, Kamps Pallets firmó una alianza estratégica con un importante proveedor de logística para optimizar la eficiencia de la cadena de suministro y el rendimiento de las entregas. Esta colaboración mejora la fiabilidad del servicio y los plazos de entrega, factores clave en el mercado de pallets de madera, lo que favorece una mayor retención de clientes y una mayor penetración en el mercado.
- En septiembre de 2022, ArbaBlox invirtió 51,34 millones de dólares en una planta de fabricación de bloques para palets en Winona, Misisipi, lo que marca su primera operación a gran escala de bloques de palets compuestos. Al aprovechar los residuos de aserradero, el proyecto fortalece el suministro sostenible de material para palets, a la vez que satisface la demanda de los servicios de alimentación y la industria. Con el respaldo de las autoridades estatales y locales, la planta mejora la capacidad de fabricación regional, impulsa la creación de empleo y consolida la transición hacia soluciones de palets de madera de ingeniería y compuesta en el mercado.
SKU-
Obtenga acceso en línea al informe sobre la primera nube de inteligencia de mercado del mundo

- Panel de análisis de datos interactivo
- Panel de análisis de empresas para oportunidades con alto potencial de crecimiento
- Acceso de analista de investigación para personalización y consultas
- Análisis de la competencia con panel interactivo
- Últimas noticias, actualizaciones y análisis de tendencias
- Aproveche el poder del análisis de referencia para un seguimiento integral de la competencia
Metodología de investigación
La recopilación de datos y el análisis del año base se realizan utilizando módulos de recopilación de datos con muestras de gran tamaño. La etapa incluye la obtención de información de mercado o datos relacionados a través de varias fuentes y estrategias. Incluye el examen y la planificación de todos los datos adquiridos del pasado con antelación. Asimismo, abarca el examen de las inconsistencias de información observadas en diferentes fuentes de información. Los datos de mercado se analizan y estiman utilizando modelos estadísticos y coherentes de mercado. Además, el análisis de la participación de mercado y el análisis de tendencias clave son los principales factores de éxito en el informe de mercado. Para obtener más información, solicite una llamada de un analista o envíe su consulta.
La metodología de investigación clave utilizada por el equipo de investigación de DBMR es la triangulación de datos, que implica la extracción de datos, el análisis del impacto de las variables de datos en el mercado y la validación primaria (experto en la industria). Los modelos de datos incluyen cuadrícula de posicionamiento de proveedores, análisis de línea de tiempo de mercado, descripción general y guía del mercado, cuadrícula de posicionamiento de la empresa, análisis de patentes, análisis de precios, análisis de participación de mercado de la empresa, estándares de medición, análisis global versus regional y de participación de proveedores. Para obtener más información sobre la metodología de investigación, envíe una consulta para hablar con nuestros expertos de la industria.
Personalización disponible
Data Bridge Market Research es líder en investigación formativa avanzada. Nos enorgullecemos de brindar servicios a nuestros clientes existentes y nuevos con datos y análisis que coinciden y se adaptan a sus objetivos. El informe se puede personalizar para incluir análisis de tendencias de precios de marcas objetivo, comprensión del mercado de países adicionales (solicite la lista de países), datos de resultados de ensayos clínicos, revisión de literatura, análisis de mercado renovado y base de productos. El análisis de mercado de competidores objetivo se puede analizar desde análisis basados en tecnología hasta estrategias de cartera de mercado. Podemos agregar tantos competidores sobre los que necesite datos en el formato y estilo de datos que esté buscando. Nuestro equipo de analistas también puede proporcionarle datos en archivos de Excel sin procesar, tablas dinámicas (libro de datos) o puede ayudarlo a crear presentaciones a partir de los conjuntos de datos disponibles en el informe.

