

Asia Pacific Inorganic Scintillators Market
Tamaño del mercado en miles de millones de dólares
Tasa de crecimiento anual compuesta (CAGR) :
% 
 USD
97.20 Billion
USD
202.37 Billion
2025
2033
USD
97.20 Billion
USD
202.37 Billion
2025
2033
| 2026 –2033 | |
| USD 97.20 Billion | |
| USD 202.37 Billion | |
| % | |
|
Segmentación del mercado de centelleadores inorgánicos de Asia-Pacífico, por material de centelleo (yoduro de sodio [NAI], yoduro de cesio (CSI), oxiortosilicato de lutecio (LSO) y oxiortosilicato de lutecio-itrio (LYSO), germanato de bismuto (BGO), fluoruro de bario, tungstato de plomo (PBWO₄), tungstato de cadmio (CDWO₄), bromuro de cerio (CEBR₃), bromuro de lantano (LABR₃), ortosilicato de gadolinio (GSO), granate de itrio y aluminio YAG (CE), oxisulfuro de gadolinio (GOS) y otros materiales de centelleo), tipo (haluros alcalinos, compuestos de óxido y metales de tierras raras), aplicación (imagenología médica, medicina nuclear, radioprotección, exploración petrolera, industria de procesos, ciencias de la vida y otros), usuario final (asistencia sanitaria, seguridad nacional y defensa, centrales nucleares, industria Aplicaciones y otros), - Tendencias de la industria y pronóstico hasta 2033
Tamaño del mercado de centelleadores inorgánicos en Asia-Pacífico
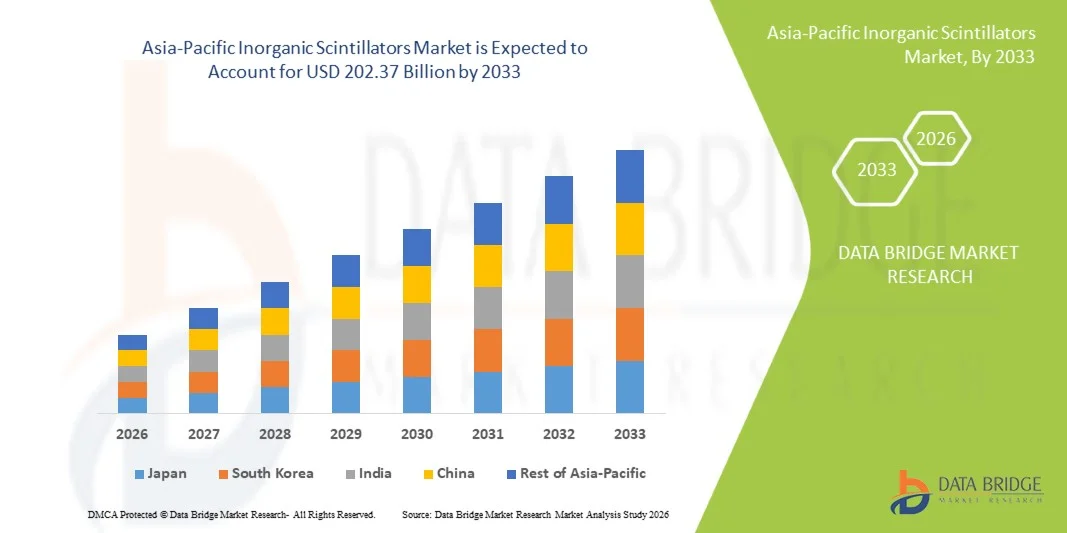
- El tamaño del mercado de centelleadores inorgánicos de Asia-Pacífico se valoró en USD 97,20 mil millones en 2025 y se espera que alcance los USD 202,37 mil millones para 2033 , con una CAGR del 9,60% durante el período de pronóstico.
- El crecimiento del mercado se debe en gran medida a la creciente demanda de tecnologías avanzadas de detección e imágenes de radiación, impulsadas por el progreso tecnológico en medicina nuclear, imágenes médicas, seguridad nacional e investigación en física de alta energía, lo que lleva a una mayor adopción de centelleadores inorgánicos en aplicaciones de atención médica, defensa e industriales.
- Además, la creciente demanda de materiales de detección de alto rendimiento, duraderos y precisos con una emisión de luz superior, un tiempo de respuesta rápido y estabilidad está consolidando los centelleadores inorgánicos como la solución preferida para los sistemas de medición de radiación e imagen. Estos factores convergentes están acelerando la adopción de soluciones de centelleadores inorgánicos, impulsando así significativamente el crecimiento general del mercado.
Análisis del mercado de centelleadores inorgánicos en Asia-Pacífico
- Los centelleadores inorgánicos, que convierten la radiación de alta energía en señales de luz visible, son componentes críticos de los sistemas de detección de radiación e imágenes utilizados en diagnósticos médicos, medicina nuclear, seguridad nacional, física de alta energía e inspección industrial debido a su alto rendimiento lumínico, resolución energética y estabilidad a largo plazo.
- La creciente demanda de centelleadores inorgánicos se debe principalmente al uso cada vez mayor de modalidades avanzadas de imágenes médicas, las crecientes inversiones en energía nuclear y monitoreo de radiación, y los crecientes requisitos de control de seguridad, junto con las continuas innovaciones en materiales que mejoran la eficiencia y el rendimiento de la detección.
- China dominó el mercado de centelleadores inorgánicos de Asia y el Pacífico con la mayor participación en los ingresos de aproximadamente el 39,4 % en 2025, respaldada por fuertes inversiones gubernamentales en energía nuclear e infraestructura de imágenes médicas, una rápida expansión de las capacidades de fabricación de detectores nacionales, una alta adopción en radiografía industrial y la presencia de importantes productores regionales que abastecen los mercados locales y globales.
- Se espera que India sea el país de más rápido crecimiento en el mercado de centelleadores inorgánicos de Asia y el Pacífico durante el período de pronóstico, impulsado por el aumento del gasto en atención médica, el aumento de la implementación de sistemas de diagnóstico por imágenes, el crecimiento de los programas de investigación nuclear, la expansión de las actividades de inspección industrial y las iniciativas gubernamentales de apoyo que promueven la fabricación nacional.
- El segmento de haluros alcalinos representó la mayor participación en los ingresos del mercado, con un 41,8 %, en 2025, impulsado por el uso generalizado de centelleadores de NaI y CsI.
Alcance del informe y segmentación del mercado de centelleadores inorgánicos en Asia-Pacífico
|
Atributos |
Perspectivas clave del mercado de centelleadores inorgánicos en Asia-Pacífico |
|
Segmentos cubiertos |
|
|
Países cubiertos |
Asia-Pacífico
|
|
Actores clave del mercado |
|
|
Oportunidades de mercado |
|
|
Conjuntos de información de datos de valor añadido |
Además de los conocimientos sobre escenarios de mercado, como el valor de mercado, la tasa de crecimiento, la segmentación, la cobertura geográfica y los principales actores, los informes de mercado seleccionados por Data Bridge Market Research también incluyen un análisis en profundidad de expertos, epidemiología de pacientes, análisis de la cartera de productos, análisis de precios y marco regulatorio. |
Tendencias del mercado de centelleadores inorgánicos en Asia-Pacífico
Creciente demanda de aplicaciones avanzadas de detección de radiación e imágenes médicas
- Una tendencia significativa y en aceleración en el mercado de centelleadores inorgánicos de Asia y el Pacífico es la creciente demanda de materiales de centelleo de alto rendimiento impulsada por la expansión de las aplicaciones en imágenes médicas, medicina nuclear, monitoreo de radiación e investigación en física de alta energía.
- El uso creciente de centelleadores inorgánicos en escáneres PET, sistemas de TC, cámaras gamma y equipos de control de seguridad está transformando la innovación de materiales en toda la región.
- Por ejemplo, la creciente instalación de sistemas PET-CT en hospitales de China, Japón y Corea del Sur ha incrementado la demanda de centelleadores basados en lutecio, como LYSO y LSO, que ofrecen una alta salida de luz, tiempos de desintegración rápidos y una excelente resolución energética necesaria para obtener imágenes de diagnóstico precisas.
- Los avances en las tecnologías de crecimiento de cristales y la ingeniería de materiales permiten a los fabricantes producir centelleadores con mayor densidad, dureza de la radiación y claridad óptica. Estas mejoras son cruciales para optimizar la calidad de imagen y la precisión de detección en aplicaciones médicas e industriales.
- Además, la creciente adopción de centelleadores inorgánicos en la seguridad nacional, el monitoreo de la radiación ambiental y las instalaciones de energía nuclear está expandiendo su uso más allá de la atención médica, particularmente en países que invierten fuertemente en energía nuclear e infraestructura de seguridad radiológica.
- Esta tendencia hacia materiales de centelleo de alta eficiencia y específicos para cada aplicación está impulsando continuos esfuerzos de I+D entre fabricantes regionales e instituciones de investigación, posicionando a Asia-Pacífico como un centro clave para el desarrollo de centelleadores inorgánicos de próxima generación.
- Se espera que la creciente necesidad de sistemas de detección confiables y de alta resolución en múltiples sectores de uso final sostenga la demanda a largo plazo de materiales centelleadores inorgánicos avanzados en la región.
Dinámica del mercado de centelleadores inorgánicos en Asia-Pacífico
Conductor
Creciente demanda de imágenes médicas, medicina nuclear y monitoreo de radiación
- La creciente prevalencia de enfermedades crónicas, cáncer y trastornos neurológicos, junto con la expansión de la infraestructura de diagnóstico por imágenes, es un impulsor importante del mercado de centelleadores inorgánicos de Asia y el Pacífico.
- Por ejemplo, los programas de modernización de la atención sanitaria dirigidos por los gobiernos en China y la India han llevado a un aumento constante en el número de centros de diagnóstico por imágenes, lo que ha impulsado significativamente la demanda de centelleadores utilizados en los sistemas de imágenes PET, SPECT y CT.
- El creciente número de procedimientos de medicina nuclear, incluidos el diagnóstico del cáncer y la planificación de la radioterapia, está incrementando aún más la demanda de centelleadores inorgánicos de alto rendimiento con una eficiencia de detección y estabilidad superiores.
- Además, las crecientes inversiones en generación de energía nuclear y programas de seguridad radiológica en países como China, Japón y Corea del Sur están impulsando la adopción de centelleadores en sistemas de control y monitoreo de la radiación.
- La expansión de las instalaciones de investigación científica, los laboratorios de física de partículas y las aplicaciones de pruebas industriales no destructivas también están contribuyendo al crecimiento sostenido del mercado.
- En conjunto, estos factores están acelerando el despliegue de centelleadores inorgánicos en los sectores de atención médica, energía, investigación e industria en toda la región de Asia y el Pacífico.
Restricción/Desafío
“ Altos costos de fabricación y complejidad de los materiales ”
- El alto costo asociado con la producción de centelleadores inorgánicos plantea un desafío significativo para la expansión del mercado, en particular para aplicaciones sensibles a los precios y economías emergentes.
- Por ejemplo, los centelleadores como LYSO y BGO requieren procesos complejos de crecimiento de cristales y elementos de tierras raras, que aumentan los costos de las materias primas y limitan la asequibilidad a gran escala.
- La necesidad de condiciones de fabricación precisas, ciclos de producción largos y experiencia técnica especializada aumentan aún más los gastos generales de producción, lo que afecta la competitividad de los precios.
- Además, las limitaciones de la cadena de suministro relacionadas con los materiales de tierras raras y la dependencia de fuentes limitadas pueden generar volatilidad de precios y problemas de disponibilidad.
- Estos desafíos de costo y complejidad pueden restringir la adopción en instalaciones de atención médica de bajo presupuesto y aplicaciones industriales donde se pueden considerar tecnologías de detección alternativas.
- Abordar estas restricciones a través de la innovación de materiales, técnicas de síntesis rentables y fabricación localizada será fundamental para mejorar la accesibilidad y sostener el crecimiento del mercado a largo plazo en el mercado de centelleadores inorgánicos de Asia y el Pacífico.
Análisis del mercado de centelleadores inorgánicos en Asia-Pacífico
El mercado está segmentado según el material de centelleo, el tipo, la aplicación y el usuario final.
• Por material de centelleo
Sobre la base del material de centelleo, el mercado de centelleadores inorgánicos de Asia-Pacífico está segmentado en yoduro de sodio (NaI), yoduro de cesio (CsI), oxiortosilicato de lutecio (LSO) y oxiortosilicato de lutecio-itrio (LYSO), germanato de bismuto (BGO), fluoruro de bario, tungstato de plomo (PbWO₄), tungstato de cadmio (CdWO₄), bromuro de cerio (CeBr₃), bromuro de lantano (LaBr₃), ortosilicato de gadolinio (GSO), granate de itrio y aluminio (YAG:Ce), oxisulfuro de gadolinio (GOS) y otros. El segmento de yoduro de sodio (NaI) dominó la mayor participación de ingresos del mercado del 34,6% en 2025, impulsado por su uso de larga data en aplicaciones de detección de radiación e imágenes médicas. Los centelleadores de NaI ofrecen una alta potencia lumínica y una excelente relación calidad-precio, lo que los convierte en los preferidos en gammacámaras y diagnósticos de medicina nuclear. Su facilidad de fabricación y disponibilidad respaldan aún más su adopción generalizada. Los detectores de NaI se utilizan ampliamente en hospitales y laboratorios de investigación. La fuerte demanda de seguridad nacional para la monitorización de la radiación impulsa su uso. La compatibilidad con los sistemas de detección existentes mejora la penetración en el mercado. La aceptación regulatoria consolidada respalda una demanda sostenida. La alta sensibilidad mejora la precisión de las imágenes. Su amplio alcance de aplicación refuerza su posición dominante. Las mejoras continuas en el crecimiento de cristales mejoran el rendimiento. La amplia base instalada mantiene una demanda recurrente. Estos factores, en conjunto, sustentan el liderazgo del mercado.
Se prevé que el segmento de bromuro de lantano (LaBr₃) experimente la tasa de crecimiento anual compuesta (TCAC) más rápida, del 8,9 %, entre 2026 y 2033, impulsada por una resolución energética superior y un tiempo de respuesta más rápido. Los centelleadores de LaBr₃ se adoptan cada vez más en espectroscopia nuclear avanzada y sistemas de imágenes médicas de alta gama. La creciente demanda de detección precisa de radiación respalda el crecimiento. Los avances tecnológicos han reducido el ruido de fondo intrínseco, mejorando la fiabilidad. La creciente adopción en aplicaciones de seguridad nacional impulsa la demanda. La expansión de las instalaciones de investigación nuclear impulsa su adopción. El mayor uso en la exploración petrolera acelera aún más el crecimiento. Un mayor rendimiento en comparación con los centelleadores tradicionales impulsa la preferencia. Las crecientes inversiones en tecnologías de diagnóstico avanzadas respaldan la expansión. El aumento de la financiación para la seguridad nuclear mejora la adopción. Las economías emergentes están adoptando centelleadores de alto rendimiento rápidamente. Estos factores, en conjunto, impulsan un fuerte crecimiento de la TCAC.
• Por tipo
Según el tipo, el mercado de centelleadores inorgánicos de Asia-Pacífico se segmenta en haluros alcalinos, compuestos de óxido y metales de tierras raras. El segmento de haluros alcalinos representó la mayor cuota de mercado en ingresos, con un 41,8%, en 2025, impulsado por el uso generalizado de centelleadores de NaI y CsI. Estos materiales ofrecen una alta eficiencia de centelleo y costes de producción relativamente bajos. Los haluros alcalinos se utilizan ampliamente en imágenes médicas y detección de radiación. Su compatibilidad con los tubos fotomultiplicadores facilita su adopción. Su alto rendimiento lumínico mejora la sensibilidad de detección. Los procesos de fabricación consolidados mejoran la consistencia del suministro. Su sólida presencia en medicina nuclear refuerza su dominio. El aumento de los procedimientos de diagnóstico por imagen impulsa la demanda. Los laboratorios de investigación prefieren los haluros alcalinos para espectroscopia. La disponibilidad en múltiples formas cristalinas aumenta la versatilidad. Las mejoras continuas de los productos sustentan la demanda. En general, la rentabilidad y el rendimiento impulsan su dominio.
Se espera que el segmento de metales de tierras raras experimente la tasa de crecimiento anual compuesta (TCAC) más rápida, del 9,4 %, entre 2026 y 2033, impulsada por la creciente demanda de centelleadores de alto rendimiento. Materiales como LYSO y LaBr₃ ofrecen una resolución superior y tiempos de desintegración más rápidos. La creciente adopción de sistemas de imágenes PET impulsa el crecimiento. La expansión del diagnóstico oncológico impulsa la demanda. La innovación tecnológica mejora la pureza y la eficiencia de los cristales. El aumento de las inversiones en tecnologías avanzadas de imagen acelera la adopción. El crecimiento de la investigación en física nuclear impulsa su uso. Una mayor sensibilidad mejora los resultados clínicos. El aumento de la financiación gubernamental para infraestructura médica impulsa la demanda. La expansión de la investigación en física de partículas impulsa aún más el crecimiento. La fuerte preferencia por materiales de alto rendimiento impulsa la TCAC. Estos factores, en conjunto, impulsan una rápida expansión.
• Por aplicación
Según su aplicación, el mercado de centelleadores inorgánicos de Asia-Pacífico se segmenta en imagenología médica, medicina nuclear, radioprotección, exploración petrolera, industria de procesos, ciencias de la vida, entre otros. El segmento de imagenología médica dominó el mercado con una participación en los ingresos del 38,9 % en 2025, impulsado por el uso generalizado de centelleadores en escáneres CT, PET y gammacámaras. La creciente prevalencia del cáncer y las enfermedades crónicas impulsa la demanda de imágenes. Los centelleadores desempeñan un papel fundamental en la precisión diagnóstica. La creciente adopción de modalidades avanzadas de imagenología respalda este dominio. Las mejoras tecnológicas mejoran la resolución de la imagen. La expansión de la infraestructura sanitaria impulsa la instalación de sistemas de imagenología. El alto volumen de pacientes aumenta la utilización de equipos. Los sólidos marcos de reembolso en las regiones desarrolladas impulsan el crecimiento. La integración con sistemas de imagenología digital mejora la eficiencia. La innovación continua de productos mejora los resultados clínicos. El envejecimiento creciente de la población impulsa la demanda de diagnóstico. Estos factores sustentan el liderazgo.
Se proyecta que el segmento de medicina nuclear crecerá a la tasa de crecimiento anual compuesta (TCAC) más rápida, del 8,6 %, entre 2026 y 2033, impulsada por el creciente uso de radiofármacos. La creciente demanda de diagnósticos y terapias dirigidas respalda el crecimiento. Los centelleadores son esenciales para la detección de radiación y la obtención de imágenes. La expansión de los departamentos de medicina nuclear impulsa la demanda de equipos. Los avances tecnológicos mejoran la sensibilidad de la detección. La creciente concienciación sobre la detección temprana de enfermedades acelera la adopción. El aumento de los programas de detección del cáncer respalda el crecimiento. La creciente inversión en infraestructura de atención médica nuclear impulsa la expansión. Las aprobaciones regulatorias favorables impulsan la adopción en el mercado. El creciente uso en teranósticos aumenta la demanda. Los mercados emergentes muestran un fuerte potencial de adopción. Estas tendencias, en conjunto, impulsan un alto crecimiento de la TCAC.
• Por el usuario final
En función del usuario final, el mercado de centelleadores inorgánicos de Asia-Pacífico se segmenta en atención médica, seguridad nacional y defensa, centrales nucleares, aplicaciones industriales y otros. El segmento de atención médica registró la mayor participación en los ingresos del mercado, con un 36,2 % en 2025, impulsado por el amplio uso de centelleadores en diagnóstico por imagen y medicina nuclear. Los hospitales y centros de diagnóstico dependen en gran medida de los detectores de centelleo. El aumento del gasto en atención médica impulsa la modernización de los equipos. El aumento del volumen de procedimientos de diagnóstico por imagen impulsa la demanda. Los avances tecnológicos mejoran la eficiencia clínica. El sólido respaldo regulatorio para la imagen médica impulsa su adopción. La expansión de los centros de tratamiento oncológico impulsa la demanda. El envejecimiento de la población aumenta las necesidades de diagnóstico. El alto enfoque en la detección temprana de enfermedades fortalece su uso. La integración con plataformas avanzadas de diagnóstico por imagen refuerza el dominio. La innovación continua mejora la fiabilidad del rendimiento. Estos factores sustentan el liderazgo en atención médica.
Se espera que el segmento de seguridad nacional y defensa registre la tasa de crecimiento anual compuesta (TCAC) más rápida, del 9,1 %, entre 2026 y 2033, impulsada por la creciente preocupación por las amenazas nucleares. Los gobiernos están invirtiendo fuertemente en sistemas de detección de radiación. Los centelleadores son cruciales para la seguridad y vigilancia fronteriza. El creciente despliegue en puertos y aeropuertos impulsa la demanda. Los avances tecnológicos mejoran la precisión de la detección. El aumento de los presupuestos de defensa apoya las adquisiciones. La expansión de los programas de monitoreo nuclear impulsa su adopción. Las crecientes tensiones geopolíticas incrementan las inversiones en seguridad. Los sistemas de detección portátiles mejoran la eficiencia operativa. El aumento de los programas de capacitación impulsa el uso de equipos. Las economías emergentes están fortaleciendo la infraestructura de seguridad. Estos factores, en conjunto, impulsan un rápido crecimiento del mercado.
Análisis regional del mercado de centelleadores inorgánicos en Asia-Pacífico
- Se prevé que el mercado de centelleadores inorgánicos en Asia-Pacífico crezca a la tasa de crecimiento anual compuesta (TCAC) más alta durante el período de pronóstico de 2026 a 2033, impulsado por el aumento de las inversiones en infraestructura sanitaria, la expansión de los programas de energía nuclear, la creciente demanda de sistemas de imágenes médicas y el crecimiento de las aplicaciones en la inspección industrial y el control de seguridad en toda la región. Países como China, India y Japón están experimentando una fuerte adopción de centelleadores inorgánicos gracias a los avances en las tecnologías de detección de radiación y la expansión de las industrias de uso final.
- El uso creciente de centelleadores inorgánicos en aplicaciones de diagnóstico por imágenes, como los sistemas PET, CT y SPECT, está impulsando significativamente la demanda, ya que los proveedores de atención médica buscan materiales detectores de alta resolución, confiables y de respuesta rápida para mejorar la precisión del diagnóstico y los resultados de los pacientes.
- Además, el surgimiento de Asia-Pacífico como centro mundial de fabricación de equipos de detección de radiación y componentes de detectores está apoyando el crecimiento del mercado, apoyado por iniciativas gubernamentales que promueven la producción nacional, la autosuficiencia tecnológica y la fabricación orientada a la exportación de materiales de centelleo avanzados.
Análisis del mercado de centelleadores inorgánicos en China y Asia-Pacífico
El mercado chino de centelleadores inorgánicos en Asia-Pacífico dominó el mercado de centelleadores inorgánicos en la región, con la mayor participación en los ingresos, de aproximadamente el 39,4 % en 2025, gracias a las sólidas inversiones gubernamentales en energía nuclear, infraestructura de imágenes médicas y sistemas de seguridad radiológica. La rápida expansión de la capacidad nacional de fabricación de detectores y cristales ha permitido la adopción generalizada de centelleadores inorgánicos en aplicaciones de medicina nuclear, radiografía industrial, seguridad nacional e investigación científica. Las iniciativas nacionales centradas en el fortalecimiento de la capacidad de energía nuclear, la expansión del diagnóstico del cáncer y la mejora de los estándares de inspección industrial han acelerado la demanda de materiales de centelleo de alto rendimiento. Además, la presencia de importantes productores regionales que abastecen tanto al mercado nacional como al internacional ha fortalecido el liderazgo de China, ya que los fabricantes locales ofrecen soluciones de centelleo competitivas en costos y tecnológicamente avanzadas.
Análisis del mercado de centelleadores inorgánicos en India y Asia-Pacífico
Se espera que el mercado de centelleadores inorgánicos de la región Asia-Pacífico de India sea el de mayor crecimiento durante el período de pronóstico, impulsado por el aumento del gasto en atención médica, el creciente despliegue de sistemas de diagnóstico por imagen y la expansión de la investigación nuclear y los programas de generación de energía. La creciente adopción de escáneres PET y CT en hospitales públicos y privados está generando una demanda sostenida de materiales de centelleo inorgánico con mayor eficiencia y durabilidad. Además, la expansión de las actividades de inspección industrial en sectores como el petróleo y el gas, la industria aeroespacial y la manufactura está impulsando el crecimiento del mercado. Las iniciativas gubernamentales de apoyo que promueven la fabricación nacional bajo programas como Make in India, junto con las inversiones en instituciones de investigación científica e infraestructura de detección de radiación, están mejorando aún más el acceso a tecnologías avanzadas de centelleo, posicionando a la India como un mercado de alto crecimiento en la región.
Cuota de mercado de centelleadores inorgánicos en Asia-Pacífico
La industria de centelleadores inorgánicos está liderada principalmente por empresas bien establecidas, entre las que se incluyen:
- Saint-Gobain (Francia)
- Hamamatsu Photonics (Japón)
- Hitachi Metals (Japón)
- CRYTUR (República Checa)
- AMCRYS-H (Ucrania)
- Scionix (Países Bajos)
- Materiales de cristal Kinheng (China)
- Corporación de Alta Tecnología SICCAS de Shanghái (China)
- Cristal épico (China)
- Espectros Alfa (EE. UU.)
- Componentes Rexon y sistemas TLD (EE. UU.)
- Detec (Alemania)
- Scintacor (Reino Unido)
- Proteus Inc. (EE. UU.)
- Toshiba Materials (Japón)
- Oxide Corporation (Japón)
- Eljen Technology (EE. UU.)
- Teledyne Judson Technologies (EE. UU.)
- Zecotek Photonics (Canadá)
Últimos avances en el mercado de centelleadores inorgánicos en Asia-Pacífico
- En marzo de 2023, Thales Group firmó una asociación estratégica con una importante empresa de tecnología médica para desarrollar sistemas de imágenes médicas de última generación utilizando centelleadores inorgánicos avanzados, combinando la experiencia en detección de radiación e imágenes de diagnóstico para mejorar el rendimiento del diagnóstico en la atención médica.
- En septiembre de 2023, Tibidabo Scientific Industries completó la adquisición de LLA Instruments, ampliando su cartera con tecnologías avanzadas de detección e identificación de materiales que incluyen detectores basados en centelleadores inorgánicos para aplicaciones científicas e industriales.
- En marzo de 2025, Saint-Gobain lanzó una nueva línea de centelleadores inorgánicos de alto rendimiento diseñados específicamente para aplicaciones de imágenes médicas, que ofrecen un rendimiento lumínico mejorado y un tiempo de respuesta más rápido para respaldar los sistemas de diagnóstico PET y SPECT avanzados.
- En febrero de 2025, Hamamatsu Photonics presentó una nueva serie de centelleadores inorgánicos destinados a la detección de radiación industrial con una resolución y eficiencia energética mejoradas, lo que demuestra una innovación continua en materiales de centelleo para los mercados de atención médica y seguridad.
- En enero de 2025, Mirion Technologies lanzó una nueva gama de detectores de centelleo que enfatizan los usos de seguridad nuclear y defensa nacional, lo que refleja una adopción más amplia de la tecnología de centelleador inorgánico en los sectores de seguridad y protección.
SKU-
Obtenga acceso en línea al informe sobre la primera nube de inteligencia de mercado del mundo

- Panel de análisis de datos interactivo
- Panel de análisis de empresas para oportunidades con alto potencial de crecimiento
- Acceso de analista de investigación para personalización y consultas
- Análisis de la competencia con panel interactivo
- Últimas noticias, actualizaciones y análisis de tendencias
- Aproveche el poder del análisis de referencia para un seguimiento integral de la competencia
Metodología de investigación
La recopilación de datos y el análisis del año base se realizan utilizando módulos de recopilación de datos con muestras de gran tamaño. La etapa incluye la obtención de información de mercado o datos relacionados a través de varias fuentes y estrategias. Incluye el examen y la planificación de todos los datos adquiridos del pasado con antelación. Asimismo, abarca el examen de las inconsistencias de información observadas en diferentes fuentes de información. Los datos de mercado se analizan y estiman utilizando modelos estadísticos y coherentes de mercado. Además, el análisis de la participación de mercado y el análisis de tendencias clave son los principales factores de éxito en el informe de mercado. Para obtener más información, solicite una llamada de un analista o envíe su consulta.
La metodología de investigación clave utilizada por el equipo de investigación de DBMR es la triangulación de datos, que implica la extracción de datos, el análisis del impacto de las variables de datos en el mercado y la validación primaria (experto en la industria). Los modelos de datos incluyen cuadrícula de posicionamiento de proveedores, análisis de línea de tiempo de mercado, descripción general y guía del mercado, cuadrícula de posicionamiento de la empresa, análisis de patentes, análisis de precios, análisis de participación de mercado de la empresa, estándares de medición, análisis global versus regional y de participación de proveedores. Para obtener más información sobre la metodología de investigación, envíe una consulta para hablar con nuestros expertos de la industria.
Personalización disponible
Data Bridge Market Research es líder en investigación formativa avanzada. Nos enorgullecemos de brindar servicios a nuestros clientes existentes y nuevos con datos y análisis que coinciden y se adaptan a sus objetivos. El informe se puede personalizar para incluir análisis de tendencias de precios de marcas objetivo, comprensión del mercado de países adicionales (solicite la lista de países), datos de resultados de ensayos clínicos, revisión de literatura, análisis de mercado renovado y base de productos. El análisis de mercado de competidores objetivo se puede analizar desde análisis basados en tecnología hasta estrategias de cartera de mercado. Podemos agregar tantos competidores sobre los que necesite datos en el formato y estilo de datos que esté buscando. Nuestro equipo de analistas también puede proporcionarle datos en archivos de Excel sin procesar, tablas dinámicas (libro de datos) o puede ayudarlo a crear presentaciones a partir de los conjuntos de datos disponibles en el informe.

