
Mercado de pantallas industriales de Asia-Pacífico, por tipo (pantallas resistentes, monitores de marco abierto, pantalla multitáctil (P-Cap), pantalla frontal, pantalla USB tipo C, pantalla SDI, pantalla de montaje trasero, monitores de montaje en panel , pantallas marinas, videowalls, otros), tamaño del panel (hasta 14 pulgadas, de 14 pulgadas a 21 pulgadas, de 21 a 40 pulgadas, de 40 pulgadas y más), tecnología (LCD, LED, OLED, pantalla de papel electrónico), tipo de comunicación (serie, Ethernet, red móvil, comunicación industrial, RF/Zigbee/IR, Jason/MQTT, otros), aplicación (HMI, aplicación remota, pantalla interactiva, señalización digital, imágenes), vertical (fabricación, energía y electricidad, militar y aviónica, petróleo y gas, metales y minería, transporte, otros), país (China, India, Japón, Corea del Sur, Australia, Singapur, Indonesia, Tailandia, Malasia, Filipinas, resto de Asia-Pacífico) Tendencias de la industria y pronóstico 2028
 Análisis y perspectivas del mercado: mercado de pantallas industriales de Asia y el Pacífico
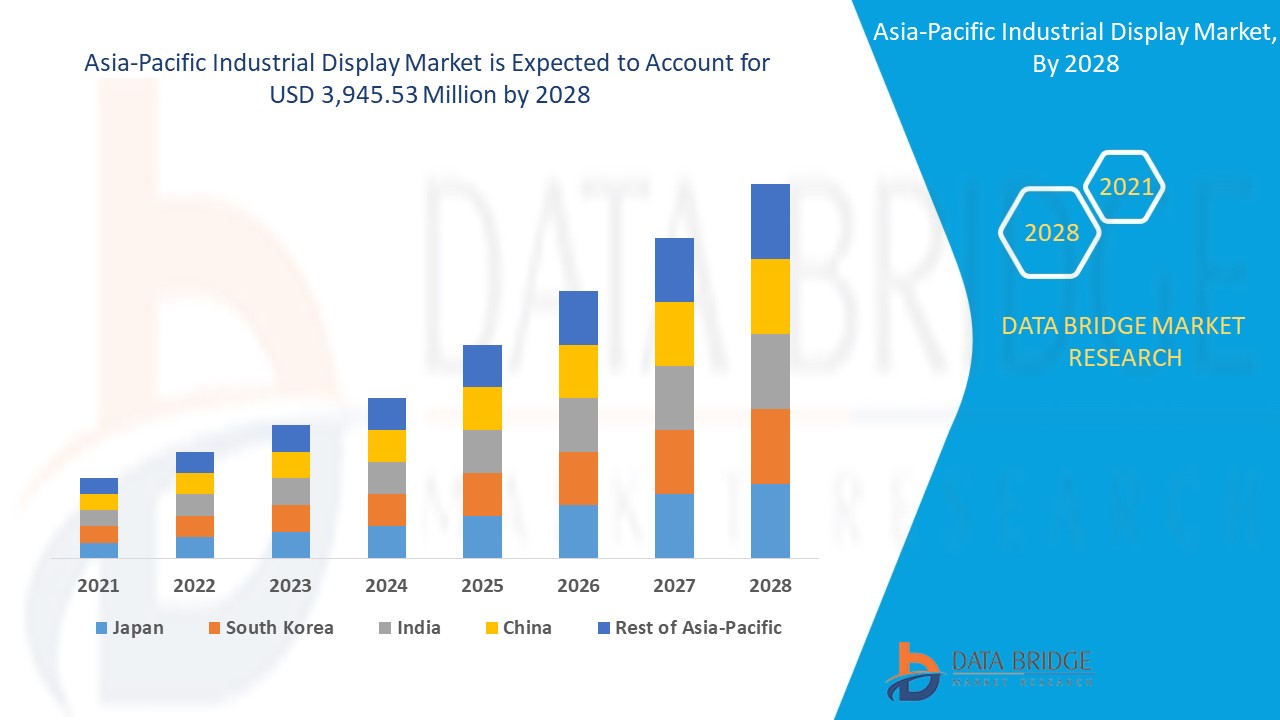
Se espera que el mercado de pantallas industriales gane crecimiento de mercado en el período de pronóstico de 2021 a 2028. Data Bridge Market Research analiza que el mercado está creciendo con una CAGR del 7,1% en el período de pronóstico de 2021 a 2028 y se espera que alcance los USD 3.945,53 millones para 2028. La aparición de varios desarrollos tecnológicos y procesos automatizados en las industrias son los principales factores que impulsan el crecimiento del mercado de pantallas industriales.
Un sistema de visualización industrial es un conjunto de máquinas que se utilizan para mostrar resultados digitales. Estas máquinas incluyen diferentes tipos de pantallas TFT, monitores, señalización digital y equipos similares. Los monitores o pantallas industriales están diseñados para una mayor durabilidad y para soportar condiciones ambientales adversas, como temperaturas extremas, humedad, polvo, suciedad y otras en aplicaciones industriales y comerciales.
La creciente demanda de aplicaciones de interfaz hombre-máquina (HMI) en las industrias de fabricación y de procesos está impulsando el crecimiento del mercado de pantallas industriales. Se requieren altas inversiones para la instalación de pantallas/paneles industriales que pueden obstaculizar el crecimiento de este mercado. La creciente demanda de aplicaciones de señalización digital en las industrias para mostrar la información necesaria está creando oportunidades para el mercado de pantallas industriales. La dependencia de los fabricantes de varios proveedores para el suministro de equipos y componentes es uno de los mayores desafíos para el mercado de pantallas industriales.
Este informe sobre el mercado de pantallas industriales proporciona detalles de la participación de mercado, nuevos desarrollos y análisis de la cartera de productos, el impacto de los actores del mercado nacional y localizado, analiza las oportunidades en términos de bolsas de ingresos emergentes, cambios en las regulaciones del mercado, aprobaciones de productos, decisiones estratégicas, lanzamientos de productos, expansiones geográficas e innovaciones tecnológicas en el mercado. Para comprender el análisis y el escenario del mercado de pantallas industriales, comuníquese con Data Bridge Market Research para obtener un informe de analista; nuestro equipo lo ayudará a crear una solución de impacto en los ingresos para lograr su objetivo deseado.
 Alcance y tamaño del mercado de pantallas industriales
El mercado de pantallas industriales está segmentado en función del tipo, tamaño del panel, tecnología, tipo de comunicación, aplicación y vertical. El crecimiento entre segmentos le ayuda a analizar nichos de crecimiento y estrategias para abordar el mercado y determinar sus áreas de aplicación principales y la diferencia en sus mercados objetivo.
- Según el tipo, el mercado de pantallas industriales se segmenta en pantallas resistentes, monitores de marco abierto, pantallas multitáctiles (P-cap), pantallas frontales, pantallas USB tipo C, pantallas SDI, pantallas de montaje trasero, monitores de montaje en panel, pantallas marinas, videowalls y otros. En 2021, el segmento de pantallas resistentes tiene la mayor participación de mercado en el mercado de pantallas industriales, ya que ofrece muchas soluciones diferentes para entornos de trabajo muy hostiles y condiciones donde el uso rudo de la tecnología es la norma.
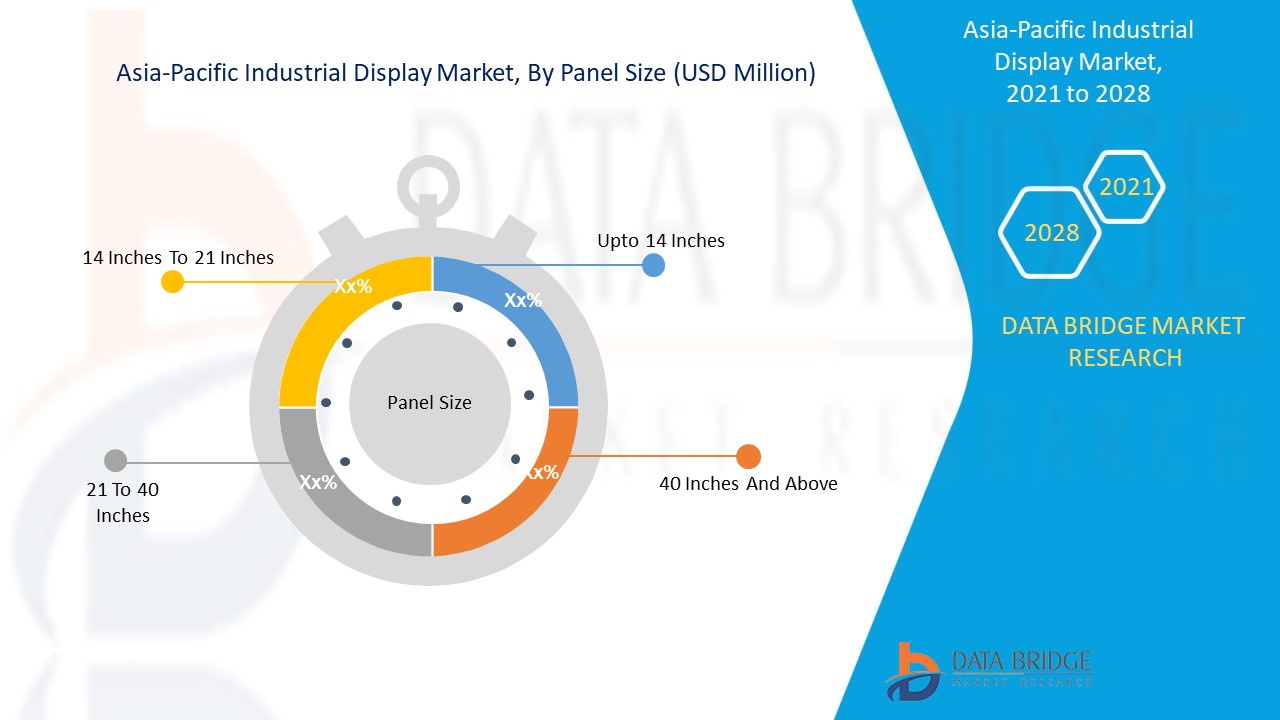
- En función del tamaño del panel, el mercado de pantallas industriales se segmenta en hasta 14 pulgadas, de 14 pulgadas a 21 pulgadas, de 21 a 40 pulgadas y de 40 pulgadas o más. En 2021, el segmento de hasta 14 pulgadas tiene la mayor participación de mercado en el mercado de pantallas industriales, ya que se espera que estos componentes se utilicen cada vez más en pequeños dispositivos electrónicos como relojes inteligentes, tabletas y computadoras portátiles.
- En función de la tecnología, el mercado de pantallas industriales se segmenta en pantallas LCD, LED, OLED y de papel electrónico. En 2021, la tecnología LCD tiene la mayor participación de mercado en el mercado de pantallas industriales, ya que las pantallas LCD han ganado aceptación debido a sus propiedades avanzadas que incluyen menor consumo de energía, tamaño compacto y bajo precio.
- Según el tipo de comunicación, el mercado de pantallas industriales se segmenta en serie, Ethernet, red móvil, comunicación industrial , RF/Zigbee/IR, Jason/MQTT y otros. En 2021, el segmento serie tiene la mayor participación de mercado en el mercado de pantallas industriales, ya que la comunicación serie es un método de comunicación que utiliza una o dos líneas de transmisión para enviar y recibir datos y esos datos se envían y reciben continuamente un bit a la vez.
- En función de la aplicación, el mercado de pantallas industriales se segmenta en HMI, aplicaciones remotas, pantallas interactivas, señalización digital e imágenes. En 2021, el segmento HMI tiene la mayor participación de mercado en el mercado de pantallas industriales debido a la creciente adopción de la automatización industrial en las industrias de fabricación, petróleo y gas y procesos.
- En función de la vertical, el mercado de pantallas industriales se segmenta en fabricación, energía y electricidad, militar y aviónica, petróleo y gas , metales y minería, transporte y otros. En 2021, el segmento de fabricación tiene la mayor participación de mercado en el mercado de pantallas industriales debido al uso creciente de pantallas en las industrias y al cambio tecnológico y al proceso de automatización de fábricas.
Análisis a nivel de país del mercado de pantallas industriales
Se analiza el mercado de pantallas industriales y se proporciona información sobre el tamaño del mercado por país, tipo, tamaño del panel, tecnología, tipo de comunicación, aplicación y vertical como se menciona anteriormente.
Los países cubiertos en el informe del mercado de pantallas industriales de Asia-Pacífico son Japón, China, India, Corea del Sur, Australia, Singapur, Malasia, Tailandia, Indonesia, Filipinas y el resto de Asia-Pacífico en Asia-Pacífico.
China representó la mayor participación de mercado debido a la presencia de importantes fabricantes de pantallas industriales en el país.
La sección de países del informe también proporciona factores de impacto de mercado individuales y cambios en la regulación en el mercado a nivel nacional que afectan las tendencias actuales y futuras del mercado. Los puntos de datos como nuevas ventas, ventas de reemplazo, demografía del país, leyes regulatorias y aranceles de importación y exportación son algunos de los principales indicadores utilizados para pronosticar el escenario del mercado para países individuales. Además, la presencia y disponibilidad de marcas de Asia-Pacífico y sus desafíos enfrentados debido a la competencia grande o escasa de las marcas locales y nacionales, el impacto de los canales de venta se consideran al proporcionar un análisis de pronóstico de los datos del país.
Demanda creciente de automatización en las industrias manufactureras
El mercado de pantallas industriales también le proporciona un análisis detallado del mercado para cada país, el crecimiento de la industria con ventas, ventas de componentes, impacto del desarrollo tecnológico en pantallas industriales y cambios en los escenarios regulatorios con su apoyo al mercado de pantallas industriales. Los datos están disponibles para el período histórico de 2010 a 2019.
Análisis del panorama competitivo y de la cuota de mercado de los displays industriales
El panorama competitivo del mercado de pantallas industriales proporciona detalles por competidor. Los detalles incluidos son una descripción general de la empresa, las finanzas de la empresa, los ingresos generados, el potencial de mercado, la inversión en investigación y desarrollo, las nuevas iniciativas de mercado, la presencia en Asia-Pacífico, los sitios e instalaciones de producción, las fortalezas y debilidades de la empresa, el lanzamiento de productos, las líneas de prueba de productos, las aprobaciones de productos, las patentes, la amplitud y la extensión de los productos, el dominio de las aplicaciones y la curva de la línea de vida de la tecnología. Los puntos de datos anteriores proporcionados solo están relacionados con el enfoque de las empresas en relación con el mercado de pantallas industriales de Asia-Pacífico.
Los principales actores cubiertos en el informe son SAMSUNG ELECTRONICS CO, LTD., Rockwell Automation, Inc., Panasonic Corporation, Sharp NEC Display Solutions, Ltd (una subsidiaria de NEC Corporation), Schneider Electric, Siemens, General Electric, Emerson Electric Co., Advantech Co., Ltd., Innolux Corporation, Pepperl+Fuchs SE, Planar, AU Optronics Corp., LG Display Co., Ltd., Japan Display Inc., BOE Technology UK Limited, TRICOMTEK CO., LTD, Tianma Microelectronics Co., Ltd. y Shenzhen TOPWAY Technology Co., Ltd. entre otros actores nacionales. Los analistas de DBMR comprenden las fortalezas competitivas y brindan un análisis competitivo para cada competidor por separado.
Numerosas empresas de todo el mundo han iniciado numerosos desarrollos y adquisiciones de productos que también están acelerando el crecimiento del mercado de pantallas industriales.
Por ejemplo,
- En septiembre de 2020, Planar, líder mundial en tecnología de visualización, lanzó la nueva serie HB de Planar, una línea de pantallas LCD de gran formato optimizadas para una colaboración rápida y eficiente. Con este lanzamiento de la nueva pantalla, la empresa de la serie ha diversificado su línea de productos.
- En noviembre de 2020, Rockwell Automation, Inc., líder mundial en automatización industrial y transformación digital, lanzó las nuevas PC industriales y el software Allen-Bradley VersaView 6300 PCs para mejorar notablemente la confiabilidad de la visualización y las aplicaciones de seguridad. Con el lanzamiento de este nuevo producto, la empresa ha aumentado su línea de productos.
La expansión de la producción, el desarrollo de nuevos productos y otras estrategias mejoran la participación de mercado de la empresa con una mayor cobertura y presencia. También brindan a las organizaciones la ventaja de mejorar su oferta de exhibición industrial.
SKU-
Obtenga acceso en línea al informe sobre la primera nube de inteligencia de mercado del mundo

- Panel de análisis de datos interactivo
- Panel de análisis de empresas para oportunidades con alto potencial de crecimiento
- Acceso de analista de investigación para personalización y consultas
- Análisis de la competencia con panel interactivo
- Últimas noticias, actualizaciones y análisis de tendencias
- Aproveche el poder del análisis de referencia para un seguimiento integral de la competencia
Tabla de contenido
1 INTRODUCTION
1.1 OBJECTIVES OF THE STUDY
1.2 MARKET DEFINITION
1.3 OVERVIEW OF ASIA PACIFIC INDUSTRIAL DISPLAY MARKET
1.4 LIMITATIONS
1.5 MARKETS COVERED
2 MARKET SEGMENTATION
2.1 MARKETS COVERED
2.2 GEOGRAPHICAL SCOPE
2.3 YEARS CONSIDERED FOR THE STUDY
2.4 CURRENCY AND PRICING
2.5 DBMR TRIPOD DATA VALIDATION MODEL
2.6 MULTIVARIATE MODELLING
2.7 TYPE LIFELINE CURVE
2.8 PRIMARY INTERVIEWS WITH KEY OPINION LEADERS
2.9 DBMR MARKET POSITION GRID
2.1 VENDOR SHARE ANALYSIS
2.11 MARKET APPLICATION COVERAGE GRID
2.12 SECONDARY SOURCES
2.13 ASSUMPTIONS
3 EXECUTIVE SUMMARY
4 PREMIUM INSIGHTS
4.1 OVERVIEW OF VALUE CHAIN ANALYSIS OF INDUSTRIAL DISPLAY MARKET
4.2 STANDARD RATINGS FOR INDUSTRIAL DISPLAY MARKET
4.2.1 INGRESS PROTECTION (IP) RATING:
4.2.2 NATIONAL ELECTRICAL MANUFACTURERS ASSOCIATION (NEMA) RATINGS:
5 MARKET OVERVIEW
5.1 DRIVERS
5.1.1 EMERGENCE OF VARIOUS TECHNOLOGICAL DEVELOPMENTS AND AUTOMATED PROCESSES IN INDUSTRIES
5.1.2 LED AND LCD BASED DISPLAY PRODUCTS REDUCES THE RISK OF EYE DAMAGE
5.1.3 RISING DEMAND FOR HUMAN MACHINE INTERFACE (HMI) APPLICATION IN MANUFACTURING AND PROCESS INDUSTRIES
5.1.4 INCREASING MANUFACTURING FACILITIES WORLDWIDE IS LEADING THE ADOPTION OF INDUSTRIAL DISPLAYS
5.1.5 AVAILABILITY OF ROBUST DISPLAY SCREEN AND WIRELESS CONNECTION
5.2 RESTRAINT
5.2.1 HIGH INVESTMENTS REQUIRED FOR INSTALLING OF INDUSTRIAL DISPLAYS / PANELS
5.3 OPPORTUNITIES
5.3.1 GROWING DEMAND FOR DIGITAL SIGNAGE APPLICATIONS IN INDUSTRIES FOR DISPLAYING NECESSARY INFORMATION
5.3.2 INCREASING DIGITALIZATION OF FACILITIES WITH INDUSTRY 4.0
5.3.3 RISING ADOPTION OF OLED DISPLAYS IN VARIOUS APPLICATIONS
5.3.4 COMPANIES ARE TRANSFORMING THEIR PROCESS FROM MANUAL TO DIGITAL
5.3.5 VARIOUS PARTNERSHIPS AND ACQUISITION IS LEADING FOR NEW PRODUCT DEVELOPMENTS AND BUSINESS EXPANSION
5.4 CHALLENGES
5.4.1 SUITABILITY OF INDUSTRIAL DISPLAY FOR ALL WEATHER CONDITIONS
5.4.2 DEPENDENCE OF MANUFACTURERS ON VARIOUS SUPPLIERS TO PROVIDE EQUIPMENT AND COMPONENTS
5.4.3 ECONOMIC CRISIS OCCURRED DUE TO VARIOUS FACTORS
6 IMPACT OF COVID-19 ON THE ASIA PACIFIC INDUSTRIAL DISPLAY MARKET
6.1 AFTERMATH OF COVID-19 AND GOVERNMENT ROLE
6.2 STRATEGIC DECISIONS FOR MARKET PLAYERS AFTER COVID-19 TO GAIN COMPETITIVE MARKET SHARE
6.3 IMPACT ON DEMAND
6.4 IMPACT ON SUPPLY CHAIN
6.5 CONCLUSION
7 ASIA PACIFIC INDUSTRIAL DISPLAY MARKET, BY TYPE
7.1 OVERVIEW
7.2 RUGGED DISPLAY
7.2.1 TYPE
7.2.1.1 smartphone & handheld computer
7.2.1.2 tablet
7.2.1.3 laptop
7.2.1.4 mission critical display
7.2.1.5 avionic display
7.2.1.6 vehicle-mounted display
7.2.2 LEVEL OF RUGEDNESS
7.2.2.1 ultra-rugged
7.2.2.2 fully rugged
7.2.2.3 semi rugged
7.3 PANEL MOUNT MONITOR
7.4 VIDEO WALLS
7.5 OPEN FRAME MONITOR
7.6 FRONT DISPLAY
7.7 REAR MOUNT DISPLAY
7.8 MARINE DISPLAY
7.8.1 APPLICATION
7.8.1.1 hmi
7.8.1.2 digital signage
7.8.1.3 interactive display
7.8.1.4 remote monitoring
7.8.1.5 imaging
7.9 SDI DISPLAY
7.1 MULTI-TOUCH (P-CAP) DISPLAY
7.11 USB TYPE-C DISPLAY
7.12 OTHERS
8 ASIA PACIFIC INDUSTRIAL DISPLAY MARKET, BY PANEL SIZE
8.1 OVERVIEW
8.2 UP TO 14 INCHES
8.3 14 INCHES TO 21 INCHES
8.4 21 TO 40 INCHES
8.5 40 INCHES AND ABOVE
9 ASIA PACIFIC INDUSTRIAL DISPLAY MARKET, BY TECHNOLOGY
9.1 OVERVIEW
9.2 LCD
9.3 LED
9.3.1 FULL ARRAY
9.3.2 EDGE LIT
9.3.3 DIRECT LIT
9.4 OLED
9.4.1 AMOLED
9.4.2 PMOLED
9.5 E-PAPER DISPLAY
10 ASIA PACIFIC INDUSTRIAL DISPLAY MARKET, BY COMMUNICATION TYPE
10.1 OVERVIEW
10.2 SERIAL
10.3 ETHERNET
10.4 MOBILE NETWORK
10.5 INDUSTRIAL COMMUNICATION
10.6 RF/ZIGBEE/IR
10.7 JASON/MQTT
10.8 OTHERS
11 ASIA PACIFIC INDUSTRIAL DISPLAY MARKET, BY APPLICATION
11.1 OVERVIEW
11.2 HMI
11.3 DIGITAL SIGNAGE
11.4 INTERACTIVE DISPLAY
11.5 REMOTE MONITORING
11.6 IMAGING
12 ASIA PACIFIC INDUSTRIAL DISPLAY MARKET, BY VERTICAL
12.1 OVERVIEW
12.2 MANUFACTURING
12.2.1 LCD
12.2.2 LED
12.2.2.1 FULL ARRAY
12.2.2.2 EDGE LIT
12.2.2.3 DIRECT LIT
12.2.3 OLED
12.2.3.1 AMOLED
12.2.3.2 PMOLED
12.2.4 E-PAPER DISPLAY
12.3 ENERGY & POWER
12.3.1 LCD
12.3.2 LED
12.3.2.1 FULL ARRAY
12.3.2.2 EDGE LIT
12.3.2.3 DIRECT LIT
12.3.3 OLED
12.3.3.1 AMOLED
12.3.3.2 PMOLED
12.3.4 E-PAPER DISPLAY
12.4 MILITARY AND AVIONICS
12.4.1 LCD
12.4.2 LED
12.4.2.1 FULL ARRAY
12.4.2.2 EDGE LIT
12.4.2.3 DIRECT LIT
12.4.3 OLED
12.4.3.1 AMOLED
12.4.3.2 PMOLED
12.4.4 E-PAPER DISPLAY
12.5 OIL & GAS
12.5.1 LCD
12.5.2 LED
12.5.2.1 FULL ARRAY
12.5.2.2 EDGE LIT
12.5.2.3 DIRECT LIT
12.5.3 OLED
12.5.3.1 AMOLED
12.5.3.2 PMOLED
12.5.4 E-PAPER DISPLAY
12.6 TRANSPORTATION
12.6.1 LCD
12.6.2 LED
12.6.2.1 FULL ARRAY
12.6.2.2 EDGE LIT
12.6.2.3 DIRECT LIT
12.6.3 OLED
12.6.3.1 AMOLED
12.6.3.2 PMOLED
12.6.4 E-PAPER DISPLAY
12.7 METAL & MINING
12.7.1 LCD
12.7.2 LED
12.7.2.1 FULL ARRAY
12.7.2.2 EDGE LIT
12.7.2.3 DIRECT LIT
12.7.3 OLED
12.7.3.1 AMOLED
12.7.3.2 PMOLED
12.7.4 E-PAPER DISPLAY
12.8 OTHERS
12.8.1 LCD
12.8.2 LED
12.8.2.1 FULL ARRAY
12.8.2.2 EDGE LIT
12.8.2.3 DIRECT LIT
12.8.3 OLED
12.8.3.1 AMOLED
12.8.3.2 PMOLED
12.8.4 E-PAPER DISPLAY
13 ASIA PACIFIC INDUSTRIAL DISPLAY MARKET, BY REGION
13.1 OVERVIEW
13.2 ASIA-PACIFIC
13.2.1 CHINA
13.2.2 JAPAN
13.2.3 SOUTH KOREA
13.2.4 SINGAPORE
13.2.5 INDIA
13.2.6 MALAYSIA
13.2.7 THAILAND
13.2.8 INDONESIA
13.2.9 AUSTRALIA
13.2.10 PHILIPPINES
13.2.11 REST OF ASIA-PACIFIC
14 COMPANY LAND SCAPE
14.1 COMPANY SHARE ANALYSIS: ASIA PACIFIC
15 SWOT ANALYSIS
16 COMPANY PROFILE
16.1 AU OPTRONICS CORP.
16.1.1 COMPANY SNAPSHOT
16.1.2 REVENUE ANALYSIS
16.1.3 COMPANY SHARE ANALYSIS
16.1.4 PRODUCT PORTFOLIO
16.1.5 RECENT DEVELOPMENT
16.2 BOE TECHNOLOGY UK LIMITED
16.2.1 COMPANY SNAPSHOT
16.2.2 COMPANY SHARE ANALYSIS
16.2.3 PRODUCT PORTFOLIO
16.2.4 RECENT DEVELOPMENT
16.3 INNOLUX CORPORATION
16.3.1 COMPANY SNAPSHOT
16.3.2 REVENUE ANALYSIS
16.3.3 COMPANY SHARE ANALYSIS
16.3.4 PRODUCT PORTFOLIO
16.3.5 RECENT DEVELOPMENTS
16.4 SAMSUNG ELECTRONICS CO., LTD
16.4.1 COMPANY SNAPSHOT
16.4.2 REVENUE ANALYSIS
16.4.3 COMPANY SHARE ANALYSIS
16.4.4 PRODUCT PORTFOLIO
16.4.5 RECENT DEVELOPMENTS
16.5 LG DISPLAY CO., LTD.
16.5.1 COMPANY SNAPSHOT
16.5.2 REVENUE ANALYSIS
16.5.3 COMPANY SHARE ANALYSIS
16.5.4 PRODUCT PORTFOLIO
16.5.5 RECENT DEVELOPMENTS
16.6 TIANMA MICROELECTRONICS CO., LTD.
16.6.1 COMPANY SNAPSHOT
16.6.2 PRODUCT PORTFOLIO
16.6.3 RECENT DEVELOPMENTS
16.7 ADVANTECH CO., LTD.
16.7.1 COMPANY SNAPSHOT
16.7.2 REVENUE ANALYSIS
16.7.3 PRODUCT PORTFOLIO
16.7.4 RECENT DEVELOPMENTS
16.8 PANASONIC CORPORATION
16.8.1 COMPANY SNAPSHOT
16.8.2 REVENUE ANALYSIS
16.8.3 PRODUCT PORTFOLIO
16.8.4 RECENT DEVELOPMENTS
16.9 EMERSON ELECTRIC CO.
16.9.1 COMPANY SNAPSHOT
16.9.2 REVENUE ANALYSIS
16.9.3 PRODUCT PORTFOLIO
16.9.4 RECENT DEVELOPMENT
16.1 GENERAL DIGITAL CORPORATION
16.10.1 COMPANY SNAPSHOT
16.10.2 PRODUCT PORTFOLIO
16.10.3 RECENT DEVELOPMENTS
16.11 GENERAL ELECTRIC
16.11.1 COMPANY SNAPSHOT
16.11.2 REVENUE ANALYSIS
16.11.3 PRODUCT PORTFOLIO
16.11.4 RECENT DEVELOPMENTS
16.12 JAPAN DISPLAY INC.
16.12.1 COMPANY SNAPSHOT
16.12.2 REVENUE ANALYSIS
16.12.3 PRODUCT PORTFOLIO
16.12.4 RECENT DEVELOPMENTS
16.13 PEPPERL+FUCHS SE
16.13.1 COMPANY SNAPSHOT
16.13.2 PRODUCT PORTFOLIO
16.13.3 RECENT DEVELOPMENT
16.14 PLANAR
16.14.1 COMPANY SNAPSHOT
16.14.2 PRODUCT PORTFOLIO
16.14.3 RECENT DEVELOPMENTS
16.15 ROCKWELL AUTOMATION, INC.
16.15.1 COMPANY SNAPSHOT
16.15.2 REVENUE ANALYSIS
16.15.3 PRODUCT PORTFOLIO
16.15.4 RECENT DEVELOPMENTS
16.16 SCHNEIDER ELECTRIC
16.16.1 COMPANY SNAPSHOT
16.16.2 REVENUE ANALYSIS
16.16.3 PRODUCT PORTFOLIO
16.16.4 RECENT DEVELOPMENT
16.17 SHARP NEC DISPLAY SOLUTIONS, LTD. (A SUBSIDIARY OF NEC CORPORATION)
16.17.1 COMPANY SNAPSHOT
16.17.2 REVENUE ANALYSIS
16.17.3 PRODUCT PORTFOLIO
16.17.4 RECENT DEVELOPMENTS
16.18 SHENZHEN TOPWAY TECHNOLOGY CO., LTD.
16.18.1 COMPANY SNAPSHOT
16.18.2 PRODUCT PORTFOLIO
16.18.3 RECENT DEVELOPMENTS
16.19 SIEMENS
16.19.1 COMPANY SNAPSHOT
16.19.2 REVENUE ANALYSIS
16.19.3 PRODUCT PORTFOLIO
16.19.4 RECENT DEVELOPMENTS
16.2 TRICOMTEK CO., LTD
16.20.1 COMPANY SNAPSHOT
16.20.2 PRODUCT PORTFOLIO
16.20.3 RECENT DEVELOPMENT
17 QUESTIONNAIRE
18 RELATED REPORTS
Lista de Tablas
TABLE 1 ASIA PACIFIC INDUSTRIAL DISPLAY MARKET, BY TYPE, 2019-2028 (USD MILLION)
TABLE 2 ASIA PACIFIC RUGGED DISPLAY IN INDUSTRIAL DISPLAY MARKET, BY REGION, 2019-2028 (USD MILLION)
TABLE 3 ASIA PACIFIC RUGGED DISPLAY IN INDUSTRIAL DISPLAY MARKET, BY TYPE, 2019-2028 (USD MILLION)
TABLE 4 ASIA PACIFIC RUGGED DISPLAY IN INDUSTRIAL DISPLAY MARKET, BY LEVEL OF RUGGEDNESS, 2019-2028 (USD MILLION)
TABLE 5 ASIA PACIFIC PANEL MOUNT MONITOR IN INDUSTRIAL DISPLAY MARKET, BY REGION, 2019-2028 (USD MILLION)
TABLE 6 ASIA PACIFIC VIDEO WALLS IN INDUSTRIAL DISPLAY MARKET, BY REGION, 2019-2028 (USD MILLION)
TABLE 7 ASIA PACIFIC OPEN FRAME MONITOR IN INDUSTRIAL DISPLAY MARKET, BY REGION, 2019-2028 (USD MILLION)
TABLE 8 ASIA PACIFIC FRONT DISPLAY IN INDUSTRIAL DISPLAY MARKET, BY REGION, 2019-2028 (USD MILLION)
TABLE 9 ASIA PACIFIC REAR MOUNT MONITOR IN INDUSTRIAL DISPLAY MARKET, BY REGION, 2019-2028 (USD MILLION)
TABLE 10 ASIA PACIFIC MARINE DISPLAY IN INDUSTRIAL DISPLAY MARKET, BY REGION, 2019-2028 (USD MILLION)
TABLE 11 ASIA PACIFIC MARINE DISPLAY IN INDUSTRIAL DISPLAY MARKET, BY APPLICATION, 2019-2028 (USD MILLION)
TABLE 12 ASIA PACIFIC SDI DISPLAY IN INDUSTRIAL DISPLAY MARKET, BY REGION, 2019-2028 (USD MILLION)
TABLE 13 ASIA PACIFIC MULTI-TOUCH (P-CAP) DISPLAY IN INDUSTRIAL DISPLAY MARKET, BY REGION, 2019-2028 (USD MILLION)
TABLE 14 ASIA PACIFIC USB TYPE-C DISPLAY IN INDUSTRIAL DISPLAY MARKET, BY REGION, 2019-2028 (USD MILLION)
TABLE 15 ASIA PACIFIC OTHERS IN INDUSTRIAL DISPLAY MARKET, BY REGION, 2019-2028 (USD MILLION)
TABLE 16 ASIA PACIFIC INDUSTRIAL DISPLAY MARKET, BY PANEL SIZE, 2019-2028 (USD MILLION)
TABLE 17 ASIA PACIFIC UP TO 14 INCHES IN INDUSTRIAL DISPLAY MARKET, BY REGION, 2019-2028 (USD MILLION)
TABLE 18 ASIA PACIFIC 14 INCHES TO 21 INCHES IN INDUSTRIAL DISPLAY MARKET, BY REGION, 2019-2028 (USD MILLION)
TABLE 19 ASIA PACIFIC 21 TO 40 INCHES IN INDUSTRIAL DISPLAY MARKET, BY REGION, 2019-2028 (USD MILLION)
TABLE 20 ASIA PACIFIC 40 INCHES AND ABOVE IN INDUSTRIAL DISPLAY MARKET, BY REGION, 2019-2028 (USD MILLION)
TABLE 21 ASIA PACIFIC INDUSTRIAL DISPLAY MARKET, BY TECHNOLOGY, 2019-2028 (USD MILLION)
TABLE 22 ASIA PACIFIC LCD IN INDUSTRIAL DISPLAY MARKET, BY REGION, 2019-2028 (USD MILLION)
TABLE 23 ASIA PACIFIC LED IN INDUSTRIAL DISPLAY MARKET, BY REGION, 2019-2028 (USD MILLION)
TABLE 24 ASIA PACIFIC LED IN INDUSTRIAL DISPLAY MARKET, BY TYPE, 2019-2028 (USD MILLION)
TABLE 25 ASIA PACIFIC OLED IN INDUSTRIAL DISPLAY MARKET, BY REGION, 2019-2028 (USD MILLION)
TABLE 26 ASIA PACIFIC OLED IN INDUSTRIAL DISPLAY MARKET, BY TYPE, 2019-2028 (USD MILLION)
TABLE 27 ASIA PACIFIC E-PAPER DISPLAY IN INDUSTRIAL DISPLAY MARKET, BY REGION, 2019-2028 (USD MILLION)
TABLE 28 ASIA PACIFIC INDUSTRIAL DISPLAY MARKET, BY COMMUNICATION TYPE, 2019-2028 (USD MILLION)
TABLE 29 ASIA PACIFIC SERIAL IN INDUSTRIAL DISPLAY MARKET, BY REGION, 2019-2028 (USD MILLION)
TABLE 30 ASIA PACIFIC ETHERNET IN INDUSTRIAL DISPLAY MARKET, BY REGION, 2019-2028 (USD MILLION)
TABLE 31 ASIA PACIFIC MOBILE NETWORK IN INDUSTRIAL DISPLAY MARKET, BY REGION, 2019-2028 (USD MILLION)
TABLE 32 ASIA PACIFIC INDUSTRIAL COMMUNICATION IN INDUSTRIAL DISPLAY MARKET, BY REGION, 2019-2028 (USD MILLION)
TABLE 33 ASIA PACIFIC RF/ZIGBEE/IR IN INDUSTRIAL DISPLAY MARKET, BY REGION, 2019-2028 (USD MILLION)
TABLE 34 ASIA PACIFIC JASON/MQTT IN INDUSTRIAL DISPLAY MARKET, BY REGION, 2019-2028 (USD MILLION)
TABLE 35 ASIA PACIFIC OTHERS IN INDUSTRIAL DISPLAY MARKET, BY REGION, 2019-2028 (USD MILLION)
TABLE 36 ASIA PACIFIC INDUSTRIAL DISPLAY MARKET, BY APPLICATION, 2019-2028 (USD MILLION)
TABLE 37 ASIA PACIFIC HMI IN INDUSTRIAL DISPLAY MARKET, BY REGION, 2019-2028 (USD MILLION)
TABLE 38 ASIA PACIFIC DIGITAL SIGNAGE IN INDUSTRIAL DISPLAY MARKET, BY REGION, 2019-2028 (USD MILLION)
TABLE 39 ASIA PACIFIC INTERACTIVE DISPLAY IN INDUSTRIAL DISPLAY MARKET, BY REGION, 2019-2028 (USD MILLION)
TABLE 40 ASIA PACIFIC REMOTE MONITORING IN INDUSTRIAL DISPLAY MARKET, BY REGION, 2019-2028 (USD MILLION)
TABLE 41 ASIA PACIFIC IMAGING IN INDUSTRIAL DISPLAY MARKET, BY REGION, 2019-2028 (USD MILLION)
TABLE 42 ASIA PACIFIC INDUSTRIAL DISPLAY MARKET, BY VERTICAL, 2019-2028 (USD MILLION)
TABLE 43 ASIA PACIFIC MANUFACTURING IN INDUSTRIAL DISPLAY MARKET, BY REGION, 2019-2028 (USD MILLION)
TABLE 44 ASIA PACIFIC MANUFACTURING IN INDUSTRIAL DISPLAY MARKET, BY TECHNOLOGY, 2019-2028 (USD MILLION)
TABLE 45 ASIA PACIFIC MANUFACTURING IN LED FOR INDUSTRIAL DISPLAY MARKET, BY TYPE, 2019-2028 (USD MILLION)
TABLE 46 ASIA PACIFIC MANUFACTURING IN OLED FOR INDUSTRIAL DISPLAY MARKET, BY TYPE, 2019-2028 (USD MILLION)
TABLE 47 ASIA PACIFIC ENERGY & POWER IN INDUSTRIAL DISPLAY MARKET, BY REGION, 2019-2028 (USD MILLION)
TABLE 48 ASIA PACIFIC ENERGY & POWER IN INDUSTRIAL DISPLAY MARKET, BY TECHNOLOGY, 2019-2028 (USD MILLION)
TABLE 49 ASIA PACIFIC ENERGY AND POWER IN LED FOR INDUSTRIAL DISPLAY MARKET, BY TYPE, 2019-2028 (USD MILLION)
TABLE 50 ASIA PACIFIC ENERGY AND POWER IN OLED FOR INDUSTRIAL DISPLAY MARKET, BY TYPE, 2019-2028 (USD MILLION)
TABLE 51 ASIA PACIFIC MILITARY AND AVIONICS IN INDUSTRIAL DISPLAY MARKET, BY REGION, 2019-2028 (USD MILLION)
TABLE 52 ASIA PACIFIC MILITARY AND AVIONICS IN INDUSTRIAL DISPLAY MARKET, BY TECHNOLOGY, 2019-2028 (USD MILLION)
TABLE 53 ASIA PACIFIC MILITARY AND AVIONICS IN LED FOR INDUSTRIAL DISPLAY MARKET, BY TYPE, 2019-2028 (USD MILLION)
TABLE 54 ASIA PACIFIC MILITARY AND AVIONICS IN OLED FOR INDUSTRIAL DISPLAY MARKET, BY TYPE, 2019-2028 (USD MILLION)
TABLE 55 ASIA PACIFIC OIL & GAS IN INDUSTRIAL DISPLAY MARKET, BY REGION, 2019-2028 (USD MILLION)
TABLE 56 ASIA PACIFIC OIL & GAS IN INDUSTRIAL DISPLAY MARKET, BY TECHNOLOGY, 2019-2028 (USD MILLION)
TABLE 57 ASIA PACIFIC OIL & GAS IN LED FOR INDUSTRIAL DISPLAY MARKET, BY TYPE, 2019-2028 (USD MILLION)
TABLE 58 ASIA PACIFIC OIL & GAS IN OLED FOR INDUSTRIAL DISPLAY MARKET, BY TYPE, 2019-2028 (USD MILLION)
TABLE 59 ASIA PACIFIC TRANSPORTATION IN INDUSTRIAL DISPLAY MARKET, BY REGION, 2019-2028 (USD MILLION)
TABLE 60 ASIA PACIFIC TRANSPORTATION IN INDUSTRIAL DISPLAY MARKET, BY TECHNOLOGY, 2019-2028 (USD MILLION)
TABLE 61 ASIA PACIFIC TRANSPORTATION IN LED FOR INDUSTRIAL DISPLAY MARKET, BY TYPE, 2019-2028 (USD MILLION)
TABLE 62 ASIA PACIFIC TRANSPORTATION IN OLED FOR INDUSTRIAL DISPLAY MARKET, BY TYPE, 2019-2028 (USD MILLION)
TABLE 63 ASIA PACIFIC METAL & MINING IN INDUSTRIAL DISPLAY MARKET, BY REGION, 2019-2028 (USD MILLION)
TABLE 64 ASIA PACIFIC METAL & MINING IN INDUSTRIAL DISPLAY MARKET, BY TECHNOLOGY, 2019-2028 (USD MILLION)
TABLE 65 ASIA PACIFIC METAL & MINING IN LED FOR INDUSTRIAL DISPLAY MARKET, BY TYPE, 2019-2028 (USD MILLION)
TABLE 66 ASIA PACIFIC METAL & MINING IN OLED FOR INDUSTRIAL DISPLAY MARKET, BY TYPE, 2019-2028 (USD MILLION)
TABLE 67 ASIA PACIFIC OTHERS IN INDUSTRIAL DISPLAY MARKET, BY REGION, 2019-2028 (USD MILLION)
TABLE 68 ASIA PACIFIC OTHERS IN INDUSTRIAL DISPLAY MARKET, BY TECHNOLOGY, 2019-2028 (USD MILLION)
TABLE 69 ASIA PACIFIC OTHERS IN LED FOR INDUSTRIAL DISPLAY MARKET, BY TYPE, 2019-2028 (USD MILLION)
TABLE 70 ASIA PACIFIC OTHERS IN OLED FOR INDUSTRIAL DISPLAY MARKET, BY TYPE, 2019-2028 (USD MILLION)
TABLE 71 ASIA PACIFIC INDUSTRIAL DISPLAY MARKET, BY REGION, 2019-2028 (USD MILLION)
TABLE 72 ASIA-PACIFIC INDUSTRIAL DISPLAY MARKET, BY COUNTRY, 2019-2028 (USD MILLION)
TABLE 73 ASIA-PACIFIC INDUSTRIAL DISPLAY MARKET, BY TYPE, 2019-2028 (USD MILLION)
TABLE 74 ASIA-PACIFIC RUGGED DISPLAY IN INDUSTRIAL DISPLAY MARKET, BY TYPE, 2019-2028 (USD MILLION)
TABLE 75 ASIA-PACIFIC RUGGED DISPLAY IN INDUSTRIAL DISPLAY MARKET, BY LEVEL OF RUGGEDNESS, 2019-2028 (USD MILLION)
TABLE 76 ASIA-PACIFIC MARINE DISPLAY IN INDUSTRIAL DISPLAY MARKET, BY APPLICATION, 2019-2028 (USD MILLION)
TABLE 77 ASIA-PACIFIC INDUSTRIAL DISPLAY MARKET, BY TECHNOLOGY, 2019-2028 (USD MILLION)
TABLE 78 ASIA-PACIFIC LED IN INDUSTRIAL DISPLAY MARKET, BY TYPE, 2019-2028 (USD MILLION)
TABLE 79 ASIA-PACIFIC OLED IN INDUSTRIAL DISPLAY MARKET, BY TYPE, 2019-2028 (USD MILLION)
TABLE 80 ASIA-PACIFIC INDUSTRIAL DISPLAY MARKET, BY COMMUNICATION TYPE, 2019-2028 (USD MILLION)
TABLE 81 ASIA-PACIFIC INDUSTRIAL DISPLAY MARKET, BY PANEL SIZE, 2019-2028 (USD MILLION)
TABLE 82 ASIA-PACIFIC INDUSTRIAL DISPLAY MARKET, BY APPLICATION, 2019-2028 (USD MILLION)
TABLE 83 ASIA-PACIFIC INDUSTRIAL DISPLAY MARKET, BY VERTICAL, 2019-2028 (USD MILLION)
TABLE 84 ASIA-PACIFIC MANUFACTURING IN INDUSTRIAL DISPLAY MARKET, BY TECHNOLOGY, 2019-2028 (USD MILLION)
TABLE 85 ASIA-PACIFIC MANUFACTURING IN LED FOR INDUSTRIAL DISPLAY MARKET, BY TYPE, 2019-2028 (USD MILLION)
TABLE 86 ASIA-PACIFIC MANUFACTURING IN OLED FOR INDUSTRIAL DISPLAY MARKET, BY TYPE, 2019-2028 (USD MILLION)
TABLE 87 ASIA-PACIFIC ENERGY & POWER IN INDUSTRIAL DISPLAY MARKET, BY TECHNOLOGY, 2019-2028 (USD MILLION)
TABLE 88 ASIA-PACIFIC ENERGY & POWER IN LED FOR INDUSTRIAL DISPLAY MARKET, BY TYPE, 2019-2028 (USD MILLION)
TABLE 89 ASIA-PACIFIC ENERGY & POWER IN OLED FOR INDUSTRIAL DISPLAY MARKET, BY TYPE, 2019-2028 (USD MILLION)
TABLE 90 ASIA-PACIFIC MILITARY & AVIONICS IN INDUSTRIAL DISPLAY MARKET, BY TECHNOLOGY, 2019-2028 (USD MILLION)
TABLE 91 ASIA-PACIFIC MILITARY & AVIONICS IN LED FOR INDUSTRIAL DISPLAY MARKET, BY TYPE, 2019-2028 (USD MILLION)
TABLE 92 ASIA-PACIFIC MILITARY & AVIONICS IN OLED FOR INDUSTRIAL DISPLAY MARKET, BY TYPE, 2019-2028 (USD MILLION)
TABLE 93 ASIA-PACIFIC OIL & GAS IN INDUSTRIAL DISPLAY MARKET, BY TECHNOLOGY, 2019-2028 (USD MILLION)
TABLE 94 ASIA-PACIFIC OIL & GAS IN LED FOR INDUSTRIAL DISPLAY MARKET, BY TYPE, 2019-2028 (USD MILLION)
TABLE 95 ASIA-PACIFIC OIL & GAS IN OLED FOR INDUSTRIAL DISPLAY MARKET, BY TYPE, 2019-2028 (USD MILLION)
TABLE 96 ASIA-PACIFIC TRANSPORTATION IN INDUSTRIAL DISPLAY MARKET, BY TECHNOLOGY, 2019-2028 (USD MILLION)
TABLE 97 ASIA-PACIFIC TRANSPORTATION IN LED FOR INDUSTRIAL DISPLAY MARKET, BY TYPE, 2019-2028 (USD MILLION)
TABLE 98 ASIA-PACIFIC TRANSPORTATION IN OLED FOR INDUSTRIAL DISPLAY MARKET, BY TYPE, 2019-2028 (USD MILLION)
TABLE 99 ASIA-PACIFIC METAL & MINING IN INDUSTRIAL DISPLAY MARKET, BY TECHNOLOGY, 2019-2028 (USD MILLION)
TABLE 100 ASIA-PACIFIC METAL & MINING IN LED FOR INDUSTRIAL DISPLAY MARKET, BY TYPE, 2019-2028 (USD MILLION)
TABLE 101 ASIA-PACIFIC METAL & MINING IN OLED FOR INDUSTRIAL DISPLAY MARKET, BY TYPE, 2019-2028 (USD MILLION)
TABLE 102 ASIA-PACIFIC OTHERS IN INDUSTRIAL DISPLAY MARKET, BY TECHNOLOGY, 2019-2028 (USD MILLION)
TABLE 103 ASIA-PACIFIC OTHERS IN LED FOR INDUSTRIAL DISPLAY MARKET, BY TYPE, 2019-2028 (USD MILLION)
TABLE 104 ASIA-PACIFIC OTHERS IN OLED FOR INDUSTRIAL DISPLAY MARKET, BY TYPE, 2019-2028 (USD MILLION)
TABLE 105 CHINA INDUSTRIAL DISPLAY MARKET, BY TYPE, 2019-2028 (USD MILLION)
TABLE 106 CHINA RUGGED DISPLAY IN INDUSTRIAL DISPLAY MARKET, BY TYPE, 2019-2028 (USD MILLION)
TABLE 107 CHINA RUGGED DISPLAY IN INDUSTRIAL DISPLAY MARKET, BY LEVEL OF RUGGEDNESS, 2019-2028 (USD MILLION)
TABLE 108 CHINA MARINE DISPLAY IN INDUSTRIAL DISPLAY MARKET, BY APPLICATION, 2019-2028 (USD MILLION)
TABLE 109 CHINA INDUSTRIAL DISPLAY MARKET, BY TECHNOLOGY, 2019-2028 (USD MILLION)
TABLE 110 CHINA LED IN INDUSTRIAL DISPLAY MARKET, BY TYPE, 2019-2028 (USD MILLION)
TABLE 111 CHINA OLED IN INDUSTRIAL DISPLAY MARKET, BY TYPE, 2019-2028 (USD MILLION)
TABLE 112 CHINA INDUSTRIAL DISPLAY MARKET, BY COMMUNICATION TYPE, 2019-2028 (USD MILLION)
TABLE 113 CHINA INDUSTRIAL DISPLAY MARKET, BY PANEL SIZE, 2019-2028 (USD MILLION)
TABLE 114 CHINA INDUSTRIAL DISPLAY MARKET, BY APPLICATION, 2019-2028 (USD MILLION)
TABLE 115 CHINA INDUSTRIAL DISPLAY MARKET, BY VERTICAL, 2019-2028 (USD MILLION)
TABLE 116 CHINA MANUFACTURING IN INDUSTRIAL DISPLAY MARKET, BY TECHNOLOGY, 2019-2028 (USD MILLION)
TABLE 117 CHINA MANUFACTURING IN LED FOR INDUSTRIAL DISPLAY MARKET, BY TYPE, 2019-2028 (USD MILLION)
TABLE 118 CHINA MANUFACTURING IN OLED FOR INDUSTRIAL DISPLAY MARKET, BY TYPE, 2019-2028 (USD MILLION)
TABLE 119 CHINA ENERGY & POWER IN INDUSTRIAL DISPLAY MARKET, BY TECHNOLOGY, 2019-2028 (USD MILLION)
TABLE 120 CHINA ENERGY & POWER IN LED FOR INDUSTRIAL DISPLAY MARKET, BY TYPE, 2019-2028 (USD MILLION)
TABLE 121 CHINA ENERGY & POWER IN OLED FOR INDUSTRIAL DISPLAY MARKET, BY TYPE, 2019-2028 (USD MILLION)
TABLE 122 CHINA MILITARY & AVIONICS IN INDUSTRIAL DISPLAY MARKET, BY TECHNOLOGY, 2019-2028 (USD MILLION)
TABLE 123 CHINA MILITARY & AVIONICS IN LED FOR INDUSTRIAL DISPLAY MARKET, BY TYPE, 2019-2028 (USD MILLION)
TABLE 124 CHINA MILITARY & AVIONICS IN OLED FOR INDUSTRIAL DISPLAY MARKET, BY TYPE, 2019-2028 (USD MILLION)
TABLE 125 CHINA OIL & GAS IN INDUSTRIAL DISPLAY MARKET, BY TECHNOLOGY, 2019-2028 (USD MILLION)
TABLE 126 CHINA OIL & GAS IN LED FOR INDUSTRIAL DISPLAY MARKET, BY TYPE, 2019-2028 (USD MILLION)
TABLE 127 CHINA OIL & GAS IN OLED FOR INDUSTRIAL DISPLAY MARKET, BY TYPE, 2019-2028 (USD MILLION)
TABLE 128 CHINA TRANSPORTATION IN INDUSTRIAL DISPLAY MARKET, BY TECHNOLOGY, 2019-2028 (USD MILLION)
TABLE 129 CHINA TRANSPORTATION IN LED FOR INDUSTRIAL DISPLAY MARKET, BY TYPE, 2019-2028 (USD MILLION)
TABLE 130 CHINA TRANSPORTATION IN OLED FOR INDUSTRIAL DISPLAY MARKET, BY TYPE, 2019-2028 (USD MILLION)
TABLE 131 CHINA METAL & MINING IN INDUSTRIAL DISPLAY MARKET, BY TECHNOLOGY, 2019-2028 (USD MILLION)
TABLE 132 CHINA METAL & MINING IN LED FOR INDUSTRIAL DISPLAY MARKET, BY TYPE, 2019-2028 (USD MILLION)
TABLE 133 CHINA METAL & MINING IN OLED FOR INDUSTRIAL DISPLAY MARKET, BY TYPE, 2019-2028 (USD MILLION)
TABLE 134 CHINA OTHERS IN INDUSTRIAL DISPLAY MARKET, BY TECHNOLOGY, 2019-2028 (USD MILLION)
TABLE 135 CHINA OTHERS IN LED FOR INDUSTRIAL DISPLAY MARKET, BY TYPE, 2019-2028 (USD MILLION)
TABLE 136 CHINA OTHERS IN OLED FOR INDUSTRIAL DISPLAY MARKET, BY TYPE, 2019-2028 (USD MILLION)
TABLE 137 JAPAN INDUSTRIAL DISPLAY MARKET, BY TYPE, 2019-2028 (USD MILLION)
TABLE 138 JAPAN RUGGED DISPLAY IN INDUSTRIAL DISPLAY MARKET, BY TYPE, 2019-2028 (USD MILLION)
TABLE 139 JAPAN RUGGED DISPLAY IN INDUSTRIAL DISPLAY MARKET, BY LEVEL OF RUGGEDNESS, 2019-2028 (USD MILLION)
TABLE 140 JAPAN MARINE DISPLAY IN INDUSTRIAL DISPLAY MARKET, BY APPLICATION, 2019-2028 (USD MILLION)
TABLE 141 JAPAN INDUSTRIAL DISPLAY MARKET, BY TECHNOLOGY, 2019-2028 (USD MILLION)
TABLE 142 JAPAN LED IN INDUSTRIAL DISPLAY MARKET, BY TYPE, 2019-2028 (USD MILLION)
TABLE 143 JAPAN OLED IN INDUSTRIAL DISPLAY MARKET, BY TYPE, 2019-2028 (USD MILLION)
TABLE 144 JAPAN INDUSTRIAL DISPLAY MARKET, BY COMMUNICATION TYPE, 2019-2028 (USD MILLION)
TABLE 145 JAPAN INDUSTRIAL DISPLAY MARKET, BY PANEL SIZE, 2019-2028 (USD MILLION)
TABLE 146 JAPAN INDUSTRIAL DISPLAY MARKET, BY APPLICATION, 2019-2028 (USD MILLION)
TABLE 147 JAPAN INDUSTRIAL DISPLAY MARKET, BY VERTICAL, 2019-2028 (USD MILLION)
TABLE 148 JAPAN MANUFACTURING IN INDUSTRIAL DISPLAY MARKET, BY TECHNOLOGY, 2019-2028 (USD MILLION)
TABLE 149 JAPAN MANUFACTURING IN LED FOR INDUSTRIAL DISPLAY MARKET, BY TYPE, 2019-2028 (USD MILLION)
TABLE 150 JAPAN MANUFACTURING IN OLED FOR INDUSTRIAL DISPLAY MARKET, BY TYPE, 2019-2028 (USD MILLION)
TABLE 151 JAPAN ENERGY & POWER IN INDUSTRIAL DISPLAY MARKET, BY TECHNOLOGY, 2019-2028 (USD MILLION)
TABLE 152 JAPAN ENERGY & POWER IN LED FOR INDUSTRIAL DISPLAY MARKET, BY TYPE, 2019-2028 (USD MILLION)
TABLE 153 JAPAN ENERGY & POWER IN OLED FOR INDUSTRIAL DISPLAY MARKET, BY TYPE, 2019-2028 (USD MILLION)
TABLE 154 JAPAN MILITARY & AVIONICS IN INDUSTRIAL DISPLAY MARKET, BY TECHNOLOGY, 2019-2028 (USD MILLION)
TABLE 155 JAPAN MILITARY & AVIONICS IN LED FOR INDUSTRIAL DISPLAY MARKET, BY TYPE, 2019-2028 (USD MILLION)
TABLE 156 JAPAN MILITARY & AVIONICS IN OLED FOR INDUSTRIAL DISPLAY MARKET, BY TYPE, 2019-2028 (USD MILLION)
TABLE 157 JAPAN OIL & GAS IN INDUSTRIAL DISPLAY MARKET, BY TECHNOLOGY, 2019-2028 (USD MILLION)
TABLE 158 JAPAN OIL & GAS IN LED FOR INDUSTRIAL DISPLAY MARKET, BY TYPE, 2019-2028 (USD MILLION)
TABLE 159 JAPAN OIL & GAS IN OLED FOR INDUSTRIAL DISPLAY MARKET, BY TYPE, 2019-2028 (USD MILLION)
TABLE 160 JAPAN TRANSPORTATION IN INDUSTRIAL DISPLAY MARKET, BY TECHNOLOGY, 2019-2028 (USD MILLION)
TABLE 161 JAPAN TRANSPORTATION IN LED FOR INDUSTRIAL DISPLAY MARKET, BY TYPE, 2019-2028 (USD MILLION)
TABLE 162 JAPAN TRANSPORTATION IN OLED FOR INDUSTRIAL DISPLAY MARKET, BY TYPE, 2019-2028 (USD MILLION)
TABLE 163 JAPAN METAL & MINING IN INDUSTRIAL DISPLAY MARKET, BY TECHNOLOGY, 2019-2028 (USD MILLION)
TABLE 164 JAPAN METAL & MINING IN LED FOR INDUSTRIAL DISPLAY MARKET, BY TYPE, 2019-2028 (USD MILLION)
TABLE 165 JAPAN METAL & MINING IN OLED FOR INDUSTRIAL DISPLAY MARKET, BY TYPE, 2019-2028 (USD MILLION)
TABLE 166 JAPAN OTHERS IN INDUSTRIAL DISPLAY MARKET, BY TECHNOLOGY, 2019-2028 (USD MILLION)
TABLE 167 JAPAN OTHERS IN LED FOR INDUSTRIAL DISPLAY MARKET, BY TYPE, 2019-2028 (USD MILLION)
TABLE 168 JAPAN OTHERS IN OLED FOR INDUSTRIAL DISPLAY MARKET, BY TYPE, 2019-2028 (USD MILLION)
TABLE 169 SOUTH KOREA INDUSTRIAL DISPLAY MARKET, BY TYPE, 2019-2028 (USD MILLION)
TABLE 170 SOUTH KOREA RUGGED DISPLAY IN INDUSTRIAL DISPLAY MARKET, BY TYPE, 2019-2028 (USD MILLION)
TABLE 171 SOUTH KOREA RUGGED DISPLAY IN INDUSTRIAL DISPLAY MARKET, BY LEVEL OF RUGGEDNESS, 2019-2028 (USD MILLION)
TABLE 172 SOUTH KOREA MARINE DISPLAY IN INDUSTRIAL DISPLAY MARKET, BY APPLICATION, 2019-2028 (USD MILLION)
TABLE 173 SOUTH KOREA INDUSTRIAL DISPLAY MARKET, BY TECHNOLOGY, 2019-2028 (USD MILLION)
TABLE 174 SOUTH KOREA LED IN INDUSTRIAL DISPLAY MARKET, BY TYPE, 2019-2028 (USD MILLION)
TABLE 175 SOUTH KOREA OLED IN INDUSTRIAL DISPLAY MARKET, BY TYPE, 2019-2028 (USD MILLION)
TABLE 176 SOUTH KOREA INDUSTRIAL DISPLAY MARKET, BY COMMUNICATION TYPE, 2019-2028 (USD MILLION)
TABLE 177 SOUTH KOREA INDUSTRIAL DISPLAY MARKET, BY PANEL SIZE, 2019-2028 (USD MILLION)
TABLE 178 SOUTH KOREA INDUSTRIAL DISPLAY MARKET, BY APPLICATION, 2019-2028 (USD MILLION)
TABLE 179 SOUTH KOREA INDUSTRIAL DISPLAY MARKET, BY VERTICAL, 2019-2028 (USD MILLION)
TABLE 180 SOUTH KOREA MANUFACTURING IN INDUSTRIAL DISPLAY MARKET, BY TECHNOLOGY, 2019-2028 (USD MILLION)
TABLE 181 SOUTH KOREA MANUFACTURING IN LED FOR INDUSTRIAL DISPLAY MARKET, BY TYPE, 2019-2028 (USD MILLION)
TABLE 182 SOUTH KOREA MANUFACTURING IN OLED FOR INDUSTRIAL DISPLAY MARKET, BY TYPE, 2019-2028 (USD MILLION)
TABLE 183 SOUTH KOREA ENERGY & POWER IN INDUSTRIAL DISPLAY MARKET, BY TECHNOLOGY, 2019-2028 (USD MILLION)
TABLE 184 SOUTH KOREA ENERGY & POWER IN LED FOR INDUSTRIAL DISPLAY MARKET, BY TYPE, 2019-2028 (USD MILLION)
TABLE 185 SOUTH KOREA ENERGY & POWER IN OLED FOR INDUSTRIAL DISPLAY MARKET, BY TYPE, 2019-2028 (USD MILLION)
TABLE 186 SOUTH KOREA MILITARY & AVIONICS IN INDUSTRIAL DISPLAY MARKET, BY TECHNOLOGY, 2019-2028 (USD MILLION)
TABLE 187 SOUTH KOREA MILITARY & AVIONICS IN LED FOR INDUSTRIAL DISPLAY MARKET, BY TYPE, 2019-2028 (USD MILLION)
TABLE 188 SOUTH KOREA MILITARY & AVIONICS IN OLED FOR INDUSTRIAL DISPLAY MARKET, BY TYPE, 2019-2028 (USD MILLION)
TABLE 189 SOUTH KOREA OIL & GAS IN INDUSTRIAL DISPLAY MARKET, BY TECHNOLOGY, 2019-2028 (USD MILLION)
TABLE 190 SOUTH KOREA OIL & GAS IN LED FOR INDUSTRIAL DISPLAY MARKET, BY TYPE, 2019-2028 (USD MILLION)
TABLE 191 SOUTH KOREA OIL & GAS IN OLED FOR INDUSTRIAL DISPLAY MARKET, BY TYPE, 2019-2028 (USD MILLION)
TABLE 192 SOUTH KOREA TRANSPORTATION IN INDUSTRIAL DISPLAY MARKET, BY TECHNOLOGY, 2019-2028 (USD MILLION)
TABLE 193 SOUTH KOREA TRANSPORTATION IN LED FOR INDUSTRIAL DISPLAY MARKET, BY TYPE, 2019-2028 (USD MILLION)
TABLE 194 SOUTH KOREA TRANSPORTATION IN OLED FOR INDUSTRIAL DISPLAY MARKET, BY TYPE, 2019-2028 (USD MILLION)
TABLE 195 SOUTH KOREA METAL & MINING IN INDUSTRIAL DISPLAY MARKET, BY TECHNOLOGY, 2019-2028 (USD MILLION)
TABLE 196 SOUTH KOREA METAL & MINING IN LED FOR INDUSTRIAL DISPLAY MARKET, BY TYPE, 2019-2028 (USD MILLION)
TABLE 197 SOUTH KOREA METAL & MINING IN OLED FOR INDUSTRIAL DISPLAY MARKET, BY TYPE, 2019-2028 (USD MILLION)
TABLE 198 SOUTH KOREA OTHERS IN INDUSTRIAL DISPLAY MARKET, BY TECHNOLOGY, 2019-2028 (USD MILLION)
TABLE 199 SOUTH KOREA OTHERS IN LED FOR INDUSTRIAL DISPLAY MARKET, BY TYPE, 2019-2028 (USD MILLION)
TABLE 200 SOUTH KOREA OTHERS IN OLED FOR INDUSTRIAL DISPLAY MARKET, BY TYPE, 2019-2028 (USD MILLION)
TABLE 201 SINGAPORE INDUSTRIAL DISPLAY MARKET, BY TYPE, 2019-2028 (USD MILLION)
TABLE 202 SINGAPORE RUGGED DISPLAY IN INDUSTRIAL DISPLAY MARKET, BY TYPE, 2019-2028 (USD MILLION)
TABLE 203 SINGAPORE RUGGED DISPLAY IN INDUSTRIAL DISPLAY MARKET, BY LEVEL OF RUGGEDNESS, 2019-2028 (USD MILLION)
TABLE 204 SINGAPORE MARINE DISPLAY IN INDUSTRIAL DISPLAY MARKET, BY APPLICATION, 2019-2028 (USD MILLION)
TABLE 205 SINGAPORE INDUSTRIAL DISPLAY MARKET, BY TECHNOLOGY, 2019-2028 (USD MILLION)
TABLE 206 SINGAPORE LED IN INDUSTRIAL DISPLAY MARKET, BY TYPE, 2019-2028 (USD MILLION)
TABLE 207 SINGAPORE OLED IN INDUSTRIAL DISPLAY MARKET, BY TYPE, 2019-2028 (USD MILLION)
TABLE 208 SINGAPORE INDUSTRIAL DISPLAY MARKET, BY COMMUNICATION TYPE, 2019-2028 (USD MILLION)
TABLE 209 SINGAPORE INDUSTRIAL DISPLAY MARKET, BY PANEL SIZE, 2019-2028 (USD MILLION)
TABLE 210 SINGAPORE INDUSTRIAL DISPLAY MARKET, BY APPLICATION, 2019-2028 (USD MILLION)
TABLE 211 SINGAPORE INDUSTRIAL DISPLAY MARKET, BY VERTICAL, 2019-2028 (USD MILLION)
TABLE 212 SINGAPORE MANUFACTURING IN INDUSTRIAL DISPLAY MARKET, BY TECHNOLOGY, 2019-2028 (USD MILLION)
TABLE 213 SINGAPORE MANUFACTURING IN LED FOR INDUSTRIAL DISPLAY MARKET, BY TYPE, 2019-2028 (USD MILLION)
TABLE 214 SINGAPORE MANUFACTURING IN OLED FOR INDUSTRIAL DISPLAY MARKET, BY TYPE, 2019-2028 (USD MILLION)
TABLE 215 SINGAPORE ENERGY & POWER IN INDUSTRIAL DISPLAY MARKET, BY TECHNOLOGY, 2019-2028 (USD MILLION)
TABLE 216 SINGAPORE ENERGY & POWER IN LED FOR INDUSTRIAL DISPLAY MARKET, BY TYPE, 2019-2028 (USD MILLION)
TABLE 217 SINGAPORE ENERGY & POWER IN OLED FOR INDUSTRIAL DISPLAY MARKET, BY TYPE, 2019-2028 (USD MILLION)
TABLE 218 SINGAPORE MILITARY & AVIONICS IN INDUSTRIAL DISPLAY MARKET, BY TECHNOLOGY, 2019-2028 (USD MILLION)
TABLE 219 SINGAPORE MILITARY & AVIONICS IN LED FOR INDUSTRIAL DISPLAY MARKET, BY TYPE, 2019-2028 (USD MILLION)
TABLE 220 SINGAPORE MILITARY & AVIONICS IN OLED FOR INDUSTRIAL DISPLAY MARKET, BY TYPE, 2019-2028 (USD MILLION)
TABLE 221 SINGAPORE OIL & GAS IN INDUSTRIAL DISPLAY MARKET, BY TECHNOLOGY, 2019-2028 (USD MILLION)
TABLE 222 SINGAPORE OIL & GAS IN LED FOR INDUSTRIAL DISPLAY MARKET, BY TYPE, 2019-2028 (USD MILLION)
TABLE 223 SINGAPORE OIL & GAS IN OLED FOR INDUSTRIAL DISPLAY MARKET, BY TYPE, 2019-2028 (USD MILLION)
TABLE 224 SINGAPORE TRANSPORTATION IN INDUSTRIAL DISPLAY MARKET, BY TECHNOLOGY, 2019-2028 (USD MILLION)
TABLE 225 SINGAPORE TRANSPORTATION IN LED FOR INDUSTRIAL DISPLAY MARKET, BY TYPE, 2019-2028 (USD MILLION)
TABLE 226 SINGAPORE TRANSPORTATION IN OLED FOR INDUSTRIAL DISPLAY MARKET, BY TYPE, 2019-2028 (USD MILLION)
TABLE 227 SINGAPORE METAL & MINING IN INDUSTRIAL DISPLAY MARKET, BY TECHNOLOGY, 2019-2028 (USD MILLION)
TABLE 228 SINGAPORE METAL & MINING IN LED FOR INDUSTRIAL DISPLAY MARKET, BY TYPE, 2019-2028 (USD MILLION)
TABLE 229 SINGAPORE METAL & MINING IN OLED FOR INDUSTRIAL DISPLAY MARKET, BY TYPE, 2019-2028 (USD MILLION)
TABLE 230 SINGAPORE OTHERS IN INDUSTRIAL DISPLAY MARKET, BY TECHNOLOGY, 2019-2028 (USD MILLION)
TABLE 231 SINGAPORE OTHERS IN LED FOR INDUSTRIAL DISPLAY MARKET, BY TYPE, 2019-2028 (USD MILLION)
TABLE 232 SINGAPORE OTHERS IN OLED FOR INDUSTRIAL DISPLAY MARKET, BY TYPE, 2019-2028 (USD MILLION)
TABLE 233 INDIA INDUSTRIAL DISPLAY MARKET, BY TYPE, 2019-2028 (USD MILLION)
TABLE 234 INDIA RUGGED DISPLAY IN INDUSTRIAL DISPLAY MARKET, BY TYPE, 2019-2028 (USD MILLION)
TABLE 235 INDIA RUGGED DISPLAY IN INDUSTRIAL DISPLAY MARKET, BY LEVEL OF RUGGEDNESS, 2019-2028 (USD MILLION)
TABLE 236 INDIA MARINE DISPLAY IN INDUSTRIAL DISPLAY MARKET, BY APPLICATION, 2019-2028 (USD MILLION)
TABLE 237 INDIA INDUSTRIAL DISPLAY MARKET, BY TECHNOLOGY, 2019-2028 (USD MILLION)
TABLE 238 INDIA LED IN INDUSTRIAL DISPLAY MARKET, BY TYPE, 2019-2028 (USD MILLION)
TABLE 239 INDIA OLED IN INDUSTRIAL DISPLAY MARKET, BY TYPE, 2019-2028 (USD MILLION)
TABLE 240 INDIA INDUSTRIAL DISPLAY MARKET, BY COMMUNICATION TYPE, 2019-2028 (USD MILLION)
TABLE 241 INDIA INDUSTRIAL DISPLAY MARKET, BY PANEL SIZE, 2019-2028 (USD MILLION)
TABLE 242 INDIA INDUSTRIAL DISPLAY MARKET, BY APPLICATION, 2019-2028 (USD MILLION)
TABLE 243 INDIA INDUSTRIAL DISPLAY MARKET, BY VERTICAL, 2019-2028 (USD MILLION)
TABLE 244 INDIA MANUFACTURING IN INDUSTRIAL DISPLAY MARKET, BY TECHNOLOGY, 2019-2028 (USD MILLION)
TABLE 245 INDIA MANUFACTURING IN LED FOR INDUSTRIAL DISPLAY MARKET, BY TYPE, 2019-2028 (USD MILLION)
TABLE 246 INDIA MANUFACTURING IN OLED FOR INDUSTRIAL DISPLAY MARKET, BY TYPE, 2019-2028 (USD MILLION)
TABLE 247 INDIA ENERGY & POWER IN INDUSTRIAL DISPLAY MARKET, BY TECHNOLOGY, 2019-2028 (USD MILLION)
TABLE 248 INDIA ENERGY & POWER IN LED FOR INDUSTRIAL DISPLAY MARKET, BY TYPE, 2019-2028 (USD MILLION)
TABLE 249 INDIA ENERGY & POWER IN OLED FOR INDUSTRIAL DISPLAY MARKET, BY TYPE, 2019-2028 (USD MILLION)
TABLE 250 INDIA MILITARY & AVIONICS IN INDUSTRIAL DISPLAY MARKET, BY TECHNOLOGY, 2019-2028 (USD MILLION)
TABLE 251 INDIA MILITARY & AVIONICS IN LED FOR INDUSTRIAL DISPLAY MARKET, BY TYPE, 2019-2028 (USD MILLION)
TABLE 252 INDIA MILITARY & AVIONICS IN OLED FOR INDUSTRIAL DISPLAY MARKET, BY TYPE, 2019-2028 (USD MILLION)
TABLE 253 INDIA OIL & GAS IN INDUSTRIAL DISPLAY MARKET, BY TECHNOLOGY, 2019-2028 (USD MILLION)
TABLE 254 INDIA OIL & GAS IN LED FOR INDUSTRIAL DISPLAY MARKET, BY TYPE, 2019-2028 (USD MILLION)
TABLE 255 INDIA OIL & GAS IN OLED FOR INDUSTRIAL DISPLAY MARKET, BY TYPE, 2019-2028 (USD MILLION)
TABLE 256 INDIA TRANSPORTATION IN INDUSTRIAL DISPLAY MARKET, BY TECHNOLOGY, 2019-2028 (USD MILLION)
TABLE 257 INDIA TRANSPORTATION IN LED FOR INDUSTRIAL DISPLAY MARKET, BY TYPE, 2019-2028 (USD MILLION)
TABLE 258 INDIA TRANSPORTATION IN OLED FOR INDUSTRIAL DISPLAY MARKET, BY TYPE, 2019-2028 (USD MILLION)
TABLE 259 INDIA METAL & MINING IN INDUSTRIAL DISPLAY MARKET, BY TECHNOLOGY, 2019-2028 (USD MILLION)
TABLE 260 INDIA METAL & MINING IN LED FOR INDUSTRIAL DISPLAY MARKET, BY TYPE, 2019-2028 (USD MILLION)
TABLE 261 INDIA METAL & MINING IN OLED FOR INDUSTRIAL DISPLAY MARKET, BY TYPE, 2019-2028 (USD MILLION)
TABLE 262 INDIA OTHERS IN INDUSTRIAL DISPLAY MARKET, BY TECHNOLOGY, 2019-2028 (USD MILLION)
TABLE 263 INDIA OTHERS IN LED FOR INDUSTRIAL DISPLAY MARKET, BY TYPE, 2019-2028 (USD MILLION)
TABLE 264 INDIA OTHERS IN OLED FOR INDUSTRIAL DISPLAY MARKET, BY TYPE, 2019-2028 (USD MILLION)
TABLE 265 MALAYSIA INDUSTRIAL DISPLAY MARKET, BY TYPE, 2019-2028 (USD MILLION)
TABLE 266 MALAYSIA RUGGED DISPLAY IN INDUSTRIAL DISPLAY MARKET, BY TYPE, 2019-2028 (USD MILLION)
TABLE 267 MALAYSIA RUGGED DISPLAY IN INDUSTRIAL DISPLAY MARKET, BY LEVEL OF RUGGEDNESS, 2019-2028 (USD MILLION)
TABLE 268 MALAYSIA MARINE DISPLAY IN INDUSTRIAL DISPLAY MARKET, BY APPLICATION, 2019-2028 (USD MILLION)
TABLE 269 MALAYSIA INDUSTRIAL DISPLAY MARKET, BY TECHNOLOGY, 2019-2028 (USD MILLION)
TABLE 270 MALAYSIA LED IN INDUSTRIAL DISPLAY MARKET, BY TYPE, 2019-2028 (USD MILLION)
TABLE 271 MALAYSIA OLED IN INDUSTRIAL DISPLAY MARKET, BY TYPE, 2019-2028 (USD MILLION)
TABLE 272 MALAYSIA INDUSTRIAL DISPLAY MARKET, BY COMMUNICATION TYPE, 2019-2028 (USD MILLION)
TABLE 273 MALAYSIA INDUSTRIAL DISPLAY MARKET, BY PANEL SIZE, 2019-2028 (USD MILLION)
TABLE 274 MALAYSIA INDUSTRIAL DISPLAY MARKET, BY APPLICATION, 2019-2028 (USD MILLION)
TABLE 275 MALAYSIA INDUSTRIAL DISPLAY MARKET, BY VERTICAL, 2019-2028 (USD MILLION)
TABLE 276 MALAYSIA MANUFACTURING IN INDUSTRIAL DISPLAY MARKET, BY TECHNOLOGY, 2019-2028 (USD MILLION)
TABLE 277 MALAYSIA MANUFACTURING IN LED FOR INDUSTRIAL DISPLAY MARKET, BY TYPE, 2019-2028 (USD MILLION)
TABLE 278 MALAYSIA MANUFACTURING IN OLED FOR INDUSTRIAL DISPLAY MARKET, BY TYPE, 2019-2028 (USD MILLION)
TABLE 279 MALAYSIA ENERGY & POWER IN INDUSTRIAL DISPLAY MARKET, BY TECHNOLOGY, 2019-2028 (USD MILLION)
TABLE 280 MALAYSIA ENERGY & POWER IN LED FOR INDUSTRIAL DISPLAY MARKET, BY TYPE, 2019-2028 (USD MILLION)
TABLE 281 MALAYSIA ENERGY & POWER IN OLED FOR INDUSTRIAL DISPLAY MARKET, BY TYPE, 2019-2028 (USD MILLION)
TABLE 282 MALAYSIA MILITARY & AVIONICS IN INDUSTRIAL DISPLAY MARKET, BY TECHNOLOGY, 2019-2028 (USD MILLION)
TABLE 283 MALAYSIA MILITARY & AVIONICS IN LED FOR INDUSTRIAL DISPLAY MARKET, BY TYPE, 2019-2028 (USD MILLION)
TABLE 284 MALAYSIA MILITARY & AVIONICS IN OLED FOR INDUSTRIAL DISPLAY MARKET, BY TYPE, 2019-2028 (USD MILLION)
TABLE 285 MALAYSIA OIL & GAS IN INDUSTRIAL DISPLAY MARKET, BY TECHNOLOGY, 2019-2028 (USD MILLION)
TABLE 286 MALAYSIA OIL & GAS IN LED FOR INDUSTRIAL DISPLAY MARKET, BY TYPE, 2019-2028 (USD MILLION)
TABLE 287 MALAYSIA OIL & GAS IN OLED FOR INDUSTRIAL DISPLAY MARKET, BY TYPE, 2019-2028 (USD MILLION)
TABLE 288 MALAYSIA TRANSPORTATION IN INDUSTRIAL DISPLAY MARKET, BY TECHNOLOGY, 2019-2028 (USD MILLION)
TABLE 289 MALAYSIA TRANSPORTATION IN LED FOR INDUSTRIAL DISPLAY MARKET, BY TYPE, 2019-2028 (USD MILLION)
TABLE 290 MALAYSIA TRANSPORTATION IN OLED FOR INDUSTRIAL DISPLAY MARKET, BY TYPE, 2019-2028 (USD MILLION)
TABLE 291 MALAYSIA METAL & MINING IN INDUSTRIAL DISPLAY MARKET, BY TECHNOLOGY, 2019-2028 (USD MILLION)
TABLE 292 MALAYSIA METAL & MINING IN LED FOR INDUSTRIAL DISPLAY MARKET, BY TYPE, 2019-2028 (USD MILLION)
TABLE 293 MALAYSIA METAL & MINING IN OLED FOR INDUSTRIAL DISPLAY MARKET, BY TYPE, 2019-2028 (USD MILLION)
TABLE 294 MALAYSIA OTHERS IN INDUSTRIAL DISPLAY MARKET, BY TECHNOLOGY, 2019-2028 (USD MILLION)
TABLE 295 MALAYSIA OTHERS IN LED FOR INDUSTRIAL DISPLAY MARKET, BY TYPE, 2019-2028 (USD MILLION)
TABLE 296 MALAYSIA OTHERS IN OLED FOR INDUSTRIAL DISPLAY MARKET, BY TYPE, 2019-2028 (USD MILLION)
TABLE 297 THAILAND INDUSTRIAL DISPLAY MARKET, BY TYPE, 2019-2028 (USD MILLION)
TABLE 298 THAILAND RUGGED DISPLAY IN INDUSTRIAL DISPLAY MARKET, BY TYPE, 2019-2028 (USD MILLION)
TABLE 299 THAILAND RUGGED DISPLAY IN INDUSTRIAL DISPLAY MARKET, BY LEVEL OF RUGGEDNESS, 2019-2028 (USD MILLION)
TABLE 300 THAILAND MARINE DISPLAY IN INDUSTRIAL DISPLAY MARKET, BY APPLICATION, 2019-2028 (USD MILLION)
TABLE 301 THAILAND INDUSTRIAL DISPLAY MARKET, BY TECHNOLOGY, 2019-2028 (USD MILLION)
TABLE 302 THAILAND LED IN INDUSTRIAL DISPLAY MARKET, BY TYPE, 2019-2028 (USD MILLION)
TABLE 303 THAILAND OLED IN INDUSTRIAL DISPLAY MARKET, BY TYPE, 2019-2028 (USD MILLION)
TABLE 304 THAILAND INDUSTRIAL DISPLAY MARKET, BY COMMUNICATION TYPE, 2019-2028 (USD MILLION)
TABLE 305 THAILAND INDUSTRIAL DISPLAY MARKET, BY PANEL SIZE, 2019-2028 (USD MILLION)
TABLE 306 THAILAND INDUSTRIAL DISPLAY MARKET, BY APPLICATION, 2019-2028 (USD MILLION)
TABLE 307 THAILAND INDUSTRIAL DISPLAY MARKET, BY VERTICAL, 2019-2028 (USD MILLION)
TABLE 308 THAILAND MANUFACTURING IN INDUSTRIAL DISPLAY MARKET, BY TECHNOLOGY, 2019-2028 (USD MILLION)
TABLE 309 THAILAND MANUFACTURING IN LED FOR INDUSTRIAL DISPLAY MARKET, BY TYPE, 2019-2028 (USD MILLION)
TABLE 310 THAILAND MANUFACTURING IN OLED FOR INDUSTRIAL DISPLAY MARKET, BY TYPE, 2019-2028 (USD MILLION)
TABLE 311 THAILAND ENERGY & POWER IN INDUSTRIAL DISPLAY MARKET, BY TECHNOLOGY, 2019-2028 (USD MILLION)
TABLE 312 THAILAND ENERGY & POWER IN LED FOR INDUSTRIAL DISPLAY MARKET, BY TYPE, 2019-2028 (USD MILLION)
TABLE 313 THAILAND ENERGY & POWER IN OLED FOR INDUSTRIAL DISPLAY MARKET, BY TYPE, 2019-2028 (USD MILLION)
TABLE 314 THAILAND MILITARY & AVIONICS IN INDUSTRIAL DISPLAY MARKET, BY TECHNOLOGY, 2019-2028 (USD MILLION)
TABLE 315 THAILAND MILITARY & AVIONICS IN LED FOR INDUSTRIAL DISPLAY MARKET, BY TYPE, 2019-2028 (USD MILLION)
TABLE 316 THAILAND MILITARY & AVIONICS IN OLED FOR INDUSTRIAL DISPLAY MARKET, BY TYPE, 2019-2028 (USD MILLION)
TABLE 317 THAILAND OIL & GAS IN INDUSTRIAL DISPLAY MARKET, BY TECHNOLOGY, 2019-2028 (USD MILLION)
TABLE 318 THAILAND OIL & GAS IN LED FOR INDUSTRIAL DISPLAY MARKET, BY TYPE, 2019-2028 (USD MILLION)
TABLE 319 THAILAND OIL & GAS IN OLED FOR INDUSTRIAL DISPLAY MARKET, BY TYPE, 2019-2028 (USD MILLION)
TABLE 320 THAILAND TRANSPORTATION IN INDUSTRIAL DISPLAY MARKET, BY TECHNOLOGY, 2019-2028 (USD MILLION)
TABLE 321 THAILAND TRANSPORTATION IN LED FOR INDUSTRIAL DISPLAY MARKET, BY TYPE, 2019-2028 (USD MILLION)
TABLE 322 THAILAND TRANSPORTATION IN OLED FOR INDUSTRIAL DISPLAY MARKET, BY TYPE, 2019-2028 (USD MILLION)
TABLE 323 THAILAND METAL & MINING IN INDUSTRIAL DISPLAY MARKET, BY TECHNOLOGY, 2019-2028 (USD MILLION)
TABLE 324 THAILAND METAL & MINING IN LED FOR INDUSTRIAL DISPLAY MARKET, BY TYPE, 2019-2028 (USD MILLION)
TABLE 325 THAILAND METAL & MINING IN OLED FOR INDUSTRIAL DISPLAY MARKET, BY TYPE, 2019-2028 (USD MILLION)
TABLE 326 THAILAND OTHERS IN INDUSTRIAL DISPLAY MARKET, BY TECHNOLOGY, 2019-2028 (USD MILLION)
TABLE 327 THAILAND OTHERS IN LED FOR INDUSTRIAL DISPLAY MARKET, BY TYPE, 2019-2028 (USD MILLION)
TABLE 328 THAILAND OTHERS IN OLED FOR INDUSTRIAL DISPLAY MARKET, BY TYPE, 2019-2028 (USD MILLION)
TABLE 329 INDONESIA INDUSTRIAL DISPLAY MARKET, BY TYPE, 2019-2028 (USD MILLION)
TABLE 330 INDONESIA RUGGED DISPLAY IN INDUSTRIAL DISPLAY MARKET, BY TYPE, 2019-2028 (USD MILLION)
TABLE 331 INDONESIA RUGGED DISPLAY IN INDUSTRIAL DISPLAY MARKET, BY LEVEL OF RUGGEDNESS, 2019-2028 (USD MILLION)
TABLE 332 INDONESIA MARINE DISPLAY IN INDUSTRIAL DISPLAY MARKET, BY APPLICATION, 2019-2028 (USD MILLION)
TABLE 333 INDONESIA INDUSTRIAL DISPLAY MARKET, BY TECHNOLOGY, 2019-2028 (USD MILLION)
TABLE 334 INDONESIA LED IN INDUSTRIAL DISPLAY MARKET, BY TYPE, 2019-2028 (USD MILLION)
TABLE 335 INDONESIA OLED IN INDUSTRIAL DISPLAY MARKET, BY TYPE, 2019-2028 (USD MILLION)
TABLE 336 INDONESIA INDUSTRIAL DISPLAY MARKET, BY COMMUNICATION TYPE, 2019-2028 (USD MILLION)
TABLE 337 INDONESIA INDUSTRIAL DISPLAY MARKET, BY PANEL SIZE, 2019-2028 (USD MILLION)
TABLE 338 INDONESIA INDUSTRIAL DISPLAY MARKET, BY APPLICATION, 2019-2028 (USD MILLION)
TABLE 339 INDONESIA INDUSTRIAL DISPLAY MARKET, BY VERTICAL, 2019-2028 (USD MILLION)
TABLE 340 INDONESIA MANUFACTURING IN INDUSTRIAL DISPLAY MARKET, BY TECHNOLOGY, 2019-2028 (USD MILLION)
TABLE 341 INDONESIA MANUFACTURING IN LED FOR INDUSTRIAL DISPLAY MARKET, BY TYPE, 2019-2028 (USD MILLION)
TABLE 342 INDONESIA MANUFACTURING IN OLED FOR INDUSTRIAL DISPLAY MARKET, BY TYPE, 2019-2028 (USD MILLION)
TABLE 343 INDONESIA ENERGY & POWER IN INDUSTRIAL DISPLAY MARKET, BY TECHNOLOGY, 2019-2028 (USD MILLION)
TABLE 344 INDONESIA ENERGY & POWER IN LED FOR INDUSTRIAL DISPLAY MARKET, BY TYPE, 2019-2028 (USD MILLION)
TABLE 345 INDONESIA ENERGY & POWER IN OLED FOR INDUSTRIAL DISPLAY MARKET, BY TYPE, 2019-2028 (USD MILLION)
TABLE 346 INDONESIA MILITARY & AVIONICS IN INDUSTRIAL DISPLAY MARKET, BY TECHNOLOGY, 2019-2028 (USD MILLION)
TABLE 347 INDONESIA MILITARY & AVIONICS IN LED FOR INDUSTRIAL DISPLAY MARKET, BY TYPE, 2019-2028 (USD MILLION)
TABLE 348 INDONESIA MILITARY & AVIONICS IN OLED FOR INDUSTRIAL DISPLAY MARKET, BY TYPE, 2019-2028 (USD MILLION)
TABLE 349 INDONESIA OIL & GAS IN INDUSTRIAL DISPLAY MARKET, BY TECHNOLOGY, 2019-2028 (USD MILLION)
TABLE 350 INDONESIA OIL & GAS IN LED FOR INDUSTRIAL DISPLAY MARKET, BY TYPE, 2019-2028 (USD MILLION)
TABLE 351 INDONESIA OIL & GAS IN OLED FOR INDUSTRIAL DISPLAY MARKET, BY TYPE, 2019-2028 (USD MILLION)
TABLE 352 INDONESIA TRANSPORTATION IN INDUSTRIAL DISPLAY MARKET, BY TECHNOLOGY, 2019-2028 (USD MILLION)
TABLE 353 INDONESIA TRANSPORTATION IN LED FOR INDUSTRIAL DISPLAY MARKET, BY TYPE, 2019-2028 (USD MILLION)
TABLE 354 INDONESIA TRANSPORTATION IN OLED FOR INDUSTRIAL DISPLAY MARKET, BY TYPE, 2019-2028 (USD MILLION)
TABLE 355 INDONESIA METAL & MINING IN INDUSTRIAL DISPLAY MARKET, BY TECHNOLOGY, 2019-2028 (USD MILLION)
TABLE 356 INDONESIA METAL & MINING IN LED FOR INDUSTRIAL DISPLAY MARKET, BY TYPE, 2019-2028 (USD MILLION)
TABLE 357 INDONESIA METAL & MINING IN OLED FOR INDUSTRIAL DISPLAY MARKET, BY TYPE, 2019-2028 (USD MILLION)
TABLE 358 INDONESIA OTHERS IN INDUSTRIAL DISPLAY MARKET, BY TECHNOLOGY, 2019-2028 (USD MILLION)
TABLE 359 INDONESIA OTHERS IN LED FOR INDUSTRIAL DISPLAY MARKET, BY TYPE, 2019-2028 (USD MILLION)
TABLE 360 INDONESIA OTHERS IN OLED FOR INDUSTRIAL DISPLAY MARKET, BY TYPE, 2019-2028 (USD MILLION)
TABLE 361 AUSTRALIA INDUSTRIAL DISPLAY MARKET, BY TYPE, 2019-2028 (USD MILLION)
TABLE 362 AUSTRALIA RUGGED DISPLAY IN INDUSTRIAL DISPLAY MARKET, BY TYPE, 2019-2028 (USD MILLION)
TABLE 363 AUSTRALIA RUGGED DISPLAY IN INDUSTRIAL DISPLAY MARKET, BY LEVEL OF RUGGEDNESS, 2019-2028 (USD MILLION)
TABLE 364 AUSTRALIA MARINE DISPLAY IN INDUSTRIAL DISPLAY MARKET, BY APPLICATION, 2019-2028 (USD MILLION)
TABLE 365 AUSTRALIA INDUSTRIAL DISPLAY MARKET, BY TECHNOLOGY, 2019-2028 (USD MILLION)
TABLE 366 AUSTRALIA LED IN INDUSTRIAL DISPLAY MARKET, BY TYPE, 2019-2028 (USD MILLION)
TABLE 367 AUSTRALIA OLED IN INDUSTRIAL DISPLAY MARKET, BY TYPE, 2019-2028 (USD MILLION)
TABLE 368 AUSTRALIA INDUSTRIAL DISPLAY MARKET, BY COMMUNICATION TYPE, 2019-2028 (USD MILLION)
TABLE 369 AUSTRALIA INDUSTRIAL DISPLAY MARKET, BY PANEL SIZE, 2019-2028 (USD MILLION)
TABLE 370 AUSTRALIA INDUSTRIAL DISPLAY MARKET, BY APPLICATION, 2019-2028 (USD MILLION)
TABLE 371 AUSTRALIA INDUSTRIAL DISPLAY MARKET, BY VERTICAL, 2019-2028 (USD MILLION)
TABLE 372 AUSTRALIA MANUFACTURING IN INDUSTRIAL DISPLAY MARKET, BY TECHNOLOGY, 2019-2028 (USD MILLION)
TABLE 373 AUSTRALIA MANUFACTURING IN LED FOR INDUSTRIAL DISPLAY MARKET, BY TYPE, 2019-2028 (USD MILLION)
TABLE 374 AUSTRALIA MANUFACTURING IN OLED FOR INDUSTRIAL DISPLAY MARKET, BY TYPE, 2019-2028 (USD MILLION)
TABLE 375 AUSTRALIA ENERGY & POWER IN INDUSTRIAL DISPLAY MARKET, BY TECHNOLOGY, 2019-2028 (USD MILLION)
TABLE 376 AUSTRALIA ENERGY & POWER IN LED FOR INDUSTRIAL DISPLAY MARKET, BY TYPE, 2019-2028 (USD MILLION)
TABLE 377 AUSTRALIA ENERGY & POWER IN OLED FOR INDUSTRIAL DISPLAY MARKET, BY TYPE, 2019-2028 (USD MILLION)
TABLE 378 AUSTRALIA MILITARY & AVIONICS IN INDUSTRIAL DISPLAY MARKET, BY TECHNOLOGY, 2019-2028 (USD MILLION)
TABLE 379 AUSTRALIA MILITARY & AVIONICS IN LED FOR INDUSTRIAL DISPLAY MARKET, BY TYPE, 2019-2028 (USD MILLION)
TABLE 380 AUSTRALIA MILITARY & AVIONICS IN OLED FOR INDUSTRIAL DISPLAY MARKET, BY TYPE, 2019-2028 (USD MILLION)
TABLE 381 AUSTRALIA OIL & GAS IN INDUSTRIAL DISPLAY MARKET, BY TECHNOLOGY, 2019-2028 (USD MILLION)
TABLE 382 AUSTRALIA OIL & GAS IN LED FOR INDUSTRIAL DISPLAY MARKET, BY TYPE, 2019-2028 (USD MILLION)
TABLE 383 AUSTRALIA OIL & GAS IN OLED FOR INDUSTRIAL DISPLAY MARKET, BY TYPE, 2019-2028 (USD MILLION)
TABLE 384 AUSTRALIA TRANSPORTATION IN INDUSTRIAL DISPLAY MARKET, BY TECHNOLOGY, 2019-2028 (USD MILLION)
TABLE 385 AUSTRALIA TRANSPORTATION IN LED FOR INDUSTRIAL DISPLAY MARKET, BY TYPE, 2019-2028 (USD MILLION)
TABLE 386 AUSTRALIA TRANSPORTATION IN OLED FOR INDUSTRIAL DISPLAY MARKET, BY TYPE, 2019-2028 (USD MILLION)
TABLE 387 AUSTRALIA METAL & MINING IN INDUSTRIAL DISPLAY MARKET, BY TECHNOLOGY, 2019-2028 (USD MILLION)
TABLE 388 AUSTRALIA METAL & MINING IN LED FOR INDUSTRIAL DISPLAY MARKET, BY TYPE, 2019-2028 (USD MILLION)
TABLE 389 AUSTRALIA METAL & MINING IN OLED FOR INDUSTRIAL DISPLAY MARKET, BY TYPE, 2019-2028 (USD MILLION)
TABLE 390 AUSTRALIA OTHERS IN INDUSTRIAL DISPLAY MARKET, BY TECHNOLOGY, 2019-2028 (USD MILLION)
TABLE 391 AUSTRALIA OTHERS IN LED FOR INDUSTRIAL DISPLAY MARKET, BY TYPE, 2019-2028 (USD MILLION)
TABLE 392 AUSTRALIA OTHERS IN OLED FOR INDUSTRIAL DISPLAY MARKET, BY TYPE, 2019-2028 (USD MILLION)
TABLE 393 PHILIPPINES INDUSTRIAL DISPLAY MARKET, BY TYPE, 2019-2028 (USD MILLION)
TABLE 394 PHILIPPINES RUGGED DISPLAY IN INDUSTRIAL DISPLAY MARKET, BY TYPE, 2019-2028 (USD MILLION)
TABLE 395 PHILIPPINES RUGGED DISPLAY IN INDUSTRIAL DISPLAY MARKET, BY LEVEL OF RUGGEDNESS, 2019-2028 (USD MILLION)
TABLE 396 PHILIPPINES MARINE DISPLAY IN INDUSTRIAL DISPLAY MARKET, BY APPLICATION, 2019-2028 (USD MILLION)
TABLE 397 PHILIPPINES INDUSTRIAL DISPLAY MARKET, BY TECHNOLOGY, 2019-2028 (USD MILLION)
TABLE 398 PHILIPPINES LED IN INDUSTRIAL DISPLAY MARKET, BY TYPE, 2019-2028 (USD MILLION)
TABLE 399 PHILIPPINES OLED IN INDUSTRIAL DISPLAY MARKET, BY TYPE, 2019-2028 (USD MILLION)
TABLE 400 PHILIPPINES INDUSTRIAL DISPLAY MARKET, BY COMMUNICATION TYPE, 2019-2028 (USD MILLION)
TABLE 401 PHILIPPINES INDUSTRIAL DISPLAY MARKET, BY PANEL SIZE, 2019-2028 (USD MILLION)
TABLE 402 PHILIPPINES INDUSTRIAL DISPLAY MARKET, BY APPLICATION, 2019-2028 (USD MILLION)
TABLE 403 PHILIPPINES INDUSTRIAL DISPLAY MARKET, BY VERTICAL, 2019-2028 (USD MILLION)
TABLE 404 PHILIPPINES MANUFACTURING IN INDUSTRIAL DISPLAY MARKET, BY TECHNOLOGY, 2019-2028 (USD MILLION)
TABLE 405 PHILIPPINES MANUFACTURING IN LED FOR INDUSTRIAL DISPLAY MARKET, BY TYPE, 2019-2028 (USD MILLION)
TABLE 406 PHILIPPINES MANUFACTURING IN OLED FOR INDUSTRIAL DISPLAY MARKET, BY TYPE, 2019-2028 (USD MILLION)
TABLE 407 PHILIPPINES ENERGY & POWER IN INDUSTRIAL DISPLAY MARKET, BY TECHNOLOGY, 2019-2028 (USD MILLION)
TABLE 408 PHILIPPINES ENERGY & POWER IN LED FOR INDUSTRIAL DISPLAY MARKET, BY TYPE, 2019-2028 (USD MILLION)
TABLE 409 PHILIPPINES ENERGY & POWER IN OLED FOR INDUSTRIAL DISPLAY MARKET, BY TYPE, 2019-2028 (USD MILLION)
TABLE 410 PHILIPPINES MILITARY & AVIONICS IN INDUSTRIAL DISPLAY MARKET, BY TECHNOLOGY, 2019-2028 (USD MILLION)
TABLE 411 PHILIPPINES MILITARY & AVIONICS IN LED FOR INDUSTRIAL DISPLAY MARKET, BY TYPE, 2019-2028 (USD MILLION)
TABLE 412 PHILIPPINES MILITARY & AVIONICS IN OLED FOR INDUSTRIAL DISPLAY MARKET, BY TYPE, 2019-2028 (USD MILLION)
TABLE 413 PHILIPPINES OIL & GAS IN INDUSTRIAL DISPLAY MARKET, BY TECHNOLOGY, 2019-2028 (USD MILLION)
TABLE 414 PHILIPPINES OIL & GAS IN LED FOR INDUSTRIAL DISPLAY MARKET, BY TYPE, 2019-2028 (USD MILLION)
TABLE 415 PHILIPPINES OIL & GAS IN OLED FOR INDUSTRIAL DISPLAY MARKET, BY TYPE, 2019-2028 (USD MILLION)
TABLE 416 PHILIPPINES TRANSPORTATION IN INDUSTRIAL DISPLAY MARKET, BY TECHNOLOGY, 2019-2028 (USD MILLION)
TABLE 417 PHILIPPINES TRANSPORTATION IN LED FOR INDUSTRIAL DISPLAY MARKET, BY TYPE, 2019-2028 (USD MILLION)
TABLE 418 PHILIPPINES TRANSPORTATION IN OLED FOR INDUSTRIAL DISPLAY MARKET, BY TYPE, 2019-2028 (USD MILLION)
TABLE 419 PHILIPPINES METAL & MINING IN INDUSTRIAL DISPLAY MARKET, BY TECHNOLOGY, 2019-2028 (USD MILLION)
TABLE 420 PHILIPPINES METAL & MINING IN LED FOR INDUSTRIAL DISPLAY MARKET, BY TYPE, 2019-2028 (USD MILLION)
TABLE 421 PHILIPPINES METAL & MINING IN OLED FOR INDUSTRIAL DISPLAY MARKET, BY TYPE, 2019-2028 (USD MILLION)
TABLE 422 PHILIPPINES OTHERS IN INDUSTRIAL DISPLAY MARKET, BY TECHNOLOGY, 2019-2028 (USD MILLION)
TABLE 423 PHILIPPINES OTHERS IN LED FOR INDUSTRIAL DISPLAY MARKET, BY TYPE, 2019-2028 (USD MILLION)
TABLE 424 PHILIPPINES OTHERS IN OLED FOR INDUSTRIAL DISPLAY MARKET, BY TYPE, 2019-2028 (USD MILLION)
TABLE 425 REST OF ASIA–PACIFIC IN INDUSTRIAL DISPLAY MARKET, BY TYPE, 2019-2028 (USD MILLION)
Lista de figuras
FIGURE 1 ASIA PACIFIC INDUSTRIAL DISPLAY MARKET: SEGMENTATION
FIGURE 2 ASIA PACIFIC INDUSTRIAL DISPLAY MARKET: DATA TRIANGULATION
FIGURE 3 ASIA PACIFIC INDUSTRIAL DISPLAY MARKET: DROC ANALYSIS
FIGURE 4 ASIA PACIFIC INDUSTRIAL DISPLAY MARKET: ASIA PACIFIC VS REGIONAL MARKET ANALYSIS
FIGURE 5 ASIA PACIFIC INDUSTRIAL DISPLAY MARKET: COMPANY RESEARCH ANALYSIS
FIGURE 6 ASIA PACIFIC INDUSTRIAL DISPLAY MARKET: INTERVIEW DEMOGRAPHICS
FIGURE 8 ASIA PACIFIC INDUSTRIAL DISPLAY MARKET: VENDOR SHARE ANALYSIS
FIGURE 9 ASIA PACIFIC INDUSTRIAL DISPLAY MARKET: MARKET APPLICATION COVERAGE GRID
FIGURE 10 ASIA PACIFIC INDUSTRIAL DISPLAY MARKET: SEGMENTATION
FIGURE 11 RISING DEMAND FOR HUMAN MACHINE INTERFACE (HMI) APPLICATION IN MANUFACTURING AND PROCESS INDUSTRIES IS EXPECTED TO DRIVE THE ASIA PACIFIC INDUSTRIAL DISPLAY MARKET IN THE FORECAST PERIOD OF 2021 TO 2028
FIGURE 12 RUGGED DISPLAYS SEGMENT IS EXPECTED TO ACCOUNT FOR THE LARGEST SHARE OF ASIA PACIFIC INDUSTRIAL DISPLAY MARKET IN 2021 & 2028
FIGURE 13 NORTH AMERICA IS EXPECTED TO DOMINATE AND ASIA-PACIFIC IS THE FASTEST GROWING REGION IN THE ASIA PACIFIC INDUSTRIAL DISPLAY MARKET IN THE FORECAST PERIOD OF 2021 TO 2028
FIGURE 14 VALUE CHAIN ANALYSIS FRAMEWORK
FIGURE 15 DRIVERS, RESTRAINT, OPPORTUNITIES, AND CHALLENGES OF ASIA PACIFIC INDUSTRIAL DISPLAY MARKET
FIGURE 16 SHIPMENTS PROJECTION OF INSTALLATION BASED DIGITAL SIGNAGE DISPLAYS
FIGURE 17 OLED SMARTPHONE PANEL SHIPMENT
FIGURE 1 ASIA PACIFIC INDUSTRIAL DISPLAY MARKET: BY TYPE, 2020
FIGURE 2 ASIA PACIFIC INDUSTRIAL DISPLAY MARKET: BY PANEL SIZE, 2020
FIGURE 3 ASIA PACIFIC INDUSTRIAL DISPLAY MARKET: BY TECHNOLOGY, 2020
FIGURE 4 ASIA PACIFIC INDUSTRIAL DISPLAY MARKET: BY COMMUNICATION TYPE, 2020
FIGURE 5 ASIA PACIFIC INDUSTRIAL DISPLAY MARKET: BY APPLICATION, 2020
FIGURE 6 ASIA PACIFIC INDUSTRIAL DISPLAY MARKET: BY VERTICAL, 2020
FIGURE 7 ASIA PACIFIC INDUSTRIAL DISPLAY MARKET: SNAPSHOT (2020)
FIGURE 8 ASIA PACIFIC INDUSTRIAL DISPLAY MARKET: BY REGION (2020)
FIGURE 9 ASIA PACIFIC INDUSTRIAL DISPLAY MARKET: BY REGION (2021 & 2028)
FIGURE 10 ASIA PACIFIC INDUSTRIAL DISPLAY MARKET: BY REGION (2020 & 2028)
FIGURE 11 ASIA PACIFIC INDUSTRIAL DISPLAY MARKET: BY TYPE (2021-2028)
FIGURE 12 ASIA-PACIFIC INDUSTRIAL DISPLAY MARKET: SNAPSHOT (2020)
FIGURE 13 ASIA-PACIFIC INDUSTRIAL DISPLAY MARKET: BY COUNTRY (2020)
FIGURE 14 ASIA-PACIFIC INDUSTRIAL DISPLAY MARKET: BY COUNTRY (2021 & 2028)
FIGURE 15 ASIA-PACIFIC INDUSTRIAL DISPLAY MARKET: BY COUNTRY (2020 & 2028)
FIGURE 16 ASIA-PACIFIC INDUSTRIAL DISPLAY MARKET: BY TYPE (2021-2028)
FIGURE 17 ASIA PACIFIC INDUSTRIAL DISPLAY MARKET: COMPANY SHARE 2020 (%)
Metodología de investigación
La recopilación de datos y el análisis del año base se realizan utilizando módulos de recopilación de datos con muestras de gran tamaño. La etapa incluye la obtención de información de mercado o datos relacionados a través de varias fuentes y estrategias. Incluye el examen y la planificación de todos los datos adquiridos del pasado con antelación. Asimismo, abarca el examen de las inconsistencias de información observadas en diferentes fuentes de información. Los datos de mercado se analizan y estiman utilizando modelos estadísticos y coherentes de mercado. Además, el análisis de la participación de mercado y el análisis de tendencias clave son los principales factores de éxito en el informe de mercado. Para obtener más información, solicite una llamada de un analista o envíe su consulta.
La metodología de investigación clave utilizada por el equipo de investigación de DBMR es la triangulación de datos, que implica la extracción de datos, el análisis del impacto de las variables de datos en el mercado y la validación primaria (experto en la industria). Los modelos de datos incluyen cuadrícula de posicionamiento de proveedores, análisis de línea de tiempo de mercado, descripción general y guía del mercado, cuadrícula de posicionamiento de la empresa, análisis de patentes, análisis de precios, análisis de participación de mercado de la empresa, estándares de medición, análisis global versus regional y de participación de proveedores. Para obtener más información sobre la metodología de investigación, envíe una consulta para hablar con nuestros expertos de la industria.
Personalización disponible
Data Bridge Market Research es líder en investigación formativa avanzada. Nos enorgullecemos de brindar servicios a nuestros clientes existentes y nuevos con datos y análisis que coinciden y se adaptan a sus objetivos. El informe se puede personalizar para incluir análisis de tendencias de precios de marcas objetivo, comprensión del mercado de países adicionales (solicite la lista de países), datos de resultados de ensayos clínicos, revisión de literatura, análisis de mercado renovado y base de productos. El análisis de mercado de competidores objetivo se puede analizar desde análisis basados en tecnología hasta estrategias de cartera de mercado. Podemos agregar tantos competidores sobre los que necesite datos en el formato y estilo de datos que esté buscando. Nuestro equipo de analistas también puede proporcionarle datos en archivos de Excel sin procesar, tablas dinámicas (libro de datos) o puede ayudarlo a crear presentaciones a partir de los conjuntos de datos disponibles en el informe.

