
Asia-Pacific Hearing Aid Market, By Product Type (Hearing & Device, Hearing Implants, and Hearing & Accessories), Hearing Loss (Sensorineural Loss, Conductive Loss, Mixed Hearing Loss, Auditory Neuropathy Spectrum Disorder (ANSD)), Patient Type (Geriatric, Adults, Pediatrics), Technology (Digital Signal Processing, Wireless Hearing Aid, Directional Microphone Systems, Artificial Intelligence, Digital Noise Reduction, Feedback Management Systems, Data Logging, Telecoil, Tinnitus Masking, and Others), End-Users (Hospitals, Specialty Clinics, Home Care Settings, and Others), Distribution Channel (Direct Tender, Retail Pharmacy, Hospital Pharmacy, Online Sales, and Others), Industry Trends and Forecast to 2030.
Asia-Pacific Hearing Aid Market Analysis and Insights
The Asia-Pacific hearing aid market is rising steadily as a result of the increasing hearing loss cases in the region, especially in China, Japan, and India. Increasing awareness regarding the benefit of early diagnosis is considerably driving the Asia-Pacific market. Government Initiatives for hearing loss awareness in many countries are one of the elements driving the market's rapid rise.
Market players are expanding their product offerings in order to acquire a competitive advantage.
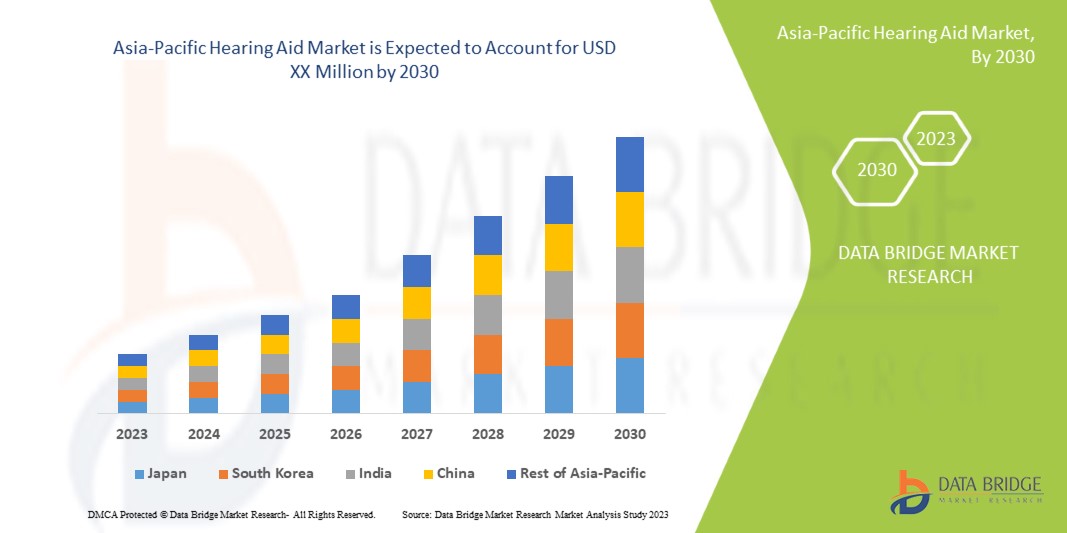
During the forecast period, manufacturers involved in the hearing aid market likely benefit significantly from increasing awareness regarding the benefits of early diagnosis in hearing loss case. Data Bridge Market Research analyses that the Asia-Pacific hearing aid market will grow at a CAGR of 9.7% during the forecast period of 2023 to 2030.
|
Report Metric |
Details |
|
Forecast Period |
2023 to 2030 |
|
Base Year |
2022 |
|
Historic Years |
2021 (Customizabe to 2020-2016) |
|
Quantitative Units |
Revenue in USD Million, Volumes in Units, Pricing in USD |
|
Segments Covered |
By Product Type (Hearing & Device, Hearing Implants, and Hearing & Accessories), Hearing Loss (Sensorineural Loss, Conductive Loss, Mixed Hearing Loss, Auditory Neuropathy Spectrum Disorder (ANSD)), Patient Type (Geriatric, Adults, Pediatrics), Technology (Digital Signal Processing, Wireless Hearing Aid, Directional Microphone Systems, Artificial Intelligence, Digital Noise Reduction, Feedback Management Systems, Data Logging, Telecoil, Tinnitus Masking, and Others), End-Users (Hospitals, Specialty Clinics, Home Care Settings, and Others), Distribution Channel (Direct Tender, Retail Pharmacy, Hospital Pharmacy, Online Sales, and Others). |
|
Countries Covered |
China, Japan, India, Australia, South Korea, Indonesia, Thailand, Singapore, Philippines, Malaysia, Vietnam, Taiwan, and the Rest of Asia-Pacific |
|
Market Players Covered |
Entre otros se encuentran: Sonova, WS Audiology A/S, GN Hearing, Arphi, Cochlear Ltd., Demant A/S, Medtronic, Eargo, Natus Medical Incorporated, Beltone Group, Zounds Hearing, Amplifoon, APLS, Starkey Laboratories, Inc., Unitron, Bernafon, Sonic Innovation, Inc., Austar Hearing Science and Technology (Xiamen) Con., Ltd., Boston Scientific Corporation, Rion Co. Ltd. y MED-EL Medical Electronics. |
Definición de mercado
Los audífonos, en su forma más básica, son micrófonos que traducen el sonido en impulsos eléctricos. Un amplificador aumenta la potencia de la señal antes de que un receptor la transforme nuevamente en sonido y la envíe al canal auditivo a través de un pequeño tubo o molde auditivo. Se necesita una batería para alimentar el audífono y permitir la amplificación. Los audífonos difieren en términos de diseño, tecnología de amplificación (analógica o digital) y características como conectividad inalámbrica y aplicaciones de software. En algunos audífonos se utilizan moldes auditivos o auriculares para dirigir el flujo de sonido hacia el oído y mejorar la calidad del sonido. El tipo y la gravedad de la pérdida auditiva, los requisitos auditivos y el estilo de vida influyen en la selección del audífono.
Dinámica del mercado de audífonos en Asia y el Pacífico
En esta sección se aborda la comprensión de los factores impulsores, las ventajas, las oportunidades, las limitaciones y los desafíos del mercado. Todo esto se analiza en detalle a continuación:
Conductores
-
Aumentar la conciencia sobre los beneficios del diagnóstico temprano
Asia es el continente más densamente poblado y, muy probablemente, el que alberga el mayor número de personas con pérdida auditiva. Según la OMS, esta cifra aumentará en gran medida de aquí a 2050. El cribado neonatal es el primer paso del actual procedimiento de cribado auditivo. El uso de estos procedimientos garantiza que cada recién nacido con pérdida auditiva permanente sea reconocido antes de los tres meses y reciba servicios de intervención oportunos y eficaces antes de los seis meses. La detección temprana de la pérdida auditiva es crucial porque los niños con pérdida auditiva suelen quedarse rezagados respecto de sus compañeros de clase en el desarrollo del habla y el lenguaje, las capacidades cognitivas y las habilidades sociales.
-
Iniciativa gubernamental para la concienciación sobre la pérdida auditiva
La inesperada falta de conocimientos sobre las enfermedades auditivas y la pérdida de audición en la sociedad persiste a pesar de que 360 millones de personas en todo el mundo padecen una pérdida auditiva discapacitante. Una de cada tres personas mayores de 65 años tiene pérdida auditiva. Sin embargo, menos del 3% de las personas reciben los audífonos necesarios. La otitis media crónica, que se presenta como un oído supurado, afecta a hasta 330 millones de personas en todo el mundo. La ignorancia es un factor importante que contribuye a la situación actual, que se agrava por la falta de servicios y personas, así como de recursos financieros para la salud auditiva y auditiva. Para contrarrestar esta situación, muchas organizaciones gubernamentales están interviniendo.
-
Avance tecnológico en el campo de la tecnología sanitaria
Los avances tecnológicos son de enorme importancia en el área de detección de pérdida auditiva y tecnología de audífonos. Los beneficios de los avances tecnológicos han llegado a casi todos los aspectos de la vida humana. Sin embargo, los beneficios más significativos se deben a los avances tecnológicos en el cuidado de la salud. Al desarrollar nuevas metodologías para el tratamiento, la tecnología del sistema de salud se vuelve más eficaz. Los avances tecnológicos recientes han salvado millones de vidas y han aumentado la calidad de vida.

Oportunidades
-
Aumento de la colaboración, fusión y adquisición entre los actores del mercado
Las iniciativas estratégicas de colaboración, fusión y adquisición por parte de los participantes del mercado de audífonos, como Cochlear, GN Hearing, William Demant y Philips, entre otros, han ayudado a los actores a ampliar su gama de productos. Esto ayuda proporcionalmente a aumentar la demanda de productos por parte de los consumidores y, por lo tanto, aumenta las ventas en el futuro. La demanda de audífonos está aumentando debido a los avances tecnológicos y la creciente incidencia de la pérdida auditiva en la región. Los principales participantes del mercado han implementado ciertos programas destinados a aumentar el funcionamiento y la rentabilidad del mercado de tratamiento de la migraña.
-
Aumenta el número de empresas que entran al mercado
Una de las enfermedades crónicas más comunes en todo el mundo es la pérdida de audición. Un informe de la OMS de 2022 estima que alrededor de 1.500 millones de personas en todo el mundo padecen pérdida de audición. Alrededor de 1.000 millones de jóvenes (de 12 a 35 años) en todo el mundo corren el riesgo de sufrir pérdida de audición como resultado de la exposición recreativa a ruidos elevados. La disponibilidad de aparatos auditivos se ve afectada por su asequibilidad.
Restricciones
-
Altos costos asociados con la fabricación del producto y la I+D
A muchos adultos les cuesta entender conversaciones, mirar televisión o escuchar determinados sonidos. La mayoría de las personas notarán una mejora significativa en todos los aspectos de su vida si usan audífonos. Lamentablemente, entre el 67 y el 86 % de las personas con pérdida auditiva no utilizan audífonos. Las personas no usan audífonos por diversos motivos.
-
Susceptible a la acumulación de cera.
Una persona que usa audífonos puede tener más probabilidades de experimentar problemas con la producción de cerumen. Los usuarios de audífonos tienen más probabilidades de desarrollar acumulación de cerumen porque la presencia de un cuerpo extraño en el oído puede estimular la producción de cerumen. Los oídos suelen limpiarse solos, pero la incorporación de un audífono puede impedir este proceso, aumentando la posibilidad de que el cerumen se acumule y endurezca.
Por lo tanto, se espera que la susceptibilidad a la acumulación de cera en los dispositivos auditivos restrinja el crecimiento del mercado.
Desafíos
- Disrupción en la industria de la cadena de suministro
La guerra por los semiconductores, en particular la disputa por las tecnologías de la información y la comunicación (TIC), es uno de los mayores problemas de Asia y el Pacífico que afectan a las cadenas de suministro de las industrias especializadas. La pandemia de COVID-19, que paralizó la producción y disparó el consumo de productos electrónicos domésticos en Asia y el Pacífico, fue la principal causa del conflicto. Sin embargo, el origen del problema es anterior al confinamiento en Asia y el Pacífico.
Por lo tanto, se espera que las disrupciones en la industria de la cadena de suministro pongan a prueba el crecimiento del mercado.
- Actualización de software muy lenta
Los cambios de software o firmware de los audífonos son un fenómeno más reciente. Las actualizaciones de firmware de los audífonos se han puesto a disposición en los últimos años, por lo que es necesario proporcionar actualizaciones de software y firmware en los audífonos. En este momento, varios fabricantes de audífonos ofrecen actualizaciones de software esporádicas para sus productos. Parece ser más común con los audífonos Bluetooth, a menudo conocidos como dispositivos auditivos hechos para iPhone. Los fabricantes de audífonos no siempre especifican en qué consisten las actualizaciones, aunque parecen lanzarse aproximadamente al mismo tiempo que se actualizan los sistemas operativos de iPhone. En realidad, esto no está a la altura de los requisitos del mercado.
Impacto de la COVID-19 en el mercado de audífonos de Asia y el Pacífico
La COVID-19 provocó un aumento repentino de la demanda de equipos médicos, incluidos los audífonos, pero también dio lugar a aplazamientos y cancelaciones de procedimientos electivos y no esenciales. Los fabricantes de dispositivos se vieron muy afectados económicamente durante los meses más afectados por la pandemia, de marzo a abril de 2020. Muchos de estos mercados de dispositivos ya se habían recuperado en el segundo semestre de 2020.
Otros mercados de dispositivos, en particular los que se emplean en operaciones críticas, como las relacionadas con las enfermedades cardiovasculares, se vieron menos afectados por la pandemia en general. A principios de 2021, prácticamente todos los mercados de dispositivos médicos se habían recuperado por completo de la considerable caída inicial de las ventas de dispositivos provocada por la pandemia. La pandemia de COVID-19, que paralizó la fabricación de automóviles y disparó el consumo de productos electrónicos domésticos en Asia y el Pacífico, fue la principal causa del conflicto. Sin embargo, el origen del problema es anterior al confinamiento en Asia y el Pacífico.
Los gobiernos y los fabricantes de audífonos de todo el mundo han reaccionado a la actual escasez de chips semiconductores en Asia y el Pacífico aumentando la producción y evitando futuras escaseces.
Desarrollo reciente
- En abril de 2022, Cochlear Limited, líder en Asia-Pacífico en soluciones auditivas implantables, anunció la adquisición de Oticon Medical. Esto ayudó a la empresa a hacerse cargo de las actividades comerciales de implantes auditivos de Demant, lo que ha ayudado a la empresa a aumentar su oferta en el mercado.
Alcance del mercado de audífonos en Asia y el Pacífico
El mercado de audífonos de Asia-Pacífico está segmentado en función del tipo de producto, la pérdida auditiva, el tipo de paciente, la tecnología, los usuarios finales y el canal de distribución. El crecimiento entre estos segmentos le ayudará a analizar los segmentos de crecimiento escaso en las industrias y brindará a los usuarios una valiosa descripción general del mercado y conocimientos del mercado para ayudarlos a tomar decisiones estratégicas para identificar las principales aplicaciones del mercado.
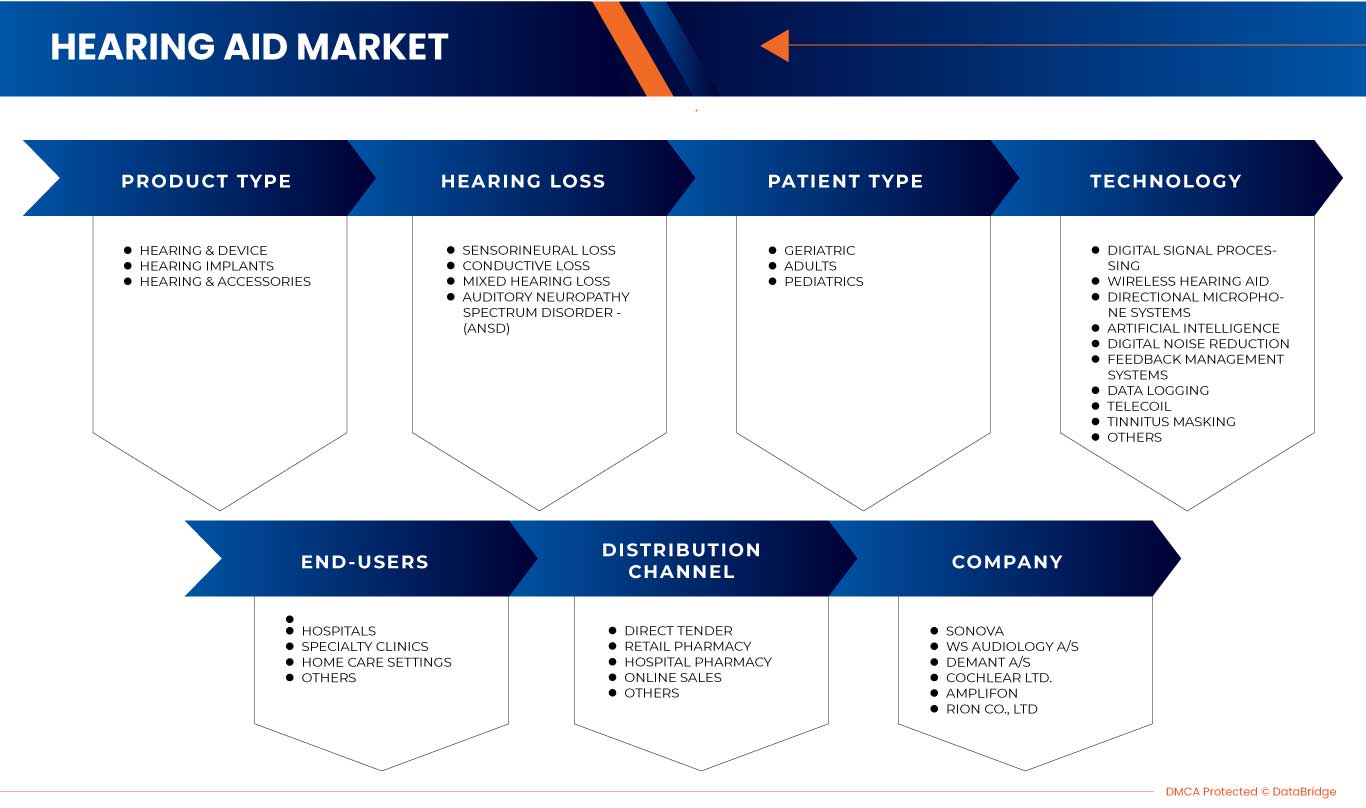
Tipo de producto
- Audición y dispositivo
- Implantes auditivos
- Audición y accesorios
Según el tipo de producto, el mercado de audífonos de Asia-Pacífico está segmentado en audición y dispositivos, implantes auditivos y audición y accesorios.
Pérdida de audición
- Pérdida neurosensorial
- Pérdida conductiva
- Pérdida auditiva mixta
- Trastorno del espectro de la neuropatía auditiva (ANSD)
Sobre la base de la pérdida auditiva, el mercado de audífonos de Asia-Pacífico está segmentado en pérdida neurosensorial, pérdida conductiva, pérdida auditiva mixta y trastorno del espectro de neuropatía auditiva (ANSD).
Tipo de paciente
- Geriátrico
- Adultos
- Pediatría
Según el tipo de paciente, el mercado de audífonos de Asia-Pacífico está segmentado en geriátrico, adultos y pediátrico.
Tecnología
- Procesamiento de señales digitales
- Audífono inalámbrico
- Sistemas de micrófonos direccionales
- Inteligencia artificial
- Reducción de ruido digital
- Sistemas de gestión de retroalimentación
- Registro de datos
- Bobina telefónica
- Enmascaramiento del tinnitus
- Otros
Sobre la base de la tecnología, el mercado de audífonos de Asia y el Pacífico está segmentado en procesamiento de señales digitales, audífonos inalámbricos, sistemas de micrófonos direccionales, inteligencia artificial, reducción de ruido digital, sistemas de gestión de retroalimentación, registro de datos, telebobina, enmascaramiento de tinnitus y otros.
Usuarios finales
- Hospitales
- Clínicas especializadas
- Entornos de atención domiciliaria
- Otros
Sobre la base de los usuarios finales, el mercado de audífonos de Asia-Pacífico está segmentado en hospitales, clínicas especializadas, entornos de atención domiciliaria y otros.
Canal de distribución
- Licitación directa
- Farmacia minorista
- Farmacia hospitalaria
- Ventas en línea
- Otros
Sobre la base del canal de distribución, el mercado de audífonos de Asia-Pacífico está segmentado en licitación directa, farmacia minorista, farmacia hospitalaria, ventas en línea y otros.
Análisis y perspectivas regionales del mercado de audífonos en Asia y el Pacífico
Se analiza el mercado de audífonos de Asia-Pacífico y se proporcionan información y tendencias del tamaño del mercado por tipo de producto, pérdida auditiva, tipo de paciente, tecnología, usuario final y canal de distribución.
Los países cubiertos en el informe del mercado de audífonos de Asia-Pacífico son China, Japón, India, Australia, Corea del Sur, Indonesia, Tailandia, Singapur, Filipinas, Malasia, Vietnam, Taiwán y el resto de Asia-Pacífico.
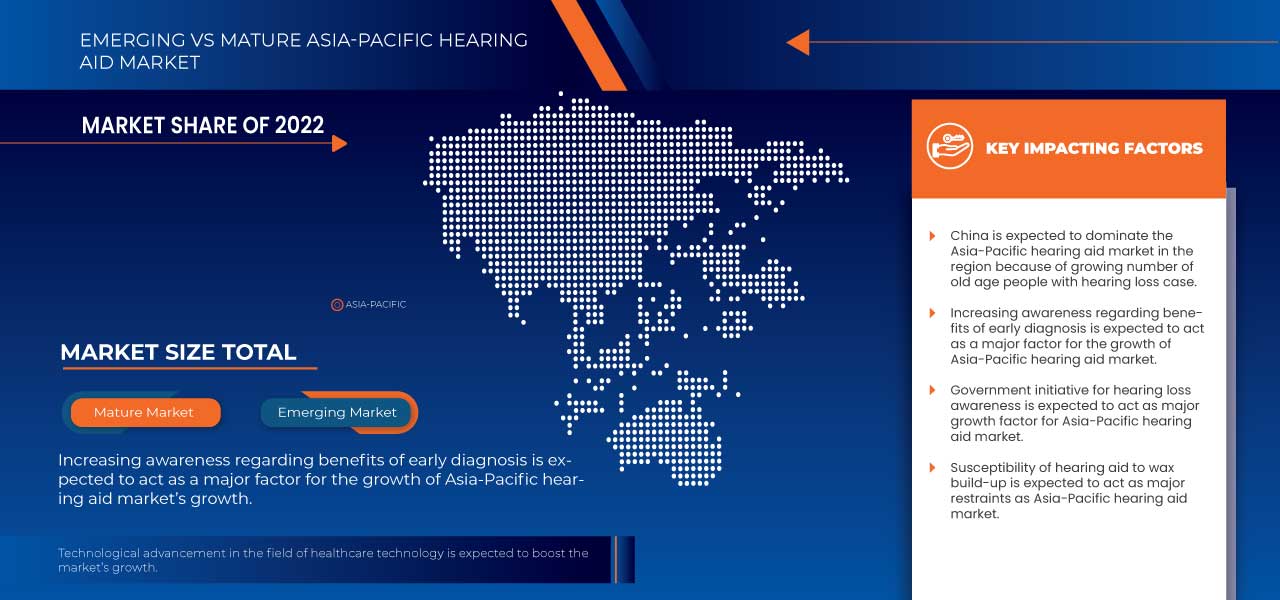
- Se espera que en 2023, China domine el mercado de audífonos de Asia-Pacífico debido al creciente número de personas mayores.
La sección de países del informe también proporciona factores individuales que impactan en el mercado y cambios en las regulaciones en el mercado a nivel nacional que afectan las tendencias actuales y futuras del mercado. Los puntos de datos como nuevas ventas, ventas de reemplazo, demografía del país, epidemiología de enfermedades y aranceles de importación y exportación son algunos de los principales indicadores utilizados para pronosticar el escenario del mercado para países individuales. Además, la presencia y disponibilidad de marcas de Asia-Pacífico y sus desafíos enfrentados debido a la competencia grande o escasa de las marcas locales y nacionales, el impacto de los canales de venta se consideran al proporcionar un análisis de pronóstico de los datos del país.
Análisis del panorama competitivo y de la cuota de mercado de audífonos en Asia-Pacífico
El panorama competitivo del mercado de audífonos de Asia-Pacífico proporciona detalles por competidor. Los detalles incluidos son una descripción general de la empresa, las finanzas de la empresa, los ingresos generados, el potencial de mercado, la inversión en investigación y desarrollo, las nuevas iniciativas de mercado, la presencia en Asia-Pacífico, los sitios e instalaciones de producción, las capacidades de producción, las fortalezas y debilidades de la empresa, el lanzamiento de soluciones, la amplitud y variedad de productos y el dominio de las aplicaciones. Los puntos de datos anteriores proporcionados solo están relacionados con el enfoque de las empresas en relación con el mercado de audífonos de Asia-Pacífico.
Algunos de los principales actores que operan en el mercado de audífonos de Asia-Pacífico son Sonova, WS Audiology A/S, GN Hearing, Arphi, Cochlear Ltd., Demant A/S, Medtronic, Eargo, Natus Medical Incorporated, Beltone Group, Zounds Hearing, Amplifoon, APLS, Starkey Laboratories, Inc., Unitron, Bernafon, Sonic Innovation, Inc., Austar Hearing Science and Technology (Xiamen) Con., Ltd., Boston Scientific Corporation, Rion Co. Ltd. y MED-EL Medical Electronics, entre otros.
SKU-
Obtenga acceso en línea al informe sobre la primera nube de inteligencia de mercado del mundo

- Panel de análisis de datos interactivo
- Panel de análisis de empresas para oportunidades con alto potencial de crecimiento
- Acceso de analista de investigación para personalización y consultas
- Análisis de la competencia con panel interactivo
- Últimas noticias, actualizaciones y análisis de tendencias
- Aproveche el poder del análisis de referencia para un seguimiento integral de la competencia
Tabla de contenido
1 INTRODUCTION
1.1 OBJECTIVES OF THE STUDY
1.2 MARKET DEFINITION
1.3 OVERVIEW OF THE ASIA-PACIFIC HEARING AID MARKET
1.4 LIMITATIONS
1.5 MARKETS COVERED
2 MARKET SEGMENTATION
2.1 MARKETS COVERED
2.2 GEOGRAPHICAL SCOPE
2.3 YEARS CONSIDERED FOR THE STUDY
2.4 CURRENCY AND PRICING
2.5 DBMR TRIPOD DATA VALIDATION MODEL
2.6 PRODUCT TYPE TIMELINE CURVE
2.7 MULTIVARIATE MODELING
2.8 PRIMARY INTERVIEWS WITH KEY OPINION LEADERS
2.9 DBMR MARKET POSITION GRID
2.1 MARKET APPLICATION COVERAGE GRID
2.11 VENDOR SHARE ANALYSIS
2.12 SECONDARY SOURCES
2.13 ASSUMPTIONS
3 EXECUTIVE SUMMARY
4 PREMIUM INSIGHTS
4.1 PORTER’S FIVE FORCES
4.2 PESTEL ANALYSIS
4.3 TECHNOLOGICAL INNOVATION
4.4 KEY STRATEGIC INITIATIVE
4.5 REVIEW FROM END-USER
4.5.1 BY PRODUCT/BRAND
4.5.2 BY COMPANY
4.6 DIGITAL HEALTH REGULATION IN ASIA-PACIFIC
4.6.1 AUSTRALIA
4.6.1.1 REGULATION
4.6.1.2 RISK CLASSIFICATION
4.6.1.3 REGISTRATION PATHWAYS
4.6.2 INDIA
4.6.2.1 REGULATION
4.6.2.2 RISK CLASSIFICATION
4.6.2.3 REGISTRATION PATHWAYS
4.6.3 JAPAN
4.6.3.1 REGULATION
4.6.3.2 RISK CLASSIFICATION
4.6.3.3 REGISTRATION PATHWAYS
4.6.4 SINGAPORE
4.6.4.1 REGULATION
4.6.4.2 RISK CLASSIFICATION
4.6.4.3 REGISTRATION PATHWAYS
4.6.5 SOUTH KOREA
4.6.5.1 REGULATION
4.6.5.2 RISK CLASSIFICATION
4.6.5.3 REGISTRATION PATHWAYS
5 EPIDEMIOLOGY
5.1 OVERVIEW
5.2 PREVALENCE OF SENSORINEURAL HEARING LOSS, BY AGE GROUP
5.3 PREVALENCE OF CONDUCTIVE HEARING LOSS, BY AGE GROUP
6 REGIONAL SUMMARY
7 MARKET OVERVIEW
7.1 DRIVERS
7.1.1 INCREASING PREVALENCE OF HEARING LOSS CASES
7.1.2 INCREASING AWARENESS REGARDING THE BENEFITS OF EARLY DIAGNOSIS
7.1.3 GOVERNMENT INITIATIVE FOR HEARING LOSS AWARENESS
7.1.4 TECHNOLOGICAL ADVANCEMENT IN THE FIELD OF HEALTHCARE TECHNOLOGY
7.2 RESTRAINTS
7.2.1 HIGH COST ATTACHED WITH THE PRODUCT MANUFACTURING AND R&D
7.2.2 SUSCEPTIBLE TO WAX BUILD-UP
7.3 OPPORTUNITIES
7.3.1 RISING COLLABORATION, MERGER, & ACQUISITION AMONG THE MARKET PLAYERS
7.3.2 INCREASING INVESTMENTS IN HEALTHCARE SEGMENTS
7.3.3 BENEFITS ASSOCIATED WITH HEARING AIDS
7.3.4 RISING NUMBER OF COMPANIES ENTERING MARKET
7.4 CHALLENGES
7.4.1 DISRUPTION IN SUPPLY CHAIN INDUSTRY
7.4.2 VERY SLOW SOFTWARE UPGRADATION
8 ASIA-PACIFIC HEARING AID MARKET, BY PRODUCT TYPE
8.1 OVERVIEW
8.2 HEARING AID DEVICE
8.2.1 RECEIVER-IN-EAR HEARING AIDS (RIC)
8.2.1.1 RECHARGEABLE
8.2.1.2 NON-RECHARGEABLE
8.2.2 BEHIND-THE-EAR HEARING AIDS (BTE)
8.2.2.1 STANDARD BEHIND-THE EAR HEARING
8.2.2.1.1 RECHARGEABLE
8.2.2.1.2 NON-RECHARGEABLE
8.2.2.2 POWER PLUS BEHIND-THE EAR HEARING
8.2.2.2.1 RECHARGEABLE
8.2.2.2.2 NON-RECHARGEABLE
8.2.3 IN-THE-EAR-HEARING AIDS (ITE)
8.2.3.1 RECHARGEABLE
8.2.3.2 NON-RECHARGEABLE
8.2.4 IN-THE-CANAL (ITC) HEARING AIDS
8.2.5 COMPLETELY-IN-CANAL (CIC) HEARING AIDS
8.2.6 INVISIBLE-IN-CANAL (IIC) HEARING AIDS
8.3 HEARING IMPLANTS
8.3.1 COCHLEAR IMPLANTS
8.3.2 BONE CONDUCTION DEVICES
8.3.3 MIDDLE EAR IMPLANTS
8.3.4 AUDITORY BRAIN STEM IMPLANTS
8.4 HEARING AID ACCESSORIES
8.4.1 HEARING AID BATTERIES
8.4.2 WIRELESS ACCESSORIES
8.4.2.1 MICROPHONE
8.4.2.2 RECEIVER
8.4.2.3 REMOTE
8.4.3 HEARING PROTECTION
8.4.4 WAX GUARD FILTERS
8.4.5 OTHERS
9 ASIA-PACIFIC HEARING AID MARKET, BY HEARING LOSS
9.1 OVERVIEW
9.2 SENSORINEURAL LOSS
9.2.1 HEARING AID DEVICE
9.2.2 HEARING & IMPLANTS
9.2.3 HEARING AID ACCESSORIES
9.3 CONDUCTIVE LOSS
9.3.1 HEARING AID DEVICE
9.3.2 HEARING & IMPLANTS
9.3.3 HEARING AID ACCESSORIES
9.4 MIXED HEARING LOSS
9.4.1 HEARING AID DEVICE
9.4.2 HEARING & IMPLANTS
9.4.3 HEARING AID ACCESSORIES
9.5 AUDITORY NEUROPATHY SPECTRUM DISORDER (ANSD)
9.5.1 HEARING AID DEVICE
9.5.2 HEARING & IMPLANTS
9.5.3 HEARING AID ACCESSORIES
10 ASIA-PACIFIC HEARING AID MARKET, BY PATIENT TYPE
10.1 OVERVIEW
10.2 GERIATRIC
10.3 ADULTS
10.4 PEDIATRICS
11 ASIA-PACIFIC HEARING AID MARKET, BY TECHNOLOGY
11.1 OVERVIEW
11.2 DIGITAL SIGNAL PROCESSING
11.3 WIRELESS HEARING AID
11.3.1 BLUETOOTH COMPATIBILITY
11.3.2 FM COMPATIBILITY
11.4 DIRECTIONAL MICROPHONE SYSTEMS
11.5 ARTIFICIAL INTELLIGENCE
11.6 DIGITAL NOISE REDUCTION
11.6.1 IMPULSE NOISE REDUCTION
11.6.2 WIND NOISE REDUCTION
11.7 FEEDBACK MANAGEMENT SYSTEMS
11.8 DATA LOGGING
11.9 TELECOIL
11.1 TINNITUS MASKING
11.11 OTHERS
12 ASIA-PACIFIC HEARING AID MARKET, BY END-USERS
12.1 OVERVIEW
12.2 HOSPITALS
12.3 SPECIALTY CLINICS
12.4 HOME CARE SETTINGS
12.5 OTHERS
13 ASIA-PACIFIC HEARING AID MARKET, BY DISTRIBUTION CHANNEL
13.1 OVERVIEW
13.2 DIRECT TENDER
13.3 RETAIL PHARMACY
13.4 HOSPITAL PHARMACY
13.5 ONLINE SALES
13.6 OTHERS
14 ASIA-PACIFIC HEARING AID MARKET, BY COUNTRY
14.1 CHINA
14.2 JAPAN
14.3 INDIA
14.4 AUSTRALIA
14.5 SOUTH KOREA
14.6 INDONESIA
14.7 THAILAND
14.8 SINGAPORE
14.9 PHILIPPINES
14.1 MALAYSIA
14.11 VIETNAM
14.12 TAIWAN
14.13 REST OF ASIA-PACIFIC
15 ASIA-PACIFIC HEARING AID MARKET: COMPANY LANDSCAPE
15.1 COMPANY SHARE ANALYSIS: ASIA-PACIFIC
15.1.1 COMPANY SHARE ANALYSIS: CHINA
15.1.2 COMPANY SHARE ANALYSIS: JAPAN
15.1.3 COMPANY SHARE ANALYSIS: INDIA
15.1.4 COMPANY SHARE ANALYSIS: AUSTRALIA
15.1.5 COMPANY SHARE ANALYSIS: SOUTH KOREA
15.1.6 COMPANY SHARE ANALYSIS: INDONESIA
15.1.7 COMPANY SHARE ANALYSIS: THAILAND
15.1.8 COMPANY SHARE ANALYSIS: SINGAPORE
15.1.9 COMPANY SHARE ANALYSIS: PHILIPPINES
15.1.10 COMPANY SHARE ANALYSIS: MALAYSIA
15.1.11 COMPANY SHARE ANALYSIS: VIETNAM
15.1.12 COMPANY SHARE ANALYSIS: TAIWAN
16 SWOT ANALYSIS
17 COMPANY PROFILES
17.1 SONOVA
17.1.1 COMPANY SNAPSHOT
17.1.2 REVENUE ANALYSIS
17.1.3 SOLUTION PORTFOLIO
17.1.4 RECENT DEVELOPMENTS
17.2 WS AUDIOLOGY A/S
17.2.1 COMPANY SNAPSHOT
17.2.2 PRODUCT PORTFOLIO
17.2.3 RECENT DEVELOPMENTS
17.3 DEMANT A/S
17.3.1 COMPANY SNAPSHOT
17.3.2 REVENUE ANALYSIS
17.3.3 SOLUTION PORTFOLIO
17.3.4 RECENT DEVELOPMENTS
17.4 COCHLEAR LTD.
17.4.1 COMPANY SNAPSHOT
17.4.2 PRODUCT PORTFOLIO
17.4.3 RECENT DEVELOPMENTS
17.5 AMPLIFON
17.5.1 COMPANY SNAPSHOT
17.5.2 REVENUE ANALYSIS
17.5.3 SOLUTION PORTFOLIO
17.5.4 RECENT DEVELOPMENTS
17.6 ALPS
17.6.1 COMPANY SNAPSHOT
17.6.2 PRODUCT PORTFOLIO
17.6.3 RECENT DEVELOPMENTS
17.7 ARPHI
17.7.1 COMPANY SNAPSHOT
17.7.2 PRODUCT PORTFOLIO
17.7.3 RECENT DEVELOPMENTS
17.8 AUSTAR HEARING SCIENCE AND TECHNOLOGY (XIAMEN) CO., LTD.
17.8.1 COMPANY SNAPSHOT
17.8.2 PRODUCT PORTFOLIO
17.8.3 RECENT DEVELOPMENTS
17.9 BELTONE GROUP
17.9.1 COMPANY SNAPSHOT
17.9.2 PRODUCT PORTFOLIO
17.9.3 RECENT DEVELOPMENTS
17.1 BERNAFON
17.10.1 COMPANY SNAPSHOT
17.10.2 PRODUCT PORTFOLIO
17.10.3 RECENT DEVELOPMENTS
17.11 BOSTON SCIENTIFIC CORPORATION
17.11.1 COMPANY SNAPSHOT
17.11.2 REVENUE ANALYSIS
17.11.3 PRODUCT PORTFOLIO
17.11.4 RECENT DEVELOPMENTS
17.12 EARGO INC.
17.12.1 COMPANY SNAPSHOT
17.12.2 REVENUE ANALYSIS
17.12.3 PRODUCT PORTFOLIO
17.12.4 RECENT DEVELOPMENTS
17.13 GN HEARING
17.13.1 COMPANY SNAPSHOT
17.13.2 PRODUCT PORTFOLIO
17.13.3 RECENT DEVELOPMENTS
17.14 MED-EL MEDICAL ELECTRONICS.
17.14.1 COMPANY SNAPSHOT
17.14.2 SOLUTION PORTFOLIO
17.14.3 RECENT DEVELOPMENTS
17.15 MEDTRONIC
17.15.1 COMPANY SNAPSHOT
17.15.2 REVENUE ANALYSIS
17.15.3 PRODUCT PORTFOLIO
17.15.4 RECENT DEVELOPMENTS
17.16 NATUS MEDICAL INCORPORATED
17.16.1 COMPANY SNAPSHOT
17.16.2 REVENUE ANALYSIS
17.16.3 PRODUCT PORTFOLIO
17.16.4 RECENT DEVELOPMENTS
17.17 RION CO., LTD.
17.17.1 COMPANY SNAPSHOT
17.17.2 REVENUE ANALYSIS
17.17.3 PRODUCT PORTFOLIO
17.17.4 RECENT DEVELOPMENTS
17.18 SONIC INNOVATIONS, INC.
17.18.1 COMPANY SNAPSHOT
17.18.2 PRODUCT PORTFOLIO
17.18.3 RECENT DEVELOPMENTS
17.19 STARKEY LABORATORIES, INC.
17.19.1 COMPANY SNAPSHOT
17.19.2 PRODUCT PORTFOLIO
17.19.3 RECENT DEVELOPMENTS
17.2 UNITRON
17.20.1 COMPANY SNAPSHOT
17.20.2 PRODUCT PORTFOLIO
17.20.3 RECENT DEVELOPMENTS
17.21 ZOUNDS HEARING
17.21.1 COMPANY SNAPSHOT
17.21.2 PRODUCT PORTFOLIO
17.21.3 RECENT DEVELOPMENTS
18 QUESTIONNAIRE
19 RELATED REPORTS
Lista de Tablas
TABLE 1 FOLLOWING ARE THE UAE STANDARDS FOR ELECTRICAL MOTOR VEHICLES:
TABLE 2 ADDITIONAL STANDARDS:
TABLE 3 COMPETITIVE EV BRANDS IN THE GLOBAL MARKET
TABLE 4 BEV PRICE TABLE
TABLE 5 PHEV PRICE TABLE
TABLE 6 MIDDLE EAST AND AFRICA ELECTRIC VEHICLE MARKET, BY PROPULSION TYPE, 2021-2030 (USD MILLION)
TABLE 7 MIDDLE EAST AND AFRICA ELECTRIC VEHICLE MARKET, BY PROPULSION TYPE, 2021-2030 (THOUSAND UNITS)
TABLE 8 MIDDLE EAST AND AFRICA BATTERY ELECTRIC VEHICLE (BEV) IN ELECTRIC VEHICLE MARKET, BY POWER OUTPUT, 2021-2030 (USD MILLION)
TABLE 9 MIDDLE EAST AND AFRICA BATTERY ELECTRIC VEHICLE (BEV) IN ELECTRIC VEHICLE MARKET, BY POWER OUTPUT, 2021-2030 (THOUSAND UNITS)
TABLE 10 MIDDLE EAST AND AFRICA PLUG-IN HYBRID ELECTRIC VEHICLE (PHEV) IN ELECTRIC VEHICLE MARKET, BY POWER OUTPUT, 2021-2030 (USD MILLION)
TABLE 11 MIDDLE EAST AND AFRICA PLUG-IN HYBRID ELECTRIC VEHICLE (PHEV) IN ELECTRIC VEHICLE MARKET, BY POWER OUTPUT, 2021-2030 (THOUSAND UNITS)
TABLE 12 MIDDLE EAST AND AFRICA FUEL CELL ELECTRIC VEHICLE (FCEV) IN ELECTRIC VEHICLE MARKET, BY POWER OUTPUT, 2021-2030 (USD MILLION)
TABLE 13 MIDDLE EAST AND AFRICA FUEL CELL ELECTRIC VEHICLE (FCEV) IN ELECTRIC VEHICLE MARKET, BY POWER OUTPUT, 2021-2030 (THOUSAND UNITS)
TABLE 14 MIDDLE EAST AND AFRICA ICE AND MICRO HYBRID VEHICLE IN ELECTRIC VEHICLE MARKET, BY POWER OUTPUT, 2021-2030 (USD MILLION)
TABLE 15 MIDDLE EAST AND AFRICA ICE AND MICRO HYBRID VEHICLE IN ELECTRIC VEHICLE MARKET, BY POWER OUTPUT, 2021-2030 (THOUSAND UNITS)
TABLE 16 MIDDLE EAST AND AFRICA ELECTRIC VEHICLE MARKET, BY VEHICLE DRIVE TYPE, 2021-2030 (USD MILLION)
TABLE 17 MIDDLE EAST AND AFRICA ELECTRIC VEHICLE MARKET, BY VEHICLE DRIVE TYPE, 2021-2030 (THOUSAND UNITS)
TABLE 18 MIDDLE EAST AND AFRICA ELECTRIC VEHICLE MARKET, BY VEHICLE SPEED, 2021-2030 (USD MILLION)
TABLE 19 MIDDLE EAST AND AFRICA ELECTRIC VEHICLE MARKET, BY VEHICLE SPEED, 2021-2030 (THOUSAND UNITS)
TABLE 20 MIDDLE EAST AND AFRICA ELECTRIC VEHICLE MARKET, BY VEHICLE CLASS, 2021-2030 (USD MILLION)
TABLE 21 MIDDLE EAST AND AFRICA ELECTRIC VEHICLE MARKET, BY VEHICLE CLASS, 2021-2030 (THOUSAND UNITS)
TABLE 22 MIDDLE EAST AND AFRICA ELECTRIC VEHICLE MARKET, BY SALES CHANNEL, 2021-2030 (USD MILLION)
TABLE 23 MIDDLE EAST AND AFRICA ELECTRIC VEHICLE MARKET, BY SALES CHANNEL, 2021-2030 (THOUSAND UNITS)
TABLE 24 MIDDLE EAST AND AFRICA ELECTRIC VEHICLE MARKET, BY POWER OUTPUT, 2021-2030 (USD MILLION)
TABLE 25 MIDDLE EAST AND AFRICA ELECTRIC VEHICLE MARKET, BY POWER OUTPUT, 2021-2030 (THOUSAND UNITS)
TABLE 26 MIDDLE EAST AND AFRICA ELECTRIC VEHICLE MARKET, BY ELECTRIC MOTOR TYPE, 2021-2030 (USD MILLION)
TABLE 27 MIDDLE EAST AND AFRICA ELECTRIC VEHICLE MARKET, BY ELECTRIC MOTOR TYPE, 2021-2030 (THOUSAND UNITS)
TABLE 28 MIDDLE EAST AND AFRICA ELECTRIC VEHICLE MARKET, BY VOLTAGE RANGE, 2021-2030 (USD MILLION)
TABLE 29 MIDDLE EAST AND AFRICA ELECTRIC VEHICLE MARKET, BY VOLTAGE RANGE, 2021-2030 (THOUSAND UNITS)
TABLE 30 MIDDLE EAST AND AFRICA ELECTRIC VEHICLE MARKET, BY CHARGING STATION TYPE, 2021-2030 (USD MILLION)
TABLE 31 MIDDLE EAST AND AFRICA ELECTRIC VEHICLE MARKET, BY CHARGING STATION TYPE, 2021-2030 (THOUSAND UNITS)
TABLE 32 MIDDLE EAST AND AFRICA NORMAL CHARGING IN ELECTRIC VEHICLE MARKET, BY LEVEL TYPE, 2021-2030 (USD MILLION)
TABLE 33 MIDDLE EAST AND AFRICA NORMAL CHARGING IN ELECTRIC VEHICLE MARKET, BY LEVEL TYPE, 2021-2030 (THOUSAND UNITS)
TABLE 34 MIDDLE EAST AND AFRICA SUPER CHARGING IN ELECTRIC VEHICLE MARKET, BY LEVEL TYPE, 2021-2030 (USD MILLION)
TABLE 35 MIDDLE EAST AND AFRICA SUPER CHARGING IN ELECTRIC VEHICLE MARKET, BY LEVEL TYPE, 2021-2030 (THOUSAND UNITS)
TABLE 36 MIDDLE EAST AND AFRICA ELECTRIC VEHICLE MARKET, BY CONNECTIVITY TYPE, 2021-2030 (USD MILLION)
TABLE 37 MIDDLE EAST AND AFRICA ELECTRIC VEHICLE MARKET, BY CONNECTIVITY TYPE, 2021-2030 (THOUSAND UNITS)
TABLE 38 MIDDLE EAST AND AFRICA ELECTRIC VEHICLE MARKET, BY POWER TRAIN, 2021-2030 (USD MILLION)
TABLE 39 MIDDLE EAST AND AFRICA ELECTRIC VEHICLE MARKET, BY POWER TRAIN, 2021-2030 (THOUSAND UNITS)
TABLE 40 MIDDLE EAST AND AFRICA ELECTRIC VEHICLE MARKET, BY VEHICLE TYPE, 2021-2030 (USD MILLION)
TABLE 41 MIDDLE EAST AND AFRICA ELECTRIC VEHICLE MARKET, BY VEHICLE TYPE, 2021-2030 (THOUSAND UNITS)
TABLE 42 MIDDLE EAST AND AFRICA PASSENGER CARS IN ELECTRIC VEHICLE MARKET, BY TYPE, 2021-2030 (USD MILLION)
TABLE 43 MIDDLE EAST AND AFRICA PASSENGER CARS IN ELECTRIC VEHICLE MARKET, BY TYPE, 2021-2030 (THOUSAND UNITS)
TABLE 44 MIDDLE EAST AND AFRICA COMMERCIAL VEHICLE IN ELECTRIC VEHICLE MARKET, BY TYPE, 2021-2030 (USD MILLION)
TABLE 45 MIDDLE EAST AND AFRICA COMMERCIAL VEHICLE IN ELECTRIC VEHICLE MARKET, BY TYPE, 2021-2030 (THOUSAND UNITS)
TABLE 46 MIDDLE EAST AND AFRICA LIGHT COMMERCIAL VEHICLE (LCV) IN ELECTRIC VEHICLE MARKET, BY TYPE, 2021-2030 (USD MILLION)
TABLE 47 MIDDLE EAST AND AFRICA LIGHT COMMERCIAL VEHICLE (LCV) IN ELECTRIC VEHICLE MARKET, BY TYPE, 2021-2030 (THOUSAND UNITS)
TABLE 48 MIDDLE EAST AND AFRICA HEAVY COMMERCIAL VEHICLE (HCV) IN ELECTRIC VEHICLE MARKET, BY TYPE, 2021-2030 (USD MILLION)
TABLE 49 MIDDLE EAST AND AFRICA HEAVY COMMERCIAL VEHICLE (HCV) IN ELECTRIC VEHICLE MARKET, BY TYPE, 2021-2030 (THOUSAND UNITS)
TABLE 50 MIDDLE EAST AND AFRICA ELECTRIC VEHICLE MARKET, BY BATTERY FORM, 2021-2030 (USD MILLION)
TABLE 51 MIDDLE EAST AND AFRICA ELECTRIC VEHICLE MARKET, BY BATTERY FORM, 2021-2030 (THOUSAND UNITS)
TABLE 52 MIDDLE EAST AND AFRICA ELECTRIC VEHICLE MARKET, BY BATTERY TYPE, 2021-2030 (USD MILLION)
TABLE 53 MIDDLE EAST AND AFRICA ELECTRIC VEHICLE MARKET, BY BATTERY FORM, 2021-2030 (THOUSAND UNITS)
TABLE 54 MIDDLE EAST & AFRICA ELECTRIC VEHICLE MARKET, BY COUNTRY, 2021-2030 (USD MILLION)
TABLE 55 MIDDLE EAST & AFRICA ELECTRIC VEHICLE MARKET, BY COUNTRY, 2021-2030 (THOUSAND UNITS)
TABLE 56 SAUDI ARABIA ELECTRIC VEHICLE MARKET, BY VEHICLE CLASS, 2021-2030 (USD MILLION)
TABLE 57 SAUDI ARABIA ELECTRIC VEHICLE MARKET, BY VEHICLE CLASS, 2021-2030 (THOUSAND UNITS)
TABLE 58 SAUDI ARABIA ELECTRIC VEHICLE MARKET, BY VEHICLE DRIVE TYPE, 2021-2030 (USD MILLION)
TABLE 59 SAUDI ARABIA ELECTRIC VEHICLE MARKET, BY VEHICLE DRIVE TYPE, 2021-2030 (THOUSAND UNITS)
TABLE 60 SAUDI ARABIA ELECTRIC VEHICLE MARKET, BY ELECTRIC MOTOR TYPE, 2021-2030 (USD MILLION)
TABLE 61 SAUDI ARABIA ELECTRIC VEHICLE MARKET, BY ELECTRIC MOTOR TYPE, 2021-2030 (THOUSAND UNITS)
TABLE 62 SAUDI ARABIA ELECTRIC VEHICLE MARKET, BY VEHICLE SPEED, 2021-2030 (USD MILLION)
TABLE 63 SAUDI ARABIA ELECTRIC VEHICLE MARKET, BY VEHICLE SPEED, 2021-2030 (THOUSAND UNITS)
TABLE 64 SAUDI ARABIA ELECTRIC VEHICLE MARKET, BY CHARGING STATION TYPE, 2021-2030 (USD MILLION)
TABLE 65 SAUDI ARABIA ELECTRIC VEHICLE MARKET, BY CHARGING STATION TYPE, 2021-2030 (THOUSAND UNITS)
TABLE 66 SAUDI ARABIA NORMAL CHARGING IN ELECTRIC VEHICLE MARKET, BY LEVEL TYPE, 2021-2030 (USD MILLION)
TABLE 67 SAUDI ARABIA NORMAL CHARGING IN ELECTRIC VEHICLE MARKET, BY LEVEL TYPE, 2021-2030 (THOUSAND UNITS)
TABLE 68 SAUDI ARABIA SUPER CHARGING IN ELECTRIC VEHICLE MARKET, BY LEVEL TYPE, 2021-2030 (USD MILLION)
TABLE 69 SAUDI ARABIA SUPER CHARGING IN ELECTRIC VEHICLE MARKET, BY LEVEL TYPE, 2021-2030 (THOUSAND UNITS)
TABLE 70 SAUDI ARABIA ELECTRIC VEHICLE MARKET, BY VOLTAGE RANGE, 2021-2030 (USD MILLION)
TABLE 71 SAUDI ARABIA ELECTRIC VEHICLE MARKET, BY VOLTAGE RANGE, 2021-2030 (THOUSAND UNITS)
TABLE 72 SAUDI ARABIA ELECTRIC VEHICLE MARKET, BY CONNECTIVITY TYPE, 2021-2030 (USD MILLION)
TABLE 73 SAUDI ARABIA ELECTRIC VEHICLE MARKET, BY CONNECTIVITY TYPE, 2021-2030 (THOUSAND UNITS)
TABLE 74 SAUDI ARABIA ELECTRIC VEHICLE MARKET, BY POWER OUTPUT, 2021-2030 (USD MILLION)
TABLE 75 SAUDI ARABIA ELECTRIC VEHICLE MARKET, BY POWER OUTPUT, 2021-2030 (THOUSAND UNITS)
TABLE 76 SAUDI ARABIA ELECTRIC VEHICLE MARKET, BY BATTERY TYPE, 2021-2030 (USD MILLION)
TABLE 77 SAUDI ARABIA ELECTRIC VEHICLE MARKET, BY BATTERY TYPE, 2021-2030 (THOUSAND UNITS)
TABLE 78 SAUDI ARABIA ELECTRIC VEHICLE MARKET, BY BATTERY FORM, 2021-2030 (USD MILLION)
TABLE 79 SAUDI ARABIA ELECTRIC VEHICLE MARKET, BY BATTERY FORM, 2021-2030 (THOUSAND UNITS)
TABLE 80 SAUDI ARABIA ELECTRIC VEHICLE MARKET, BY POWER TRAIN, 2021-2030 (USD MILLION)
TABLE 81 SAUDI ARABIA ELECTRIC VEHICLE MARKET, BY POWER TRAIN, 2021-2030 (THOUSAND UNITS)
TABLE 82 SAUDI ARABIA ELECTRIC VEHICLE MARKET, PROPULSION TYPE, 2021-2030 (USD MILLION)
TABLE 83 SAUDI ARABIA ELECTRIC VEHICLE MARKET, BY PROPULSION TYPE, BY VOLUME, 2021-2030 (THOUSAND UNITS)
TABLE 84 SAUDI ARABIA BATTERY ELECTRIC VEHICLE (BEV) IN ELECTRIC VEHICLE MARKET, BY POWER OUTPUT, 2021-2030 (USD MILLION)
TABLE 85 SAUDI ARABIA BATTERY ELECTRIC VEHICLE (BEV) IN ELECTRIC VEHICLE MARKET, BY POWER OUTPUT, 2021-2030 (THOUSAND UNITS)
TABLE 86 SAUDI ARABIA PLUG-IN HYBRID ELECTRIC VEHICLE (PHEV) IN ELECTRIC VEHICLE MARKET, BY POWER OUTPUT, 2021-2030 (USD MILLION)
TABLE 87 SAUDI ARABIA PLUG-IN HYBRID ELECTRIC VEHICLE (PHEV) IN ELECTRIC VEHICLE MARKET, BY POWER OUTPUT, 2021-2030 (THOUSAND UNITS)
TABLE 88 SAUDI ARABIA FUEL CELL ELECTRIC VEHICLE (FCEV) IN ELECTRIC VEHICLE MARKET, BY POWER OUTPUT, 2021-2030 (USD MILLION)
TABLE 89 SAUDI ARABIA FUEL CELL ELECTRIC VEHICLE (FCEV) IN ELECTRIC VEHICLE MARKET, BY POWER OUTPUT, 2021-2030 (THOUSAND UNITS)
TABLE 90 SAUDI ARABIA ICE AND MICRO HYBRID VEHICLE IN ELECTRIC VEHICLE MARKET, BY POWER OUTPUT, 2021-2030 (USD MILLION)
TABLE 91 SAUDI ARABIA ICE AND MICRO HYBRID VEHICLE IN ELECTRIC VEHICLE MARKET, BY POWER OUTPUT, 2021-2030 (THOUSAND UNITS)
TABLE 92 SAUDI ARABIA ELECTRIC VEHICLE MARKET, BY VEHICLE TYPE, 2021-2030 (USD MILLION)
TABLE 93 SAUDI ARABIA ELECTRIC VEHICLE MARKET, BY VEHICLE TYPE, 2021-2030 (THOUSAND UNITS)
TABLE 94 SAUDI ARABIA PASSENGER CARS IN ELECTRIC VEHICLE MARKET, BY TYPE, 2021-2030 (USD MILLION)
TABLE 95 SAUDI ARABIA PASSENGER CARS IN ELECTRIC VEHICLE MARKET, BY TYPE, 2021-2030 (THOUSAND UNITS)
TABLE 96 SAUDI ARABIA COMMERCIAL VEHICLE IN ELECTRIC VEHICLE MARKET, BY TYPE, 2021-2030 (USD MILLION)
TABLE 97 SAUDI ARABIA COMMERCIAL VEHICLE IN ELECTRIC VEHICLE MARKET, BY TYPE, 2021-2030 (THOUSAND UNITS)
TABLE 98 SAUDI ARABIA LIGHT COMMERCIAL VEHICLE (LCV) IN ELECTRIC VEHICLE MARKET, TYPE, 2021-2030 (USD MILLION)
TABLE 99 SAUDI ARABIA LIGHT COMMERCIAL VEHICLE (LCV) IN ELECTRIC VEHICLE MARKET, TYPE, 2021-2030 (THOUSAND UNITS)
TABLE 100 SAUDI ARABIA HEAVY COMMERCIAL VEHICLE (HCV) IN ELECTRIC VEHICLE MARKET, BY TYPE, 2021-2030 (USD MILLION)
TABLE 101 SAUDI ARABIA HEAVY COMMERCIAL VEHICLE (HCV) IN ELECTRIC VEHICLE MARKET, BY TYPE, 2021-2030 (THOUSAND UNITS)
TABLE 102 SAUDI ARABIA ELECTRIC VEHICLE MARKET, BY SALES CHANNEL, 2021-2030 (USD MILLION)
TABLE 103 SAUDI ARABIA ELECTRIC VEHICLE MARKET, BY SALES CHANNEL, 2021-2030 (THOUSAND UNITS)
TABLE 104 U.A.E. ELECTRIC VEHICLE MARKET, BY VEHICLE CLASS, 2021-2030 (USD MILLION)
TABLE 105 U.A.E. ELECTRIC VEHICLE MARKET, BY VEHICLE CLASS, 2021-2030 (THOUSAND UNITS)
TABLE 106 U.A.E. ELECTRIC VEHICLE MARKET, BY VEHICLE DRIVE TYPE, 2021-2030 (USD MILLION)
TABLE 107 U.A.E. ELECTRIC VEHICLE MARKET, BY VEHICLE DRIVE TYPE, 2021-2030 (THOUSAND UNITS)
TABLE 108 U.A.E. ELECTRIC VEHICLE MARKET, BY ELECTRIC MOTOR TYPE, 2021-2030 (USD MILLION)
TABLE 109 U.A.E. ELECTRIC VEHICLE MARKET, BY ELECTRIC MOTOR TYPE, 2021-2030 (THOUSAND UNITS)
TABLE 110 U.A.E. ELECTRIC VEHICLE MARKET, BY VEHICLE SPEED, 2021-2030 (USD MILLION)
TABLE 111 U.A.E. ELECTRIC VEHICLE MARKET, BY VEHICLE SPEED, 2021-2030 (THOUSAND UNITS)
TABLE 112 U.A.E. ELECTRIC VEHICLE MARKET, BY CHARGING STATION TYPE, 2021-2030 (USD MILLION)
TABLE 113 U.A.E. ELECTRIC VEHICLE MARKET, BY CHARGING STATION TYPE, 2021-2030 (THOUSAND UNITS)
TABLE 114 U.A.E. NORMAL CHARGING IN ELECTRIC VEHICLE MARKET, BY LEVEL TYPE, 2021-2030 (USD MILLION)
TABLE 115 U.A.E. NORMAL CHARGING IN ELECTRIC VEHICLE MARKET, BY LEVEL TYPE, 2021-2030 (THOUSAND UNITS)
TABLE 116 U.A.E. SUPER CHARGING IN ELECTRIC VEHICLE MARKET, BY LEVEL TYPE, 2021-2030 (USD MILLION)
TABLE 117 U.A.E. SUPER CHARGING IN ELECTRIC VEHICLE MARKET, BY LEVEL TYPE, 2021-2030 (THOUSAND UNITS)
TABLE 118 U.A.E. ELECTRIC VEHICLE MARKET, BY VOLTAGE RANGE, 2021-2030 (USD MILLION)
TABLE 119 U.A.E. ELECTRIC VEHICLE MARKET, BY VOLTAGE RANGE, 2021-2030 (THOUSAND UNITS)
TABLE 120 U.A.E. ELECTRIC VEHICLE MARKET, BY CONNECTIVITY TYPE, 2021-2030 (USD MILLION)
TABLE 121 U.A.E. ELECTRIC VEHICLE MARKET, BY CONNECTIVITY TYPE, 2021-2030 (THOUSAND UNITS)
TABLE 122 U.A.E. ELECTRIC VEHICLE MARKET, BY POWER OUTPUT, 2021-2030 (USD MILLION)
TABLE 123 U.A.E. ELECTRIC VEHICLE MARKET, BY POWER OUTPUT, 2021-2030 (THOUSAND UNITS)
TABLE 124 U.A.E. ELECTRIC VEHICLE MARKET, BY BATTERY TYPE, 2021-2030 (USD MILLION)
TABLE 125 U.A.E. ELECTRIC VEHICLE MARKET, BY BATTERY TYPE, 2021-2030 (THOUSAND UNITS)
TABLE 126 U.A.E. ELECTRIC VEHICLE MARKET, BY BATTERY FORM, 2021-2030 (USD MILLION)
TABLE 127 U.A.E. ELECTRIC VEHICLE MARKET, BY BATTERY FORM, 2021-2030 (THOUSAND UNITS)
TABLE 128 U.A.E. ELECTRIC VEHICLE MARKET, BY POWER TRAIN, 2021-2030 (USD MILLION)
TABLE 129 U.A.E. ELECTRIC VEHICLE MARKET, BY POWER TRAIN, 2021-2030 (THOUSAND UNITS)
TABLE 130 U.A.E. ELECTRIC VEHICLE MARKET, PROPULSION TYPE, 2021-2030 (USD MILLION)
TABLE 131 U.A.E. ELECTRIC VEHICLE MARKET, BY PROPULSION TYPE, BY VOLUME, 2021-2030 (THOUSAND UNITS)
TABLE 132 U.A.E. BATTERY ELECTRIC VEHICLE (BEV) IN ELECTRIC VEHICLE MARKET, BY POWER OUTPUT, 2021-2030 (USD MILLION)
TABLE 133 U.A.E. BATTERY ELECTRIC VEHICLE (BEV) IN ELECTRIC VEHICLE MARKET, BY POWER OUTPUT, 2021-2030 (THOUSAND UNITS)
TABLE 134 U.A.E. PLUG-IN HYBRID ELECTRIC VEHICLE (PHEV) IN ELECTRIC VEHICLE MARKET, BY POWER OUTPUT, 2021-2030 (USD MILLION)
TABLE 135 U.A.E. PLUG-IN HYBRID ELECTRIC VEHICLE (PHEV) IN ELECTRIC VEHICLE MARKET, BY POWER OUTPUT, 2021-2030 (THOUSAND UNITS)
TABLE 136 U.A.E. FUEL CELL ELECTRIC VEHICLE (FCEV) IN ELECTRIC VEHICLE MARKET, BY POWER OUTPUT, 2021-2030 (USD MILLION)
TABLE 137 U.A.E. FUEL CELL ELECTRIC VEHICLE (FCEV) IN ELECTRIC VEHICLE MARKET, BY POWER OUTPUT, 2021-2030 (THOUSAND UNITS)
TABLE 138 U.A.E. ICE AND MICRO HYBRID VEHICLE IN ELECTRIC VEHICLE MARKET, BY POWER OUTPUT, 2021-2030 (USD MILLION)
TABLE 139 U.A.E. ICE AND MICRO HYBRID VEHICLE IN ELECTRIC VEHICLE MARKET, BY POWER OUTPUT, 2021-2030 (THOUSAND UNITS)
TABLE 140 U.A.E. ELECTRIC VEHICLE MARKET, BY VEHICLE TYPE, 2021-2030 (USD MILLION)
TABLE 141 U.A.E. ELECTRIC VEHICLE MARKET, BY VEHICLE TYPE, 2021-2030 (THOUSAND UNITS)
TABLE 142 U.A.E. PASSENGER CARS IN ELECTRIC VEHICLE MARKET, BY TYPE, 2021-2030 (USD MILLION)
TABLE 143 U.A.E. PASSENGER CARS IN ELECTRIC VEHICLE MARKET, BY TYPE, 2021-2030 (THOUSAND UNITS)
TABLE 144 U.A.E. COMMERCIAL VEHICLE IN ELECTRIC VEHICLE MARKET, BY TYPE, 2021-2030 (USD MILLION)
TABLE 145 U.A.E. COMMERCIAL VEHICLE IN ELECTRIC VEHICLE MARKET, BY TYPE, 2021-2030 (THOUSAND UNITS)
TABLE 146 U.A.E. LIGHT COMMERCIAL VEHICLE (LCV) IN ELECTRIC VEHICLE MARKET, TYPE, 2021-2030 (USD MILLION)
TABLE 147 U.A.E. LIGHT COMMERCIAL VEHICLE (LCV) IN ELECTRIC VEHICLE MARKET, TYPE, 2021-2030 (THOUSAND UNITS)
TABLE 148 U.A.E. HEAVY COMMERCIAL VEHICLE (HCV) IN ELECTRIC VEHICLE MARKET, BY TYPE, 2021-2030 (USD MILLION)
TABLE 149 U.A.E. HEAVY COMMERCIAL VEHICLE (HCV) IN ELECTRIC VEHICLE MARKET, BY TYPE, 2021-2030 (THOUSAND UNITS)
TABLE 150 U.A.E. ELECTRIC VEHICLE MARKET, BY SALES CHANNEL, 2021-2030 (USD MILLION)
TABLE 151 U.A.E. ELECTRIC VEHICLE MARKET, BY SALES CHANNEL, 2021-2030 (THOUSAND UNITS)
TABLE 152 ISRAEL ELECTRIC VEHICLE MARKET, BY VEHICLE CLASS, 2021-2030 (USD MILLION)
TABLE 153 ISRAEL ELECTRIC VEHICLE MARKET, BY VEHICLE CLASS, 2021-2030 (THOUSAND UNITS)
TABLE 154 ISRAEL ELECTRIC VEHICLE MARKET, BY VEHICLE DRIVE TYPE, 2021-2030 (USD MILLION)
TABLE 155 ISRAEL ELECTRIC VEHICLE MARKET, BY VEHICLE DRIVE TYPE, 2021-2030 (THOUSAND UNITS)
TABLE 156 ISRAEL ELECTRIC VEHICLE MARKET, BY ELECTRIC MOTOR TYPE, 2021-2030 (USD MILLION)
TABLE 157 ISRAEL ELECTRIC VEHICLE MARKET, BY ELECTRIC MOTOR TYPE, 2021-2030 (THOUSAND UNITS)
TABLE 158 ISRAEL ELECTRIC VEHICLE MARKET, BY VEHICLE SPEED, 2021-2030 (USD MILLION)
TABLE 159 ISRAEL ELECTRIC VEHICLE MARKET, BY VEHICLE SPEED, 2021-2030 (THOUSAND UNITS)
TABLE 160 ISRAEL ELECTRIC VEHICLE MARKET, BY CHARGING STATION TYPE, 2021-2030 (USD MILLION)
TABLE 161 ISRAEL ELECTRIC VEHICLE MARKET, BY CHARGING STATION TYPE, 2021-2030 (THOUSAND UNITS)
TABLE 162 ISRAEL NORMAL CHARGING IN ELECTRIC VEHICLE MARKET, BY LEVEL TYPE, 2021-2030 (USD MILLION)
TABLE 163 ISRAEL NORMAL CHARGING IN ELECTRIC VEHICLE MARKET, BY LEVEL TYPE, 2021-2030 (THOUSAND UNITS)
TABLE 164 ISRAEL SUPER CHARGING IN ELECTRIC VEHICLE MARKET, BY LEVEL TYPE, 2021-2030 (USD MILLION)
TABLE 165 ISRAEL SUPER CHARGING IN ELECTRIC VEHICLE MARKET, BY LEVEL TYPE, 2021-2030 (THOUSAND UNITS)
TABLE 166 ISRAEL ELECTRIC VEHICLE MARKET, BY VOLTAGE RANGE, 2021-2030 (USD MILLION)
TABLE 167 ISRAEL ELECTRIC VEHICLE MARKET, BY VOLTAGE RANGE, 2021-2030 (THOUSAND UNITS)
TABLE 168 ISRAEL ELECTRIC VEHICLE MARKET, BY CONNECTIVITY TYPE, 2021-2030 (USD MILLION)
TABLE 169 ISRAEL ELECTRIC VEHICLE MARKET, BY CONNECTIVITY TYPE, 2021-2030 (THOUSAND UNITS)
TABLE 170 ISRAEL ELECTRIC VEHICLE MARKET, BY POWER OUTPUT, 2021-2030 (USD MILLION)
TABLE 171 ISRAEL ELECTRIC VEHICLE MARKET, BY POWER OUTPUT, 2021-2030 (THOUSAND UNITS)
TABLE 172 ISRAEL ELECTRIC VEHICLE MARKET, BY BATTERY TYPE, 2021-2030 (USD MILLION)
TABLE 173 ISRAEL ELECTRIC VEHICLE MARKET, BY BATTERY TYPE, 2021-2030 (THOUSAND UNITS)
TABLE 174 ISRAEL ELECTRIC VEHICLE MARKET, BY BATTERY FORM, 2021-2030 (USD MILLION)
TABLE 175 ISRAEL ELECTRIC VEHICLE MARKET, BY BATTERY FORM, 2021-2030 (THOUSAND UNITS)
TABLE 176 ISRAEL ELECTRIC VEHICLE MARKET, BY POWER TRAIN, 2021-2030 (USD MILLION)
TABLE 177 ISRAEL ELECTRIC VEHICLE MARKET, BY POWER TRAIN, 2021-2030 (THOUSAND UNITS)
TABLE 178 ISRAEL ELECTRIC VEHICLE MARKET, PROPULSION TYPE, 2021-2030 (USD MILLION)
TABLE 179 ISRAEL ELECTRIC VEHICLE MARKET, BY PROPULSION TYPE, BY VOLUME, 2021-2030 (THOUSAND UNITS)
TABLE 180 ISRAEL BATTERY ELECTRIC VEHICLE (BEV) IN ELECTRIC VEHICLE MARKET, BY POWER OUTPUT, 2021-2030 (USD MILLION)
TABLE 181 ISRAEL BATTERY ELECTRIC VEHICLE (BEV) IN ELECTRIC VEHICLE MARKET, BY POWER OUTPUT, 2021-2030 (THOUSAND UNITS)
TABLE 182 ISRAEL PLUG-IN HYBRID ELECTRIC VEHICLE (PHEV) IN ELECTRIC VEHICLE MARKET, BY POWER OUTPUT, 2021-2030 (USD MILLION)
TABLE 183 ISRAEL PLUG-IN HYBRID ELECTRIC VEHICLE (PHEV) IN ELECTRIC VEHICLE MARKET, BY POWER OUTPUT, 2021-2030 (THOUSAND UNITS)
TABLE 184 ISRAEL FUEL CELL ELECTRIC VEHICLE (FCEV) IN ELECTRIC VEHICLE MARKET, BY POWER OUTPUT, 2021-2030 (USD MILLION)
TABLE 185 ISRAEL FUEL CELL ELECTRIC VEHICLE (FCEV) IN ELECTRIC VEHICLE MARKET, BY POWER OUTPUT, 2021-2030 (THOUSAND UNITS)
TABLE 186 ISRAEL ICE AND MICRO HYBRID VEHICLE IN ELECTRIC VEHICLE MARKET, BY POWER OUTPUT, 2021-2030 (USD MILLION)
TABLE 187 ISRAEL ICE AND MICRO HYBRID VEHICLE IN ELECTRIC VEHICLE MARKET, BY POWER OUTPUT, 2021-2030 (THOUSAND UNITS)
TABLE 188 ISRAEL ELECTRIC VEHICLE MARKET, BY VEHICLE TYPE, 2021-2030 (USD MILLION)
TABLE 189 ISRAEL ELECTRIC VEHICLE MARKET, BY VEHICLE TYPE, 2021-2030 (THOUSAND UNITS)
TABLE 190 ISRAEL PASSENGER CARS IN ELECTRIC VEHICLE MARKET, BY TYPE, 2021-2030 (USD MILLION)
TABLE 191 ISRAEL PASSENGER CARS IN ELECTRIC VEHICLE MARKET, BY TYPE, 2021-2030 (THOUSAND UNITS)
TABLE 192 ISRAEL COMMERCIAL VEHICLE IN ELECTRIC VEHICLE MARKET, BY TYPE, 2021-2030 (USD MILLION)
TABLE 193 ISRAEL COMMERCIAL VEHICLE IN ELECTRIC VEHICLE MARKET, BY TYPE, 2021-2030 (THOUSAND UNITS)
TABLE 194 ISRAEL LIGHT COMMERCIAL VEHICLE (LCV) IN ELECTRIC VEHICLE MARKET, TYPE, 2021-2030 (USD MILLION)
TABLE 195 ISRAEL LIGHT COMMERCIAL VEHICLE (LCV) IN ELECTRIC VEHICLE MARKET, TYPE, 2021-2030 (THOUSAND UNITS)
TABLE 196 ISRAEL HEAVY COMMERCIAL VEHICLE (HCV) IN ELECTRIC VEHICLE MARKET, BY TYPE, 2021-2030 (USD MILLION)
TABLE 197 ISRAEL HEAVY COMMERCIAL VEHICLE (HCV) IN ELECTRIC VEHICLE MARKET, BY TYPE, 2021-2030 (THOUSAND UNITS)
TABLE 198 ISRAEL ELECTRIC VEHICLE MARKET, BY SALES CHANNEL, 2021-2030 (USD MILLION)
TABLE 199 ISRAEL ELECTRIC VEHICLE MARKET, BY SALES CHANNEL, 2021-2030 (THOUSAND UNITS)
TABLE 200 BAHRAIN ELECTRIC VEHICLE MARKET, BY VEHICLE CLASS, 2021-2030 (USD MILLION)
TABLE 201 BAHRAIN ELECTRIC VEHICLE MARKET, BY VEHICLE CLASS, 2021-2030 (THOUSAND UNITS)
TABLE 202 BAHRAIN ELECTRIC VEHICLE MARKET, BY VEHICLE DRIVE TYPE, 2021-2030 (USD MILLION)
TABLE 203 BAHRAIN ELECTRIC VEHICLE MARKET, BY VEHICLE DRIVE TYPE, 2021-2030 (THOUSAND UNITS)
TABLE 204 BAHRAIN ELECTRIC VEHICLE MARKET, BY ELECTRIC MOTOR TYPE, 2021-2030 (USD MILLION)
TABLE 205 BAHRAIN ELECTRIC VEHICLE MARKET, BY ELECTRIC MOTOR TYPE, 2021-2030 (THOUSAND UNITS)
TABLE 206 BAHRAIN ELECTRIC VEHICLE MARKET, BY VEHICLE SPEED, 2021-2030 (USD MILLION)
TABLE 207 BAHRAIN ELECTRIC VEHICLE MARKET, BY VEHICLE SPEED, 2021-2030 (THOUSAND UNITS)
TABLE 208 BAHRAIN ELECTRIC VEHICLE MARKET, BY CHARGING STATION TYPE, 2021-2030 (USD MILLION)
TABLE 209 BAHRAIN ELECTRIC VEHICLE MARKET, BY CHARGING STATION TYPE, 2021-2030 (THOUSAND UNITS)
TABLE 210 BAHRAIN NORMAL CHARGING IN ELECTRIC VEHICLE MARKET, BY LEVEL TYPE, 2021-2030 (USD MILLION)
TABLE 211 BAHRAIN NORMAL CHARGING IN ELECTRIC VEHICLE MARKET, BY LEVEL TYPE, 2021-2030 (THOUSAND UNITS)
TABLE 212 BAHRAIN SUPER CHARGING IN ELECTRIC VEHICLE MARKET, BY LEVEL TYPE, 2021-2030 (USD MILLION)
TABLE 213 BAHRAIN SUPER CHARGING IN ELECTRIC VEHICLE MARKET, BY LEVEL TYPE, 2021-2030 (THOUSAND UNITS)
TABLE 214 BAHRAIN ELECTRIC VEHICLE MARKET, BY VOLTAGE RANGE, 2021-2030 (USD MILLION)
TABLE 215 BAHRAIN ELECTRIC VEHICLE MARKET, BY VOLTAGE RANGE, 2021-2030 (THOUSAND UNITS)
TABLE 216 BAHRAIN ELECTRIC VEHICLE MARKET, BY CONNECTIVITY TYPE, 2021-2030 (USD MILLION)
TABLE 217 BAHRAIN ELECTRIC VEHICLE MARKET, BY CONNECTIVITY TYPE, 2021-2030 (THOUSAND UNITS)
TABLE 218 BAHRAIN ELECTRIC VEHICLE MARKET, BY POWER OUTPUT, 2021-2030 (USD MILLION)
TABLE 219 BAHRAIN ELECTRIC VEHICLE MARKET, BY POWER OUTPUT, 2021-2030 (THOUSAND UNITS)
TABLE 220 BAHRAIN ELECTRIC VEHICLE MARKET, BY BATTERY TYPE, 2021-2030 (USD MILLION)
TABLE 221 BAHRAIN ELECTRIC VEHICLE MARKET, BY BATTERY TYPE, 2021-2030 (THOUSAND UNITS)
TABLE 222 BAHRAIN ELECTRIC VEHICLE MARKET, BY BATTERY FORM, 2021-2030 (USD MILLION)
TABLE 223 BAHRAIN ELECTRIC VEHICLE MARKET, BY BATTERY FORM, 2021-2030 (THOUSAND UNITS)
TABLE 224 BAHRAIN ELECTRIC VEHICLE MARKET, BY POWER TRAIN, 2021-2030 (USD MILLION)
TABLE 225 BAHRAIN ELECTRIC VEHICLE MARKET, BY POWER TRAIN, 2021-2030 (THOUSAND UNITS)
TABLE 226 BAHRAIN ELECTRIC VEHICLE MARKET, PROPULSION TYPE, 2021-2030 (USD MILLION)
TABLE 227 BAHRAIN ELECTRIC VEHICLE MARKET, BY PROPULSION TYPE, BY VOLUME, 2021-2030 (THOUSAND UNITS)
TABLE 228 BAHRAIN BATTERY ELECTRIC VEHICLE (BEV) IN ELECTRIC VEHICLE MARKET, BY POWER OUTPUT, 2021-2030 (USD MILLION)
TABLE 229 BAHRAIN BATTERY ELECTRIC VEHICLE (BEV) IN ELECTRIC VEHICLE MARKET, BY POWER OUTPUT, 2021-2030 (THOUSAND UNITS)
TABLE 230 BAHRAIN PLUG-IN HYBRID ELECTRIC VEHICLE (PHEV) IN ELECTRIC VEHICLE MARKET, BY POWER OUTPUT, 2021-2030 (USD MILLION)
TABLE 231 BAHRAIN PLUG-IN HYBRID ELECTRIC VEHICLE (PHEV) IN ELECTRIC VEHICLE MARKET, BY POWER OUTPUT, 2021-2030 (THOUSAND UNITS)
TABLE 232 BAHRAIN FUEL CELL ELECTRIC VEHICLE (FCEV) IN ELECTRIC VEHICLE MARKET, BY POWER OUTPUT, 2021-2030 (USD MILLION)
TABLE 233 BAHRAIN FUEL CELL ELECTRIC VEHICLE (FCEV) IN ELECTRIC VEHICLE MARKET, BY POWER OUTPUT, 2021-2030 (THOUSAND UNITS)
TABLE 234 BAHRAIN ICE AND MICRO HYBRID VEHICLE IN ELECTRIC VEHICLE MARKET, BY POWER OUTPUT, 2021-2030 (USD MILLION)
TABLE 235 BAHRAIN ICE AND MICRO HYBRID VEHICLE IN ELECTRIC VEHICLE MARKET, BY POWER OUTPUT, 2021-2030 (THOUSAND UNITS)
TABLE 236 BAHRAIN ELECTRIC VEHICLE MARKET, BY VEHICLE TYPE, 2021-2030 (USD MILLION)
TABLE 237 BAHRAIN ELECTRIC VEHICLE MARKET, BY VEHICLE TYPE, 2021-2030 (THOUSAND UNITS)
TABLE 238 BAHRAIN PASSENGER CARS IN ELECTRIC VEHICLE MARKET, BY TYPE, 2021-2030 (USD MILLION)
TABLE 239 BAHRAIN PASSENGER CARS IN ELECTRIC VEHICLE MARKET, BY TYPE, 2021-2030 (THOUSAND UNITS)
TABLE 240 BAHRAIN COMMERCIAL VEHICLE IN ELECTRIC VEHICLE MARKET, BY TYPE, 2021-2030 (USD MILLION)
TABLE 241 BAHRAIN COMMERCIAL VEHICLE IN ELECTRIC VEHICLE MARKET, BY TYPE, 2021-2030 (THOUSAND UNITS)
TABLE 242 BAHRAIN LIGHT COMMERCIAL VEHICLE (LCV) IN ELECTRIC VEHICLE MARKET, TYPE, 2021-2030 (USD MILLION)
TABLE 243 BAHRAIN LIGHT COMMERCIAL VEHICLE (LCV) IN ELECTRIC VEHICLE MARKET, TYPE, 2021-2030 (THOUSAND UNITS)
TABLE 244 BAHRAIN HEAVY COMMERCIAL VEHICLE (HCV) IN ELECTRIC VEHICLE MARKET, BY TYPE, 2021-2030 (USD MILLION)
TABLE 245 BAHRAIN HEAVY COMMERCIAL VEHICLE (HCV) IN ELECTRIC VEHICLE MARKET, BY TYPE, 2021-2030 (THOUSAND UNITS)
TABLE 246 BAHRAIN ELECTRIC VEHICLE MARKET, BY SALES CHANNEL, 2021-2030 (USD MILLION)
TABLE 247 BAHRAIN ELECTRIC VEHICLE MARKET, BY SALES CHANNEL, 2021-2030 (THOUSAND UNITS)
TABLE 248 QATAR ELECTRIC VEHICLE MARKET, BY VEHICLE CLASS, 2021-2030 (USD MILLION)
TABLE 249 QATAR ELECTRIC VEHICLE MARKET, BY VEHICLE CLASS, 2021-2030 (THOUSAND UNITS)
TABLE 250 QATAR ELECTRIC VEHICLE MARKET, BY VEHICLE DRIVE TYPE, 2021-2030 (USD MILLION)
TABLE 251 QATAR ELECTRIC VEHICLE MARKET, BY VEHICLE DRIVE TYPE, 2021-2030 (THOUSAND UNITS)
TABLE 252 QATAR ELECTRIC VEHICLE MARKET, BY ELECTRIC MOTOR TYPE, 2021-2030 (USD MILLION)
TABLE 253 QATAR ELECTRIC VEHICLE MARKET, BY ELECTRIC MOTOR TYPE, 2021-2030 (THOUSAND UNITS)
TABLE 254 QATAR ELECTRIC VEHICLE MARKET, BY VEHICLE SPEED, 2021-2030 (USD MILLION)
TABLE 255 QATAR ELECTRIC VEHICLE MARKET, BY VEHICLE SPEED, 2021-2030 (THOUSAND UNITS)
TABLE 256 QATAR ELECTRIC VEHICLE MARKET, BY CHARGING STATION TYPE, 2021-2030 (USD MILLION)
TABLE 257 QATAR ELECTRIC VEHICLE MARKET, BY CHARGING STATION TYPE, 2021-2030 (THOUSAND UNITS)
TABLE 258 QATAR NORMAL CHARGING IN ELECTRIC VEHICLE MARKET, BY LEVEL TYPE, 2021-2030 (USD MILLION)
TABLE 259 QATAR NORMAL CHARGING IN ELECTRIC VEHICLE MARKET, BY LEVEL TYPE, 2021-2030 (THOUSAND UNITS)
TABLE 260 QATAR SUPER CHARGING IN ELECTRIC VEHICLE MARKET, BY LEVEL TYPE, 2021-2030 (USD MILLION)
TABLE 261 QATAR SUPER CHARGING IN ELECTRIC VEHICLE MARKET, BY LEVEL TYPE, 2021-2030 (THOUSAND UNITS)
TABLE 262 QATAR ELECTRIC VEHICLE MARKET, BY VOLTAGE RANGE, 2021-2030 (USD MILLION)
TABLE 263 QATAR ELECTRIC VEHICLE MARKET, BY VOLTAGE RANGE, 2021-2030 (THOUSAND UNITS)
TABLE 264 QATAR ELECTRIC VEHICLE MARKET, BY CONNECTIVITY TYPE, 2021-2030 (USD MILLION)
TABLE 265 QATAR ELECTRIC VEHICLE MARKET, BY CONNECTIVITY TYPE, 2021-2030 (THOUSAND UNITS)
TABLE 266 QATAR ELECTRIC VEHICLE MARKET, BY POWER OUTPUT, 2021-2030 (USD MILLION)
TABLE 267 QATAR ELECTRIC VEHICLE MARKET, BY POWER OUTPUT, 2021-2030 (THOUSAND UNITS)
TABLE 268 QATAR ELECTRIC VEHICLE MARKET, BY BATTERY TYPE, 2021-2030 (USD MILLION)
TABLE 269 QATAR ELECTRIC VEHICLE MARKET, BY BATTERY TYPE, 2021-2030 (THOUSAND UNITS)
TABLE 270 QATAR ELECTRIC VEHICLE MARKET, BY BATTERY FORM, 2021-2030 (USD MILLION)
TABLE 271 QATAR ELECTRIC VEHICLE MARKET, BY BATTERY FORM, 2021-2030 (THOUSAND UNITS)
TABLE 272 QATAR ELECTRIC VEHICLE MARKET, BY POWER TRAIN, 2021-2030 (USD MILLION)
TABLE 273 QATAR ELECTRIC VEHICLE MARKET, BY POWER TRAIN, 2021-2030 (THOUSAND UNITS)
TABLE 274 QATAR ELECTRIC VEHICLE MARKET, PROPULSION TYPE, 2021-2030 (USD MILLION)
TABLE 275 QATAR ELECTRIC VEHICLE MARKET, BY PROPULSION TYPE, BY VOLUME, 2021-2030 (THOUSAND UNITS)
TABLE 276 QATAR BATTERY ELECTRIC VEHICLE (BEV) IN ELECTRIC VEHICLE MARKET, BY POWER OUTPUT, 2021-2030 (USD MILLION)
TABLE 277 QATAR BATTERY ELECTRIC VEHICLE (BEV) IN ELECTRIC VEHICLE MARKET, BY POWER OUTPUT, 2021-2030 (THOUSAND UNITS)
TABLE 278 QATAR PLUG-IN HYBRID ELECTRIC VEHICLE (PHEV) IN ELECTRIC VEHICLE MARKET, BY POWER OUTPUT, 2021-2030 (USD MILLION)
TABLE 279 QATAR PLUG-IN HYBRID ELECTRIC VEHICLE (PHEV) IN ELECTRIC VEHICLE MARKET, BY POWER OUTPUT, 2021-2030 (THOUSAND UNITS)
TABLE 280 QATAR FUEL CELL ELECTRIC VEHICLE (FCEV) IN ELECTRIC VEHICLE MARKET, BY POWER OUTPUT, 2021-2030 (USD MILLION)
TABLE 281 QATAR FUEL CELL ELECTRIC VEHICLE (FCEV) IN ELECTRIC VEHICLE MARKET, BY POWER OUTPUT, 2021-2030 (THOUSAND UNITS)
TABLE 282 QATAR ICE AND MICRO HYBRID VEHICLE IN ELECTRIC VEHICLE MARKET, BY POWER OUTPUT, 2021-2030 (USD MILLION)
TABLE 283 QATAR ICE AND MICRO HYBRID VEHICLE IN ELECTRIC VEHICLE MARKET, BY POWER OUTPUT, 2021-2030 (THOUSAND UNITS)
TABLE 284 QATAR ELECTRIC VEHICLE MARKET, BY VEHICLE TYPE, 2021-2030 (USD MILLION)
TABLE 285 QATAR ELECTRIC VEHICLE MARKET, BY VEHICLE TYPE, 2021-2030 (THOUSAND UNITS)
TABLE 286 QATAR PASSENGER CARS IN ELECTRIC VEHICLE MARKET, BY TYPE, 2021-2030 (USD MILLION)
TABLE 287 QATAR PASSENGER CARS IN ELECTRIC VEHICLE MARKET, BY TYPE, 2021-2030 (THOUSAND UNITS)
TABLE 288 QATAR COMMERCIAL VEHICLE IN ELECTRIC VEHICLE MARKET, BY TYPE, 2021-2030 (USD MILLION)
TABLE 289 QATAR COMMERCIAL VEHICLE IN ELECTRIC VEHICLE MARKET, BY TYPE, 2021-2030 (THOUSAND UNITS)
TABLE 290 QATAR LIGHT COMMERCIAL VEHICLE (LCV) IN ELECTRIC VEHICLE MARKET, TYPE, 2021-2030 (USD MILLION)
TABLE 291 QATAR LIGHT COMMERCIAL VEHICLE (LCV) IN ELECTRIC VEHICLE MARKET, TYPE, 2021-2030 (THOUSAND UNITS)
TABLE 292 QATAR HEAVY COMMERCIAL VEHICLE (HCV) IN ELECTRIC VEHICLE MARKET, BY TYPE, 2021-2030 (USD MILLION)
TABLE 293 QATAR HEAVY COMMERCIAL VEHICLE (HCV) IN ELECTRIC VEHICLE MARKET, BY TYPE, 2021-2030 (THOUSAND UNITS)
TABLE 294 QATAR ELECTRIC VEHICLE MARKET, BY SALES CHANNEL, 2021-2030 (USD MILLION)
TABLE 295 QATAR ELECTRIC VEHICLE MARKET, BY SALES CHANNEL, 2021-2030 (THOUSAND UNITS)
TABLE 296 KUWAIT ELECTRIC VEHICLE MARKET, BY VEHICLE CLASS, 2021-2030 (USD MILLION)
TABLE 297 KUWAIT ELECTRIC VEHICLE MARKET, BY VEHICLE CLASS, 2021-2030 (THOUSAND UNITS)
TABLE 298 KUWAIT ELECTRIC VEHICLE MARKET, BY VEHICLE DRIVE TYPE, 2021-2030 (USD MILLION)
TABLE 299 KUWAIT ELECTRIC VEHICLE MARKET, BY VEHICLE DRIVE TYPE, 2021-2030 (THOUSAND UNITS)
TABLE 300 KUWAIT ELECTRIC VEHICLE MARKET, BY ELECTRIC MOTOR TYPE, 2021-2030 (USD MILLION)
TABLE 301 KUWAIT ELECTRIC VEHICLE MARKET, BY ELECTRIC MOTOR TYPE, 2021-2030 (THOUSAND UNITS)
TABLE 302 KUWAIT ELECTRIC VEHICLE MARKET, BY VEHICLE SPEED, 2021-2030 (USD MILLION)
TABLE 303 KUWAIT ELECTRIC VEHICLE MARKET, BY VEHICLE SPEED, 2021-2030 (THOUSAND UNITS)
TABLE 304 KUWAIT ELECTRIC VEHICLE MARKET, BY CHARGING STATION TYPE, 2021-2030 (USD MILLION)
TABLE 305 KUWAIT ELECTRIC VEHICLE MARKET, BY CHARGING STATION TYPE, 2021-2030 (THOUSAND UNITS)
TABLE 306 KUWAIT NORMAL CHARGING IN ELECTRIC VEHICLE MARKET, BY LEVEL TYPE, 2021-2030 (USD MILLION)
TABLE 307 KUWAIT NORMAL CHARGING IN ELECTRIC VEHICLE MARKET, BY LEVEL TYPE, 2021-2030 (THOUSAND UNITS)
TABLE 308 KUWAIT SUPER CHARGING IN ELECTRIC VEHICLE MARKET, BY LEVEL TYPE, 2021-2030 (USD MILLION)
TABLE 309 KUWAIT SUPER CHARGING IN ELECTRIC VEHICLE MARKET, BY LEVEL TYPE, 2021-2030 (THOUSAND UNITS)
TABLE 310 KUWAIT ELECTRIC VEHICLE MARKET, BY VOLTAGE RANGE, 2021-2030 (USD MILLION)
TABLE 311 KUWAIT ELECTRIC VEHICLE MARKET, BY VOLTAGE RANGE, 2021-2030 (THOUSAND UNITS)
TABLE 312 KUWAIT ELECTRIC VEHICLE MARKET, BY CONNECTIVITY TYPE, 2021-2030 (USD MILLION)
TABLE 313 KUWAIT ELECTRIC VEHICLE MARKET, BY CONNECTIVITY TYPE, 2021-2030 (THOUSAND UNITS)
TABLE 314 KUWAIT ELECTRIC VEHICLE MARKET, BY POWER OUTPUT, 2021-2030 (USD MILLION)
TABLE 315 KUWAIT ELECTRIC VEHICLE MARKET, BY POWER OUTPUT, 2021-2030 (THOUSAND UNITS)
TABLE 316 KUWAIT ELECTRIC VEHICLE MARKET, BY BATTERY TYPE, 2021-2030 (USD MILLION)
TABLE 317 KUWAIT ELECTRIC VEHICLE MARKET, BY BATTERY TYPE, 2021-2030 (THOUSAND UNITS)
TABLE 318 KUWAIT ELECTRIC VEHICLE MARKET, BY BATTERY FORM, 2021-2030 (USD MILLION)
TABLE 319 KUWAIT ELECTRIC VEHICLE MARKET, BY BATTERY FORM, 2021-2030 (THOUSAND UNITS)
TABLE 320 KUWAIT ELECTRIC VEHICLE MARKET, BY POWER TRAIN, 2021-2030 (USD MILLION)
TABLE 321 KUWAIT ELECTRIC VEHICLE MARKET, BY POWER TRAIN, 2021-2030 (THOUSAND UNITS)
TABLE 322 KUWAIT ELECTRIC VEHICLE MARKET, PROPULSION TYPE, 2021-2030 (USD MILLION)
TABLE 323 KUWAIT ELECTRIC VEHICLE MARKET, BY PROPULSION TYPE, BY VOLUME, 2021-2030 (THOUSAND UNITS)
TABLE 324 KUWAIT BATTERY ELECTRIC VEHICLE (BEV) IN ELECTRIC VEHICLE MARKET, BY POWER OUTPUT, 2021-2030 (USD MILLION)
TABLE 325 KUWAIT BATTERY ELECTRIC VEHICLE (BEV) IN ELECTRIC VEHICLE MARKET, BY POWER OUTPUT, 2021-2030 (THOUSAND UNITS)
TABLE 326 KUWAIT PLUG-IN HYBRID ELECTRIC VEHICLE (PHEV) IN ELECTRIC VEHICLE MARKET, BY POWER OUTPUT, 2021-2030 (USD MILLION)
TABLE 327 KUWAIT PLUG-IN HYBRID ELECTRIC VEHICLE (PHEV) IN ELECTRIC VEHICLE MARKET, BY POWER OUTPUT, 2021-2030 (THOUSAND UNITS)
TABLE 328 KUWAIT FUEL CELL ELECTRIC VEHICLE (FCEV) IN ELECTRIC VEHICLE MARKET, BY POWER OUTPUT, 2021-2030 (USD MILLION)
TABLE 329 KUWAIT FUEL CELL ELECTRIC VEHICLE (FCEV) IN ELECTRIC VEHICLE MARKET, BY POWER OUTPUT, 2021-2030 (THOUSAND UNITS)
TABLE 330 KUWAIT ICE AND MICRO HYBRID VEHICLE IN ELECTRIC VEHICLE MARKET, BY POWER OUTPUT, 2021-2030 (USD MILLION)
TABLE 331 KUWAIT ICE AND MICRO HYBRID VEHICLE IN ELECTRIC VEHICLE MARKET, BY POWER OUTPUT, 2021-2030 (THOUSAND UNITS)
TABLE 332 KUWAIT ELECTRIC VEHICLE MARKET, BY VEHICLE TYPE, 2021-2030 (USD MILLION)
TABLE 333 KUWAIT ELECTRIC VEHICLE MARKET, BY VEHICLE TYPE, 2021-2030 (THOUSAND UNITS)
TABLE 334 KUWAIT PASSENGER CARS IN ELECTRIC VEHICLE MARKET, BY TYPE, 2021-2030 (USD MILLION)
TABLE 335 KUWAIT PASSENGER CARS IN ELECTRIC VEHICLE MARKET, BY TYPE, 2021-2030 (THOUSAND UNITS)
TABLE 336 KUWAIT COMMERCIAL VEHICLE IN ELECTRIC VEHICLE MARKET, BY TYPE, 2021-2030 (USD MILLION)
TABLE 337 KUWAIT COMMERCIAL VEHICLE IN ELECTRIC VEHICLE MARKET, BY TYPE, 2021-2030 (THOUSAND UNITS)
TABLE 338 KUWAIT LIGHT COMMERCIAL VEHICLE (LCV) IN ELECTRIC VEHICLE MARKET, TYPE, 2021-2030 (USD MILLION)
TABLE 339 KUWAIT LIGHT COMMERCIAL VEHICLE (LCV) IN ELECTRIC VEHICLE MARKET, TYPE, 2021-2030 (THOUSAND UNITS)
TABLE 340 KUWAIT HEAVY COMMERCIAL VEHICLE (HCV) IN ELECTRIC VEHICLE MARKET, BY TYPE, 2021-2030 (USD MILLION)
TABLE 341 KUWAIT HEAVY COMMERCIAL VEHICLE (HCV) IN ELECTRIC VEHICLE MARKET, BY TYPE, 2021-2030 (THOUSAND UNITS)
TABLE 342 KUWAIT ELECTRIC VEHICLE MARKET, BY SALES CHANNEL, 2021-2030 (USD MILLION)
TABLE 343 KUWAIT ELECTRIC VEHICLE MARKET, BY SALES CHANNEL, 2021-2030 (THOUSAND UNITS)
TABLE 344 EGYPT ELECTRIC VEHICLE MARKET, BY VEHICLE CLASS, 2021-2030 (USD MILLION)
TABLE 345 EGYPT ELECTRIC VEHICLE MARKET, BY VEHICLE CLASS, 2021-2030 (THOUSAND UNITS)
TABLE 346 EGYPT ELECTRIC VEHICLE MARKET, BY VEHICLE DRIVE TYPE, 2021-2030 (USD MILLION)
TABLE 347 EGYPT ELECTRIC VEHICLE MARKET, BY VEHICLE DRIVE TYPE, 2021-2030 (THOUSAND UNITS)
TABLE 348 EGYPT ELECTRIC VEHICLE MARKET, BY ELECTRIC MOTOR TYPE, 2021-2030 (USD MILLION)
TABLE 349 EGYPT ELECTRIC VEHICLE MARKET, BY ELECTRIC MOTOR TYPE, 2021-2030 (THOUSAND UNITS)
TABLE 350 EGYPT ELECTRIC VEHICLE MARKET, BY VEHICLE SPEED, 2021-2030 (USD MILLION)
TABLE 351 EGYPT ELECTRIC VEHICLE MARKET, BY VEHICLE SPEED, 2021-2030 (THOUSAND UNITS)
TABLE 352 EGYPT ELECTRIC VEHICLE MARKET, BY CHARGING STATION TYPE, 2021-2030 (USD MILLION)
TABLE 353 EGYPT ELECTRIC VEHICLE MARKET, BY CHARGING STATION TYPE, 2021-2030 (THOUSAND UNITS)
TABLE 354 EGYPT NORMAL CHARGING IN ELECTRIC VEHICLE MARKET, BY LEVEL TYPE, 2021-2030 (USD MILLION)
TABLE 355 EGYPT NORMAL CHARGING IN ELECTRIC VEHICLE MARKET, BY LEVEL TYPE, 2021-2030 (THOUSAND UNITS)
TABLE 356 EGYPT SUPER CHARGING IN ELECTRIC VEHICLE MARKET, BY LEVEL TYPE, 2021-2030 (USD MILLION)
TABLE 357 EGYPT SUPER CHARGING IN ELECTRIC VEHICLE MARKET, BY LEVEL TYPE, 2021-2030 (THOUSAND UNITS)
TABLE 358 EGYPT ELECTRIC VEHICLE MARKET, BY VOLTAGE RANGE, 2021-2030 (USD MILLION)
TABLE 359 EGYPT ELECTRIC VEHICLE MARKET, BY VOLTAGE RANGE, 2021-2030 (THOUSAND UNITS)
TABLE 360 EGYPT ELECTRIC VEHICLE MARKET, BY CONNECTIVITY TYPE, 2021-2030 (USD MILLION)
TABLE 361 EGYPT ELECTRIC VEHICLE MARKET, BY CONNECTIVITY TYPE, 2021-2030 (THOUSAND UNITS)
TABLE 362 EGYPT ELECTRIC VEHICLE MARKET, BY POWER OUTPUT, 2021-2030 (USD MILLION)
TABLE 363 EGYPT ELECTRIC VEHICLE MARKET, BY POWER OUTPUT, 2021-2030 (THOUSAND UNITS)
TABLE 364 EGYPT ELECTRIC VEHICLE MARKET, BY BATTERY TYPE, 2021-2030 (USD MILLION)
TABLE 365 EGYPT ELECTRIC VEHICLE MARKET, BY BATTERY TYPE, 2021-2030 (THOUSAND UNITS)
TABLE 366 EGYPT ELECTRIC VEHICLE MARKET, BY BATTERY FORM, 2021-2030 (USD MILLION)
TABLE 367 EGYPT ELECTRIC VEHICLE MARKET, BY BATTERY FORM, 2021-2030 (THOUSAND UNITS)
TABLE 368 EGYPT ELECTRIC VEHICLE MARKET, BY POWER TRAIN, 2021-2030 (USD MILLION)
TABLE 369 EGYPT ELECTRIC VEHICLE MARKET, BY POWER TRAIN, 2021-2030 (THOUSAND UNITS)
TABLE 370 EGYPT ELECTRIC VEHICLE MARKET, PROPULSION TYPE, 2021-2030 (USD MILLION)
TABLE 371 EGYPT ELECTRIC VEHICLE MARKET, BY PROPULSION TYPE, BY VOLUME, 2021-2030 (THOUSAND UNITS)
TABLE 372 EGYPT BATTERY ELECTRIC VEHICLE (BEV) IN ELECTRIC VEHICLE MARKET, BY POWER OUTPUT, 2021-2030 (USD MILLION)
TABLE 373 EGYPT BATTERY ELECTRIC VEHICLE (BEV) IN ELECTRIC VEHICLE MARKET, BY POWER OUTPUT, 2021-2030 (THOUSAND UNITS)
TABLE 374 EGYPT PLUG-IN HYBRID ELECTRIC VEHICLE (PHEV) IN ELECTRIC VEHICLE MARKET, BY POWER OUTPUT, 2021-2030 (USD MILLION)
TABLE 375 EGYPT PLUG-IN HYBRID ELECTRIC VEHICLE (PHEV) IN ELECTRIC VEHICLE MARKET, BY POWER OUTPUT, 2021-2030 (THOUSAND UNITS)
TABLE 376 EGYPT FUEL CELL ELECTRIC VEHICLE (FCEV) IN ELECTRIC VEHICLE MARKET, BY POWER OUTPUT, 2021-2030 (USD MILLION)
TABLE 377 EGYPT FUEL CELL ELECTRIC VEHICLE (FCEV) IN ELECTRIC VEHICLE MARKET, BY POWER OUTPUT, 2021-2030 (THOUSAND UNITS)
TABLE 378 EGYPT ICE AND MICRO HYBRID VEHICLE IN ELECTRIC VEHICLE MARKET, BY POWER OUTPUT, 2021-2030 (USD MILLION)
TABLE 379 EGYPT ICE AND MICRO HYBRID VEHICLE IN ELECTRIC VEHICLE MARKET, BY POWER OUTPUT, 2021-2030 (THOUSAND UNITS)
TABLE 380 EGYPT ELECTRIC VEHICLE MARKET, BY VEHICLE TYPE, 2021-2030 (USD MILLION)
TABLE 381 EGYPT ELECTRIC VEHICLE MARKET, BY VEHICLE TYPE, 2021-2030 (THOUSAND UNITS)
TABLE 382 EGYPT PASSENGER CARS IN ELECTRIC VEHICLE MARKET, BY TYPE, 2021-2030 (USD MILLION)
TABLE 383 EGYPT PASSENGER CARS IN ELECTRIC VEHICLE MARKET, BY TYPE, 2021-2030 (THOUSAND UNITS)
TABLE 384 EGYPT COMMERCIAL VEHICLE IN ELECTRIC VEHICLE MARKET, BY TYPE, 2021-2030 (USD MILLION)
TABLE 385 EGYPT COMMERCIAL VEHICLE IN ELECTRIC VEHICLE MARKET, BY TYPE, 2021-2030 (THOUSAND UNITS)
TABLE 386 EGYPT LIGHT COMMERCIAL VEHICLE (LCV) IN ELECTRIC VEHICLE MARKET, TYPE, 2021-2030 (USD MILLION)
TABLE 387 EGYPT LIGHT COMMERCIAL VEHICLE (LCV) IN ELECTRIC VEHICLE MARKET, TYPE, 2021-2030 (THOUSAND UNITS)
TABLE 388 EGYPT HEAVY COMMERCIAL VEHICLE (HCV) IN ELECTRIC VEHICLE MARKET, BY TYPE, 2021-2030 (USD MILLION)
TABLE 389 EGYPT HEAVY COMMERCIAL VEHICLE (HCV) IN ELECTRIC VEHICLE MARKET, BY TYPE, 2021-2030 (THOUSAND UNITS)
TABLE 390 EGYPT ELECTRIC VEHICLE MARKET, BY SALES CHANNEL, 2021-2030 (USD MILLION)
TABLE 391 EGYPT ELECTRIC VEHICLE MARKET, BY SALES CHANNEL, 2021-2030 (THOUSAND UNITS)
TABLE 392 SOUTH AFRICA ELECTRIC VEHICLE MARKET, BY VEHICLE CLASS, 2021-2030 (USD MILLION)
TABLE 393 SOUTH AFRICA ELECTRIC VEHICLE MARKET, BY VEHICLE CLASS, 2021-2030 (THOUSAND UNITS)
TABLE 394 SOUTH AFRICA ELECTRIC VEHICLE MARKET, BY VEHICLE DRIVE TYPE, 2021-2030 (USD MILLION)
TABLE 395 SOUTH AFRICA ELECTRIC VEHICLE MARKET, BY VEHICLE DRIVE TYPE, 2021-2030 (THOUSAND UNITS)
TABLE 396 SOUTH AFRICA ELECTRIC VEHICLE MARKET, BY ELECTRIC MOTOR TYPE, 2021-2030 (USD MILLION)
TABLE 397 SOUTH AFRICA ELECTRIC VEHICLE MARKET, BY ELECTRIC MOTOR TYPE, 2021-2030 (THOUSAND UNITS)
TABLE 398 SOUTH AFRICA ELECTRIC VEHICLE MARKET, BY VEHICLE SPEED, 2021-2030 (USD MILLION)
TABLE 399 SOUTH AFRICA ELECTRIC VEHICLE MARKET, BY VEHICLE SPEED, 2021-2030 (THOUSAND UNITS)
TABLE 400 SOUTH AFRICA ELECTRIC VEHICLE MARKET, BY CHARGING STATION TYPE, 2021-2030 (USD MILLION)
TABLE 401 SOUTH AFRICA ELECTRIC VEHICLE MARKET, BY CHARGING STATION TYPE, 2021-2030 (THOUSAND UNITS)
TABLE 402 SOUTH AFRICA NORMAL CHARGING IN ELECTRIC VEHICLE MARKET, BY LEVEL TYPE, 2021-2030 (USD MILLION)
TABLE 403 SOUTH AFRICA NORMAL CHARGING IN ELECTRIC VEHICLE MARKET, BY LEVEL TYPE, 2021-2030 (THOUSAND UNITS)
TABLE 404 SOUTH AFRICA SUPER CHARGING IN ELECTRIC VEHICLE MARKET, BY LEVEL TYPE, 2021-2030 (USD MILLION)
TABLE 405 SOUTH AFRICA SUPER CHARGING IN ELECTRIC VEHICLE MARKET, BY LEVEL TYPE, 2021-2030 (THOUSAND UNITS)
TABLE 406 SOUTH AFRICA ELECTRIC VEHICLE MARKET, BY VOLTAGE RANGE, 2021-2030 (USD MILLION)
TABLE 407 SOUTH AFRICA ELECTRIC VEHICLE MARKET, BY VOLTAGE RANGE, 2021-2030 (THOUSAND UNITS)
TABLE 408 SOUTH AFRICA ELECTRIC VEHICLE MARKET, BY CONNECTIVITY TYPE, 2021-2030 (USD MILLION)
TABLE 409 SOUTH AFRICA ELECTRIC VEHICLE MARKET, BY CONNECTIVITY TYPE, 2021-2030 (THOUSAND UNITS)
TABLE 410 SOUTH AFRICA ELECTRIC VEHICLE MARKET, BY POWER OUTPUT, 2021-2030 (USD MILLION)
TABLE 411 SOUTH AFRICA ELECTRIC VEHICLE MARKET, BY POWER OUTPUT, 2021-2030 (THOUSAND UNITS)
TABLE 412 SOUTH AFRICA ELECTRIC VEHICLE MARKET, BY BATTERY TYPE, 2021-2030 (USD MILLION)
TABLE 413 SOUTH AFRICA ELECTRIC VEHICLE MARKET, BY BATTERY TYPE, 2021-2030 (THOUSAND UNITS)
TABLE 414 SOUTH AFRICA ELECTRIC VEHICLE MARKET, BY BATTERY FORM, 2021-2030 (USD MILLION)
TABLE 415 SOUTH AFRICA ELECTRIC VEHICLE MARKET, BY BATTERY FORM, 2021-2030 (THOUSAND UNITS)
TABLE 416 SOUTH AFRICA ELECTRIC VEHICLE MARKET, BY POWER TRAIN, 2021-2030 (USD MILLION)
TABLE 417 SOUTH AFRICA ELECTRIC VEHICLE MARKET, BY POWER TRAIN, 2021-2030 (THOUSAND UNITS)
TABLE 418 SOUTH AFRICA ELECTRIC VEHICLE MARKET, PROPULSION TYPE, 2021-2030 (USD MILLION)
TABLE 419 SOUTH AFRICA ELECTRIC VEHICLE MARKET, BY PROPULSION TYPE, BY VOLUME, 2021-2030 (THOUSAND UNITS)
TABLE 420 SOUTH AFRICA BATTERY ELECTRIC VEHICLE (BEV) IN ELECTRIC VEHICLE MARKET, BY POWER OUTPUT, 2021-2030 (USD MILLION)
TABLE 421 SOUTH AFRICA BATTERY ELECTRIC VEHICLE (BEV) IN ELECTRIC VEHICLE MARKET, BY POWER OUTPUT, 2021-2030 (THOUSAND UNITS)
TABLE 422 SOUTH AFRICA PLUG-IN HYBRID ELECTRIC VEHICLE (PHEV) IN ELECTRIC VEHICLE MARKET, BY POWER OUTPUT, 2021-2030 (USD MILLION)
TABLE 423 SOUTH AFRICA PLUG-IN HYBRID ELECTRIC VEHICLE (PHEV) IN ELECTRIC VEHICLE MARKET, BY POWER OUTPUT, 2021-2030 (THOUSAND UNITS)
TABLE 424 SOUTH AFRICA FUEL CELL ELECTRIC VEHICLE (FCEV) IN ELECTRIC VEHICLE MARKET, BY POWER OUTPUT, 2021-2030 (USD MILLION)
TABLE 425 SOUTH AFRICA FUEL CELL ELECTRIC VEHICLE (FCEV) IN ELECTRIC VEHICLE MARKET, BY POWER OUTPUT, 2021-2030 (THOUSAND UNITS)
TABLE 426 SOUTH AFRICA ICE AND MICRO HYBRID VEHICLE IN ELECTRIC VEHICLE MARKET, BY POWER OUTPUT, 2021-2030 (USD MILLION)
TABLE 427 SOUTH AFRICA ICE AND MICRO HYBRID VEHICLE IN ELECTRIC VEHICLE MARKET, BY POWER OUTPUT, 2021-2030 (THOUSAND UNITS)
TABLE 428 SOUTH AFRICA ELECTRIC VEHICLE MARKET, BY VEHICLE TYPE, 2021-2030 (USD MILLION)
TABLE 429 SOUTH AFRICA ELECTRIC VEHICLE MARKET, BY VEHICLE TYPE, 2021-2030 (THOUSAND UNITS)
TABLE 430 SOUTH AFRICA PASSENGER CARS IN ELECTRIC VEHICLE MARKET, BY TYPE, 2021-2030 (USD MILLION)
TABLE 431 SOUTH AFRICA PASSENGER CARS IN ELECTRIC VEHICLE MARKET, BY TYPE, 2021-2030 (THOUSAND UNITS)
TABLE 432 SOUTH AFRICA COMMERCIAL VEHICLE IN ELECTRIC VEHICLE MARKET, BY TYPE, 2021-2030 (USD MILLION)
TABLE 433 SOUTH AFRICA COMMERCIAL VEHICLE IN ELECTRIC VEHICLE MARKET, BY TYPE, 2021-2030 (THOUSAND UNITS)
TABLE 434 SOUTH AFRICA LIGHT COMMERCIAL VEHICLE (LCV) IN ELECTRIC VEHICLE MARKET, TYPE, 2021-2030 (USD MILLION)
TABLE 435 SOUTH AFRICA LIGHT COMMERCIAL VEHICLE (LCV) IN ELECTRIC VEHICLE MARKET, TYPE, 2021-2030 (THOUSAND UNITS)
TABLE 436 SOUTH AFRICA HEAVY COMMERCIAL VEHICLE (HCV) IN ELECTRIC VEHICLE MARKET, BY TYPE, 2021-2030 (USD MILLION)
TABLE 437 SOUTH AFRICA HEAVY COMMERCIAL VEHICLE (HCV) IN ELECTRIC VEHICLE MARKET, BY TYPE, 2021-2030 (THOUSAND UNITS)
TABLE 438 SOUTH AFRICA ELECTRIC VEHICLE MARKET, BY SALES CHANNEL, 2021-2030 (USD MILLION)
TABLE 439 SOUTH AFRICA ELECTRIC VEHICLE MARKET, BY SALES CHANNEL, 2021-2030 (THOUSAND UNITS)
TABLE 440 OMAN ELECTRIC VEHICLE MARKET, BY VEHICLE CLASS, 2021-2030 (USD MILLION)
TABLE 441 OMAN ELECTRIC VEHICLE MARKET, BY VEHICLE CLASS, 2021-2030 (THOUSAND UNITS)
TABLE 442 OMAN ELECTRIC VEHICLE MARKET, BY VEHICLE DRIVE TYPE, 2021-2030 (USD MILLION)
TABLE 443 OMAN ELECTRIC VEHICLE MARKET, BY VEHICLE DRIVE TYPE, 2021-2030 (THOUSAND UNITS)
TABLE 444 OMAN ELECTRIC VEHICLE MARKET, BY ELECTRIC MOTOR TYPE, 2021-2030 (USD MILLION)
TABLE 445 OMAN ELECTRIC VEHICLE MARKET, BY ELECTRIC MOTOR TYPE, 2021-2030 (THOUSAND UNITS)
TABLE 446 OMAN ELECTRIC VEHICLE MARKET, BY VEHICLE SPEED, 2021-2030 (USD MILLION)
TABLE 447 OMAN ELECTRIC VEHICLE MARKET, BY VEHICLE SPEED, 2021-2030 (THOUSAND UNITS)
TABLE 448 OMAN ELECTRIC VEHICLE MARKET, BY CHARGING STATION TYPE, 2021-2030 (USD MILLION)
TABLE 449 OMAN ELECTRIC VEHICLE MARKET, BY CHARGING STATION TYPE, 2021-2030 (THOUSAND UNITS)
TABLE 450 OMAN NORMAL CHARGING IN ELECTRIC VEHICLE MARKET, BY LEVEL TYPE, 2021-2030 (USD MILLION)
TABLE 451 OMAN NORMAL CHARGING IN ELECTRIC VEHICLE MARKET, BY LEVEL TYPE, 2021-2030 (THOUSAND UNITS)
TABLE 452 OMAN SUPER CHARGING IN ELECTRIC VEHICLE MARKET, BY LEVEL TYPE, 2021-2030 (USD MILLION)
TABLE 453 OMAN SUPER CHARGING IN ELECTRIC VEHICLE MARKET, BY LEVEL TYPE, 2021-2030 (THOUSAND UNITS)
TABLE 454 OMAN ELECTRIC VEHICLE MARKET, BY VOLTAGE RANGE, 2021-2030 (USD MILLION)
TABLE 455 OMAN ELECTRIC VEHICLE MARKET, BY VOLTAGE RANGE, 2021-2030 (THOUSAND UNITS)
TABLE 456 OMAN ELECTRIC VEHICLE MARKET, BY CONNECTIVITY TYPE, 2021-2030 (USD MILLION)
TABLE 457 OMAN ELECTRIC VEHICLE MARKET, BY CONNECTIVITY TYPE, 2021-2030 (THOUSAND UNITS)
TABLE 458 OMAN ELECTRIC VEHICLE MARKET, BY POWER OUTPUT, 2021-2030 (USD MILLION)
TABLE 459 OMAN ELECTRIC VEHICLE MARKET, BY POWER OUTPUT, 2021-2030 (THOUSAND UNITS)
TABLE 460 OMAN ELECTRIC VEHICLE MARKET, BY BATTERY TYPE, 2021-2030 (USD MILLION)
TABLE 461 OMAN ELECTRIC VEHICLE MARKET, BY BATTERY TYPE, 2021-2030 (THOUSAND UNITS)
TABLE 462 OMAN ELECTRIC VEHICLE MARKET, BY BATTERY FORM, 2021-2030 (USD MILLION)
TABLE 463 OMAN ELECTRIC VEHICLE MARKET, BY BATTERY FORM, 2021-2030 (THOUSAND UNITS)
TABLE 464 OMAN ELECTRIC VEHICLE MARKET, BY POWER TRAIN, 2021-2030 (USD MILLION)
TABLE 465 OMAN ELECTRIC VEHICLE MARKET, BY POWER TRAIN, 2021-2030 (THOUSAND UNITS)
TABLE 466 OMAN ELECTRIC VEHICLE MARKET, PROPULSION TYPE, 2021-2030 (USD MILLION)
TABLE 467 OMAN ELECTRIC VEHICLE MARKET, BY PROPULSION TYPE, BY VOLUME, 2021-2030 (THOUSAND UNITS)
TABLE 468 OMAN BATTERY ELECTRIC VEHICLE (BEV) IN ELECTRIC VEHICLE MARKET, BY POWER OUTPUT, 2021-2030 (USD MILLION)
TABLE 469 OMAN BATTERY ELECTRIC VEHICLE (BEV) IN ELECTRIC VEHICLE MARKET, BY POWER OUTPUT, 2021-2030 (THOUSAND UNITS)
TABLE 470 OMAN PLUG-IN HYBRID ELECTRIC VEHICLE (PHEV) IN ELECTRIC VEHICLE MARKET, BY POWER OUTPUT, 2021-2030 (USD MILLION)
TABLE 471 OMAN PLUG-IN HYBRID ELECTRIC VEHICLE (PHEV) IN ELECTRIC VEHICLE MARKET, BY POWER OUTPUT, 2021-2030 (THOUSAND UNITS)
TABLE 472 OMAN FUEL CELL ELECTRIC VEHICLE (FCEV) IN ELECTRIC VEHICLE MARKET, BY POWER OUTPUT, 2021-2030 (USD MILLION)
TABLE 473 OMAN FUEL CELL ELECTRIC VEHICLE (FCEV) IN ELECTRIC VEHICLE MARKET, BY POWER OUTPUT, 2021-2030 (THOUSAND UNITS)
TABLE 474 OMAN ICE AND MICRO HYBRID VEHICLE IN ELECTRIC VEHICLE MARKET, BY POWER OUTPUT, 2021-2030 (USD MILLION)
TABLE 475 OMAN ICE AND MICRO HYBRID VEHICLE IN ELECTRIC VEHICLE MARKET, BY POWER OUTPUT, 2021-2030 (THOUSAND UNITS)
TABLE 476 OMAN ELECTRIC VEHICLE MARKET, BY VEHICLE TYPE, 2021-2030 (USD MILLION)
TABLE 477 OMAN ELECTRIC VEHICLE MARKET, BY VEHICLE TYPE, 2021-2030 (THOUSAND UNITS)
TABLE 478 OMAN PASSENGER CARS IN ELECTRIC VEHICLE MARKET, BY TYPE, 2021-2030 (USD MILLION)
TABLE 479 OMAN PASSENGER CARS IN ELECTRIC VEHICLE MARKET, BY TYPE, 2021-2030 (THOUSAND UNITS)
TABLE 480 OMAN COMMERCIAL VEHICLE IN ELECTRIC VEHICLE MARKET, BY TYPE, 2021-2030 (USD MILLION)
TABLE 481 OMAN COMMERCIAL VEHICLE IN ELECTRIC VEHICLE MARKET, BY TYPE, 2021-2030 (THOUSAND UNITS)
TABLE 482 OMAN LIGHT COMMERCIAL VEHICLE (LCV) IN ELECTRIC VEHICLE MARKET, TYPE, 2021-2030 (USD MILLION)
TABLE 483 OMAN LIGHT COMMERCIAL VEHICLE (LCV) IN ELECTRIC VEHICLE MARKET, TYPE, 2021-2030 (THOUSAND UNITS)
TABLE 484 OMAN HEAVY COMMERCIAL VEHICLE (HCV) IN ELECTRIC VEHICLE MARKET, BY TYPE, 2021-2030 (USD MILLION)
TABLE 485 OMAN HEAVY COMMERCIAL VEHICLE (HCV) IN ELECTRIC VEHICLE MARKET, BY TYPE, 2021-2030 (THOUSAND UNITS)
TABLE 486 OMAN ELECTRIC VEHICLE MARKET, BY SALES CHANNEL, 2021-2030 (USD MILLION)
TABLE 487 OMAN ELECTRIC VEHICLE MARKET, BY SALES CHANNEL, 2021-2030 (THOUSAND UNITS)
TABLE 488 REST OF MIDDLE EAST AND AFRICA ELECTRIC VEHICLE MARKET, BY VEHICLE CLASS, 2021-2030 (USD MILLION)
LIST OF FIGURES
Asia-Pacific Hearing Aid Market, By Product Type (Hearing & Device, Hearing Implants, and Hearing & Accessories), Hearing Loss (Sensorineural Loss, Conductive Loss, Mixed Hearing Loss, Auditory Neuropathy Spectrum Disorder (ANSD)), Patient Type (Geriatric, Adults, Pediatrics), Technology (Digital Signal Processing, Wireless Hearing Aid, Directional Microphone Systems, Artificial Intelligence, Digital Noise Reduction, Feedback Management Systems, Data Logging, Telecoil, Tinnitus Masking, and Others), End-Users (Hospitals, Specialty Clinics, Home Care Settings, and Others), Distribution Channel (Direct Tender, Retail Pharmacy, Hospital Pharmacy, Online Sales, and Others), Industry Trends and Forecast to 2030.
TABLE 1 REVIEW FROM END-USER ON THE BASIS OF A FEW PARAMETERS
TABLE 2 REVIEW FROM END-USER BY COMPANY
TABLE 3 ASIA-PACIFIC HEARING AID MARKET, BY PRODUCT TYPE, 2021-2030 (USD MILLION)
TABLE 4 ASIA-PACIFIC HEARING AID DEVICE IN HEARING AID MARKET, BY TYPE, 2021-2030 (USD MILLION)
TABLE 5 ASIA-PACIFIC HEARING AID DEVICE IN HEARING AID MARKET, BY TYPE, 2021-2030 (ASP)
TABLE 6 ASIA-PACIFIC HEARING AID DEVICE IN HEARING AID MARKET, BY TYPE, 2021-2030 (THOUSAND UNITS)
TABLE 7 ASIA-PACIFIC RECEIVER-IN-EAR HEARING AIDS (RIC) IN HEARING AID MARKET, BY TYPE, 2021-2030 (USD MILLION)
TABLE 8 ASIA-PACIFIC BEHIND-THE-EAR HEARING AIDS (BTE) IN HEARING AID MARKET, BY TYPE, 2021-2030 (USD MILLION)
TABLE 9 ASIA-PACIFIC STANDARD BEHIND-THE EAR HEARING IN HEARING AID MARKET, BY TYPE, 2021-2030 (USD MILLION)
TABLE 10 ASIA-PACIFIC POWER PLUS BEHIND-THE EAR HEARING IN HEARING AID MARKET, BY TYPE, 2021-2030 (USD MILLION)
TABLE 11 ASIA-PACIFIC IN-THE-EAR-HEARING AIDS (ITE) IN HEARING AID MARKET, BY TYPE, 2021-2030 (USD MILLION)
TABLE 12 ASIA-PACIFIC HEARING IMPLANTS IN HEARING AID MARKET, BY TYPE, 2021-2030 (USD MILLION)
TABLE 13 ASIA-PACIFIC HEARING IMPLANTS IN HEARING AID MARKET, BY TYPE, 2021-2030 (ASP)
TABLE 14 ASIA-PACIFIC HEARING IMPLANTS IN HEARING AID MARKET, BY TYPE, 2021-2030 (THOUSAND UNITS)
TABLE 15 ASIA-PACIFIC HEARING AID ACCESSORIES IN HEARING AID MARKET, BY TYPE, 2021-2030 (USD MILLION)
TABLE 16 ASIA-PACIFIC HEARING AID ACCESSORIES IN HEARING AID MARKET, BY TYPE, 2021-2030 (ASP)
TABLE 17 ASIA-PACIFIC HEARING AID ACCESSORIES IN HEARING AID MARKET, BY TYPE, 2021-2030 (THOUSAND UNITS)
TABLE 18 ASIA-PACIFIC WIRELESS ACCESSORIES IN HEARING AID MARKET, BY TYPE, 2021-2030 (USD MILLION)
TABLE 19 ASIA-PACIFIC HEARING AID MARKET, BY HEARING LOSS, 2021-2030 (USD MILLION)
TABLE 20 ASIA-PACIFIC SENSORINEURAL LOSS IN HEARING AID MARKET, BY PRODUCT TYPE, 2021-2030 (USD MILLION)
TABLE 21 ASIA-PACIFIC CONDUCTIVE LOSS IN HEARING AID MARKET, BY PRODUCT TYPE, 2021-2030 (USD MILLION)
TABLE 22 ASIA-PACIFIC MIXED HEARING LOSS IN HEARING AID MARKET, BY PRODUCT TYPE, 2021-2030 (USD MILLION)
TABLE 23 ASIA-PACIFIC AUDITORY NEUROPATHY SPECTRUM DISORDER (ANSD)IN HEARING AID MARKET, BY PRODUCT TYPE, 2021-2030 (USD MILLION)
TABLE 24 ASIA-PACIFIC HEARING AID MARKET, BY PATIENT TYPE, 2021-2030 (USD MILLION)
TABLE 25 ASIA-PACIFIC HEARING AID MARKET, BY TECHNOLOGY, 2021-2030 (USD MILLION)
TABLE 26 ASIA-PACIFIC WIRELESS HEARING AID IN HEARING AID MARKET, BY TYPE, 2021-2030 (USD MILLION)
TABLE 27 ASIA-PACIFIC DIGITAL NOISE REDUCTION IN HEARING AID MARKET, BY TYPE, 2021-2030 (USD MILLION)
TABLE 28 ASIA-PACIFIC HEARING AID MARKET, BY END-USERS, 2021-2030 (USD MILLION)
TABLE 29 ASIA-PACIFIC HEARING AID MARKET, BY DISTRIBUTION CHANNEL, 2021-2030 (USD MILLION)
TABLE 30 ASIA-PACIFIC HEARING AID MARKET, BY COUNTRY, 2021-2030 (USD MILLION)
TABLE 31 ASIA-PACIFIC HEARING AID MARKET, BY PRODUCT TYPE, 2021-2030 (USD MILLION)
TABLE 32 ASIA-PACIFIC HEARING AID DEVICE IN HEARING AID MARKET, BY TYPE, 2021-2030 (USD MILLION)
TABLE 33 ASIA-PACIFIC HEARING AID DEVICE IN HEARING AID MARKET, BY TYPE, 2021-2030 (ASP)
TABLE 34 ASIA-PACIFIC HEARING AID DEVICE IN HEARING AID MARKET, BY TYPE, 2021-2030 (THOUSAND UNITS)
TABLE 35 ASIA-PACIFIC RECEIVER-IN-EAR HEARING AIDS (RIC) IN HEARING AID MARKET, BY TYPE, 2021-2030 (USD MILLION)
TABLE 36 ASIA-PACIFIC BEHIND-THE-EAR HEARING AIDS (BTE) IN HEARING AID MARKET, BY TYPE, 2021-2030 (USD MILLION)
TABLE 37 ASIA-PACIFIC STANDARD BEHIND-THE EAR HEARING IN HEARING AID MARKET, BY TYPE, 2021-2030 (USD MILLION)
TABLE 38 ASIA-PACIFIC POWER PLUS BEHIND-THE EAR HEARING IN HEARING AID MARKET, BY TYPE, 2021-2030 (USD MILLION)
TABLE 39 ASIA-PACIFIC IN-THE-EAR-HEARING AIDS (ITE) IN HEARING AID MARKET, BY TYPE, 2021-2030 (USD MILLION)
TABLE 40 ASIA-PACIFIC HEARING IMPLANTS IN HEARING AID MARKET, BY TYPE, 2021-2030 (USD MILLION)
TABLE 41 ASIA-PACIFIC HEARING IMPLANTS IN HEARING AID MARKET, BY TYPE, 2021-2030 (ASP)
TABLE 42 ASIA-PACIFIC HEARING IMPLANTS IN HEARING AID MARKET, BY TYPE, 2021-2030 (THOUSAND UNITS)
TABLE 43 ASIA-PACIFIC HEARING AID ACCESSORIES IN HEARING AID MARKET, BY TYPE, 2021-2030 (USD MILLION)
TABLE 44 ASIA-PACIFIC WIRELESS ACCESSORIES IN WIRELESS ACCESSORIES IN HEARING AID MARKET, BY TYPE, 2021-2030 (USD MILLION)
TABLE 45 ASIA-PACIFIC HEARING AID ACCESSORIES IN HEARING AID MARKET, BY TYPE, 2021-2030 (ASP)
TABLE 46 ASIA-PACIFIC HEARING AID ACCESSORIES IN HEARING AID MARKET, BY TYPE, 2021-2030 (THOUSAND UNITS)
TABLE 47 ASIA-PACIFIC HEARING AID MARKET, BY HEARING LOSS, 2021-2030 (USD MILLION)
TABLE 48 ASIA-PACIFIC SENSORINEURAL LOSS IN HEARING AID MARKET, BY PRODUCT TYPE, 2021-2030 (USD MILLION)
TABLE 49 ASIA-PACIFIC CONDUCTIVE LOSS IN HEARING AID MARKET, BY PRODUCT TYPE, 2021-2030 (USD MILLION)
TABLE 50 ASIA-PACIFIC MIXED HEARING LOSS IN HEARING AID MARKET, BY PRODUCT TYPE, 2021-2030 (USD MILLION)
TABLE 51 ASIA-PACIFIC AUDITORY NEUROPATHY SPECTRUM DISORDER (ANSD) IN HEARING AID MARKET, BY PRODUCT TYPE, 2021-2030 (USD MILLION)
TABLE 52 ASIA-PACIFIC HEARING AID MARKET, BY PATIENT TYPE, 2021-2030 (USD MILLION)
TABLE 53 ASIA-PACIFIC HEARING AID MARKET, BY TECHNOLOGY, 2021-2030 (USD MILLION)
TABLE 54 ASIA-PACIFIC WIRELESS HEARING AID IN HEARING AID MARKET, BY TYPE, 2021-2030 (USD MILLION)
TABLE 55 ASIA-PACIFIC DIGITAL NOISE REDUCTION IN HEARING AID MARKET, BY TYPE, 2021-2030 (USD MILLION)
TABLE 56 ASIA-PACIFIC HEARING AID MARKET, BY END-USERS, 2021-2030 (USD MILLION)
TABLE 57 ASIA-PACIFIC HEARING AID MARKET, BY DISTRIBUTION CHANNEL, 2021-2030 (USD MILLION)
TABLE 58 CHINA HEARING AID MARKET, BY PRODUCT TYPE, 2021-2030 (USD MILLION)
TABLE 59 CHINA HEARING AID DEVICE IN HEARING AID MARKET, BY TYPE, 2021-2030 (USD MILLION)
TABLE 60 CHINA HEARING AID DEVICE IN HEARING AID MARKET, BY TYPE, 2021-2030 (ASP)
TABLE 61 CHINA HEARING AID DEVICE IN HEARING AID MARKET, BY TYPE, 2021-2030 (THOUSAND UNITS)
TABLE 62 CHINA RECEIVER-IN-EAR HEARING AIDS (RIC) IN HEARING AID MARKET, BY TYPE, 2021-2030 (USD MILLION)
TABLE 63 CHINA BEHIND-THE-EAR HEARING AIDS (BTE) IN HEARING AID MARKET, BY TYPE, 2021-2030 (USD MILLION)
TABLE 64 CHINA STANDARD BEHIND-THE EAR HEARING IN HEARING AID MARKET, BY TYPE, 2021-2030 (USD MILLION)
TABLE 65 CHINA POWER PLUS BEHIND-THE EAR HEARING IN HEARING AID MARKET, BY TYPE, 2021-2030 (USD MILLION)
TABLE 66 CHINA IN-THE-EAR-HEARING AIDS (ITE) IN HEARING AID MARKET, BY TYPE, 2021-2030 (USD MILLION)
TABLE 67 CHINA HEARING IMPLANTS IN HEARING AID MARKET, BY TYPE, 2021-2030 (USD MILLION)
TABLE 68 CHINA HEARING IMPLANTS IN HEARING AID MARKET, BY TYPE, 2021-2030 (ASP)
TABLE 69 CHINA HEARING IMPLANTS IN HEARING AID MARKET, BY TYPE, 2021-2030 (THOUSAND UNITS)
TABLE 70 CHINA HEARING AID ACCESSORIES IN HEARING AID MARKET, BY TYPE, 2021-2030 (USD MILLION)
TABLE 71 CHINA WIRELESS ACCESSORIES IN WIRELESS ACCESSORIES IN HEARING AID MARKET, BY TYPE, 2021-2030 (USD MILLION)
TABLE 72 CHINA HEARING AID ACCESSORIES IN HEARING AID MARKET, BY TYPE, 2021-2030 (ASP)
TABLE 73 CHINA HEARING AID ACCESSORIES IN HEARING AID MARKET, BY TYPE, 2021-2030 (THOUSAND UNITS)
TABLE 74 CHINA HEARING AID MARKET, BY HEARING LOSS, 2021-2030 (USD MILLION)
TABLE 75 CHINA SENSORINEURAL LOSS IN HEARING AID MARKET, BY PRODUCT TYPE, 2021-2030 (USD MILLION)
TABLE 76 CHINA CONDUCTIVE LOSS IN HEARING AID MARKET, BY PRODUCT TYPE, 2021-2030 (USD MILLION)
TABLE 77 CHINA MIXED HEARING LOSS IN HEARING AID MARKET, BY PRODUCT TYPE, 2021-2030 (USD MILLION)
TABLE 78 CHINA AUDITORY NEUROPATHY SPECTRUM DISORDER (ANSD) IN HEARING AID MARKET, BY PRODUCT TYPE, 2021-2030 (USD MILLION)
TABLE 79 CHINA HEARING AID MARKET, BY PATIENT TYPE, 2021-2030 (USD MILLION)
TABLE 80 CHINA HEARING AID MARKET, BY TECHNOLOGY, 2021-2030 (USD MILLION)
TABLE 81 CHINA WIRELESS HEARING AID IN HEARING AID MARKET, BY TYPE, 2021-2030 (USD MILLION)
TABLE 82 CHINA DIGITAL NOISE REDUCTION IN HEARING AID MARKET, BY TYPE, 2021-2030 (USD MILLION)
TABLE 83 CHINA HEARING AID MARKET, BY END-USERS, 2021-2030 (USD MILLION)
TABLE 84 CHINA HEARING AID MARKET, BY DISTRIBUTION CHANNEL, 2021-2030 (USD MILLION)
TABLE 85 JAPAN HEARING AID MARKET, BY PRODUCT TYPE, 2021-2030 (USD MILLION)
TABLE 86 JAPAN HEARING AID DEVICE IN HEARING AID MARKET, BY TYPE, 2021-2030 (USD MILLION)
TABLE 87 JAPAN HEARING AID DEVICE IN HEARING AID MARKET, BY TYPE, 2021-2030 (ASP)
TABLE 88 JAPAN HEARING AID DEVICE IN HEARING AID MARKET, BY TYPE, 2021-2030 (THOUSAND UNITS)
TABLE 89 JAPAN RECEIVER-IN-EAR HEARING AIDS (RIC) IN HEARING AID MARKET, BY TYPE, 2021-2030 (USD MILLION)
TABLE 90 JAPAN BEHIND-THE-EAR HEARING AIDS (BTE) IN HEARING AID MARKET, BY TYPE, 2021-2030 (USD MILLION)
TABLE 91 JAPAN STANDARD BEHIND-THE EAR HEARING IN HEARING AID MARKET, BY TYPE, 2021-2030 (USD MILLION)
TABLE 92 JAPAN POWER PLUS BEHIND-THE EAR HEARING IN HEARING AID MARKET, BY TYPE, 2021-2030 (USD MILLION)
TABLE 93 JAPAN IN-THE-EAR-HEARING AIDS (ITE) IN HEARING AID MARKET, BY TYPE, 2021-2030 (USD MILLION)
TABLE 94 JAPAN HEARING IMPLANTS IN HEARING AID MARKET, BY TYPE, 2021-2030 (USD MILLION)
TABLE 95 JAPAN HEARING IMPLANTS IN HEARING AID MARKET, BY TYPE, 2021-2030 (ASP)
TABLE 96 JAPAN HEARING & IMPLANTS IN HEARING AID MARKET, BY TYPE, 2021-2030 (THOUSAND UNITS)
TABLE 97 JAPAN HEARING AID ACCESSORIES IN HEARING AID MARKET, BY TYPE, 2021-2030 (USD MILLION)
TABLE 98 JAPAN WIRELESS ACCESSORIES IN WIRELESS ACCESSORIES IN HEARING AID MARKET, BY TYPE, 2021-2030 (USD MILLION)
TABLE 99 JAPAN HEARING AID ACCESSORIES IN HEARING AID MARKET, BY TYPE, 2021-2030 (ASP)
TABLE 100 JAPAN HEARING AID ACCESSORIES IN HEARING AID MARKET, BY TYPE, 2021-2030 (THOUSAND UNITS)
TABLE 101 JAPAN HEARING AID MARKET, BY HEARING LOSS, 2021-2030 (USD MILLION)
TABLE 102 JAPAN SENSORINEURAL LOSS IN HEARING AID MARKET, BY PRODUCT TYPE, 2021-2030 (USD MILLION)
TABLE 103 JAPAN CONDUCTIVE LOSS IN HEARING AID MARKET, BY PRODUCT TYPE, 2021-2030 (USD MILLION)
TABLE 104 JAPAN MIXED HEARING LOSS IN HEARING AID MARKET, BY PRODUCT TYPE, 2021-2030 (USD MILLION)
TABLE 105 JAPAN AUDITORY NEUROPATHY SPECTRUM DISORDER (ANSD) IN HEARING AID MARKET, BY PRODUCT TYPE, 2021-2030 (USD MILLION)
TABLE 106 JAPAN HEARING AID MARKET, BY PATIENT TYPE, 2021-2030 (USD MILLION)
TABLE 107 JAPAN HEARING AID MARKET, BY TECHNOLOGY, 2021-2030 (USD MILLION)
TABLE 108 JAPAN WIRELESS HEARING AID IN HEARING AID MARKET, BY TYPE, 2021-2030 (USD MILLION)
TABLE 109 JAPAN DIGITAL NOISE REDUCTION IN HEARING AID MARKET, BY TYPE, 2021-2030 (USD MILLION)
TABLE 110 JAPAN HEARING AID MARKET, BY END-USERS, 2021-2030 (USD MILLION)
TABLE 111 JAPAN HEARING AID MARKET, BY DISTRIBUTION CHANNEL, 2021-2030 (USD MILLION)
TABLE 112 INDIA HEARING AID MARKET, BY PRODUCT TYPE, 2021-2030 (USD MILLION)
TABLE 113 INDIA HEARING AID DEVICE IN HEARING AID MARKET, BY TYPE, 2021-2030 (USD MILLION)
TABLE 114 INDIA HEARING AID DEVICE IN HEARING AID MARKET, BY TYPE, 2021-2030 (ASP)
TABLE 115 INDIA HEARING AID DEVICE IN HEARING AID MARKET, BY TYPE, 2021-2030 (THOUSAND UNITS)
TABLE 116 INDIA RECEIVER-IN-EAR HEARING AIDS (RIC) IN HEARING AID MARKET, BY TYPE, 2021-2030 (USD MILLION)
TABLE 117 INDIA BEHIND-THE-EAR HEARING AIDS (BTE) IN HEARING AID MARKET, BY TYPE, 2021-2030 (USD MILLION)
TABLE 118 INDIA STANDARD BEHIND-THE EAR HEARING IN HEARING AID MARKET, BY TYPE, 2021-2030 (USD MILLION)
TABLE 119 INDIA POWER PLUS BEHIND-THE EAR HEARING IN HEARING AID MARKET, BY TYPE, 2021-2030 (USD MILLION)
TABLE 120 INDIA IN-THE-EAR-HEARING AIDS (ITE) IN HEARING AID MARKET, BY TYPE, 2021-2030 (USD MILLION)
TABLE 121 INDIA HEARING IMPLANTS IN HEARING AID MARKET, BY TYPE, 2021-2030 (USD MILLION)
TABLE 122 INDIA HEARING IMPLANTS IN HEARING AID MARKET, BY TYPE, 2021-2030 (ASP)
TABLE 123 INDIA HEARING IMPLANTS IN HEARING AID MARKET, BY TYPE, 2021-2030 (THOUSAND UNITS)
TABLE 124 INDIA HEARING AID ACCESSORIES IN HEARING AID MARKET, BY TYPE, 2021-2030 (USD MILLION)
TABLE 125 INDIA WIRELESS ACCESSORIES IN WIRELESS ACCESSORIES IN HEARING AID MARKET, BY TYPE, 2021-2030 (USD MILLION)
TABLE 126 INDIA HEARING AID ACCESSORIES IN HEARING AID MARKET, BY TYPE, 2021-2030 (ASP)
TABLE 127 INDIA HEARING AID ACCESSORIES IN HEARING AID MARKET, BY TYPE, 2021-2030 (THOUSAND UNITS)
TABLE 128 INDIA HEARING AID MARKET, BY HEARING LOSS, 2021-2030 (USD MILLION)
TABLE 129 INDIA SENSORINEURAL LOSS IN HEARING AID MARKET, BY PRODUCT TYPE, 2021-2030 (USD MILLION)
TABLE 130 INDIA CONDUCTIVE LOSS IN HEARING AID MARKET, BY PRODUCT TYPE, 2021-2030 (USD MILLION)
TABLE 131 INDIA MIXED HEARING LOSS IN HEARING AID MARKET, BY PRODUCT TYPE, 2021-2030 (USD MILLION)
TABLE 132 INDIA AUDITORY NEUROPATHY SPECTRUM DISORDER (ANSD) IN HEARING AID MARKET, BY PRODUCT TYPE, 2021-2030 (USD MILLION)
TABLE 133 INDIA HEARING AID MARKET, BY PATIENT TYPE, 2021-2030 (USD MILLION)
TABLE 134 INDIA HEARING AID MARKET, BY TECHNOLOGY, 2021-2030 (USD MILLION)
TABLE 135 INDIA WIRELESS HEARING AID IN HEARING AID MARKET, BY TYPE, 2021-2030 (USD MILLION)
TABLE 136 INDIA DIGITAL NOISE REDUCTION IN HEARING AID MARKET, BY TYPE, 2021-2030 (USD MILLION)
TABLE 137 INDIA HEARING AID MARKET, BY END-USERS, 2021-2030 (USD MILLION)
TABLE 138 INDIA HEARING AID MARKET, BY DISTRIBUTION CHANNEL, 2021-2030 (USD MILLION)
TABLE 139 AUSTRALIA HEARING AID MARKET, BY PRODUCT TYPE, 2021-2030 (USD MILLION)
TABLE 140 AUSTRALIA HEARING AID DEVICE IN HEARING AID MARKET, BY TYPE, 2021-2030 (USD MILLION)
TABLE 141 AUSTRALIA HEARING AID DEVICE IN HEARING AID MARKET, BY TYPE, 2021-2030 (ASP)
TABLE 142 AUSTRALIA HEARING AID DEVICE IN HEARING AID MARKET, BY TYPE, 2021-2030 (THOUSAND UNITS)
TABLE 143 AUSTRALIA RECEIVER-IN-EAR HEARING AIDS (RIC) IN HEARING AID MARKET, BY TYPE, 2021-2030 (USD MILLION)
TABLE 144 AUSTRALIA BEHIND-THE-EAR HEARING AIDS (BTE) IN HEARING AID MARKET, BY TYPE, 2021-2030 (USD MILLION)
TABLE 145 AUSTRALIA STANDARD BEHIND-THE EAR HEARING IN HEARING AID MARKET, BY TYPE, 2021-2030 (USD MILLION)
TABLE 146 AUSTRALIA POWER PLUS BEHIND-THE EAR HEARING IN HEARING AID MARKET, BY TYPE, 2021-2030 (USD MILLION)
TABLE 147 AUSTRALIA IN-THE-EAR-HEARING AIDS (ITE) IN HEARING AID MARKET, BY TYPE, 2021-2030 (USD MILLION)
TABLE 148 AUSTRALIA HEARING IMPLANTS IN HEARING AID MARKET, BY TYPE, 2021-2030 (USD MILLION)
TABLE 149 AUSTRALIA HEARING IMPLANTS IN HEARING AID MARKET, BY TYPE, 2021-2030 (ASP)
TABLE 150 AUSTRALIA HEARING IMPLANTS IN HEARING AID MARKET, BY TYPE, 2021-2030 (THOUSAND UNITS)
TABLE 151 AUSTRALIA HEARING AID ACCESSORIES IN HEARING AID MARKET, BY TYPE, 2021-2030 (USD MILLION)
TABLE 152 AUSTRALIA WIRELESS ACCESSORIES IN WIRELESS ACCESSORIES IN HEARING AID MARKET, BY TYPE, 2021-2030 (USD MILLION)
TABLE 153 AUSTRALIA HEARING AID ACCESSORIES IN HEARING AID MARKET, BY TYPE, 2021-2030 (ASP)
TABLE 154 AUSTRALIA HEARING AID ACCESSORIES IN HEARING AID MARKET, BY TYPE, 2021-2030 (THOUSAND UNITS)
TABLE 155 AUSTRALIA HEARING AID MARKET, BY HEARING LOSS, 2021-2030 (USD MILLION)
TABLE 156 AUSTRALIA SENSORINEURAL LOSS IN HEARING AID MARKET, BY PRODUCT TYPE, 2021-2030 (USD MILLION)
TABLE 157 AUSTRALIA CONDUCTIVE LOSS IN HEARING AID MARKET, BY PRODUCT TYPE, 2021-2030 (USD MILLION)
TABLE 158 AUSTRALIA MIXED HEARING LOSS IN HEARING AID MARKET, BY PRODUCT TYPE, 2021-2030 (USD MILLION)
TABLE 159 AUSTRALIA AUDITORY NEUROPATHY SPECTRUM DISORDER (ANSD) IN HEARING AID MARKET, BY PRODUCT TYPE, 2021-2030 (USD MILLION)
TABLE 160 AUSTRALIA HEARING AID MARKET, BY PATIENT TYPE, 2021-2030 (USD MILLION)
TABLE 161 AUSTRALIA HEARING AID MARKET, BY TECHNOLOGY, 2021-2030 (USD MILLION)
TABLE 162 AUSTRALIA WIRELESS HEARING AID IN HEARING AID MARKET, BY TYPE, 2021-2030 (USD MILLION)
TABLE 163 AUSTRALIA DIGITAL NOISE REDUCTION IN HEARING AID MARKET, BY TYPE, 2021-2030 (USD MILLION)
TABLE 164 AUSTRALIA HEARING AID MARKET, BY END-USERS, 2021-2030 (USD MILLION)
TABLE 165 AUSTRALIA HEARING AID MARKET, BY DISTRIBUTION CHANNEL, 2021-2030 (USD MILLION)
TABLE 166 SOUTH KOREA HEARING AID MARKET, BY PRODUCT TYPE, 2021-2030 (USD MILLION)
TABLE 167 SOUTH KOREA HEARING AID DEVICE IN HEARING AID MARKET, BY TYPE, 2021-2030 (USD MILLION)
TABLE 168 SOUTH KOREA HEARING AID DEVICE IN HEARING AID MARKET, BY TYPE, 2021-2030 (ASP)
TABLE 169 SOUTH KOREA HEARING AID DEVICE IN HEARING AID MARKET, BY TYPE, 2021-2030 (THOUSAND UNITS)
TABLE 170 SOUTH KOREA RECEIVER-IN-EAR HEARING AIDS (RIC) IN HEARING AID MARKET, BY TYPE, 2021-2030 (USD MILLION)
TABLE 171 SOUTH KOREA BEHIND-THE-EAR HEARING AIDS (BTE) IN HEARING AID MARKET, BY TYPE, 2021-2030 (USD MILLION)
TABLE 172 SOUTH KOREA STANDARD BEHIND-THE EAR HEARING IN HEARING AID MARKET, BY TYPE, 2021-2030 (USD MILLION)
TABLE 173 SOUTH KOREA POWER PLUS BEHIND-THE EAR HEARING IN HEARING AID MARKET, BY TYPE, 2021-2030 (USD MILLION)
TABLE 174 SOUTH KOREA IN-THE-EAR-HEARING AIDS (ITE) IN HEARING AID MARKET, BY TYPE, 2021-2030 (USD MILLION)
TABLE 175 SOUTH KOREA HEARING IMPLANTS IN HEARING AID MARKET, BY TYPE, 2021-2030 (USD MILLION)
TABLE 176 SOUTH KOREA HEARING IMPLANTS IN HEARING AID MARKET, BY TYPE, 2021-2030 (ASP)
TABLE 177 SOUTH KOREA HEARING IMPLANTS IN HEARING AID MARKET, BY TYPE, 2021-2030 (THOUSAND UNITS)
TABLE 178 SOUTH KOREA HEARING AID ACCESSORIES IN HEARING AID MARKET, BY TYPE, 2021-2030 (USD MILLION)
TABLE 179 SOUTH KOREA WIRELESS ACCESSORIES IN WIRELESS ACCESSORIES IN HEARING AID MARKET, BY TYPE, 2021-2030 (USD MILLION)
TABLE 180 SOUTH KOREA HEARING AID ACCESSORIES IN HEARING AID MARKET, BY TYPE, 2021-2030 (ASP)
TABLE 181 SOUTH KOREA HEARING AID ACCESSORIES IN HEARING AID MARKET, BY TYPE, 2021-2030 (THOUSAND UNITS)
TABLE 182 SOUTH KOREA HEARING AID MARKET, BY HEARING LOSS, 2021-2030 (USD MILLION)
TABLE 183 SOUTH KOREA SENSORINEURAL LOSS IN HEARING AID MARKET, BY PRODUCT TYPE, 2021-2030 (USD MILLION)
TABLE 184 SOUTH KOREA CONDUCTIVE LOSS IN HEARING AID MARKET, BY PRODUCT TYPE, 2021-2030 (USD MILLION)
TABLE 185 SOUTH KOREA MIXED HEARING LOSS IN HEARING AID MARKET, BY PRODUCT TYPE, 2021-2030 (USD MILLION)
TABLE 186 SOUTH KOREA AUDITORY NEUROPATHY SPECTRUM DISORDER (ANSD) IN HEARING AID MARKET, BY PRODUCT TYPE, 2021-2030 (USD MILLION)
TABLE 187 SOUTH KOREA HEARING AID MARKET, BY PATIENT TYPE, 2021-2030 (USD MILLION)
TABLE 188 SOUTH KOREA HEARING AID MARKET, BY TECHNOLOGY, 2021-2030 (USD MILLION)
TABLE 189 SOUTH KOREA WIRELESS HEARING AID IN HEARING AID MARKET, BY TYPE, 2021-2030 (USD MILLION)
TABLE 190 SOUTH KOREA DIGITAL NOISE REDUCTION IN HEARING AID MARKET, BY TYPE, 2021-2030 (USD MILLION)
TABLE 191 SOUTH KOREA HEARING AID MARKET, BY END-USERS, 2021-2030 (USD MILLION)
TABLE 192 SOUTH KOREA HEARING AID MARKET, BY DISTRIBUTION CHANNEL, 2021-2030 (USD MILLION)
TABLE 193 INDONESIA HEARING AID MARKET, BY PRODUCT TYPE, 2021-2030 (USD MILLION)
TABLE 194 INDONESIA HEARING AID DEVICE IN HEARING AID MARKET, BY TYPE, 2021-2030 (USD MILLION)
TABLE 195 INDONESIA HEARING AID DEVICE IN HEARING AID MARKET, BY TYPE, 2021-2030 (ASP)
TABLE 196 INDONESIA HEARING AID DEVICE IN HEARING AID MARKET, BY TYPE, 2021-2030 (THOUSAND UNITS)
TABLE 197 INDONESIA RECEIVER-IN-EAR HEARING AIDS (RIC) IN HEARING AID MARKET, BY TYPE, 2021-2030 (USD MILLION)
TABLE 198 INDONESIA BEHIND-THE-EAR HEARING AIDS (BTE) IN HEARING AID MARKET, BY TYPE, 2021-2030 (USD MILLION)
TABLE 199 INDONESIA STANDARD BEHIND-THE EAR HEARING IN HEARING AID MARKET, BY TYPE, 2021-2030 (USD MILLION)
TABLE 200 INDONESIA POWER PLUS BEHIND-THE EAR HEARING IN HEARING AID MARKET, BY TYPE, 2021-2030 (USD MILLION)
TABLE 201 INDONESIA IN-THE-EAR-HEARING AIDS (ITE) IN HEARING AID MARKET, BY TYPE, 2021-2030 (USD MILLION)
TABLE 202 INDONESIA HEARING IMPLANTS IN HEARING AID MARKET, BY TYPE, 2021-2030 (USD MILLION)
TABLE 203 INDONESIA HEARING IMPLANTS IN HEARING AID MARKET, BY TYPE, 2021-2030 (ASP)
TABLE 204 INDONESIA HEARING IMPLANTS IN HEARING AID MARKET, BY TYPE, 2021-2030 (THOUSAND UNITS)
TABLE 205 INDONESIA HEARING AID ACCESSORIES IN HEARING AID MARKET, BY TYPE, 2021-2030 (USD MILLION)
TABLE 206 INDONESIA WIRELESS ACCESSORIES IN WIRELESS ACCESSORIES IN HEARING AID MARKET, BY TYPE, 2021-2030 (USD MILLION)
TABLE 207 INDONESIA HEARING AID ACCESSORIES IN HEARING AID MARKET, BY TYPE, 2021-2030 (ASP)
TABLE 208 INDONESIA HEARING AID ACCESSORIES IN HEARING AID MARKET, BY TYPE, 2021-2030 (THOUSAND UNITS)
TABLE 209 INDONESIA HEARING AID MARKET, BY HEARING LOSS, 2021-2030 (USD MILLION)
TABLE 210 INDONESIA SENSORINEURAL LOSS IN HEARING AID MARKET, BY PRODUCT TYPE, 2021-2030 (USD MILLION)
TABLE 211 INDONESIA CONDUCTIVE LOSS IN HEARING AID MARKET, BY PRODUCT TYPE, 2021-2030 (USD MILLION)
TABLE 212 INDONESIA MIXED HEARING LOSS IN HEARING AID MARKET, BY PRODUCT TYPE, 2021-2030 (USD MILLION)
TABLE 213 INDONESIA AUDITORY NEUROPATHY SPECTRUM DISORDER (ANSD) IN HEARING AID MARKET, BY PRODUCT TYPE, 2021-2030 (USD MILLION)
TABLE 214 INDONESIA HEARING AID MARKET, BY PATIENT TYPE, 2021-2030 (USD MILLION)
TABLE 215 INDONESIA HEARING AID MARKET, BY TECHNOLOGY, 2021-2030 (USD MILLION)
TABLE 216 INDONESIA WIRELESS HEARING AID IN HEARING AID MARKET, BY TYPE, 2021-2030 (USD MILLION)
TABLE 217 INDONESIA DIGITAL NOISE REDUCTION IN HEARING AID MARKET, BY TYPE, 2021-2030 (USD MILLION)
TABLE 218 INDONESIA HEARING AID MARKET, BY END-USERS, 2021-2030 (USD MILLION)
TABLE 219 INDONESIA HEARING AID MARKET, BY DISTRIBUTION CHANNEL, 2021-2030 (USD MILLION)
TABLE 220 THAILAND HEARING AID MARKET, BY PRODUCT TYPE, 2021-2030 (USD MILLION)
TABLE 221 THAILAND HEARING AID DEVICE IN HEARING AID MARKET, BY TYPE, 2021-2030 (USD MILLION)
TABLE 222 THAILAND HEARING AID DEVICE IN HEARING AID MARKET, BY TYPE, 2021-2030 (ASP)
TABLE 223 THAILAND HEARING AID DEVICE IN HEARING AID MARKET, BY TYPE, 2021-2030 (THOUSAND UNITS)
TABLE 224 THAILAND RECEIVER-IN-EAR HEARING AIDS (RIC) IN HEARING AID MARKET, BY TYPE, 2021-2030 (USD MILLION)
TABLE 225 THAILAND BEHIND-THE-EAR HEARING AIDS (BTE) IN HEARING AID MARKET, BY TYPE, 2021-2030 (USD MILLION)
TABLE 226 THAILAND STANDARD BEHIND-THE EAR HEARING IN HEARING AID MARKET, BY TYPE, 2021-2030 (USD MILLION)
TABLE 227 THAILAND POWER PLUS BEHIND-THE EAR HEARING IN HEARING AID MARKET, BY TYPE, 2021-2030 (USD MILLION)
TABLE 228 THAILAND IN-THE-EAR-HEARING AIDS (ITE) IN HEARING AID MARKET, BY TYPE, 2021-2030 (USD MILLION)
TABLE 229 THAILAND HEARING IMPLANTS IN HEARING AID MARKET, BY TYPE, 2021-2030 (USD MILLION)
TABLE 230 THAILAND HEARING IMPLANTS IN HEARING AID MARKET, BY TYPE, 2021-2030 (ASP)
TABLE 231 THAILAND HEARING IMPLANTS IN HEARING AID MARKET, BY TYPE, 2021-2030 (THOUSAND UNITS)
TABLE 232 THAILAND HEARING AID ACCESSORIES IN HEARING AID MARKET, BY TYPE, 2021-2030 (USD MILLION)
TABLE 233 THAILAND WIRELESS ACCESSORIES IN WIRELESS ACCESSORIES IN HEARING AID MARKET, BY TYPE, 2021-2030 (USD MILLION)
TABLE 234 THAILAND HEARING AID ACCESSORIES IN HEARING AID MARKET, BY TYPE, 2021-2030 (ASP)
TABLE 235 THAILAND HEARING AID ACCESSORIES IN HEARING AID MARKET, BY TYPE, 2021-2030 (THOUSAND UNITS)
TABLE 236 THAILAND HEARING AID MARKET, BY HEARING LOSS, 2021-2030 (USD MILLION)
TABLE 237 THAILAND SENSORINEURAL LOSS IN HEARING AID MARKET, BY PRODUCT TYPE, 2021-2030 (USD MILLION)
TABLE 238 THAILAND CONDUCTIVE LOSS IN HEARING AID MARKET, BY PRODUCT TYPE, 2021-2030 (USD MILLION)
TABLE 239 THAILAND MIXED HEARING LOSS IN HEARING AID MARKET, BY PRODUCT TYPE, 2021-2030 (USD MILLION)
TABLE 240 THAILAND AUDITORY NEUROPATHY SPECTRUM DISORDER (ANSD) IN HEARING AID MARKET, BY PRODUCT TYPE, 2021-2030 (USD MILLION)
TABLE 241 THAILAND HEARING AID MARKET, BY PATIENT TYPE, 2021-2030 (USD MILLION)
TABLE 242 THAILAND HEARING AID MARKET, BY TECHNOLOGY, 2021-2030 (USD MILLION)
TABLE 243 THAILAND WIRELESS HEARING AID IN HEARING AID MARKET, BY TYPE, 2021-2030 (USD MILLION)
TABLE 244 THAILAND DIGITAL NOISE REDUCTION IN HEARING AID MARKET, BY TYPE, 2021-2030 (USD MILLION)
TABLE 245 THAILAND HEARING AID MARKET, BY END-USERS, 2021-2030 (USD MILLION)
TABLE 246 THAILAND HEARING AID MARKET, BY DISTRIBUTION CHANNEL, 2021-2030 (USD MILLION)
TABLE 247 SINGAPORE HEARING AID MARKET, BY PRODUCT TYPE, 2021-2030 (USD MILLION)
TABLE 248 SINGAPORE HEARING AID DEVICE IN HEARING AID MARKET, BY TYPE, 2021-2030 (USD MILLION)
TABLE 249 SINGAPORE HEARING AID DEVICE IN HEARING AID MARKET, BY TYPE, 2021-2030 (ASP)
TABLE 250 SINGAPORE HEARING AID DEVICE IN HEARING AID MARKET, BY TYPE, 2021-2030 (THOUSAND UNITS)
TABLE 251 SINGAPORE RECEIVER-IN-EAR HEARING AIDS (RIC) IN HEARING AID MARKET, BY TYPE, 2021-2030 (USD MILLION)
TABLE 252 SINGAPORE BEHIND-THE-EAR HEARING AIDS (BTE) IN HEARING AID MARKET, BY TYPE, 2021-2030 (USD MILLION)
TABLE 253 SINGAPORE STANDARD BEHIND-THE EAR HEARING IN HEARING AID MARKET, BY TYPE, 2021-2030 (USD MILLION)
TABLE 254 SINGAPORE POWER PLUS BEHIND-THE EAR HEARING IN HEARING AID MARKET, BY TYPE, 2021-2030 (USD MILLION)
TABLE 255 SINGAPORE IN-THE-EAR-HEARING AIDS (ITE) IN HEARING AID MARKET, BY TYPE, 2021-2030 (USD MILLION)
TABLE 256 SINGAPORE HEARING IMPLANTS IN HEARING AID MARKET, BY TYPE, 2021-2030 (USD MILLION)
TABLE 257 SINGAPORE HEARING IMPLANTS IN HEARING AID MARKET, BY TYPE, 2021-2030 (ASP)
TABLE 258 SINGAPORE HEARING IMPLANTS IN HEARING AID MARKET, BY TYPE, 2021-2030 (THOUSAND UNITS)
TABLE 259 SINGAPORE HEARING AID ACCESSORIES IN HEARING AID MARKET, BY TYPE, 2021-2030 (USD MILLION)
TABLE 260 SINGAPORE WIRELESS ACCESSORIES IN WIRELESS ACCESSORIES IN HEARING AID MARKET, BY TYPE, 2021-2030 (USD MILLION)
TABLE 261 SINGAPORE HEARING AID ACCESSORIES IN HEARING AID MARKET, BY TYPE, 2021-2030 (ASP)
TABLE 262 SINGAPORE HEARING AID ACCESSORIES IN HEARING AID MARKET, BY TYPE, 2021-2030 (THOUSAND UNITS)
TABLE 263 SINGAPORE HEARING AID MARKET, BY HEARING LOSS, 2021-2030 (USD MILLION)
TABLE 264 SINGAPORE SENSORINEURAL LOSS IN HEARING AID MARKET, BY PRODUCT TYPE, 2021-2030 (USD MILLION)
TABLE 265 SINGAPORE CONDUCTIVE LOSS IN HEARING AID MARKET, BY PRODUCT TYPE, 2021-2030 (USD MILLION)
TABLE 266 SINGAPORE MIXED HEARING LOSS IN HEARING AID MARKET, BY PRODUCT TYPE, 2021-2030 (USD MILLION)
TABLE 267 SINGAPORE AUDITORY NEUROPATHY SPECTRUM DISORDER (ANSD) IN HEARING AID MARKET, BY PRODUCT TYPE, 2021-2030 (USD MILLION)
TABLE 268 SINGAPORE HEARING AID MARKET, BY PATIENT TYPE, 2021-2030 (USD MILLION)
TABLE 269 SINGAPORE HEARING AID MARKET, BY TECHNOLOGY, 2021-2030 (USD MILLION)
TABLE 270 SINGAPORE WIRELESS HEARING AID IN HEARING AID MARKET, BY TYPE, 2021-2030 (USD MILLION)
TABLE 271 SINGAPORE DIGITAL NOISE REDUCTION IN HEARING AID MARKET, BY TYPE, 2021-2030 (USD MILLION)
TABLE 272 SINGAPORE HEARING AID MARKET, BY END-USERS, 2021-2030 (USD MILLION)
TABLE 273 SINGAPORE HEARING AID MARKET, BY DISTRIBUTION CHANNEL, 2021-2030 (USD MILLION)
TABLE 274 PHILIPPINES HEARING AID MARKET, BY PRODUCT TYPE, 2021-2030 (USD MILLION)
TABLE 275 PHILIPPINES HEARING AID DEVICE IN HEARING AID MARKET, BY TYPE, 2021-2030 (USD MILLION)
TABLE 276 PHILIPPINES HEARING AID DEVICE IN HEARING AID MARKET, BY TYPE, 2021-2030 (ASP)
TABLE 277 PHILIPPINES HEARING AID DEVICE IN HEARING AID MARKET, BY TYPE, 2021-2030 (THOUSAND UNITS)
TABLE 278 PHILIPPINES RECEIVER-IN-EAR HEARING AIDS (RIC) IN HEARING AID MARKET, BY TYPE, 2021-2030 (USD MILLION)
TABLE 279 PHILIPPINES BEHIND-THE-EAR HEARING AIDS (BTE) IN HEARING AID MARKET, BY TYPE, 2021-2030 (USD MILLION)
TABLE 280 PHILIPPINES STANDARD BEHIND-THE EAR HEARING IN HEARING AID MARKET, BY TYPE, 2021-2030 (USD MILLION)
TABLE 281 PHILIPPINES POWER PLUS BEHIND-THE EAR HEARING IN HEARING AID MARKET, BY TYPE, 2021-2030 (USD MILLION)
TABLE 282 PHILIPPINES IN-THE-EAR-HEARING AIDS (ITE) IN HEARING AID MARKET, BY TYPE, 2021-2030 (USD MILLION)
TABLE 283 PHILIPPINES HEARING IMPLANTS IN HEARING AID MARKET, BY TYPE, 2021-2030 (USD MILLION)
TABLE 284 PHILIPPINES HEARING IMPLANTS IN HEARING AID MARKET, BY TYPE, 2021-2030 (ASP)
TABLE 285 PHILIPPINES HEARING IMPLANTS IN HEARING AID MARKET, BY TYPE, 2021-2030 (THOUSAND UNITS)
TABLE 286 PHILIPPINES HEARING AID ACCESSORIES IN HEARING AID MARKET, BY TYPE, 2021-2030 (USD MILLION)
TABLE 287 PHILIPPINES WIRELESS ACCESSORIES IN WIRELESS ACCESSORIES IN HEARING AID MARKET, BY TYPE, 2021-2030 (USD MILLION)
TABLE 288 PHILIPPINES HEARING AID ACCESSORIES IN HEARING AID MARKET, BY TYPE, 2021-2030 (ASP)
TABLE 289 PHILIPPINES HEARING AID ACCESSORIES IN HEARING AID MARKET, BY TYPE, 2021-2030 (THOUSAND UNITS)
TABLE 290 PHILIPPINES HEARING AID MARKET, BY HEARING LOSS, 2021-2030 (USD MILLION)
TABLE 291 PHILIPPINES SENSORINEURAL LOSS IN HEARING AID MARKET, BY PRODUCT TYPE, 2021-2030 (USD MILLION)
TABLE 292 PHILIPPINES CONDUCTIVE LOSS IN HEARING AID MARKET, BY PRODUCT TYPE, 2021-2030 (USD MILLION)
TABLE 293 PHILIPPINES MIXED HEARING LOSS IN HEARING AID MARKET, BY PRODUCT TYPE, 2021-2030 (USD MILLION)
TABLE 294 PHILIPPINES AUDITORY NEUROPATHY SPECTRUM DISORDER (ANSD) IN HEARING AID MARKET, BY PRODUCT TYPE, 2021-2030 (USD MILLION)
TABLE 295 PHILIPPINES HEARING AID MARKET, BY PATIENT TYPE, 2021-2030 (USD MILLION)
TABLE 296 PHILIPPINES HEARING AID MARKET, BY TECHNOLOGY, 2021-2030 (USD MILLION)
TABLE 297 PHILIPPINES WIRELESS HEARING AID IN HEARING AID MARKET, BY TYPE, 2021-2030 (USD MILLION)
TABLE 298 PHILIPPINES DIGITAL NOISE REDUCTION IN HEARING AID MARKET, BY TYPE, 2021-2030 (USD MILLION)
TABLE 299 PHILIPPINES HEARING AID MARKET, BY END-USERS, 2021-2030 (USD MILLION)
TABLE 300 PHILIPPINES HEARING AID MARKET, BY DISTRIBUTION CHANNEL, 2021-2030 (USD MILLION)
TABLE 301 MALAYSIA HEARING AID MARKET, BY PRODUCT TYPE, 2021-2030 (USD MILLION)
TABLE 302 MALAYSIA HEARING AID DEVICE IN HEARING AID MARKET, BY TYPE, 2021-2030 (USD MILLION)
TABLE 303 MALAYSIA HEARING AID DEVICE IN HEARING AID MARKET, BY TYPE, 2021-2030 (ASP)
TABLE 304 MALAYSIA HEARING AID DEVICE IN HEARING AID MARKET, BY TYPE, 2021-2030 (THOUSAND UNITS)
TABLE 305 MALAYSIA RECEIVER-IN-EAR HEARING AIDS (RIC) IN HEARING AID MARKET, BY TYPE, 2021-2030 (USD MILLION)
TABLE 306 MALAYSIA BEHIND-THE-EAR HEARING AIDS (BTE) IN HEARING AID MARKET, BY TYPE, 2021-2030 (USD MILLION)
TABLE 307 MALAYSIA STANDARD BEHIND-THE EAR HEARING IN HEARING AID MARKET, BY TYPE, 2021-2030 (USD MILLION)
TABLE 308 MALAYSIA POWER PLUS BEHIND-THE EAR HEARING IN HEARING AID MARKET, BY TYPE, 2021-2030 (USD MILLION)
TABLE 309 MALAYSIA IN-THE-EAR-HEARING AIDS (ITE) IN HEARING AID MARKET, BY TYPE, 2021-2030 (USD MILLION)
TABLE 310 MALAYSIA HEARING IMPLANTS IN HEARING AID MARKET, BY TYPE, 2021-2030 (USD MILLION)
TABLE 311 MALAYSIA HEARING IMPLANTS IN HEARING AID MARKET, BY TYPE, 2021-2030 (ASP)
TABLE 312 MALAYSIA HEARING IMPLANTS IN HEARING AID MARKET, BY TYPE, 2021-2030 (THOUSAND UNITS)
TABLE 313 MALAYSIA HEARING AID ACCESSORIES IN HEARING AID MARKET, BY TYPE, 2021-2030 (USD MILLION)
TABLE 314 MALAYSIA WIRELESS ACCESSORIES IN WIRELESS ACCESSORIES IN HEARING AID MARKET, BY TYPE, 2021-2030 (USD MILLION)
TABLE 315 MALAYSIA HEARING AID ACCESSORIES IN HEARING AID MARKET, BY TYPE, 2021-2030 (ASP)
TABLE 316 MALAYSIA HEARING AID ACCESSORIES IN HEARING AID MARKET, BY TYPE, 2021-2030 (THOUSAND UNITS)
TABLE 317 MALAYSIA HEARING AID MARKET, BY HEARING LOSS, 2021-2030 (USD MILLION)
TABLE 318 MALAYSIA SENSORINEURAL LOSS IN HEARING AID MARKET, BY PRODUCT TYPE, 2021-2030 (USD MILLION)
TABLE 319 MALAYSIA CONDUCTIVE LOSS IN HEARING AID MARKET, BY PRODUCT TYPE, 2021-2030 (USD MILLION)
TABLE 320 MALAYSIA MIXED HEARING LOSS IN HEARING AID MARKET, BY PRODUCT TYPE, 2021-2030 (USD MILLION)
TABLE 321 MALAYSIA AUDITORY NEUROPATHY SPECTRUM DISORDER (ANSD) IN HEARING AID MARKET, BY PRODUCT TYPE, 2021-2030 (USD MILLION)
TABLE 322 MALAYSIA HEARING AID MARKET, BY PATIENT TYPE, 2021-2030 (USD MILLION)
TABLE 323 MALAYSIA HEARING AID MARKET, BY TECHNOLOGY, 2021-2030 (USD MILLION)
TABLE 324 MALAYSIA WIRELESS HEARING AID IN HEARING AID MARKET, BY TYPE, 2021-2030 (USD MILLION)
TABLE 325 MALAYSIA DIGITAL NOISE REDUCTION IN HEARING AID MARKET, BY TYPE, 2021-2030 (USD MILLION)
TABLE 326 MALAYSIA HEARING AID MARKET, BY END-USERS, 2021-2030 (USD MILLION)
TABLE 327 MALAYSIA HEARING AID MARKET, BY DISTRIBUTION CHANNEL, 2021-2030 (USD MILLION)
TABLE 328 VIETNAM HEARING AID MARKET, BY PRODUCT TYPE, 2021-2030 (USD MILLION)
TABLE 329 VIETNAM HEARING AID DEVICE IN HEARING AID MARKET, BY TYPE, 2021-2030 (USD MILLION)
TABLE 330 VIETNAM HEARING AID DEVICE IN HEARING AID MARKET, BY TYPE, 2021-2030 (ASP)
TABLE 331 VIETNAM HEARING AID DEVICE IN HEARING AID MARKET, BY TYPE, 2021-2030 (THOUSAND UNITS)
TABLE 332 VIETNAM RECEIVER-IN-EAR HEARING AIDS (RIC) IN HEARING AID MARKET, BY TYPE, 2021-2030 (USD MILLION)
TABLE 333 VIETNAM BEHIND-THE-EAR HEARING AIDS (BTE) IN HEARING AID MARKET, BY TYPE, 2021-2030 (USD MILLION)
TABLE 334 VIETNAM STANDARD BEHIND-THE EAR HEARING IN HEARING AID MARKET, BY TYPE, 2021-2030 (USD MILLION)
TABLE 335 VIETNAM POWER PLUS BEHIND-THE EAR HEARING IN HEARING AID MARKET, BY TYPE, 2021-2030 (USD MILLION)
TABLE 336 VIETNAM IN-THE-EAR-HEARING AIDS (ITE) IN HEARING AID MARKET, BY TYPE, 2021-2030 (USD MILLION)
TABLE 337 VIETNAM HEARING IMPLANTS IN HEARING AID MARKET, BY TYPE, 2021-2030 (USD MILLION)
TABLE 338 VIETNAM HEARING IMPLANTS IN HEARING AID MARKET, BY TYPE, 2021-2030 (ASP)
TABLE 339 VIETNAM HEARING IMPLANTS IN HEARING AID MARKET, BY TYPE, 2021-2030 (THOUSAND UNITS)
TABLE 340 VIETNAM HEARING AID ACCESSORIES IN HEARING AID MARKET, BY TYPE, 2021-2030 (USD MILLION)
TABLE 341 VIETNAM WIRELESS ACCESSORIES IN WIRELESS ACCESSORIES IN HEARING AID MARKET, BY TYPE, 2021-2030 (USD MILLION)
TABLE 342 VIETNAM HEARING AID ACCESSORIES IN HEARING AID MARKET, BY TYPE, 2021-2030 (ASP)
TABLE 343 VIETNAM HEARING AID ACCESSORIES IN HEARING AID MARKET, BY TYPE, 2021-2030 (THOUSAND UNITS)
TABLE 344 VIETNAM HEARING AID MARKET, BY HEARING LOSS, 2021-2030 (USD MILLION)
TABLE 345 VIETNAM SENSORINEURAL LOSS IN HEARING AID MARKET, BY PRODUCT TYPE, 2021-2030 (USD MILLION)
TABLE 346 VIETNAM CONDUCTIVE LOSS IN HEARING AID MARKET, BY PRODUCT TYPE, 2021-2030 (USD MILLION)
TABLE 347 VIETNAM MIXED HEARING LOSS IN HEARING AID MARKET, BY PRODUCT TYPE, 2021-2030 (USD MILLION)
TABLE 348 VIETNAM AUDITORY NEUROPATHY SPECTRUM DISORDER (ANSD) IN HEARING AID MARKET, BY PRODUCT TYPE, 2021-2030 (USD MILLION)
TABLE 349 VIETNAM HEARING AID MARKET, BY PATIENT TYPE, 2021-2030 (USD MILLION)
TABLE 350 VIETNAM HEARING AID MARKET, BY TECHNOLOGY, 2021-2030 (USD MILLION)
TABLE 351 VIETNAM WIRELESS HEARING AID IN HEARING AID MARKET, BY TYPE, 2021-2030 (USD MILLION)
TABLE 352 VIETNAM DIGITAL NOISE REDUCTION IN HEARING AID MARKET, BY TYPE, 2021-2030 (USD MILLION)
TABLE 353 VIETNAM HEARING AID MARKET, BY END-USERS, 2021-2030 (USD MILLION)
TABLE 354 VIETNAM HEARING AID MARKET, BY DISTRIBUTION CHANNEL, 2021-2030 (USD MILLION)
TABLE 355 TAIWAN HEARING AID MARKET, BY PRODUCT TYPE, 2021-2030 (USD MILLION)
TABLE 356 TAIWAN HEARING AID DEVICE IN HEARING AID MARKET, BY TYPE, 2021-2030 (USD MILLION)
TABLE 357 TAIWAN HEARING AID DEVICE IN HEARING AID MARKET, BY TYPE, 2021-2030 (ASP)
TABLE 358 TAIWAN HEARING AID DEVICE IN HEARING AID MARKET, BY TYPE, 2021-2030 (THOUSAND UNITS)
TABLE 359 TAIWAN RECEIVER-IN-EAR HEARING AIDS (RIC) IN HEARING AID MARKET, BY TYPE, 2021-2030 (USD MILLION)
TABLE 360 TAIWAN BEHIND-THE-EAR HEARING AIDS (BTE) IN HEARING AID MARKET, BY TYPE, 2021-2030 (USD MILLION)
TABLE 361 TAIWAN STANDARD BEHIND-THE EAR HEARING IN HEARING AID MARKET, BY TYPE, 2021-2030 (USD MILLION)
TABLE 362 TAIWAN POWER PLUS BEHIND-THE EAR HEARING IN HEARING AID MARKET, BY TYPE, 2021-2030 (USD MILLION)
TABLE 363 TAIWAN IN-THE-EAR-HEARING AIDS (ITE) IN HEARING AID MARKET, BY TYPE, 2021-2030 (USD MILLION)
TABLE 364 TAIWAN HEARING IMPLANTS IN HEARING AID MARKET, BY TYPE, 2021-2030 (USD MILLION)
TABLE 365 TAIWAN HEARING IMPLANTS IN HEARING AID MARKET, BY TYPE, 2021-2030 (ASP)
TABLE 366 TAIWAN HEARING IMPLANTS IN HEARING AID MARKET, BY TYPE, 2021-2030 (THOUSAND UNITS)
TABLE 367 TAIWAN HEARING AID ACCESSORIES IN HEARING AID MARKET, BY TYPE, 2021-2030 (USD MILLION)
TABLE 368 TAIWAN WIRELESS ACCESSORIES IN WIRELESS ACCESSORIES IN HEARING AID MARKET, BY TYPE, 2021-2030 (USD MILLION)
TABLE 369 TAIWAN HEARING AID ACCESSORIES IN HEARING AID MARKET, BY TYPE, 2021-2030 (ASP)
TABLE 370 TAIWAN HEARING AID ACCESSORIES IN HEARING AID MARKET, BY TYPE, 2021-2030 (THOUSAND UNITS)
TABLE 371 TAIWAN HEARING AID MARKET, BY HEARING LOSS, 2021-2030 (USD MILLION)
TABLE 372 TAIWAN SENSORINEURAL LOSS IN HEARING AID MARKET, BY PRODUCT TYPE, 2021-2030 (USD MILLION)
TABLE 373 TAIWAN CONDUCTIVE LOSS IN HEARING AID MARKET, BY PRODUCT TYPE, 2021-2030 (USD MILLION)
TABLE 374 TAIWAN MIXED HEARING LOSS IN HEARING AID MARKET, BY PRODUCT TYPE, 2021-2030 (USD MILLION)
TABLE 375 TAIWAN AUDITORY NEUROPATHY SPECTRUM DISORDER (ANSD) IN HEARING AID MARKET, BY PRODUCT TYPE, 2021-2030 (USD MILLION)
TABLE 376 TAIWAN HEARING AID MARKET, BY PATIENT TYPE, 2021-2030 (USD MILLION)
TABLE 377 TAIWAN HEARING AID MARKET, BY TECHNOLOGY, 2021-2030 (USD MILLION)
TABLE 378 TAIWAN WIRELESS HEARING AID IN HEARING AID MARKET, BY TYPE, 2021-2030 (USD MILLION)
TABLE 379 TAIWAN DIGITAL NOISE REDUCTION IN HEARING AID MARKET, BY TYPE, 2021-2030 (USD MILLION)
TABLE 380 TAIWAN HEARING AID MARKET, BY END-USERS, 2021-2030 (USD MILLION)
TABLE 381 TAIWAN HEARING AID MARKET, BY DISTRIBUTION CHANNEL, 2021-2030 (USD MILLION)
TABLE 382 REST OF ASIA-PACIFIC HEARING AID MARKET, BY PRODUCT TYPE, 2021-2030 (USD MILLION)
Lista de figuras
FIGURE 1 ASIA-PACIFIC HEARING AID MARKET: SEGMENTATION
FIGURE 2 ASIA-PACIFIC HEARING AID MARKET: DATA TRIANGULATION
FIGURE 3 ASIA-PACIFIC HEARING AID MARKET: DROC ANALYSIS
FIGURE 4 ASIA-PACIFIC HEARING AID MARKET: REGIONAL VS COUNTRY MARKET ANALYSIS
FIGURE 5 ASIA-PACIFIC HEARING AID MARKET: COMPANY RESEARCH ANALYSIS
FIGURE 6 ASIA-PACIFIC HEARING AID MARKET: PRODUCT TYPE TIMELINE CURVE
FIGURE 7 ASIA-PACIFIC HEARING AID MARKET: MULTIVARIATE MODELLING
FIGURE 8 ASIA-PACIFIC HEARING AID MARKET: INTERVIEW DEMOGRAPHICS
FIGURE 9 ASIA-PACIFIC HEARING AID MARKET: DBMR MARKET POSITION GRID
FIGURE 10 ASIA-PACIFIC HEARING AID MARKET: APPLICATION COVERAGE GRID
FIGURE 11 ASIA-PACIFIC HEARING AID MARKET: VENDOR SHARE ANALYSIS
FIGURE 12 ASIA-PACIFIC HEARING AID MARKET: SEGMENTATION
FIGURE 13 THE INCREASING PREVALENCE OF HEARING LOSS CASES IS DRIVING THE ASIA-PACIFIC HEARING AID MARKET GROWTH IN THE FORECAST PERIOD OF 2023 TO 2030
FIGURE 14 HEARING AID DEVICE ARE EXPECTED TO ACCOUNT FOR THE LARGEST SHARE OF THE ASIA-PACIFIC HEARING AID MARKET IN 2023 & 2030
FIGURE 15 HEARING AID PREFERENCES IN 2022
FIGURE 16 PREVALENCE OF HEARING LOSS BY DIFFERENT AGE GROUP ACROSS WESTERN-PACIFIC REGION
FIGURE 17 PREVALENCE OF SENSORINEURAL HEARING LOSS
FIGURE 18 PREVALENCE OF CONDUCTIVE HEARING LOSS
FIGURE 19 DRIVERS, RESTRAINTS, OPPORTUNITIES, AND CHALLENGES OF THE ASIA-PACIFIC HEARING AID MARKET
FIGURE 20 PREVALENCE OF HEARING LOSS IN THE CONSTANCES COHORT
FIGURE 21 BELOW IS THE GRAPHICAL REPRESENTATION OF DATA BY WHO IN THE REGION –
FIGURE 22 ASIA-PACIFIC HEARING AID MARKET: BY PRODUCT TYPE, 2022
FIGURE 23 ASIA-PACIFIC HEARING AID MARKET: BY HEARING LOSS, 2022
FIGURE 24 ASIA-PACIFIC HEARING AID MARKET: BY PATIENT TYPE, 2022
FIGURE 25 ASIA-PACIFIC HEARING AID MARKET: BY TECHNOLOGY, 2022
FIGURE 26 ASIA-PACIFIC HEARING AID MARKET: BY END-USERS, 2022
FIGURE 27 ASIA-PACIFIC HEARING AID MARKET: BY DISTRIBUTION CHANNEL, 2022
FIGURE 28 ASIA-PACIFIC HEARING AID MARKET: SNAPSHOT (2022)
FIGURE 29 ASIA-PACIFIC HEARING AID MARKET: BY COUNTRY (2022)
FIGURE 30 ASIA-PACIFIC HEARING AID MARKET: BY COUNTRY (2023 & 2030)
FIGURE 31 ASIA-PACIFIC HEARING AID MARKET: BY COUNTRY (2022 & 2030)
FIGURE 32 ASIA-PACIFIC HEARING AID MARKET: BY PRODUCT TYPE (2023-2030)
FIGURE 33 ASIA-PACIFIC HEARING AID MARKET: COMPANY SHARE 2022 (%)
FIGURE 34 CHINA HEARING AID MARKET: COMPANY SHARE 2022 (%)
FIGURE 35 JAPAN HEARING AID MARKET: COMPANY SHARE 2022 (%)
FIGURE 36 INDIA HEARING AID MARKET: COMPANY SHARE 2022 (%)
FIGURE 37 AUSTRALIA HEARING AID MARKET: COMPANY SHARE 2022 (%)
FIGURE 38 SOUTH KOREA HEARING AID MARKET: COMPANY SHARE 2022 (%)
FIGURE 39 INDONESIA HEARING AID MARKET: COMPANY SHARE 2022 (%)
FIGURE 40 THAILAND HEARING AID MARKET: COMPANY SHARE 2022 (%)
FIGURE 41 SINGAPORE HEARING AID MARKET: COMPANY SHARE 2022 (%)
FIGURE 42 PHILIPPINES HEARING AID MARKET: COMPANY SHARE 2022 (%)
FIGURE 43 MALAYSIA HEARING AID MARKET: COMPANY SHARE 2022 (%)
FIGURE 44 VIETNAM HEARING AID MARKET: COMPANY SHARE 2022 (%)
FIGURE 45 TAIWAN HEARING AID MARKET: COMPANY SHARE 2022 (%)
Metodología de investigación
La recopilación de datos y el análisis del año base se realizan utilizando módulos de recopilación de datos con muestras de gran tamaño. La etapa incluye la obtención de información de mercado o datos relacionados a través de varias fuentes y estrategias. Incluye el examen y la planificación de todos los datos adquiridos del pasado con antelación. Asimismo, abarca el examen de las inconsistencias de información observadas en diferentes fuentes de información. Los datos de mercado se analizan y estiman utilizando modelos estadísticos y coherentes de mercado. Además, el análisis de la participación de mercado y el análisis de tendencias clave son los principales factores de éxito en el informe de mercado. Para obtener más información, solicite una llamada de un analista o envíe su consulta.
La metodología de investigación clave utilizada por el equipo de investigación de DBMR es la triangulación de datos, que implica la extracción de datos, el análisis del impacto de las variables de datos en el mercado y la validación primaria (experto en la industria). Los modelos de datos incluyen cuadrícula de posicionamiento de proveedores, análisis de línea de tiempo de mercado, descripción general y guía del mercado, cuadrícula de posicionamiento de la empresa, análisis de patentes, análisis de precios, análisis de participación de mercado de la empresa, estándares de medición, análisis global versus regional y de participación de proveedores. Para obtener más información sobre la metodología de investigación, envíe una consulta para hablar con nuestros expertos de la industria.
Personalización disponible
Data Bridge Market Research es líder en investigación formativa avanzada. Nos enorgullecemos de brindar servicios a nuestros clientes existentes y nuevos con datos y análisis que coinciden y se adaptan a sus objetivos. El informe se puede personalizar para incluir análisis de tendencias de precios de marcas objetivo, comprensión del mercado de países adicionales (solicite la lista de países), datos de resultados de ensayos clínicos, revisión de literatura, análisis de mercado renovado y base de productos. El análisis de mercado de competidores objetivo se puede analizar desde análisis basados en tecnología hasta estrategias de cartera de mercado. Podemos agregar tantos competidores sobre los que necesite datos en el formato y estilo de datos que esté buscando. Nuestro equipo de analistas también puede proporcionarle datos en archivos de Excel sin procesar, tablas dinámicas (libro de datos) o puede ayudarlo a crear presentaciones a partir de los conjuntos de datos disponibles en el informe.

