Image

Mercado de gomitas y jaleas de Asia y el Pacífico: tendencias de la industria y pronóstico hasta 2029

Bebida alimenticia

Image

Mercado de gomitas y jaleas de Asia y el Pacífico: tendencias de la industria y pronóstico hasta 2029

  • Bebida alimenticia
  • Próximo informe
  • mayo 2022
  • Asia-Pacífico
  • 350 páginas
  • Número de mesas: 220
  • Número de figuras: 60

Mercado de gomitas y jaleas de Asia y el Pacífico: tendencias de la industria y pronóstico hasta 2029

Tamaño del mercado en miles de millones de dólares

CAGR: % Diagram

Diagram Período de pronóstico 2021-2029
Diagram Tamaño del mercado (año base) USD 3009,07 millones
Diagram Tamaño del mercado (año previsto) 5.694,56 millones de dólares
Diagram CAGR %

Gomitas y jaleas de Asia y el Pacífico por tipo de producto (gomitas, jaleas), tipo (gomitas complementarias, gomitas tradicionales, gomitas bajas en azúcar, gomitas sin azúcar), ingrediente de gelatina (pectina con alto contenido de metoxilo (HMP), pectina con bajo contenido de metoxilo (LMP)), Consumidor objetivo (adultos, niños), categoría (OGM, no OGM), sabores (cereza, melocotón, matcha, coco, café, fresa, limón, manzana, naranja, miel y jengibre, mango, sandía, piña, granada, frambuesa). , Uvas, Chocolate, Lima, Combinación, Otros), Ingrediente (Gelatina, Pectina, Almidón, Azúcar, Jarabe de Glucosa, Ácido Cítrico, Otros), Tipo de Envase (Botellas y Frascos, Bolsas Stand Up, Bolsitas, Paquetes, Bandejas Club Store, Otros), canal de distribución (venta minorista en tiendas, venta minorista fuera de tiendas): tendencias de la industria y pronóstico para 2029

Asia-Pacific Gummies and jellies Market

Análisis y tamaño del mercado

El uso de un agente gelificante o estabilizador es una característica común de estos productos. Las gomitas, en cambio, tienen una textura gomosa y están elaboradas con gelatina. Los caramelos de gelatina, por otro lado, se elaboran con ingredientes distintos a la gelatina, como agar, goma, almidón, acacia, etc. Las gelatinas pueden tener diferentes texturas, pero no son tan elásticas como las gomitas. El mercado de jaleas y gominolas ha crecido significativamente en los últimos años.

Data Bridge Market Research analiza que se espera que el mercado de gomitas y jaleas, valorado en 3009,07 millones de dólares en 2021, alcance el valor de 5694,56 millones de dólares en 2029, con una tasa compuesta anual del 8,3% durante el período previsto de 2022 a 2029.

Definición de mercado

Las gomitas y jaleas son tipos similares de dulces y productos de confitería que se elaboran con una base de gelatina y diversos aditivos e ingredientes aromatizados, así como colorantes, para producir caramelos en una variedad de formas, tamaños, colores y sabores.

Alcance del informe y segmentación del mercado

Métrica de informe

Detalles

Período de pronóstico

2022 a 2029

Año base

2021

Años históricos

2020 (Personalizable para 2019 - 2014)

Unidades Cuantitativas

Ingresos en millones de dólares, volúmenes en unidades, precios en dólares

Segmentos cubiertos

Por tipo de producto (gomitas, jaleas), tipo (gomitas complementarias, gomitas tradicionales, gomitas bajas en azúcar, gomitas sin azúcar), ingrediente de gelatina (pectina con alto contenido de metoxilo (HMP), pectina con bajo contenido de metoxilo (LMP)), consumidor objetivo (adultos, niños) ), Categoría (OGM, No-GMO), Sabores (Cereza, Melocotón, matcha, Coco, Café, Fresa, Limón, Manzana, Naranja, Miel Y Jengibre, mango, Sandía, Piña, Granada, Frambuesa, Uvas, Chocolate, Lima, Combinación, Otros), Ingrediente (Gelatina, Pectina, Almidón, Azúcar, jarabe de glucosa, ácido cítrico, otros), tipo de embalaje (botellas y frascos, bolsas stand up, bolsitas, paquetes, bandejas de Club Store, otros), canal de distribución (venta minorista en tienda, venta minorista fuera de tienda)

Países cubiertos

China, India, Japón, Corea del Sur, Australia, Singapur, Indonesia, Tailandia, Malasia, Vietnam, Nueva Zelanda, Filipinas, resto de Asia-Pacífico

Actores del mercado cubiertos

HARIBO of America, Inc (EE.UU.), Ferrero (Luxemburgo), Perfetti Van Melle (EE.UU.), Meiji Holdings Co., Ltd. (Países Bajos), Bayer AG (Alemania), Candy People (EE.UU.), CHURCH & DWIGHT CO., INC. (EE. UU.), GlaxoSmithKline plc (EE.UU.)Dixie Brands (EE.UU.), KANNAWAY LLC. (Estados Unidos), CURA CS, LLC. (EE.UU.), KAZMIRA (EE.UU.), Curaleaf (EE.UU.) y CannazALL (EE.UU.) New Age Inc. (EE.UU.)

Oportunidades

  • Actividades de investigación y desarrollo en el proceso de fabricación actual.
  • Intervención de nuevos sabores y texturas
  • Creciente población de jóvenes en los países en desarrollo

Dinámica del mercado de gomitas y jaleas

Conductores

  • La creciente población vegana en todo el mundo y el alto gasto en dulces

La creciente población vegana en todo el mundo, así como los altos niveles de gasto de los consumidores endulces, jaleas y otros productos de confitería, son los principales factores que fomentan el crecimiento del mercado de gomitas y jaleas. Además, la creciente conciencia de los consumidores sobre los efectos secundarios negativos del consumo de chocolate, así como los sabores, texturas, diseño, forma, empaque y contenido de azúcar únicos de los dulces, impulsarán el crecimiento en el valor de mercado de las gomitas y jaleas.

  • Mejor conocimiento del bienestar sanitario.

Dado que se trata del grupo de consumidores más grande y de más rápido crecimiento, los fabricantes están desarrollando estrategias innovadoras de empaque y marketing que diferencian los productos por sus envoltorios, como envoltorios 3D, tener un código QR en el envoltorio de un juego en línea y realizar un concurso para atraer a los compradores. La facilidad de manipulación y suministro de los caramelos se atribuye a la creciente demanda de jaleas y gomitas en las confiterías de azúcar en todo el mundo. A diferencia del chocolate, las jaleas y gomitas no necesitan almacenarse en un ambiente refrigerado, lo que aumenta la demanda en las zonas rurales de los países en desarrollo.

Oportunidad

Existen varias oportunidades en el mercado de gomitas y jaleas de Asia y el Pacífico que las empresas pueden aprovechar para crecer y expandir sus operaciones. Las empresas, por ejemplo, podrían realizar investigación y desarrollo para mejorar su proceso de fabricación actual. De igual forma, tienen la oportunidad de introducir al mercado gelatinas y gomitas de nuevos sabores, ampliando así su portafolio de productos. Las empresas del mercado sólo pueden crecer en el entorno empresarial de Asia y el Pacífico si aprovechan estas oportunidades.

Restricciones

El mercado de gomitas y jaleas se ve obstaculizado por una serie de factores que reducen su atractivo y potencial de crecimiento. Un impedimento importante es el aumento de los problemas de salud entre las personas preocupadas por su salud. Otra limitación importante es la naturaleza siempre cambiante de la tecnología. Podría suponer un importante cuello de botella para las empresas, ya que les puede resultar difícil implementar nuevas tecnologías en sus procesos y actividades de producción. Mientras operan en un entorno de Asia y el Pacífico, las empresas deben considerar varias tendencias de la industria de jaleas y gomitas que podrían actuar como limitaciones.

Este informe de mercado de Gomitas y jaleas proporciona detalles de nuevos desarrollos recientes, regulaciones comerciales, análisis de importación y exportación, análisis de producción, optimización de la cadena de valor, participación de mercado, impacto de los actores del mercado nacional y localizado, analiza oportunidades en términos de bolsillos de ingresos emergentes, cambios en regulaciones del mercado, análisis estratégico del crecimiento del mercado, tamaño del mercado, crecimientos del mercado de categorías, nichos de aplicación y dominio, aprobaciones de productos, lanzamientos de productos, expansiones geográficas, innovaciones tecnológicas en el mercado. Para obtener más información sobre el mercado de gomitas y jaleas, comuníquese con Data Bridge Market Research para obtener un resumen del analista; nuestro equipo lo ayudará a tomar una decisión de mercado informada para lograr el crecimiento del mercado.

Impacto de COVID-19 en el mercado de gomitas y jaleas

La pandemia de Covid 19 ha tenido un impacto negativo en el mercado de jaleas y gomitas de Asia y el Pacífico. Debido a la implementación de estrictas pautas de distanciamiento social y normas de bloqueo, las actividades de producción cesaron, lo que provocó la interrupción del proceso de producción. Sin embargo, se espera que el mercado se recupere durante el período previsto. Las empresas del dinámico mercado de jaleas y gomitas han estado desarrollando nuevos sabores y variedades para revitalizar el mercado.

Alcance del mercado de gomitas y jaleas de Asia y el Pacífico

El mercado de gomitas y jaleas está segmentado según el tipo de producto, tipo, ingrediente de gelatina, consumidor objetivo, categoría, sabores, ingrediente, tipo de envase y canal de distribución. El crecimiento entre estos segmentos lo ayudará a analizar los segmentos de escaso crecimiento en las industrias y brindará a los usuarios una valiosa descripción general del mercado e información sobre el mercado para ayudarlos a tomar decisiones estratégicas para identificar las aplicaciones principales del mercado.

Tipo

  • Gomitas suplementarias
  • Gomitas tradicionales
  • Gomitas bajas en azúcar

Tipo de producto

  • Gomitas
  • jaleas

ingrediente de gelatina

  • Pectina de alto metoxilo (HMP)
  • Pectina baja en metoxilo (LMP)
  • Pectina de alto metoxilo (HMP)

Consumidores

  • Adultos
  • Niños

Categoría

  • OGM
  • NO GMO

Sabores

  • Cereza
  • Durazno
  • Matcha
  • Coco
  • Café
  • Fresa
  • Limón
  • Manzana
  • Naranja
  • Miel y jengibre
  • mango
  • Sandía
  • Piña
  • Granada
  • Frambuesa
  • Uvas
  • Chocolate
  • Cal
  • Combinación
  • Otros

Ingredientes

embalaje

  • botellas y frascos
  • Bolsas de pie
  • Bolsita
  • Paquetes
  • Bandejas de la tienda del club
  • Otros

Canal de distribución

  • Venta minorista basada en tiendas
  • Venta al por menor sin tienda

Análisis/perspectivas regionales del mercado de gomitas y jaleas

Se analiza el mercado de gomitas y jaleas y se proporcionan conocimientos y tendencias sobre el tamaño del mercado por país, tipo de producto, tipo, ingrediente de gelatina, consumidor objetivo, categoría, sabores, ingrediente, tipo de embalaje y canal de distribución, como se mencionó anteriormente.

Los países cubiertos en el informe del mercado de gomitas y jaleas son China, India, Japón, Corea del Sur, Australia, Singapur, Indonesia, Tailandia, Malasia, Vietnam, Nueva Zelanda, Filipinas y el resto de Asia-Pacífico.


La sección de países del informe también proporciona factores que impactan el mercado individual y cambios en la regulación del mercado que impactan las tendencias actuales y futuras del mercado. Puntos de datos como el análisis de la cadena de valor ascendente y descendente, las tendencias técnicas y el análisis de las cinco fuerzas de Porter y los estudios de casos son algunos de los indicadores utilizados para pronosticar el escenario del mercado para países individuales. Además, se consideran la presencia y disponibilidad de las marcas de Asia y el Pacífico y los desafíos que enfrentan debido a la competencia grande o escasa de las marcas locales y nacionales, el impacto de los aranceles internos y las rutas comerciales, al tiempo que se proporciona un análisis de pronóstico de los datos del país.

Panorama competitivo y cuota de mercado Análisis Gomitas y jaleas

El panorama competitivo del mercado de gomitas y jaleas proporciona detalles por competidor. Los detalles incluidos son descripción general de la empresa, finanzas de la empresa, ingresos generados, potencial de mercado, inversión en investigación y desarrollo, nuevas iniciativas de mercado, presencia en Asia y el Pacífico, sitios e instalaciones de producción, capacidades de producción, fortalezas y debilidades de la empresa, lanzamiento de productos, ancho y amplitud del producto. , dominio de la aplicación. Los puntos de datos anteriores proporcionados únicamente están relacionados con el enfoque de las empresas en el mercado de gomitas y jaleas.

Algunos de los principales actores que operan en el mercado de gomitas y jaleas son:

  • HARIBO of America, Inc (EE. UU.)
  • Ferrero (Luxemburgo)
  • Perfecto Van Melle (Estados Unidos)
  • Meiji Holdings Co., Ltd. (Países Bajos)
  • Bayer AG (Alemania)
  • Gente de dulces (Estados Unidos)
  • IGLESIA Y DWIGHT CO., INC. (EE. UU.)
  • GlaxoSmithKline plc (A NOSOTROS)
  • Marcas Dixie (EE. UU.)
  • CABEZA DERECHA LLC. (A NOSOTROS)
  • CURA CS, LLC. (A NOSOTROS)
  • KAZMIRA (Estados Unidos)
  • Curaleaf (Estados Unidos)
  • CannazALL (Estados Unidos)
  • New Age Inc. (EE. UU.)


SKU-

TABLA 1 MERCADO DE GOMITAS Y JALEAS DE ASIA Y EL PACÍFICO, POR REGIÓN, 2018-2027 (MILLONES DE USD)

TABLA 2 MERCADO DE GOMITAS Y JALEAS DE ASIA Y EL PACÍFICO, POR TIPO DE PRODUCTO, 2018-2027 (MILLONES DE USD)

TABLA 3 MERCADO DE GOMITAS DE ASIA Y EL PACÍFICO, POR TIPO, 2018-2027 (MILLONES DE USD)

TABLA 4 GOMAS SUPLEMENTARIAS DE ASIA Y EL PACÍFICO EN EL MERCADO DE GOMAS, POR TIPO, 2018-2027 (MILLONES DE USD)

TABLA 5 GOMAS DE VITAMINA EN EL MERCADO DE GOMAS DE ASIA Y EL PACÍFICO, POR TIPO, 2018-2027 (MILLONES DE USD)

TABLA 6 MERCADO DE VITAMINA ÚNICA EN GOMAS DE ASIA Y EL PACÍFICO, POR TIPO, 2018-2027 (MILLONES DE USD)

TABLA 7 MERCADO DE VITAMINA B EN GOMAS DE ASIA Y EL PACÍFICO, POR TIPO, 2018-2027 (MILLONES DE USD)

TABLA 8 GOMITAS PROBIÓTICAS DE ASIA Y EL PACÍFICO EN EL MERCADO DE GOMAS, POR TIPO, 2018-2027 (MILLONES DE USD)

TABLA 9 GOMAS SUPLEMENTARIAS DE ASIA Y EL PACÍFICO EN EL MERCADO DE GOMAS, POR APLICACIÓN, 2018-2027 (MILLONES DE USD)

TABLA 10 MERCADO DE JALEAS DE ASIA Y EL PACÍFICO, POR INGREDIENTE DE JALEA, 2018-2027 (MILLONES DE USD)

TABLA 11 MERCADO DE GOMITAS Y JALEAS DE ASIA Y EL PACÍFICO, POR CONSUMIDOR OBJETIVO, 2018-2027 (MILLONES DE USD)

TABLA 12 MERCADO DE GOMAS Y JALEAS PARA ADULTOS DE ASIA Y PACÍFICO, POR CONSUMIDOR OBJETIVO, 2018-2027 (MILLONES DE USD)

TABLA 13 MERCADO DE GOMITAS Y JALEAS DE ASIA Y EL PACÍFICO, POR CATEGORÍA, 2018-2027 (MILLONES DE USD)

TABLA 14 MERCADO DE GOMITAS Y JALEAS DE ASIA Y EL PACÍFICO, POR SABORES, 2018-2027 (MILLONES DE USD)

TABLA 15 MERCADO DE GOMITAS Y JALEAS DE ASIA Y EL PACÍFICO, POR INGREDIENTE, 2018-2027 (MILLONES DE USD)

TABLA 16 MERCADO DE GOMITAS Y JALEAS DE ASIA Y EL PACÍFICO, POR TIPO DE ENVASE, 2018-2027 (MILLONES DE USD)

TABLA 17 MERCADO DE BOTELLAS Y TARROS DE GOMAS Y JALEAS EN ASIA Y EL PACÍFICO, POR TIPO DE ENVASE, 2018-2027 (MILLONES DE USD)

TABLA 18 MERCADO DE ENVASES DE GOMAS Y JALEAS DE ASIA Y EL PACÍFICO, POR TIPO DE ENVASE, 2018-2027 (MILLONES DE USD)

TABLA 19 MERCADO DE GOMITAS Y JALEAS DE ASIA Y EL PACÍFICO, POR CANAL DE DISTRIBUCIÓN, 2018-2027 (MILLONES DE USD)

TABLA 20 MERCADO MINORISTA DE GOMAS Y JALEAS EN TIENDAS DE ASIA Y EL PACÍFICO, POR CANAL DE DISTRIBUCIÓN, 2018-2027 (MILLONES DE USD)

TABLA 21 MERCADO MINORISTA DE GOMAS Y JALEAS EN ASIA Y EL PACÍFICO, POR CANAL DE DISTRIBUCIÓN, 2018-2027 (MILLONES DE USD)

TABLA 22 PORCENTAJE ESTIMADO (AJUSTADO POR EDAD) DE ADULTOS ESTADOUNIDENSES CON SOBREPESO Y OBESIDAD POR SEXO, 2013-2014 DATOS NHANES

TABLA 23 MERCADO DE GOMITAS Y JALEAS DE ASIA Y EL PACÍFICO, POR TIPO DE PRODUCTO, 2018-2027 (MILLONES DE USD)

TABLA 24 MERCADO DE GOMITAS DE ASIA Y EL PACÍFICO, POR TIPO, 2018-2027 (MILLONES DE USD)

TABLA 25 GOMAS SUPLEMENTARIAS DE ASIA Y EL PACÍFICO EN EL MERCADO DE GOMAS, POR TIPO, 2018-2027 (MILLONES DE USD)

TABLA 26 GOMITAS DE VITAMINA EN EL MERCADO DE GOMAS DE ASIA Y EL PACÍFICO, POR TIPO, 2018-2027 (MILLONES DE USD)

TABLA 27 MERCADO DE VITAMINA ÚNICA EN GOMAS DE ASIA Y EL PACÍFICO, POR TIPO, 2018-2027 (MILLONES DE USD)

TABLA 28 MERCADO DE VITAMINA B EN GOMAS DE ASIA Y EL PACÍFICO, POR TIPO, 2018-2027 (MILLONES DE USD)

TABLA 29 GOMITAS PROBIÓTICAS DE ASIA Y EL PACÍFICO EN EL MERCADO DE GOMAS, POR TIPO, 2018-2027 (MILLONES DE USD)

TABLA 30 GOMAS SUPLEMENTARIAS DE ASIA Y EL PACÍFICO EN EL MERCADO DE GOMAS, POR APLICACIÓN, 2018-2027 (MILLONES DE USD)

TABLA 31 MERCADO DE JALEAS DE ASIA Y PACÍFICO, POR INGREDIENTE DE JALEA, 2018-2027 (MILLONES DE USD)

TABLA 32 MERCADO DE GOMITAS Y JALEAS DE ASIA Y EL PACÍFICO, POR CONSUMIDOR OBJETIVO, 2018-2027 (MILLONES DE USD)

TABLA 33 MERCADO DE GOMAS Y JALEAS PARA ADULTOS DE ASIA Y PACÍFICO, POR CONSUMIDOR OBJETIVO, 2018-2027 (MILLONES DE USD)

TABLA 34 MERCADO DE GOMITAS Y JALEAS DE ASIA Y EL PACÍFICO, POR CATEGORÍA 2018-2027 (MILLONES DE USD)

TABLA 35 MERCADO DE GOMITAS Y JALEAS DE ASIA Y EL PACÍFICO, POR SABORES, 2018-2027 (MILLONES DE USD)

TABLA 36 MERCADO DE GOMITAS Y JALEAS DE ASIA Y EL PACÍFICO, POR INGREDIENTE, 2018-2027 (MILLONES DE USD)

TABLA 37 MERCADO DE GOMITAS Y JALEAS DE ASIA Y EL PACÍFICO, POR TIPO DE ENVASE, 2018-2027 (MILLONES DE USD)

CUADRO 38 MERCADO DE BOTELLAS Y TARROS DE GOMAS Y JALEAS EN ASIA Y EL PACÍFICO, POR TIPO DE ENVASE, 2018-2027 (MILLONES DE USD)

TABLA 39 MERCADO DE ENVASES DE GOMAS Y JALEAS DE ASIA Y EL PACÍFICO, POR TIPO DE ENVASE, 2018-2027 (MILLONES DE USD)

TABLA 40 MERCADO DE GOMITAS Y JALEAS DE ASIA Y EL PACÍFICO, POR CANAL DE DISTRIBUCIÓN, 2018-2027 (MILLONES DE USD)

TABLA 41 MERCADO MINORISTA DE GOMAS Y JALEAS EN TIENDAS DE ASIA Y EL PACÍFICO, POR CANAL DE DISTRIBUCIÓN, 2018-2027 (MILLONES DE USD)

TABLA 42 MERCADO MINORISTA DE GOMAS Y JALEAS EN ASIA Y EL PACÍFICO, POR CANAL DE DISTRIBUCIÓN, 2018-2027 (MILLONES DE USD)

CUADRO 43 MERCADO DE GOMITAS Y JALEAS DE ASIA Y EL PACÍFICO, POR PAÍS, 2018-2027 (MILLONES DE USD)

TABLA 44 MERCADO CHINA DE GOMITAS Y JALEAS, POR TIPO DE PRODUCTO, 2018-2027 (MILLONES DE USD)

TABLA 45 MERCADO DE GOMITAS DE CHINA, POR TIPO, 2018-2027 (MILLONES DE USD)

TABLA 46 GOMITAS SUPLEMENTARIAS DE CHINA EN EL MERCADO DE GOMAS, POR TIPO, 2018-2027 (MILLONES DE USD)

TABLA 47 GOMITAS DE VITAMINA DE CHINA EN EL MERCADO DE GOMAS, POR TIPO, 2018-2027 (MILLONES DE USD)

TABLA 48 MERCADO DE VITAMINA ÚNICA EN GOMAS DE CHINA, POR TIPO, 2018-2027 (MILLONES DE USD)

TABLA 49 MERCADO CHINA DE VITAMINA B EN GOMAS, POR TIPO, 2018-2027 (MILLONES DE USD)

TABLA 50 GOMITAS PROBIÓTICAS DE CHINA EN EL MERCADO DE GOMAS, POR TIPO, 2018-2027 (MILLONES DE USD)

TABLA 51 GOMAS SUPLEMENTARIAS DE CHINA EN EL MERCADO DE GOMAS, POR APLICACIÓN, 2018-2027 (MILLONES DE USD)

CUADRO 52 MERCADO DE JALEAS DE CHINA, POR INGREDIENTE DE JALEA, 2018-2027 (MILLONES DE USD)

CUADRO 53 MERCADO DE GOMITAS Y JALEAS DE CHINA, POR CONSUMIDOR OBJETIVO, 2018-2027 (MILLONES DE USD)

CUADRO 54 MERCADO CHINA DE GOMITAS Y JALEAS PARA ADULTOS, POR CONSUMIDOR OBJETIVO, 2018-2027 (MILLONES DE USD)

CUADRO 55 MERCADO DE GOMITAS Y JALEAS DE CHINA, POR CATEGORÍA, 2018-2027 (MILLONES DE USD)

CUADRO 56 MERCADO DE GOMITAS Y JALEAS DE CHINA, POR SABORES, 2018-2027 (MILLONES DE USD)

CUADRO 57 MERCADO CHINA DE GOMITAS Y JALEAS, POR INGREDIENTE, 2018-2027 (MILLONES DE USD)

CUADRO 58 MERCADO DE GOMITAS Y JALEAS DE CHINA, POR TIPO DE ENVASE, 2018-2027 (MILLONES DE USD)

CUADRO 59 MERCADO CHINA DE BOTELLAS Y TARROS DE GOMITAS Y JALEAS, POR TIPO DE ENVASE, 2018-2027 (MILLONES DE USD)

TABLA 60 MERCADO DE GOMAS Y JALEAS DE CHINA, POR TIPO DE ENVASE, 2018-2027 (MILLONES DE USD)

CUADRO 61 MERCADO DE GOMITAS Y JALEAS DE CHINA, POR CANAL DE DISTRIBUCIÓN, 2018-2027 (MILLONES DE USD)

TABLA 62 MERCADO MINORISTA DE GOMAS Y JALEAS EN TIENDAS DE CHINA, POR CANAL DE DISTRIBUCIÓN, 2018-2027 (MILLONES DE USD)

TABLA 63 MERCADO MINORISTA DE GOMAS Y JALEAS EN CHINA, POR CANAL DE DISTRIBUCIÓN, 2018-2027 (MILLONES DE USD)

TABLA 64 MERCADO JAPÓN DE GOMITAS Y JALEAS, POR TIPO DE PRODUCTO, 2018-2027 (MILLONES DE USD)

TABLA 65 MERCADO DE GOMITAS DE JAPÓN, POR TIPO, 2018-2027 (MILLONES DE USD)

TABLA 66 GOMITAS SUPLEMENTARIAS DE JAPÓN EN EL MERCADO DE GOMAS, POR TIPO, 2018-2027 (MILLONES DE USD)

TABLA 67 GOMITAS DE VITAMINA EN EL MERCADO DE GOMAS DE JAPÓN, POR TIPO, 2018-2027 (MILLONES DE USD)

TABLA 68 MERCADO DE VITAMINA ÚNICA EN GOMAS DE JAPÓN, POR TIPO, 2018-2027 (MILLONES DE USD)

TABLA 69 MERCADO JAPÓN DE VITAMINA B EN GOMAS, POR TIPO, 2018-2027 (MILLONES DE USD)

TABLA 70 GOMAS PROBIÓTICAS EN EL MERCADO DE GOMAS DE JAPÓN, POR TIPO, 2018-2027 (MILLONES DE USD)

TABLA 71 GOMAS SUPLEMENTARIAS DE JAPÓN EN EL MERCADO DE GOMAS, POR APLICACIÓN, 2018-2027 (MILLONES DE USD)

CUADRO 72 MERCADO DE JALEAS DE JAPÓN, POR INGREDIENTE DE JALEA, 2018-2027 (MILLONES DE USD)

CUADRO 73 MERCADO DE GOMITAS Y JALEAS DE JAPÓN, POR CONSUMIDOR OBJETIVO, 2018-2027 (MILLONES DE USD)

TABLA 74 MERCADO DE GOMITAS Y JALEAS PARA ADULTOS EN JAPÓN, POR CONSUMIDOR OBJETIVO, 2018-2027 (MILLONES DE USD)

CUADRO 75 MERCADO DE GOMITAS Y JALEAS DE JAPÓN, POR CATEGORÍA, 2018-2027 (MILLONES DE USD)

TABLA 76 MERCADO JAPÓN DE GOMITAS Y JALEAS, POR SABORES, 2018-2027 (MILLONES DE USD)

TABLA 77 MERCADO JAPÓN DE GOMITAS Y JALEAS, POR INGREDIENTE, 2018-2027 (MILLONES DE USD)

CUADRO 78 MERCADO DE GOMITAS Y JALEAS DE JAPÓN, POR TIPO DE ENVASE, 2018-2027 (MILLONES DE USD)

TABLA 79 MERCADO DE BOTELLAS Y TARROS DE GOMAS Y JALEAS DE JAPÓN, POR TIPO DE ENVASE, 2018-2027 (MILLONES DE USD)

TABLA 80 MERCADO DE GOMAS Y JALEAS EN JAPÓN, POR TIPO DE ENVASE, 2018-2027 (MILLONES DE USD)

CUADRO 81 MERCADO DE GOMITAS Y JALEAS DE JAPÓN, POR CANAL DE DISTRIBUCIÓN, 2018-2027 (MILLONES DE USD)

TABLA 82 MERCADO MINORISTA DE GOMAS Y JALEAS EN TIENDAS EN JAPÓN, POR CANAL DE DISTRIBUCIÓN, 2018-2027 (MILLONES DE USD)

TABLA 83 MERCADO MINORISTA DE GOMAS Y JALEAS EN JAPÓN, POR CANAL DE DISTRIBUCIÓN, 2018-2027 (MILLONES DE USD)

TABLA 84 MERCADO DE GOMAS Y JALEAS DE LA INDIA, POR TIPO, 2018-2027 (MILLONES DE USD)

TABLA 85 MERCADO DE GOMITAS DE LA INDIA, POR TIPO, 2018-2027 (MILLONES DE USD)

TABLA 86 GOMITAS SUPLEMENTARIAS DE LA INDIA EN EL MERCADO DE GOMAS, POR TIPO, 2018-2027 (MILLONES DE USD)

TABLA 87 GOMITAS DE VITAMINA DE LA INDIA EN EL MERCADO DE GOMAS, POR TIPO, 2018-2027 (MILLONES DE USD)

TABLA 88 MERCADO DE VITAMINA ÚNICA EN GOMAS DE LA INDIA, POR TIPO, 2018-2027 (MILLONES DE USD)

TABLA 89 MERCADO DE VITAMINA B EN GOMAS DE LA INDIA, POR TIPO, 2018-2027 (MILLONES DE USD)

TABLA 90 GOMITAS PROBIÓTICAS DE LA INDIA EN EL MERCADO DE GOMAS, POR TIPO, 2018-2027 (MILLONES DE USD)

TABLA 91 GOMAS SUPLEMENTARIAS DE LA INDIA EN EL MERCADO DE GOMAS, POR APLICACIÓN, 2018-2027 (MILLONES DE USD)

TABLA 92 MERCADO DE JALEAS DE LA INDIA, POR INGREDIENTE DE JALEA, 2018-2027 (MILLONES DE USD)

CUADRO 93 MERCADO DE GOMITAS Y JALEAS DE LA INDIA, POR CONSUMIDOR OBJETIVO, 2018-2027 (MILLONES DE USD)

TABLA 94 MERCADO DE GOMAS Y JALEAS PARA ADULTOS DE LA INDIA, POR CONSUMIDOR OBJETIVO, 2018-2027 (MILLONES DE USD)

TABLA 95 MERCADO DE GOMAS Y JALEAS DE LA INDIA, POR CATEGORÍA, 2018-2027 (MILLONES DE USD)

TABLA 96 MERCADO DE GOMITAS Y JALEAS DE LA INDIA, POR SABORES, 2018-2027 (MILLONES DE USD)

TABLA 97 MERCADO DE GOMAS Y JALEAS DE LA INDIA, POR INGREDIENTE, 2018-2027 (MILLONES DE USD)

TABLA 98 MERCADO DE GOMITAS Y JALEAS DE LA INDIA, POR TIPO DE ENVASE, 2018-2027 (MILLONES DE USD)

TABLA 99 MERCADO DE BOTELLAS Y TARROS DE GOMAS Y JALEAS DE LA INDIA, POR TIPO DE ENVASE, 2018-2027 (MILLONES DE USD)

TABLA 100 ENVASES DE LA INDIA EN EL MERCADO DE GOMITAS Y JALEAS, POR TIPO DE ENVASE, 2018-2027 (MILLONES DE USD)

CUADRO 101 MERCADO DE GOMITAS Y JALEAS DE LA INDIA, POR CANAL DE DISTRIBUCIÓN, 2018-2027 (MILLONES DE USD)

TABLA 102 MERCADO MINORISTA DE GOMAS Y JALEAS EN TIENDAS DE LA INDIA, POR CANAL DE DISTRIBUCIÓN, 2018-2027 (MILLONES DE USD)

TABLA 103 MERCADO MINORISTA DE GOMAS Y JALEAS EN LA INDIA, POR CANAL DE DISTRIBUCIÓN, 2018-2027 (MILLONES DE USD)

TABLA 104 MERCADO DE GOMITAS Y JALEAS DE COREA DEL SUR, POR TIPO DE PRODUCTO, 2018-2027 (MILLONES DE USD)

TABLA 105 MERCADO DE GOMITAS DE COREA DEL SUR, POR TIPO, 2018-2027 (MILLONES DE USD)

TABLA 106 GOMITAS SUPLEMENTARIAS DE COREA DEL SUR EN EL MERCADO DE GOMITAS, POR TIPO, 2018-2027 (MILLONES DE USD)

TABLA 107 GOMITAS DE VITAMINA DE COREA DEL SUR EN EL MERCADO DE GOMAS, POR TIPO, 2018-2027 (MILLONES DE USD)

TABLA 108 MERCADO DE VITAMINA ÚNICA EN GOMAS DE COREA DEL SUR, POR TIPO, 2018-2027 (MILLONES DE USD)

TABLA 109 MERCADO DE VITAMINA B EN GOMAS DE COREA DEL SUR, POR TIPO, 2018-2027 (MILLONES DE USD)

TABLA 110 GOMITAS PROBIÓTICAS DE COREA DEL SUR EN EL MERCADO DE GOMAS, POR TIPO, 2018-2027 (MILLONES DE USD)

TABLA 111 GOMITAS SUPLEMENTARIAS DE COREA DEL SUR EN EL MERCADO DE GOMITAS, POR APLICACIÓN, 2018-2027 (MILLONES DE USD)

CUADRO 112 MERCADO DE JALEAS DE COREA DEL SUR, POR INGREDIENTE DE JALEA, 2018-2027 (MILLONES DE USD)

CUADRO 113 MERCADO DE GOMITAS Y JALEAS DE COREA DEL SUR, POR CONSUMIDOR OBJETIVO, 2018-2027 (MILLONES DE USD)

TABLA 114 MERCADO DE GOMITAS Y JALEAS PARA ADULTOS DE COREA DEL SUR, POR CONSUMIDOR OBJETIVO, 2018-2027 (MILLONES DE USD)

CUADRO 115 MERCADO DE GOMITAS Y JALEAS DE COREA DEL SUR, POR CATEGORÍA, 2018-2027 (MILLONES DE USD)

CUADRO 116 MERCADO DE GOMITAS Y JALEAS DE COREA DEL SUR, POR SABORES, 2018-2027 (MILLONES DE USD)

CUADRO 117 MERCADO DE GOMITAS Y JALEAS DE COREA DEL SUR, POR INGREDIENTE, 2018-2027 (MILLONES DE USD)

CUADRO 118 MERCADO DE GOMITAS Y JALEAS DE COREA DEL SUR, POR TIPO DE ENVASE, 2018-2027 (MILLONES DE USD)

CUADRO 119 MERCADO DE BOTELLAS Y TARROS DE GOMAS Y JALEAS DE COREA DEL SUR, POR TIPO DE ENVASE, 2018-2027 (MILLONES DE USD)

TABLA 120 MERCADO DE ENVASES DE GOMAS Y JALEAS DE COREA DEL SUR, POR TIPO DE ENVASE, 2018-2027 (MILLONES DE USD)

CUADRO 121 MERCADO DE GOMITAS Y JALEAS DE COREA DEL SUR, POR CANAL DE DISTRIBUCIÓN, 2018-2027 (MILLONES DE USD)

TABLA 122 MERCADO MINORISTA DE GOMAS Y JALEAS EN TIENDAS DE COREA DEL SUR, POR CANAL DE DISTRIBUCIÓN, 2018-2027 (MILLONES DE USD)

TABLA 123 MERCADO MINORISTA DE GOMAS Y JALEAS EN COREA DEL SUR, POR CANAL DE DISTRIBUCIÓN, 2018-2027 (MILLONES DE USD)

TABLA 124 MERCADO DE GOMITAS Y JALEAS DE AUSTRALIA, POR TIPO DE PRODUCTO, 2018-2027 (MILLONES DE USD)

TABLA 125 MERCADO DE GOMITAS DE AUSTRALIA, POR TIPO, 2018-2027 (MILLONES DE USD)

TABLA 126 GOMITAS SUPLEMENTARIAS DE AUSTRALIA EN EL MERCADO DE GOMAS, POR TIPO, 2018-2027 (MILLONES DE USD)

TABLA 127 GOMITAS DE VITAMINA DE AUSTRALIA EN EL MERCADO DE GOMAS, POR TIPO, 2018-2027 (MILLONES DE USD)

TABLA 128 MERCADO DE VITAMINA ÚNICA EN GOMAS DE AUSTRALIA, POR TIPO, 2018-2027 (MILLONES DE USD)

TABLA 129 MERCADO DE VITAMINA B EN GOMAS DE AUSTRALIA, POR TIPO, 2018-2027 (MILLONES DE USD)

TABLA 130 GOMAS PROBIÓTICAS EN EL MERCADO DE GOMAS DE AUSTRALIA, POR TIPO, 2018-2027 (MILLONES DE USD)

TABLA 131 GOMITAS SUPLEMENTARIAS DE AUSTRALIA EN EL MERCADO DE GOMITAS, POR APLICACIÓN, 2018-2027 (MILLONES DE USD)

TABLA 132 MERCADO DE JALEAS DE AUSTRALIA, POR INGREDIENTE DE JALEA, 2018-2027 (MILLONES DE USD)

CUADRO 133 MERCADO DE GOMITAS Y JALEAS DE AUSTRALIA, POR CONSUMIDOR OBJETIVO, 2018-2027 (MILLONES DE USD)

TABLA 134 MERCADO DE GOMITAS Y JALEAS PARA ADULTOS DE AUSTRALIA, POR CONSUMIDOR OBJETIVO, 2018-2027 (MILLONES DE USD)

CUADRO 135 MERCADO DE GOMITAS Y JALEAS DE AUSTRALIA, POR CATEGORÍA, 2018-2027 (MILLONES DE USD)

TABLA 136 MERCADO DE GOMITAS Y JALEAS DE AUSTRALIA, POR SABORES, 2018-2027 (MILLONES DE USD)

CUADRO 137 MERCADO DE GOMITAS Y JALEAS DE AUSTRALIA, POR INGREDIENTE, 2018-2027 (MILLONES DE USD)

CUADRO 138 MERCADO DE GOMITAS Y JALEAS DE AUSTRALIA, POR TIPO DE ENVASE, 2018-2027 (MILLONES DE USD)

TABLA 139 MERCADO DE BOTELLAS Y TARROS DE GOMAS Y JALEAS DE AUSTRALIA, POR TIPO DE ENVASE, 2018-2027 (MILLONES DE USD)

TABLA 140 MERCADO DE ENVASES DE GOMAS Y JALEAS DE AUSTRALIA, POR TIPO DE ENVASE, 2018-2027 (MILLONES DE USD)

CUADRO 141 MERCADO DE GOMITAS Y JALEAS DE AUSTRALIA, POR CANAL DE DISTRIBUCIÓN, 2018-2027 (MILLONES DE USD)

TABLA 142 MERCADO MINORISTA DE GOMAS Y JALEAS EN TIENDAS DE AUSTRALIA, POR CANAL DE DISTRIBUCIÓN, 2018-2027 (MILLONES DE USD)

TABLA 143 MERCADO MINORISTA DE GOMAS Y JALEAS EN AUSTRALIA, POR CANAL DE DISTRIBUCIÓN, 2018-2027 (MILLONES DE USD)

TABLA 144 MERCADO DE GOMITAS Y JALEAS DE SINGAPUR, POR TIPO DE PRODUCTO, 2018-2027 (MILLONES DE USD)

TABLA 145 MERCADO DE GOMITAS DE SINGAPUR, POR TIPO, 2018-2027 (MILLONES DE USD)

TABLA 146 GOMAS SUPLEMENTARIAS DE SINGAPUR EN EL MERCADO DE GOMAS, POR TIPO, 2018-2027 (MILLONES DE USD)

TABLA 147 GOMITAS DE VITAMINA DE SINGAPUR EN EL MERCADO DE GOMAS, POR TIPO, 2018-2027 (MILLONES DE USD)

TABLA 148 MERCADO DE VITAMINA ÚNICA EN GOMAS DE SINGAPUR, POR TIPO, 2018-2027 (MILLONES DE USD)

TABLA 149 MERCADO DE VITAMINA B EN GOMAS DE SINGAPUR, POR TIPO, 2018-2027 (MILLONES DE USD)

TABLA 150 GOMITAS PROBIÓTICAS DE SINGAPUR EN EL MERCADO DE GOMAS, POR TIPO, 2018-2027 (MILLONES DE USD)

TABLA 151 GOMAS SUPLEMENTARIAS DE SINGAPUR EN EL MERCADO DE GOMAS, POR APLICACIÓN, 2018-2027 (MILLONES DE USD)

CUADRO 152 MERCADO DE JALEAS DE SINGAPUR, POR INGREDIENTE DE JALEA, 2018-2027 (MILLONES DE USD)

CUADRO 153 MERCADO DE GOMITAS Y JALEAS DE SINGAPUR, POR CONSUMIDOR OBJETIVO, 2018-2027 (MILLONES DE USD)

TABLA 154 MERCADO DE GOMAS Y JALEAS PARA ADULTOS DE SINGAPUR, POR CONSUMIDOR OBJETIVO, 2018-2027 (MILLONES DE USD)

CUADRO 155 MERCADO DE GOMITAS Y JALEAS DE SINGAPUR, POR CATEGORÍA, 2018-2027 (MILLONES DE USD)

CUADRO 156 MERCADO DE GOMITAS Y JALEAS DE SINGAPUR, POR SABORES, 2018-2027 (MILLONES DE USD)

CUADRO 157 MERCADO DE GOMITAS Y JALEAS DE SINGAPUR, POR INGREDIENTE, 2018-2027 (MILLONES DE USD)

CUADRO 158 MERCADO DE GOMITAS Y JALEAS DE SINGAPUR, POR TIPO DE ENVASE, 2018-2027 (MILLONES DE USD)

CUADRO 159 MERCADO DE BOTELLAS Y TARROS DE GOMAS Y JALEAS DE SINGAPUR, POR TIPO DE ENVASE, 2018-2027 (MILLONES DE USD)

TABLA 160 ENVASES DE SINGAPUR EN EL MERCADO DE GOMITAS Y JALEAS, POR TIPO DE ENVASE, 2018-2027 (MILLONES DE USD)

CUADRO 161 MERCADO DE GOMITAS Y JALEAS DE SINGAPUR, POR CANAL DE DISTRIBUCIÓN, 2018-2027 (MILLONES DE USD)

TABLA 162 MERCADO MINORISTA DE GOMAS Y JALEAS EN TIENDAS DE SINGAPUR, POR CANAL DE DISTRIBUCIÓN, 2018-2027 (MILLONES DE USD)

TABLA 163 MERCADO MINORISTA DE GOMAS Y JALEAS EN SINGAPUR, POR CANAL DE DISTRIBUCIÓN, 2018-2027 (MILLONES DE USD)

TABLA 164 MERCADO DE GOMITAS Y JALEAS DE MALASIA, POR TIPO DE PRODUCTO, 2018-2027 (MILLONES DE USD)

TABLA 165 MERCADO DE GOMITAS DE MALASIA, POR TIPO, 2018-2027 (MILLONES DE USD)

TABLA 166 GOMAS SUPLEMENTARIAS DE MALASIA EN EL MERCADO DE GOMAS, POR TIPO, 2018-2027 (MILLONES DE USD)

TABLA 167 GOMITAS DE VITAMINA DE MALASIA EN EL MERCADO DE GOMAS, POR TIPO, 2018-2027 (MILLONES DE USD)

TABLA 168 MERCADO DE VITAMINA ÚNICA EN GOMAS DE MALASIA, POR TIPO, 2018-2027 (MILLONES DE USD)

TABLA 169 MERCADO DE VITAMINA B EN GOMAS DE MALASIA, POR TIPO, 2018-2027 (MILLONES DE USD)

TABLA 170 GOMITAS PROBIÓTICAS DE MALASIA EN EL MERCADO DE GOMAS, POR TIPO, 2018-2027 (MILLONES DE USD)

TABLA 171 GOMAS SUPLEMENTARIAS DE MALASIA EN EL MERCADO DE GOMAS, POR APLICACIÓN, 2018-2027 (MILLONES DE USD)

CUADRO 172 MERCADO DE JALEAS DE MALASIA, POR INGREDIENTE DE JALEA, 2018-2027 (MILLONES DE USD)

CUADRO 173 MERCADO DE GOMITAS Y JALEAS DE MALASIA, POR CONSUMIDOR OBJETIVO, 2018-2027 (MILLONES DE USD)

CUADRO 174 MERCADO DE GOMAS Y JALEAS PARA ADULTOS DE MALASIA, POR CONSUMIDOR OBJETIVO, 2018-2027 (MILLONES DE USD)

CUADRO 175 MERCADO DE GOMITAS Y JALEAS DE MALASIA, POR CATEGORÍA, 2018-2027 (MILLONES DE USD)

CUADRO 176 MERCADO DE GOMITAS Y JALEAS DE MALASIA, POR SABORES, 2018-2027 (MILLONES DE USD)

CUADRO 177 MERCADO DE GOMITAS Y JALEAS DE MALASIA, POR INGREDIENTE, 2018-2027 (MILLONES DE USD)

CUADRO 178 MERCADO DE GOMITAS Y JALEAS DE MALASIA, POR TIPO DE ENVASE, 2018-2027 (MILLONES DE USD)

CUADRO 179 MERCADO DE BOTELLAS Y TARROS DE GOMAS Y JALEAS DE MALASIA, POR TIPO DE ENVASE, 2018-2027 (MILLONES DE USD)

TABLA 180 MERCADO DE ENVASES DE GOMAS Y JALEAS DE MALASIA, POR TIPO DE ENVASE, 2018-2027 (MILLONES DE USD)

CUADRO 181 MERCADO DE GOMITAS Y JALEAS DE MALASIA, POR CANAL DE DISTRIBUCIÓN, 2018-2027 (MILLONES DE USD)

CUADRO 182 MERCADO MINORISTA DE GOMAS Y JALEAS EN TIENDAS DE MALASIA, POR CANAL DE DISTRIBUCIÓN, 2018-2027 (MILLONES DE USD)

CUADRO 183 MERCADO MINORISTA DE GOMAS Y JALEAS EN MALASIA, POR CANAL DE DISTRIBUCIÓN, 2018-2027 (MILLONES DE USD)

CUADRO 184 MERCADO DE GOMITAS Y JALEAS DE INDONESIA, POR TIPO DE PRODUCTO, 2018-2027 (MILLONES DE USD)

CUADRO 185 MERCADO DE GOMITAS DE INDONESIA, POR TIPO, 2018-2027 (MILLONES DE USD)

TABLA 186 GOMAS SUPLEMENTARIAS DE INDONESIA EN EL MERCADO DE GOMAS, POR TIPO, 2018-2027 (MILLONES DE USD)

TABLA 187 GOMITAS DE VITAMINA DE INDONESIA EN EL MERCADO DE GOMAS, POR TIPO, 2018-2027 (MILLONES DE USD)

TABLA 188 MERCADO DE VITAMINA ÚNICA EN GOMAS DE INDONESIA, POR TIPO, 2018-2027 (MILLONES DE USD)

TABLA 189 MERCADO DE VITAMINA B EN GOMAS DE INDONESIA, POR TIPO, 2018-2027 (MILLONES DE USD)

TABLA 190 GOMITAS PROBIÓTICAS DE INDONESIA EN EL MERCADO DE GOMAS, POR TIPO, 2018-2027 (MILLONES DE USD)

TABLA 191 GOMAS SUPLEMENTARIAS DE INDONESIA EN EL MERCADO DE GOMAS, POR APLICACIÓN, 2018-2027 (MILLONES DE USD)

CUADRO 192 MERCADO DE JALEAS DE INDONESIA, POR INGREDIENTE DE JALEA, 2018-2027 (MILLONES DE USD)

CUADRO 193 MERCADO DE GOMITAS Y JALEAS DE INDONESIA, POR CONSUMIDOR OBJETIVO, 2018-2027 (MILLONES DE USD)

CUADRO 194 MERCADO DE GOMAS Y JALEAS PARA ADULTOS DE INDONESIA, POR CONSUMIDOR OBJETIVO, 2018-2027 (MILLONES DE USD)

CUADRO 195 MERCADO DE GOMITAS Y JALEAS DE INDONESIA, POR CATEGORÍA, 2018-2027 (MILLONES DE USD)

CUADRO 196 MERCADO DE GOMITAS Y JALEAS DE INDONESIA, POR SABORES, 2018-2027 (MILLONES DE USD)

CUADRO 197 MERCADO DE GOMITAS Y JALEAS DE INDONESIA, POR INGREDIENTE, 2018-2027 (MILLONES DE USD)

CUADRO 198 MERCADO DE GOMITAS Y JALEAS DE INDONESIA, POR TIPO DE ENVASE, 2018-2027 (MILLONES DE USD)

CUADRO 199 MERCADO DE BOTELLAS Y TARROS DE GOMAS Y JALEAS DE INDONESIA, POR TIPO DE ENVASE, 2018-2027 (MILLONES DE USD)

TABLA 200 ENVASES DE INDONESIA EN EL MERCADO DE GOMITAS Y JALEAS, POR TIPO DE ENVASE, 2018-2027 (MILLONES DE USD)

CUADRO 201 MERCADO DE GOMITAS Y JALEAS DE INDONESIA, POR CANAL DE DISTRIBUCIÓN, 2018-2027 (MILLONES DE USD)

TABLA 202 MERCADO MINORISTA DE GOMAS Y JALEAS EN TIENDAS DE INDONESIA, POR CANAL DE DISTRIBUCIÓN, 2018-2027 (MILLONES DE USD)

TABLA 203 MERCADO MINORISTA DE GOMAS Y JALEAS EN INDONESIA, POR CANAL DE DISTRIBUCIÓN, 2018-2027 (MILLONES DE USD)

TABLA 204 MERCADO DE GOMITAS Y JALEAS DE TAILANDIA, POR TIPO DE PRODUCTO, 2018-2027 (MILLONES DE USD)

TABLA 205 MERCADO DE GOMITAS DE TAILANDIA, POR TIPO, 2018-2027 (MILLONES DE USD)

TABLA 206 GOMAS SUPLEMENTARIAS DE TAILANDIA EN EL MERCADO DE GOMAS, POR TIPO, 2018-2027 (MILLONES DE USD)

TABLA 207 GOMITAS DE VITAMINA DE TAILANDIA EN EL MERCADO DE GOMAS, POR TIPO, 2018-2027 (MILLONES DE USD)

TABLA 208 MERCADO DE VITAMINA ÚNICA EN GOMAS DE TAILANDIA, POR TIPO, 2018-2027 (MILLONES DE USD)

TABLA 209 MERCADO DE VITAMINA B EN GOMAS DE TAILANDIA, POR TIPO, 2018-2027 (MILLONES DE USD)

TABLA 210 GOMAS PROBIÓTICAS EN EL MERCADO DE GOMAS DE TAILANDIA, POR TIPO, 2018-2027 (MILLONES DE USD)

TABLA 211 GOMAS SUPLEMENTARIAS DE TAILANDIA EN EL MERCADO DE GOMAS, POR APLICACIÓN, 2018-2027 (MILLONES DE USD)

CUADRO 212 MERCADO DE JALEAS DE TAILANDIA, POR INGREDIENTE DE JALEA, 2018-2027 (MILLONES DE USD)

CUADRO 213 MERCADO DE GOMITAS Y JALEAS DE TAILANDIA, POR CONSUMIDOR OBJETIVO, 2018-2027 (MILLONES DE USD)

TABLA 214 MERCADO DE GOMAS Y JALEAS PARA ADULTOS DE TAILANDIA, POR CONSUMIDOR OBJETIVO, 2018-2027 (MILLONES DE USD)

TABLA 215 MERCADO DE GOMITAS Y JALEAS DE TAILANDIA, POR CATEGORÍA, 2018-2027 (MILLONES DE USD)

TABLA 216 MERCADO DE GOMITAS Y JALEAS DE TAILANDIA, POR SABORES, 2018-2027 (MILLONES DE USD)

TABLA 217 MERCADO DE GOMITAS Y JALEAS DE TAILANDIA, POR INGREDIENTE, 2018-2027 (MILLONES DE USD)

TABLA 218 MERCADO DE GOMITAS Y JALEAS DE TAILANDIA, POR TIPO DE ENVASE, 2018-2027 (MILLONES DE USD)

TABLA 219 MERCADO DE BOTELLAS Y TARROS DE GOMAS Y JALEAS DE TAILANDIA, POR TIPO DE ENVASE, 2018-2027 (MILLONES DE USD)

TABLA 220 ENVASES DE TAILANDIA EN EL MERCADO DE GOMAS Y JALEAS, POR TIPO DE ENVASE, 2018-2027 (MILLONES DE USD)

CUADRO 221 MERCADO DE GOMITAS Y JALEAS DE TAILANDIA, POR CANAL DE DISTRIBUCIÓN, 2018-2027 (MILLONES DE USD)

TABLA 222 MERCADO MINORISTA DE GOMAS Y JALEAS EN TIENDAS DE TAILANDIA, POR CANAL DE DISTRIBUCIÓN, 2018-2027 (MILLONES DE USD)

TABLA 223 MERCADO MINORISTA DE GOMAS Y JALEAS EN TAILANDIA, POR CANAL DE DISTRIBUCIÓN, 2018-2027 (MILLONES DE USD)

CUADRO 224 MERCADO DE GOMITAS Y JALEAS DE FILIPINAS, POR TIPO DE PRODUCTO, 2018-2027 (MILLONES DE USD)

CUADRO 225 MERCADO DE GOMITAS DE FILIPINAS, POR TIPO, 2018-2027 (MILLONES DE USD)

TABLA 226 FILIPINAS GOMAS SUPLEMENTARIAS EN EL MERCADO DE GOMAS, POR TIPO, 2018-2027 (MILLONES DE USD)

TABLA 227 GOMAS DE VITAMINA EN EL MERCADO DE GOMAS DE FILIPINAS, POR TIPO, 2018-2027 (MILLONES DE USD)

TABLA 228 MERCADO DE VITAMINA ÚNICA EN GOMAS DE FILIPINAS, POR TIPO, 2018-2027 (MILLONES DE USD)

TABLA 229 MERCADO DE VITAMINA B EN GOMAS DE FILIPINAS, POR TIPO, 2018-2027 (MILLONES DE USD)

TABLA 230 GOMAS PROBIÓTICAS EN EL MERCADO DE GOMAS DE FILIPINAS, POR TIPO, 2018-2027 (MILLONES DE USD)

TABLA 231 GOMAS SUPLEMENTARIAS DE FILIPINAS EN EL MERCADO DE GOMAS, POR APLICACIÓN, 2018-2027 (MILLONES DE USD)

CUADRO 232 MERCADO DE JALEAS DE FILIPINAS, POR INGREDIENTE DE JALEA, 2018-2027 (MILLONES DE USD)

CUADRO 233 MERCADO DE GOMITAS Y JALEAS DE FILIPINAS, POR CONSUMIDOR OBJETIVO, 2018-2027 (MILLONES DE USD)

CUADRO 234 MERCADO DE GOMAS Y JALEAS PARA ADULTOS DE FILIPINAS, POR CONSUMIDOR OBJETIVO, 2018-2027 (MILLONES DE USD)

CUADRO 235 MERCADO DE GOMITAS Y JALEAS DE FILIPINAS, POR CATEGORÍA, 2018-2027 (MILLONES DE USD)

CUADRO 236 MERCADO DE GOMITAS Y JALEAS DE FILIPINAS, POR SABORES, 2018-2027 (MILLONES DE USD)

CUADRO 237 MERCADO DE GOMITAS Y JALEAS DE FILIPINAS, POR INGREDIENTE, 2018-2027 (MILLONES DE USD)

CUADRO 238 MERCADO DE GOMITAS Y JALEAS DE FILIPINAS, POR TIPO DE ENVASE, 2018-2027 (MILLONES DE USD)

CUADRO 239 MERCADO DE BOTELLAS Y TARROS DE GOMAS Y JALEAS DE FILIPINAS, POR TIPO DE ENVASE, 2018-2027 (MILLONES DE USD)

TABLA 240 ENVASES DE FILIPINAS EN EL MERCADO DE GOMITAS Y JALEAS, POR TIPO DE ENVASE, 2018-2027 (MILLONES DE USD)

CUADRO 241 MERCADO DE GOMITAS Y JALEAS DE FILIPINAS, POR CANAL DE DISTRIBUCIÓN, 2018-2027 (MILLONES DE USD)

CUADRO 242 MERCADO MINORISTA DE GOMAS Y JALEAS EN TIENDAS DE FILIPINAS, POR CANAL DE DISTRIBUCIÓN, 2018-2027 (MILLONES DE USD)

CUADRO 243 MERCADO MINORISTA DE GOMAS Y JALEAS EN FILIPINAS, POR CANAL DE DISTRIBUCIÓN, 2018-2027 (MILLONES DE USD)

CUADRO 244 MERCADO DE GOMITAS Y JALEAS DE VIETNAM, POR TIPO DE PRODUCTO, 2018-2027 (MILLONES DE USD)

CUADRO 245 MERCADO DE GOMITAS DE VIETNAM, POR TIPO, 2018-2027 (MILLONES DE USD)

TABLA 246 GOMITAS SUPLEMENTARIAS DE VIETNAM EN EL MERCADO DE GOMAS, POR TIPO, 2018-2027 (MILLONES DE USD)

TABLA 247 GOMITAS DE VITAMINA DE VIETNAM EN EL MERCADO DE GOMAS, POR TIPO, 2018-2027 (MILLONES DE USD)

CUADRO 248 MERCADO DE VITAMINA ÚNICA EN GOMAS DE VIETNAM, POR TIPO, 2018-2027 (MILLONES DE USD)

TABLA 249 MERCADO DE VITAMINA B EN GOMAS DE VIETNAM, POR TIPO, 2018-2027 (MILLONES DE USD)

TABLA 250 GOMAS PROBIÓTICAS DE VIETNAM EN EL MERCADO DE GOMAS, POR TIPO, 2018-2027 (MILLONES DE USD)

TABLA 251 GOMITAS SUPLEMENTARIAS DE VIETNAM EN EL MERCADO DE GOMAS, POR APLICACIÓN, 2018-2027 (MILLONES DE USD)

CUADRO 252 MERCADO DE JALEAS DE VIETNAM, POR INGREDIENTE DE JALEA, 2018-2027 (MILLONES DE USD)

CUADRO 253 MERCADO DE GOMITAS Y JALEAS DE VIETNAM, POR CONSUMIDOR OBJETIVO, 2018-2027 (MILLONES DE USD)

CUADRO 254 MERCADO DE GOMAS Y JALEAS PARA ADULTOS DE VIETNAM, POR CONSUMIDOR OBJETIVO, 2018-2027 (MILLONES DE USD)

CUADRO 255 ​​MERCADO DE GOMITAS Y JALEAS DE VIETNAM, POR CATEGORÍA, 2018-2027 (MILLONES DE USD)

CUADRO 256 MERCADO DE GOMITAS Y JALEAS DE VIETNAM, POR SABORES, 2018-2027 (MILLONES DE USD)

CUADRO 257 MERCADO DE GOMITAS Y JALEAS DE VIETNAM, POR INGREDIENTE, 2018-2027 (MILLONES DE USD)

CUADRO 258 MERCADO DE GOMITAS Y JALEAS DE VIETNAM, POR TIPO DE ENVASE, 2018-2027 (MILLONES DE USD)

CUADRO 259 MERCADO DE BOTELLAS Y TARROS DE GOMAS Y JALEAS DE VIETNAM, POR TIPO DE ENVASE, 2018-2027 (MILLONES DE USD)

TABLA 260 MERCADO DE ENVASES DE GOMAS Y JALEAS DE VIETNAM, POR TIPO DE ENVASE, 2018-2027 (MILLONES DE USD)

CUADRO 261 MERCADO DE GOMITAS Y JALEAS DE VIETNAM, POR CANAL DE DISTRIBUCIÓN, 2018-2027 (MILLONES DE USD)

CUADRO 262 MERCADO MINORISTA DE GOMAS Y JALEAS EN TIENDAS DE VIETNAM, POR CANAL DE DISTRIBUCIÓN, 2018-2027 (MILLONES DE USD)

CUADRO 263 MERCADO MINORISTA DE GOMAS Y JALEAS EN VIETNAM, POR CANAL DE DISTRIBUCIÓN, 2018-2027 (MILLONES DE USD)

TABLA 264 MERCADO DE GOMITAS Y JALEAS DE NUEVA ZELANDA, POR TIPO DE PRODUCTO, 2018-2027 (MILLONES DE USD)

TABLA 265 MERCADO DE GOMITAS DE NUEVA ZELANDA, POR TIPO, 2018-2027 (MILLONES DE USD)

TABLA 266 GOMITAS SUPLEMENTARIAS DE NUEVA ZELANDA EN EL MERCADO DE GOMITAS, POR TIPO, 2018-2027 (MILLONES DE USD)

TABLA 267 GOMITAS DE VITAMINA DE NUEVA ZELANDA EN EL MERCADO DE GOMAS, POR TIPO, 2018-2027 (MILLONES DE USD)

TABLA 268 MERCADO DE VITAMINA ÚNICA EN GOMAS DE NUEVA ZELANDA, POR TIPO, 2018-2027 (MILLONES DE USD)

TABLA 269 MERCADO DE VITAMINA B EN GOMAS DE NUEVA ZELANDA, POR TIPO, 2018-2027 (MILLONES DE USD)

TABLA 270 GOMITAS PROBIÓTICAS DE NUEVA ZELANDA EN EL MERCADO DE GOMAS, POR TIPO, 2018-2027 (MILLONES DE USD)

TABLA 271 GOMITAS SUPLEMENTARIAS DE NUEVA ZELANDA EN EL MERCADO DE GOMITAS, POR APLICACIÓN, 2018-2027 (MILLONES DE USD)

CUADRO 272 MERCADO DE JALEAS DE NUEVA ZELANDA, POR INGREDIENTE DE JALEA, 2018-2027 (MILLONES DE USD)

CUADRO 273 MERCADO DE GOMITAS Y JALEAS DE NUEVA ZELANDA, POR CONSUMIDOR OBJETIVO, 2018-2027 (MILLONES DE USD)

CUADRO 274 MERCADO DE GOMITAS Y JALEAS PARA ADULTOS DE NUEVA ZELANDA, POR CONSUMIDOR OBJETIVO, 2018-2027 (MILLONES DE USD)

CUADRO 275 MERCADO DE GOMITAS Y JALEAS DE NUEVA ZELANDA, POR CATEGORÍA, 2018-2027 (MILLONES DE USD)

CUADRO 276 MERCADO DE GOMITAS Y JALEAS DE NUEVA ZELANDA, POR SABORES, 2018-2027 (MILLONES DE USD)

CUADRO 277 MERCADO DE GOMITAS Y JALEAS DE NUEVA ZELANDA, POR INGREDIENTE, 2018-2027 (MILLONES DE USD)

CUADRO 278 MERCADO DE GOMITAS Y JALEAS DE NUEVA ZELANDA, POR TIPO DE ENVASE, 2018-2027 (MILLONES DE USD)

CUADRO 279 MERCADO DE BOTELLAS Y TARROS DE GOMITAS Y JALEAS DE NUEVA ZELANDA, POR TIPO DE ENVASE, 2018-2027 (MILLONES DE USD)

TABLA 280 ENVASES DE NUEVA ZELANDA EN EL MERCADO DE GOMITAS Y JALEAS, POR TIPO DE ENVASE, 2018-2027 (MILLONES DE USD)

CUADRO 281 MERCADO DE GOMITAS Y JALEAS DE NUEVA ZELANDA, POR CANAL DE DISTRIBUCIÓN, 2018-2027 (MILLONES DE USD)

CUADRO 282 MERCADO MINORISTA DE GOMAS Y JALEAS EN TIENDAS DE NUEVA ZELANDA, POR CANAL DE DISTRIBUCIÓN, 2018-2027 (MILLONES DE USD)

CUADRO 283 MERCADO MINORISTA DE GOMAS Y JALEAS EN NUEVA ZELANDA, POR CANAL DE DISTRIBUCIÓN, 2018-2027 (MILLONES DE USD)

TABLA 284 RESTO DEL MERCADO DE GOMITAS Y JALEAS DE ASIA Y EL PACÍFICO, POR TIPO DE PRODUCTO, 2018-2027 (MILLONES DE USD)

Por favor complete el siguiente formulario para Infografías

Al hacer clic en el botón "Enviar", usted acepta la investigación de mercado de Data Bridge. política de privacidad y Términos y condiciones

Metodología de investigación:

La recopilación de datos y el análisis del año base se realizan mediante módulos de recopilación de datos con muestras de gran tamaño. La etapa incluye la obtención de información de mercado o datos relacionados a través de diversas fuentes y estrategias. Incluye examinar y planificar de antemano todos los datos adquiridos del pasado. Asimismo, abarca el examen de las inconsistencias de la información observadas en diferentes fuentes de información. Los datos de mercado se analizan y estiman utilizando modelos estadísticos y coherentes de mercado. Además, el análisis de la cuota de mercado y el análisis de tendencias clave son los principales factores de éxito en el informe de mercado. Para saber más, solicite una llamada de analista o envíe su consulta.

La metodología de investigación clave utilizada por el equipo de investigación de DBMR es la triangulación de datos, que implica extracción de datos, análisis del impacto de las variables de datos en el mercado y validación primaria (experto de la industria). Los modelos de datos incluyen cuadrícula de posicionamiento de proveedores, análisis de la línea de tiempo del mercado, descripción general y guía del mercado, cuadrícula de posicionamiento de la empresa, análisis de patentes, análisis de precios, análisis de participación de mercado de la empresa, estándares de medición, análisis global versus regional y de participación de proveedores. Para saber más sobre la metodología de investigación, envíe una consulta para hablar con nuestros expertos de la industria.

Por favor complete el siguiente formulario para Metodología de Investigación

Al hacer clic en el botón "Enviar", usted acepta la investigación de mercado de Data Bridge. política de privacidad y Términos y condiciones

Personalización disponible:

Data Bridge Market Research es líder en investigación formativa avanzada. Estamos orgullosos de brindar servicios a nuestros clientes nuevos y existentes con datos y análisis que coinciden y se adaptan a sus objetivos. El informe se puede personalizar para incluir análisis de tendencias de precios de marcas objetivo que comprendan el mercado de países adicionales (solicite la lista de países), datos de resultados de ensayos clínicos, revisión de literatura, mercado renovado y análisis de la base de productos. El análisis de mercado de los competidores objetivo se puede analizar desde análisis basados ​​en tecnología hasta estrategias de cartera de mercado. Podemos agregar tantos competidores sobre los que necesite datos en el formato y estilo de datos que esté buscando. Nuestro equipo de analistas también puede proporcionarle datos en tablas dinámicas de archivos de Excel sin procesar (libro de datos) o puede ayudarlo a crear presentaciones a partir de los conjuntos de datos disponibles en el informe.

Complete el siguiente formulario para personalizar disponible

Al hacer clic en el botón "Enviar", usted acepta la investigación de mercado de Data Bridge. política de privacidad y Términos y condiciones

HAGA PREGUNTAS FRECUENTES

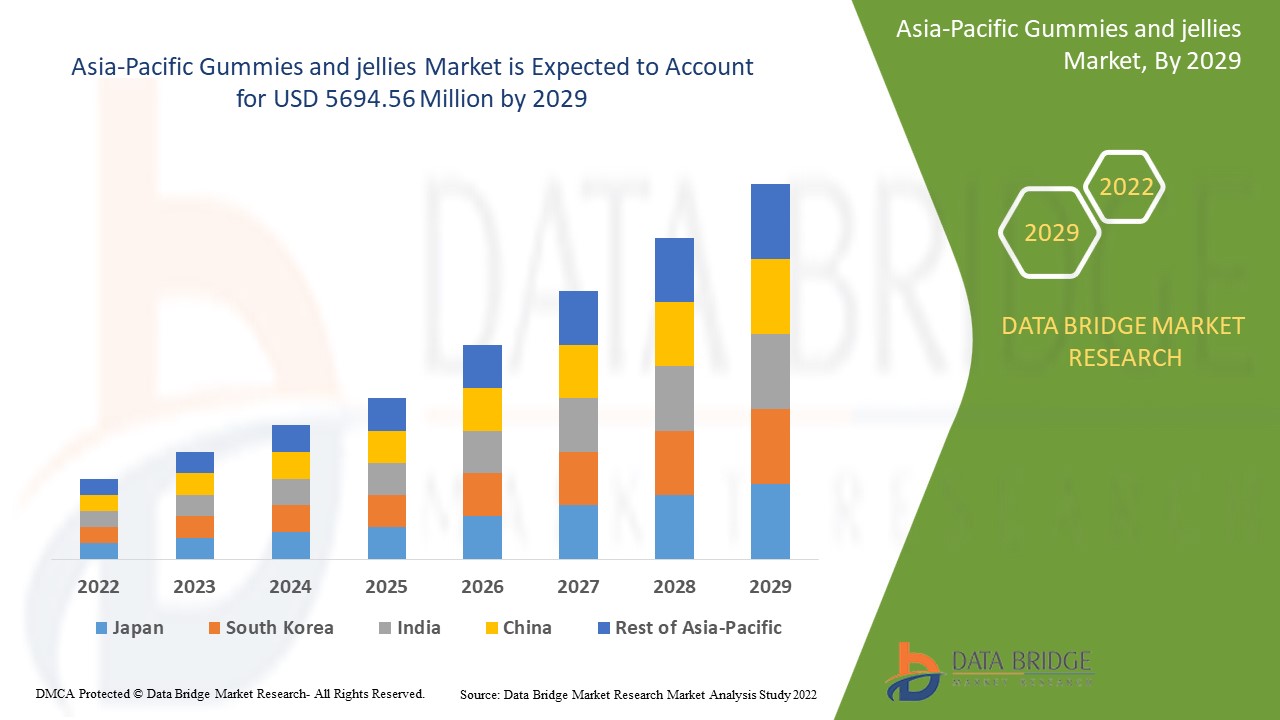
El tamaño del mercado de gomitas y jaleas de Asia y el Pacífico tendrá un valor de 5694,56 millones de dólares para 2029.
La tasa de crecimiento del mercado de gomitas y jaleas de Asia y el Pacífico en el período previsto para 2029 es del 8,3%.
Las principales empresas del mercado de gomitas y jaleas de Asia y el Pacífico son HARIBO of America, Inc, Ferrero, Perfetti Van Melle, Meiji Holdings Co., Ltd., Bayer AG, Candy People, CHURCH & DWIGHT CO., INC., GlaxoSmithKline plc. entre otros actores nacionales y globales.
El aumento de la población vegana en todo el mundo, así como el alto gasto en dulces y un mejor conocimiento sobre el bienestar sanitario son los motores de crecimiento del mercado de gomitas y jaleas de Asia y el Pacífico.
El tipo de producto, el tipo, el ingrediente de la gelatina, el consumidor objetivo, la categoría, los sabores, el ingrediente, el tipo de envase y el canal de distribución son los factores en los que se basa la investigación de mercado de gomitas y jaleas de Asia y el Pacífico.
Informe de muestra gratuito

ELEGIR TIPO DE LICENCIA

  • 4200.00
  • 3500.00
  • 2000.00
  • 5500.00
  • 7500.00

Por qué elegirnos

Cobertura de la industria

DBMR trabaja en todo el mundo en múltiples industrias, lo que nos brinda conocimiento en todos los sectores verticales y brinda a nuestros clientes información no solo de su industria sino también de cómo otras industrias afectarán su ecosistema.

Cobertura Regional

La cobertura de Data Bridge no se limita a las economías desarrolladas o emergentes. Trabajamos en todo el mundo cubriendo la mayor variedad de países donde ninguna otra firma de investigación de mercado o consultoría de negocios ha realizado investigaciones; creando oportunidades de crecimiento para nuestros clientes en áreas aún desconocidas.

Cobertura Tecnológica

En el mundo actual, la tecnología impulsa el sentimiento del mercado, por lo que nuestra visión es brindar a nuestros clientes información no solo sobre las tecnologías desarrolladas, sino también sobre los cambios tecnológicos futuros e disruptivos a lo largo del ciclo de vida del producto, brindándoles oportunidades imprevistas en el mercado que crearán disrupciones en su industria. . Esto lleva a la innovación y a que nuestros clientes salgan ganadores.

Soluciones orientadas a objetivos

El objetivo de DBMR es ayudar a nuestros clientes a alcanzar sus objetivos a través de nuestras soluciones; por lo tanto, creamos de manera formativa las soluciones más adecuadas para las necesidades de nuestros clientes, ahorrándoles tiempo y esfuerzos para impulsar sus grandes estrategias.

Soporte de analista incomparable

Nuestros analistas se enorgullecen del éxito de nuestros clientes. A diferencia de otros, creemos en trabajar junto a nuestros clientes para lograr sus objetivos con soporte de analistas las 24 horas para determinar las necesidades correctas e inspirar la innovación a través del servicio.

Banner

testimonios de clientes