
Asia Pacific Genetic Testing Market
Tamaño del mercado en miles de millones de dólares
Tasa de crecimiento anual compuesta (CAGR) :
% 
 USD
3,417.74 Billion
USD
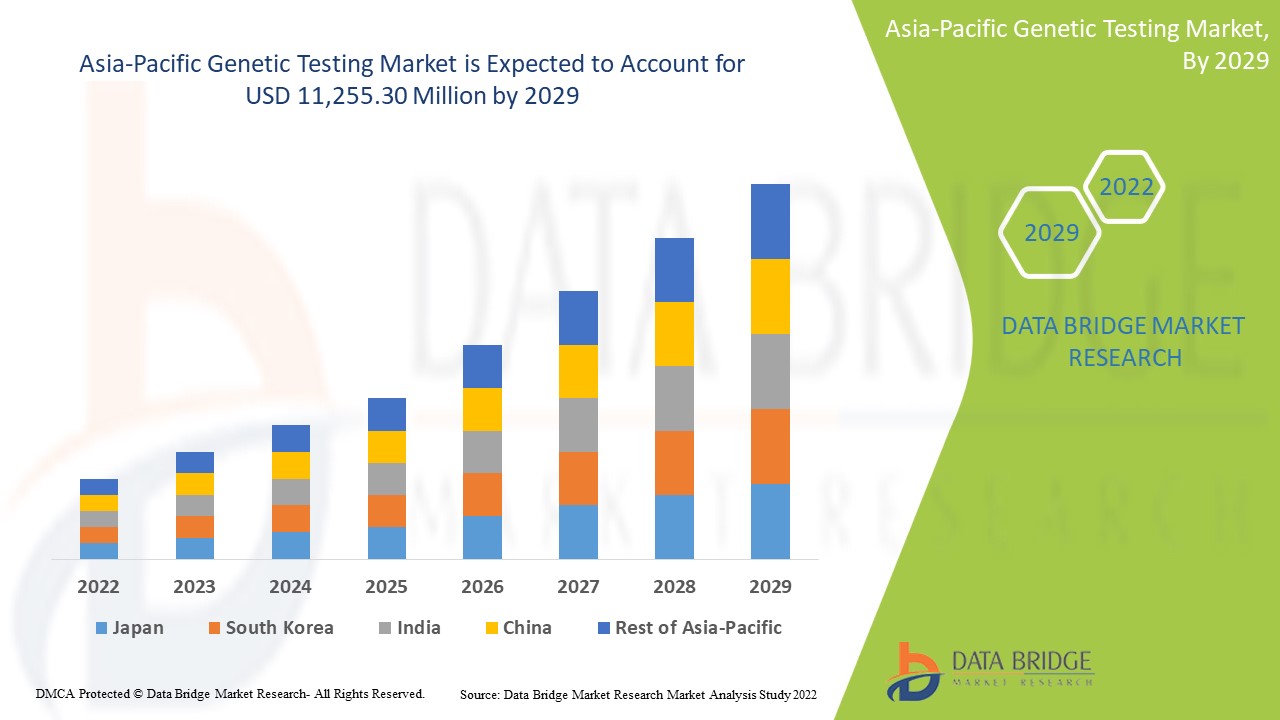
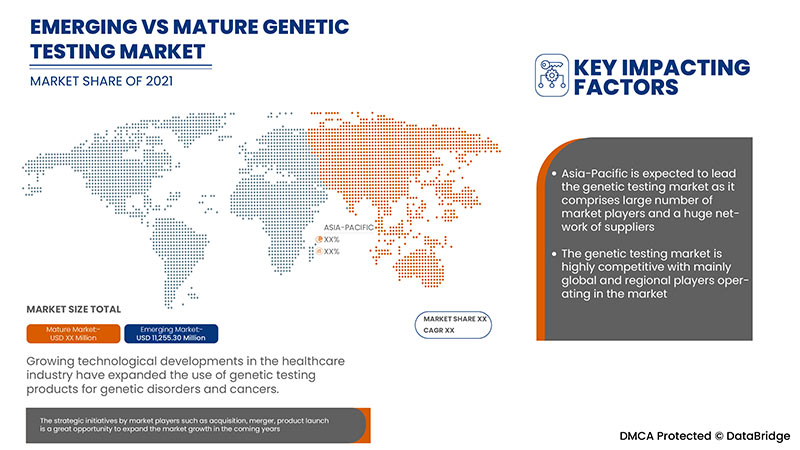
11,255.30 Billion
2021
2029
USD
3,417.74 Billion
USD
11,255.30 Billion
2021
2029
| 2022 –2029 | |
| USD 3,417.74 Billion | |
| USD 11,255.30 Billion | |
| % | |
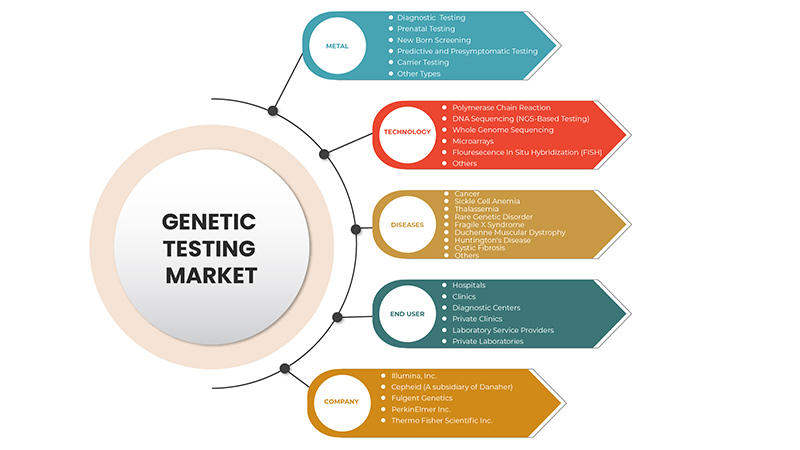
Asia-Pacific Genetic Testing Market, By Type (Carrier Testing, Diagnostic Testing, Prenatal Testing, New Born Screening, Predictive And Presymptomatic Testing, Other Types), Technology (DNA Sequencing (NGS-Based Testing), Polymerase Chain Reaction, Microarrays, Whole Genome Sequencing, Fluorescence In Situ Hybridization (FISH), Others), Diseases (Rare Genetic Disorder, CancerCystic Fibrosis, Sickle Cell Anemia, Duchenne Muscular Dystrophy, Thalassemia, Huntington’s Disease, Fragile X Syndrome, Duchenne Muscular Dystrophy, Others) End User (Hospitals, Clinics, Diagnostic Centres, Private Clinics, Laboratory Service Providers, Private Laboratories) Industry Trends and Forecast to 2029
Market Analysis and Insights
Asia-Pacific genetic testing market is driven by the factors such as high prevalence of genetic disorders, growing technological advancements in the genetic testing market which enhance its demand, as well as increasing investment in research and development, which leads to market growth. Currently, healthcare expenditure has increased across developed and emerging countries which are expected to create a competitive advantage for manufacturers to develop new and innovative genetic testing markets. However, the high cost associated with the genetic testing and stringent regulatory frameworks for genetic testing.
Asia-Pacific genetic testing market report provides details of market share, new developments, and product pipeline analysis, the impact of domestic and localized market players, analyses opportunities in terms of emerging revenue pockets, changes in market regulations, product approvals, strategic decisions, product launches, geographic expansions, and technological innovations in the market. To understand the analysis and the market scenario contact us for an analyst brief, our team will help you create a revenue impact solution to achieve your desired goal. The scalability and business expansion of the retail units in the developing countries of various region and partnership with suppliers for safe distribution of machine and drugs products are the major drivers which propelled the demand of the market in the forecast period.
Market Definition
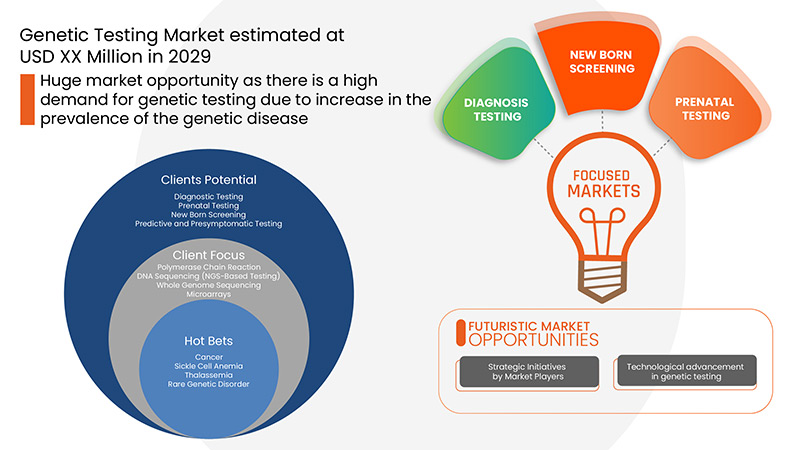
Genetic testing is a kind of medical test that identifies changes in genes, chromosomes, or proteins. The outcome of a genetic test can confirm or rule out a suspected genetic condition or aid in determining a person’s chance of developing or passing on a genetic disorder. Over 77,000 genetic tests are currently in use, and others are being developed.
The increasing innovations and technologies and rising number of players in the market, and novel product launches are also propelling the growth of the Asia-Pacific genetic testing market.
Se espera que el mercado de pruebas genéticas de Asia y el Pacífico gane crecimiento de mercado en el período de pronóstico de 2022 a 2029. Data Bridge Market Research analiza que el mercado está creciendo con una CAGR del 16,3% en el período de pronóstico de 2022 a 2029 y se espera que alcance los USD 11.255,30 millones para 2029 desde USD 3.417,74 millones en 2021.
|
Métrica del informe |
Detalles |
|
Período de pronóstico |
2022 a 2029 |
|
Año base |
2021 |
|
Años históricos |
2020 |
|
Unidades cuantitativas |
Ingresos en millones de USD |
|
Segmentos cubiertos |
Por tipo (Pruebas de portadores, Pruebas diagnósticas, Pruebas prenatales, Detección en recién nacidos, Pruebas predictivas y presintomáticas, Otros tipos), Tecnología (Secuenciación de ADN (Pruebas basadas en NGS), Reacción en cadena de la polimerasa, Microarrays, Secuenciación del genoma completo, Hibridación in situ con fluorescencia (FISH), Otros), Enfermedades (Trastorno genético raro, Cáncer, Fibrosis quística, Anemia de células falciformes, Distrofia muscular de Duchenne, Talasemia, Enfermedad de Huntington, Síndrome del cromosoma X frágil, Distrofia muscular de Duchenne, Otros) Usuario final (Hospitales, Clínicas, Centros de diagnóstico, Clínicas privadas, Proveedores de servicios de laboratorio, Laboratorios privados) |
|
Países cubiertos |
Japón, China, Corea del Sur, India, Australia, Singapur, Tailandia, Malasia, Indonesia, Vietnam, Filipinas, Resto de Asia-Pacífico |
|
Actores del mercado cubiertos |
Thermo Fisher Scientific Inc., Invitae Corporation, Bio-Rad Laboratories, Inc., PerkinElmer Inc., Illumina, Inc., QIAGEN, F. Hoffmann-La Roche Ltd., Myriad Genetics, Inc., Abbott, Eurofins Scientific, BIO-HELIX, Biocartis, Cepheid (una subsidiaria de Danaher), PacBio, Genes2Me, Eugene Labs, Mapmygenome, MedGenome, BioReference, Natera, Inc., entre otros. |
Dinámica del mercado de pruebas genéticas en Asia y el Pacífico
Conductores
- Aumento de la prevalencia de trastornos genéticos
Por ejemplo
- En diciembre de 2020, el Hospital del Centro Nacional del Cáncer de Japón lanzó un proyecto de investigación conjunta internacional en ocho países asiáticos, entre ellos Japón, Corea, Malasia, Filipinas, Singapur, Taiwán, Tailandia y Vietnam, para el desarrollo de nuevos tratamientos basados en anomalías genómicas encontradas en los tipos de cáncer más comunes que se encuentran en la población asiática. Se espera que el análisis genómico se utilice más ampliamente para proporcionar los mejores enfoques de tratamiento del cáncer.
- Aumento de la adopción de la secuenciación de próxima generación
A medida que la farmacología centrada en la genómica continúa desempeñando un papel más importante en el tratamiento de diversas enfermedades crónicas, especialmente el cáncer, la secuenciación de próxima generación (NGS) está evolucionando como una herramienta poderosa para proporcionar una visión más profunda y precisa de las bases moleculares de tumores individuales y receptores específicos.
La NGS ofrece ventajas en cuanto a precisión, sensibilidad y velocidad en comparación con los métodos tradicionales que tienen el potencial de tener un impacto significativo en el campo de la oncología. Debido a que la NGS puede evaluar múltiples genes en un solo ensayo, se elimina la necesidad de solicitar múltiples pruebas para identificar la mutación causal.
Por ejemplo,
- La NGS también se ha explorado para la elaboración de perfiles integrales de farmacogenética con relevancia para la farmacocinética y farmacodinamia de los medicamentos; los informes iniciales de 2017 sugieren que esta tecnología puede representar una herramienta confiable y eficiente para descubrir variaciones genéticas comunes y raras en estos genes.
Por lo tanto, se espera que esto actúe como motor del crecimiento del mercado de pruebas genéticas.
Oportunidades
-
Aumento de la renta disponible
El gasto de dinero que un país destina a su atención sanitaria y su tasa de crecimiento a lo largo del tiempo están condicionados por una amplia variedad de factores económicos y sociales, entre ellos, los mecanismos de financiación y la estructura de la organización del sistema de salud. En particular, existe una fuerte correlación entre el nivel de ingresos total de un país y el gasto de su población en atención sanitaria.
Por ejemplo,
-
El ingreso disponible per cápita de China es de USD 4.461,95 según se informó en 2019, lo que muestra un aumento del 5,8% en comparación con años anteriores.
Además, las iniciativas estratégicas adoptadas por los actores clave del mercado proporcionarán integridad estructural y oportunidades futuras para el mercado de pruebas genéticas en el período de pronóstico de 2022 a 2029.
Restricciones/Desafíos
- Alto costo de las pruebas genéticas
Las pruebas genéticas pueden ser costosas y es posible que no estén cubiertas por algunos planes de seguro médico. Las numerosas pruebas genéticas difieren en costos según la enfermedad específica para la que se realizan las pruebas.
Según Breastcancer.org, el costo de las pruebas genéticas para el cáncer puede variar mucho y puede oscilar entre $300 y $5,000. El costo de las pruebas genéticas puede depender del tipo de prueba y de su complejidad.
Las pruebas genéticas pueden costar entre 100 y más de 2000 dólares, según la naturaleza y la complejidad de la prueba. Si se requiere más de una prueba o si es necesario realizar la prueba a varios miembros de la familia para obtener un resultado significativo, el gasto aumenta. El costo de las pruebas de detección neonatal varía según el estado.
Impacto de la COVID-19 en el mercado de pruebas genéticas de Asia y el Pacífico
El COVID-19 ha afectado positivamente al mercado, ya que se realizaron muchas pruebas genéticas y serológicas para el COVID-19, lo que aumenta la demanda de pruebas genéticas durante este período.
Desarrollo reciente
- En diciembre de 2021, Thermo Fisher Scientific Inc. anunció que había completado la adquisición de PPD, Inc., un proveedor líder mundial de servicios de investigación clínica para la industria biofarmacéutica y biotecnológica, por 17 400 millones de dólares. Esta adquisición ayudó a generar más ingresos e impulsó el crecimiento del mercado.
Alcance del mercado de pruebas genéticas en Asia y el Pacífico
El mercado de pruebas genéticas de Asia-Pacífico está segmentado por tipo, tecnología, enfermedades y usuario final. El crecimiento entre estos segmentos le ayudará a analizar los segmentos de crecimiento reducido de las industrias y brindará a los usuarios una valiosa descripción general del mercado y conocimientos del mercado para tomar decisiones estratégicas a fin de identificar las principales aplicaciones del mercado.
Tipo
- Pruebas de diagnóstico
- Pruebas prenatales
- Evaluación del recién nacido
- Pruebas predictivas y presintomáticas
- Pruebas de portadores
- Otros tipos
Según el tipo, el mercado de pruebas genéticas de Asia y el Pacífico está segmentado en pruebas de diagnóstico, pruebas prenatales, detección de recién nacidos, pruebas predictivas y presintomáticas, pruebas de portadores y otros tipos.
Tecnología
- Reacción en cadena de la polimerasa
- Secuenciación de ADN (prueba basada en NGS)
- Secuenciación del genoma completo
- Microarrays
- Hibridación in situ con fluorescencia (FISH)
- Otros
Sobre la base de la tecnología, el mercado de pruebas genéticas de Asia y el Pacífico está segmentado en secuenciación de ADN (pruebas basadas en NGS), reacción en cadena de la polimerasa, microarrays, secuenciación del genoma completo, hibridación in situ con fluorescencia (FISH) y otros.
Enfermedades
- Cáncer
- Anemia de células falciformes
- Talasemia
- Trastorno genético raro
- Síndrome del cromosoma X frágil
- Distrofia muscular de Duchenne
- Enfermedad de Huntington
- Fibrosis quística
- Otros
Sobre la base de las enfermedades, el mercado de pruebas genéticas de Asia y el Pacífico está segmentado en trastornos genéticos raros, cáncer, fibrosis quística, anemia de células falciformes, distrofia muscular de Duchenne, talasemia, enfermedad de Huntington, síndrome del cromosoma X frágil y otros.
Usuario final
- Hospitales
- Clínicas
- Centros de diagnóstico
- Clínicas privadas
- Proveedores de servicios de laboratorio
- Laboratorios privados
Sobre la base de los usuarios finales, el mercado de pruebas genéticas de Asia y el Pacífico está segmentado en hospitales, clínicas, centros de diagnóstico, clínicas privadas, proveedores de servicios de laboratorio y laboratorios privados.
Análisis y perspectivas regionales del mercado de pruebas genéticas
Se analiza el mercado de pruebas genéticas y se proporcionan información y tendencias del tamaño del mercado por país, tipo, tecnología, enfermedades y usuario final como se menciona anteriormente.
China es el principal país dominante en el mercado debido a la creciente prevalencia de trastornos genéticos entre la población de estos países. Además, domina el mercado de pruebas genéticas en términos de participación de mercado e ingresos de mercado y seguirá aumentando su dominio durante el período de pronóstico. Esto se debe a los defectos genéticos y las aberraciones cromosómicas en la población de las regiones y al rápido desarrollo de la investigación que está impulsando el mercado.
La sección de países del informe también proporciona factores de impacto de mercado individuales y cambios en las regulaciones del mercado que afectan las tendencias actuales y futuras del mercado. Los puntos de datos, como las ventas nuevas y de reemplazo, la demografía del país, la epidemiología de las enfermedades y los aranceles de importación y exportación, son algunos de los principales indicadores utilizados para pronosticar el escenario del mercado para países individuales. Además, la presencia y disponibilidad de marcas globales y sus desafíos enfrentados debido a la alta competencia de las marcas locales y nacionales, y el impacto de los canales de venta se consideran al proporcionar un análisis de pronóstico de los datos del país.
Análisis del panorama competitivo y de la cuota de mercado de las pruebas genéticas
El panorama competitivo del mercado de pruebas genéticas proporciona detalles sobre los competidores. Los detalles incluidos son una descripción general de la empresa, las finanzas de la empresa, los ingresos generados, el potencial de mercado, la inversión en investigación y desarrollo, las nuevas iniciativas de mercado, la presencia global, los sitios e instalaciones de producción, las capacidades de producción, las fortalezas y debilidades de la empresa, el lanzamiento de productos, la amplitud y variedad de productos y el dominio de las aplicaciones. Los puntos de datos proporcionados anteriormente solo están relacionados con el enfoque de las empresas en el mercado de pruebas genéticas.
Algunos de los principales actores que operan en el mercado de pruebas genéticas son Thermo Fisher Scientific Inc., Invitae Corporation, Bio-Rad Laboratories, Inc., PerkinElmer Inc., Illumina, Inc., QIAGEN, F. Hoffmann-La Roche Ltd., Myriad Genetics, Inc., Abbott, Eurofins Scientific, BIO-HELIX, Biocartis, Cepheid (una subsidiaria de Danaher), PacBio, Genes2Me, Eugene Labs, Mapmygenome, MedGenome, BioReference, Natera, Inc., entre otros.
Metodología de la investigación
La recopilación de datos y el análisis del año base se realizan utilizando módulos de recopilación de datos con tamaños de muestra grandes. Los datos del mercado se analizan y estiman utilizando modelos estadísticos y coherentes de mercado. Además, el análisis de la participación de mercado y el análisis de tendencias clave son los principales factores de éxito en el informe de mercado. La metodología de investigación clave utilizada por el equipo de investigación de DBMR es la triangulación de datos que implica la extracción de datos, el análisis del impacto de las variables de datos en el mercado y la validación primaria (experto en la industria). Aparte de esto, los modelos de datos incluyen la cuadrícula de posicionamiento de proveedores, el análisis de la línea de tiempo del mercado, la descripción general y la guía del mercado, la cuadrícula de posicionamiento de la empresa, el análisis de la participación de mercado de la empresa, los estándares de medición, el análisis global frente a regional y el análisis de la participación de los proveedores. Solicite una llamada de un analista en caso de tener más consultas.
Personalización disponible
Data Bridge Market Research es líder en investigación formativa avanzada. Nos enorgullecemos de brindar a nuestros clientes existentes y nuevos datos y análisis que coinciden y se adaptan a sus objetivos. El informe se puede personalizar para incluir análisis de tendencias de precios de marcas objetivo, comprensión del mercado de países adicionales (solicite la lista de países), datos de resultados de ensayos clínicos, revisión de literatura, análisis de mercado renovado y base de productos. El análisis de mercado de competidores objetivo se puede analizar desde análisis basados en tecnología hasta estrategias de cartera de mercado. Podemos agregar tantos competidores sobre los que necesite datos en el formato y estilo de datos que esté buscando. Nuestro equipo de analistas también puede proporcionarle datos en archivos de Excel sin procesar, tablas dinámicas (libro de datos) o puede ayudarlo a crear presentaciones a partir de los conjuntos de datos disponibles en el informe.
SKU-
Obtenga acceso en línea al informe sobre la primera nube de inteligencia de mercado del mundo

- Panel de análisis de datos interactivo
- Panel de análisis de empresas para oportunidades con alto potencial de crecimiento
- Acceso de analista de investigación para personalización y consultas
- Análisis de la competencia con panel interactivo
- Últimas noticias, actualizaciones y análisis de tendencias
- Aproveche el poder del análisis de referencia para un seguimiento integral de la competencia
Tabla de contenido
1 INTRODUCTION
1.1 OBJECTIVES OF THE STUDY
1.2 MARKET DEFINITION
1.3 OVERVIEW OF THE ASIA PACIFIC GENETIC TESTING MARKET
1.4 LIMITATIONS
1.5 MARKETS COVERED
2 MARKET SEGMENTATION
2.1 MARKETS COVERED
2.2 GEOGRAPHICAL SCOPE
2.3 YEARS CONSIDERED FOR THE STUDY
2.4 CURRENCY AND PRICING
2.5 DBMR TRIPOD DATA VALIDATION MODEL
2.6 MULTIVARIATE MODELLING
2.7 TYPE LIFELINE CURVE
2.8 PRIMARY INTERVIEWS WITH KEY OPINION LEADERS
2.9 DBMR MARKET POSITION GRID
2.1 MARKET APPLICATION COVERAGE GRID
2.11 VENDOR SHARE ANALYSIS
2.12 SECONDARY SOURCES
2.13 ASSUMPTIONS
3 EXECUTIVE SUMMARY
4 PREMIUM INSIGHTS
4.1 PESTEL ANALYSIS
4.2 PORTER’S FIVE FORCES
4.3 STRATEGIC INITIATIVES:
4.4 CONCLUSION:
4.5 INDUSTRY INSIGHTS
4.5.1 CANCER GENETICS RISK ASSESSMENT AND COUNSELING
4.5.2 GENETIC TESTS PRICING
4.5.3 KEY INSIGHTS
5 EPIDERMIOLOGY
6 ASIA PACIFIC GENETIC TESTING MARKET: REGULATIONS
7 MARKET OVERVIEW
7.1 DRIVERS
7.1.1 GROWING PREVALENCE OF GENETIC DISORDERS
7.1.2 INCREASE IN THE ADOPTION OF NEXT GENERATION SEQUENCING
7.1.3 WIDE PRODUCT PORTFOLIO OFFERED BY A MAJOR PLAYER
7.1.4 INCREASE TREND TOWARD PERSONALIZED MEDICATION
7.2 RESTRAINTS
7.2.1 HIGH COST OF GENETIC TESTING
7.2.2 CYBER SECURITY CONCERNS IN GENOMICS
7.3 OPPORTUNITIES
7.3.1 STRATEGIC INITIATIVES BY THE KEY MARKET PLAYER
7.3.2 TECHNOLOGICAL ADVANCEMENT
7.3.3 INCREASING RESEARCH AND DEVELOPMENT
7.3.4 RISING DISPOSABLE INCOME
7.4 CHALLENGES
7.4.1 LACK OF SKILLED PROFESSIONALS TO PERFORM GENETIC TESTING
7.4.2 STRINGENT REGULATION POLICY
8 ASIA PACIFIC GENETIC TESTING MARKET, BY TYPE
8.1 OVERVIEW
8.2 DIAGNOSTIC TESTING
8.3 PRENATAL TESTING
8.3.1 NON-INVASIVE SCREENING
8.3.1.1 BY SCREENING METHOD
8.3.1.1.1 WHOLE GENOME SEQUENCING
8.3.1.1.2 COUNTING OF cfDNA FRAGMENTS
8.3.1.1.3 OTHERS
8.3.1.2 BY CONDITION
8.3.1.2.1 TRISOMY 21
8.3.1.2.2 KLINEFELTER SYNDROME
8.3.1.2.3 JACOBS SYNDROME
8.3.1.2.4 CYSTIC FIBROSIS
8.3.1.2.5 TURNER SYNDROME
8.3.1.2.6 TRISOMY 18
8.3.1.2.7 HEMOPHILIA
8.3.1.2.8 TRISOMY 13
8.3.1.2.9 MICRODELETION SYNDROME
8.3.1.2.10 FETAL GENDER
8.3.1.2.11 OTHERS
8.3.1.3 BY SCREENING TYPE
8.3.1.3.1 CARRIER SEQUENCING
8.3.1.3.2 SEQUENTIAL SEQUENCING
8.3.2 MATERNAL SERUM QUAD SCREENING
8.4 NEW BORN SCREENING
8.4.1.1 SICKLE CELL DISEASE
8.4.1.2 CONGENITAL HYPOTHYROIDISM
8.4.1.3 PHENYLKETONURIA (PKU)
8.4.1.4 GALACTOSEMIA
8.4.1.5 MAPLE SYRUP URINE DISEASE
8.4.1.6 OTHERS
8.5 PREDICTIVE AND PRESYMPTOMATIC TESTING
8.6 CARRIER TESTING
8.6.1 BY TEST TYPE
8.6.1.1 MOLECULAR SCREENING TEST
8.6.1.2 BIOCHEMICAL SCREENING TEST
8.6.2 BY TYPE
8.6.2.1 EXPANDED CARRIER SCREENING
8.6.2.1.1 PREDESIGNED PANEL TESTING
8.6.2.1.2 CUSTOM-MADE PANEL TESTING
8.6.2.2 TARGETED DISEASE CARRIER SCREENING
8.6.2.2.1 BY MEDICAL CONDITION
8.6.2.2.2 HEMATOLOGICAL CONDITIONS
8.6.2.2.3 PULMONARY CONDITIONS
8.6.2.2.4 NEUROLOGICAL CONDITIONS
8.6.2.2.5 OTHER CONDITIONS
8.7 OTHER TYPES
9 ASIA PACIFIC GENETIC TESTING MARKET, BY TECHNOLOGY
9.1 OVERVIEW
9.2 POLYMERASE CHAIN REACTION
9.2.1 REAL-TIME PCR (QPCR)
9.2.2 DIGITAL PCR (DPCR)
9.2.3 REVERSE TRANSCRIPTION PCR (RT-PCR)
9.2.4 HOT-START PCR
9.2.5 MULTIPLEX PCR
9.2.6 OTHER PCR
9.3 DNA SEQUENCING (NGS-BASED TESTING)
9.3.1 NEXT GENERATION SEQUENCING (NGS)
9.3.2 SANGER SEQUENCING (SINGLE GENE)
9.3.3 OTHER
9.4 WHOLE GENOME SEQUENCING
9.5 MICROARRAYS
9.5.1 DNA MICROARRAYS
9.5.2 PROTEIN MICROARRAYS
9.5.3 OTHER MICROARRAYS
9.6 FLUORESCENCE IN SITU HYBRIDIZATION (FISH)
9.7 OTHERS
10 ASIA PACIFIC GENETIC TESTING MARKET, BY DISEASES
10.1 OVERVIEW
10.2 CANCER
10.2.1 BREAST
10.2.2 COLON
10.2.3 LUNG
10.2.4 PROSTATE
10.2.5 OTHERS
10.3 SICKLE CELL ANEMIA
10.4 THALASSEMIA
10.5 RARE GENETIC DISORDER
10.5.1 TRISOMY 21
10.5.2 MONOSOMY X
10.5.3 TRISOMY 13
10.5.4 MICRODELETION SYNDROME
10.5.5 TRISOMY 18
10.5.6 OTHERS
10.6 FRAGILE X SYNDROME
10.7 DUCHENNE MUSCULAR DYSTROPHY
10.8 HUNTINGTON'S DISEASE
10.9 CYSTIC FIBROSIS
10.1 OTHERS
11 ASIA PACIFIC GENETIC TESTING MARKET, BY END USER
11.1 OVERVIEW
11.2 HOSPITALS
11.3 CLINICS
11.4 DIAGNOSTIC CENTERS
11.5 PRIVATE CLINICS
11.6 LABORATORY SERVICE PROVIDERS
11.7 PRIVATE LABORATORIES
12 ASIA PACIFIC GENETIC TESTING MARKET, BY REGION
12.1 ASIA-PACIFIC
12.1.1 CHINA
12.1.2 JAPAN
12.1.3 INDIA
12.1.4 SOUTH KOREA
12.1.5 AUSTRALIA
12.1.6 SINGAPORE
12.1.7 THAILAND
12.1.8 INDONESIA
12.1.9 PHILIPPINES
12.1.10 MALAYSIA
12.1.11 VIETNAM
12.1.12 REST OF ASIA-PACIFIC
13 ASIA PACIFIC GENETIC TESTING MARKET, COMPANY LANDSCAPE
13.1 COMPANY SHARE ANALYSIS: ASIA PACIFIC
14 SWOT ANALYSIS
15 COMPANY PROFILE
15.1 ILLUMINA, INC.
15.1.1 COMPANY SNAPSHOT
15.1.2 COMPANY SHARE ANALYSIS
15.1.3 PRODUCT PORTFOLIO
15.1.4 RECENT DEVELOPMENT
15.1.4.1 ACQUISITION
15.1.4.2 COLLABORATION
15.2 CEPHEID
15.2.1 COMPANY SNAPSHOT
15.2.2 REVENUE ANALYSIS
15.2.3 COMPANY SHARE ANALYSIS
15.2.4 PRODUCT PORTFOLIO
15.2.5 RECENT DEVELOPMENT
15.2.5.1 BUSINEES EXPANSION
15.3 FULGENT GENETICS
15.3.1 COMPANY SNAPSHOT
15.3.2 REVENUE ANALYSIS
15.3.3 COMPANY SHARE ANALYSIS
15.3.4 PRODUCT PORTFOLIO
15.3.5 RECENT DEVELOPMENT
15.3.5.1 ACQUISITION
15.4 PERKINELMER INC.
15.4.1 COMPANY SNAPSHOT
15.4.2 REVENUE ANALYSIS
15.4.3 COMPANY SHARE ANALYSIS
15.4.4 PRODUCT PORTFOLIO
15.4.5 RECENT DEVELOPMENT
15.4.5.1 PRODUCT LAUNCH
15.5 THERMO FISHER SCIENTIFIC INC.
15.5.1 COMPANY SNAPSHOT
15.5.2 REVENUE ANALYSIS
15.5.3 COMPANY SHARE ANALYSIS
15.5.4 PRODUCT PORTFOLIO
15.5.5 RECENT DEVELOPMENT
15.5.5.1 COLLABORATION
15.6 ABBOTT
15.6.1 COMPANY SNAPSHOT
15.6.2 REVENUE ANALYSIS
15.6.3 PRODUCT PORTFOLIO
15.6.4 RECENT DEVELOPMENT
15.7 BIOCARTIS
15.7.1 COMPANY SNAPSHOT
15.7.2 REVENUE ANALYSIS
15.7.3 PRODUCT PORTFOLIO
15.7.4 RECENT DEVELOPMENT
15.7.4.1 PARTNERSHIP
15.7.4.2 AGREEMENT
15.8 BIO-HELIX
15.8.1 COMPANY SNAPSHOT
15.8.2 PRODUCT PORTFOLIO
15.8.3 RECENT DEVELOPMENT
15.9 BIO-RAD LABORATORIES, INC.
15.9.1 COMPANY SNAPSHOT
15.9.2 REVENUE ANALYSIS
15.9.3 PRODUCT PORTFOLIO
15.9.4 RECENT DEVELOPMENTS
15.9.4.1 ACQUISITION
15.9.4.2 PARTNERSHIP
15.1 BIOREFERENCE
15.10.1 COMPANY SNAPSHOT
15.10.2 REVENUE ANALYSIS
15.10.3 PRODUCT PORTFOLIO
15.10.4 RECENT DEVELOPMENT
15.10.4.1 ACQUISITION
15.11 ELITECHGROUP
15.11.1 COMPANY SNAPSHOT
15.11.2 PRODUCT PORTFOLIO
15.11.3 RECENT DEVELOPMENTS
15.11.3.1 PRODUCT LAUNCH
15.11.3.2 BUSINESS EXPANSION
15.12 EUROFINS SCIENTIFIC
15.12.1 COMPANY SNAPSHOT
15.12.2 REVENUE ANALYSIS
15.12.3 PRODUCT PORTFOLIO
15.12.4 RECENT DEVELOPMENT
15.12.4.1 PRODUCT LAUNCH
15.13 EUGENE LABS
15.13.1 COMPANY SNAPSHOT
15.13.2 PRODUCT PORTFOLIO
15.13.3 RECENT DEVELOPMENT
15.14 F. HOFFMANN-LA ROCHE LTD)
15.14.1 COMPANY SNAPSHOT
15.14.2 REVENUE ANALYSIS (PARENT COMPANY)
15.14.3 PRODUCT PORTFOLIO
15.14.4 RECENT DEVELOPMENTS
15.14.4.1 PRODUCT LAUNCH
15.15 GENES2ME
15.15.1 COMPANY SNAPSHOT
15.15.2 PRODUCT PORTFOLIO
15.15.3 RECENT DEVELOPMENT
15.16 INVITAE CORPORATION
15.16.1 COMPANY SNAPSHOT
15.16.2 REVENUE ANALYSIS
15.16.3 PRODUCT PORTFOLIO
15.16.4 RECENT DEVELOPMENTS
15.17 MAPMYGENOME
15.17.1 COMPANY SNAPSHOT
15.17.2 PRODUCT PORTFOLIO
15.17.3 RECENT DEVELOPMENT
15.18 MEDGENOME
15.18.1 COMPANY SNAPSHOT
15.18.2 PRODUCT PORTFOLIO
15.18.3 RECENT DEVELOPMENT
15.19 MYRIAD GENETICS
15.19.1 COMPANY SNAPSHOT
15.19.2 REVENUE ANALYSIS
15.19.3 PRODUCT PORTFOLIO
15.19.4 RECENT DEVELOPMENT
15.2 NATERA, INC.
15.20.1 COMPANY SNAPSHOT
15.20.2 PRODUCT PORTFOLIO
15.20.3 RECENT DEVELOPMENT
15.20.3.1 PARTNERSHIP
15.21 OTOGENRTICS
15.21.1 COMPANY SNAPSHOT
15.21.2 PRODUCT PORTFOLIO
15.21.3 RECENT DEVELOPMENT
15.22 PACBIO
15.22.1 COMPANY SNAPSHOT
15.22.2 REVENUE ANALYSIS
15.22.3 PRODUCT PORTFOLIO
15.22.4 RECENT DEVELOPMENT
15.23 QIAGEN
15.23.1 COMPANY SNAPSHOT
15.23.2 PRODUCT PORTFOLIO
15.23.3 RECENT DEVELOPMENTS
15.23.3.1 PARTNERSHIP
15.23.3.2 PRODUCT LAUNCH
15.24 SEMA4 OPCO, INC.
15.24.1 COMPANY SNAPSHOT
15.24.2 REVENUE ANALYSIS
15.24.3 PRODUCT PORTFOLIO
15.24.4 RECENT DEVELOPMENT
15.25 SORENSON GENOMICS
15.25.1 COMPANY SNAPSHOT
15.25.2 PRODUCT PORTFOLIO
15.25.3 RECENT DEVELOPMENT
16 QUESTIONNAIRE
17 RELATED REPORTS
Lista de Tablas
TABLE 1 ASIA PACIFIC GENETIC TESTING MARKET, BY TYPE, 2020-2029 (USD MILLION)
TABLE 2 ASIA PACIFIC GENETIC TESTING MARKET, BY TYPE, 2020-2029 (UNITS)
TABLE 3 ASIA PACIFIC GENETIC TESTING MARKET, BY TYPE, 2020-2029 (ASP)
TABLE 4 ASIA PACIFIC DIAGNOSTIC TESTING IN GENETIC TESTING MARKET, BY REGION, 2020-2029 (USD MILLION)
TABLE 5 ASIA PACIFIC PRENATAL TESTING IN GENETIC TESTING MARKET, BY REGION, 2020-2029 (USD MILLION)
TABLE 6 ASIA PACIFIC PRENATAL TESTING IN GENETIC TESTING MARKET, BY TYPE, 2020-2029 (USD MILLION)
TABLE 7 ASIA PACIFIC PRENATAL TESTING IN GENETIC TESTING MARKET, BY TYPE, 2020-2029 (UNITS)
TABLE 8 ASIA PACIFIC PRENATAL TESTING IN GENETIC TESTING MARKET, BY TYPE, 2020-2029 (ASP)
TABLE 9 ASIA PACIFIC NON-INVASIVE SCREENING IN GENETIC TESTING MARKET, BY SCREENING METHOD, 2020-2029 (USD MILLION)
TABLE 10 ASIA PACIFIC NON-INVASIVE SCREENING IN GENETIC TESTING MARKET, BY SCREENING METHOD, 2020-2029 (UNITS)
TABLE 11 ASIA PACIFIC NON-INVASIVE SCREENING IN GENETIC TESTING MARKET, BY SCREENING METHOD, 2020-2029 (ASP)
TABLE 12 ASIA PACIFIC NON-INVASIVE SCREENING IN GENETIC TESTING MARKET, BY CONDITION, 2020-2029 (USD MILLION)
TABLE 13 ASIA PACIFIC NON-INVASIVE SCREENING IN GENETIC TESTING MARKET, BY SCREENING TYPE, 2020-2029 (USD MILLION)
TABLE 14 ASIA PACIFIC NON-INVASIVE SCREENING IN GENETIC TESTING MARKET, BY SCREENING TYPE, 2020-2029 (UNITS)
TABLE 15 ASIA PACIFIC NON-INVASIVE SCREENING IN GENETIC TESTING MARKET, BY SCREENING TYPE, 2020-2029 (ASP)
TABLE 16 ASIA PACIFIC NEW BORN SCREENING IN GENETIC TESTING MARKET, BY REGION, 2020-2029 (USD MILLION)
TABLE 17 ASIA PACIFIC NEW-BORN SCREENING IN GENETIC TESTING MARKET, BY TYPE, 2020-2029 (USD MILLION)
TABLE 18 ASIA PACIFIC PREDICTIVE AND PRESYMPTOMATIC TESTING IN GENETIC TESTING MARKET, BY REGION, 2020-2029 (USD MILLION)
TABLE 19 ASIA PACIFIC CARRIER TESTING IN GENETIC TESTING MARKET, BY REGION, 2020-2029 (USD MILLION)
TABLE 20 ASIA PACIFIC CARRIER TESTING IN GENETIC TESTING MARKET, BY TEST TYPE, 2020-2029 (USD MILLION)
TABLE 21 ASIA PACIFIC CARRIER TESTING IN GENETIC TESTING MARKET, BY TEST TYPE, 2020-2029 (UNITS)
TABLE 22 ASIA PACIFIC CARRIER TESTING IN GENETIC TESTING MARKET, BY TEST TYPE, 2020-2029 (ASP)
TABLE 23 ASIA PACIFIC CARRIER TESTING IN GENETIC TESTING MARKET, BY TYPE, 2020-2029 (USD MILLION)
TABLE 24 ASIA PACIFIC CARRIER TESTING IN GENETIC TESTING MARKET, BY TYPE, 2020-2029 (UNITS)
TABLE 25 ASIA PACIFIC CARRIER TESTING IN GENETIC TESTING MARKET, BY TYPE, 2020-2029 (ASP)
TABLE 26 ASIA PACIFIC EXPANDED CARRIER SCREENING IN GENETIC TESTING MARKET, BY TYPE, 2020-2029 (USD MILLION)
TABLE 27 ASIA PACIFIC EXPANDED CARRIER SCREENING IN GENETIC TESTING MARKET, BY TYPE, 2020-2029 (UNITS)
TABLE 28 ASIA PACIFIC EXPANDED CARRIER SCREENING IN GENETIC TESTING MARKET, BY TYPE, 2020-2029 (ASP)
TABLE 29 ASIA PACIFIC CARRIER TESTING IN GENETIC TESTING MARKET, BY MEDICAL CONDITION, 2020-2029 (USD MILLION)
TABLE 30 ASIA PACIFIC OTHER TYPES IN GENETIC TESTING MARKET, BY REGION, 2020-2029 (USD MILLION)
TABLE 31 ASIA PACIFIC GENETIC TESTING MARKET, BY TECHNOLOGY, 2020-2029 (USD MILLION)
TABLE 32 ASIA PACIFIC POLYMERASE CHAIN REACTION IN GENETIC TESTING MARKET, BY REGION, 2020-2029 (USD MILLION)
TABLE 33 ASIA PACIFIC POLYMERASE CHAIN REACTION IN GENETIC TESTING MARKET, BY TECHNOLOGY, 2020-2029 (USD MILLION)
TABLE 34 ASIA PACIFIC DNA SEQUENCING (NGS-BASED TESTING) IN GENETIC TESTING MARKET, BY REGION, 2020-2029 (USD MILLION)
TABLE 35 ASIA PACIFIC DNA SEQUENCING (NGS-BASED TESTING) IN GENETIC TESTING MARKET, BY TECHNOLOGY, 2020-2029 (USD MILLION)
TABLE 36 ASIA PACIFIC WHOLE GENOME SEQUENCING IN GENETIC TESTING MARKET, BY REGION, 2020-2029 (USD MILLION)
TABLE 37 ASIA PACIFIC MICROARRAYS IN GENETIC TESTING MARKET, BY REGION, 2020-2029 (USD MILLION)
TABLE 38 ASIA PACIFIC MICROARRAYS IN GENETIC TESTING MARKET, BY TECHNOLOGY, 2020-2029 (USD MILLION)
TABLE 39 ASIA PACIFIC FLUORESCENCE IN SITU HYBRIDIZATION (FISH) IN GENETIC TESTING MARKET, BY REGION, 2020-2029 (USD MILLION)
TABLE 40 ASIA PACIFIC OTHERS IN GENETIC TESTING MARKET, BY REGION, 2020-2029 (USD MILLION)
TABLE 41 ASIA PACIFIC GENETIC TESTING MARKET, BY DISEASES, 2020-2029 (USD MILLION)
TABLE 42 ASIA PACIFIC CANCER IN GENETIC TESTING MARKET, BY REGION, 2020-2029 (USD MILLION)
TABLE 43 ASIA PACIFIC CANCER IN GENETIC TESTING MARKET, BY DISEASES, 2020-2029 (USD MILLION)
TABLE 44 ASIA PACIFIC SICKLE CELL ANEMIA IN GENETIC TESTING MARKET, BY REGION, 2020-2029 (USD MILLION)
TABLE 45 ASIA PACIFIC THALASSEMIA IN GENETIC TESTING MARKET, BY REGION, 2020-2029 (USD MILLION)
TABLE 46 ASIA PACIFIC RARE GENETIC DISORDER IN GENETIC TESTING MARKET, BY REGION, 2020-2029 (USD MILLION)
TABLE 47 ASIA PACIFIC RARE GENETIC DISORDER IN GENETIC TESTING MARKET, BY DISEASES, 2020-2029 (USD MILLION)
TABLE 48 ASIA PACIFIC FRAGILE X SYNDROME IN GENETIC TESTING MARKET, BY REGION, 2020-2029 (USD MILLION)
TABLE 49 ASIA PACIFIC DUCHENNE MUSCULAR DYSTROPHY IN GENETIC TESTING MARKET, BY REGION, 2020-2029 (USD MILLION)
TABLE 50 ASIA PACIFIC HUNTINGTON'S DISEASE IN GENETIC TESTING MARKET, BY REGION, 2020-2029 (USD MILLION)
TABLE 51 ASIA PACIFIC CYSTIC FIBROSIS IN GENETIC TESTING MARKET, BY REGION, 2020-2029 (USD MILLION)
TABLE 52 ASIA PACIFIC OTHERS IN GENETIC TESTING MARKET, BY REGION, 2020-2029 (USD MILLION)
TABLE 53 ASIA PACIFIC GENETIC TESTING MARKET, BY END USER, 2020-2029 (USD MILLION)
TABLE 54 ASIA PACIFIC HOSPITALS IN GENETIC TESTING MARKET, BY REGION, 2020-2029 (USD MILLION)
TABLE 55 ASIA PACIFIC CLINICS IN GENETIC TESTING MARKET, BY REGION, 2020-2029 (USD MILLION)
TABLE 56 ASIA PACIFIC DIAGNOSTIC CENTERS IN GENETIC TESTING MARKET, BY REGION, 2020-2029 (USD MILLION)
TABLE 57 ASIA PACIFIC PRIVATE CLINICS IN GENETIC TESTING MARKET, BY REGION, 2020-2029 (USD MILLION)
TABLE 58 ASIA PACIFIC LABORATORY SERVICE PROVIDERS IN GENETIC TESTING MARKET, BY REGION, 2020-2029 (USD MILLION)
TABLE 59 ASIA PACIFIC PRIVATE LABORATORIES IN GENETIC TESTING MARKET, BY REGION, 2020-2029 (USD MILLION)
TABLE 60 ASIA-PACIFIC GENETIC TESTING MARKET, BY COUNTRY, 2020-2029 (USD MILLION)
TABLE 61 ASIA-PACIFIC GENETIC TESTING MARKET, BY TYPE, 2020-2029 (USD MILLION)
TABLE 62 ASIA-PACIFIC GENETIC TESTING MARKET, BY TYPE, 2020-2029 (UNITS)
TABLE 63 ASIA-PACIFIC GENETIC TESTING MARKET, BY TYPE, 2020-2029 (ASP)
TABLE 64 ASIA-PACIFIC PRENATAL TESTING IN GENETIC TESTING MARKET, BY TYPE, 2020-2029 (USD MILLION)
TABLE 65 ASIA-PACIFIC PRENATAL TESTING IN GENETIC TESTING MARKET, BY TYPE, 2020-2029 (UNITS)
TABLE 66 ASIA-PACIFIC PRENATAL TESTING IN GENETIC TESTING MARKET, BY TYPE, 2020-2029 (ASP)
TABLE 67 ASIA-PACIFIC NON-INVASIVE SCREENING IN GENETIC TESTING MARKET, BY SCREENING METHOD, 2020-2029 (USD MILLION)
TABLE 68 ASIA-PACIFIC NON-INVASIVE SCREENING IN GENETIC TESTING MARKET, BY SCREENING METHOD, 2020-2029 (UNITS)
TABLE 69 ASIA-PACIFIC NON-INVASIVE SCREENING IN GENETIC TESTING MARKET, BY SCREENING METHOD, 2020-2029 (ASP)
TABLE 70 ASIA-PACIFIC NON-INVASIVE SCREENING IN GENETIC TESTING MARKET, BY CONDITION, 2020-2029 (USD MILLION)
TABLE 71 ASIA-PACIFIC NON-INVASIVE SCREENING IN GENETIC TESTING MARKET, BY SCREENING TYPE, 2020-2029 (USD MILLION)
TABLE 72 ASIA-PACIFIC NON-INVASIVE SCREENING IN GENETIC TESTING MARKET, BY SCREENING TYPE, 2020-2029 (UNITS)
TABLE 73 ASIA-PACIFIC NON-INVASIVE SCREENING IN GENETIC TESTING MARKET, BY SCREENING TYPE, 2020-2029 (ASP)
TABLE 74 ASIA-PACIFIC NEW-BORN SCREENING IN GENETIC TESTING MARKET, BY TYPE, 2020-2029 (USD MILLION)
TABLE 75 ASIA-PACIFIC CARRIER TESTING IN GENETIC TESTING MARKET, BY TEST TYPE, 2020-2029 (USD MILLION)
TABLE 76 ASIA-PACIFIC CARRIER TESTING IN GENETIC TESTING MARKET, BY TEST TYPE, 2020-2029 (UNITS)
TABLE 77 ASIA-PACIFIC CARRIER TESTING IN GENETIC TESTING MARKET, BY TEST TYPE, 2020-2029 (ASP)
TABLE 78 ASIA-PACIFIC CARRIER TESTING IN GENETIC TESTING MARKET, BY TYPE, 2020-2029 (USD MILLION)
TABLE 79 ASIA-PACIFIC CARRIER TESTING IN GENETIC TESTING MARKET, BY TYPE, 2020-2029 (UNITS)
TABLE 80 ASIA-PACIFIC CARRIER TESTING IN GENETIC TESTING MARKET, BY TYPE, 2020-2029 (ASP)
TABLE 81 ASIA-PACIFIC EXPANDED CARRIER SCREENING IN GENETIC TESTING MARKET, BY TYPE, 2020-2029 (USD MILLION)
TABLE 82 ASIA-PACIFIC EXPANDED CARRIER SCREENING IN GENETIC TESTING MARKET, BY TYPE, 2020-2029 (UNITS)
TABLE 83 ASIA-PACIFIC EXPANDED CARRIER SCREENING IN GENETIC TESTING MARKET, BY TYPE, 2020-2029 (ASP)
TABLE 84 ASIA-PACIFIC CARRIER TESTING IN GENETIC TESTING MARKET, BY MEDICAL CONDITION, 2020-2029 (USD MILLION)
TABLE 85 ASIA-PACIFIC GENETIC TESTING MARKET, BY TECHNOLOGY, 2020-2029 (USD MILLION)
TABLE 86 ASIA-PACIFIC POLYMERASE CHAIN REACTION IN GENETIC TESTING MARKET, BY TECHNOLOGY, 2020-2029 (USD MILLION)
TABLE 87 ASIA-PACIFIC DNA SEQUENCING IN GENETIC TESTING MARKET, BY TECHNOLOGY, 2020-2029 (USD MILLION)
TABLE 88 ASIA-PACIFIC MICROARRAYS IN GENETIC TESTING MARKET, BY TECHNOLOGY, 2020-2029 (USD MILLION)
TABLE 89 ASIA-PACIFIC GENETIC TESTING MARKET, BY DISEASES, 2020-2029 (USD MILLION)
TABLE 90 ASIA-PACIFIC RARE GENETIC DISORDER IN GENETIC TESTING MARKET, BY DISEASES, 2020-2029 (USD MILLION)
TABLE 91 ASIA-PACIFIC CANCER IN GENETIC TESTING MARKET, BY DISEASES, 2020-2029 (USD MILLION)
TABLE 92 ASIA-PACIFIC GENETIC TESTING MARKET, BY END USER, 2020-2029 (USD MILLION)
TABLE 93 CHINA GENETIC TESTING MARKET, BY TYPE, 2020-2029 (USD MILLION)
TABLE 94 CHINA GENETIC TESTING MARKET, BY TYPE, 2020-2029 (UNITS)
TABLE 95 CHINA GENETIC TESTING MARKET, BY TYPE, 2020-2029 (ASP)
TABLE 96 CHINA PRENATAL TESTING IN GENETIC TESTING MARKET, BY TYPE, 2020-2029 (USD MILLION)
TABLE 97 CHINA PRENATAL TESTING IN GENETIC TESTING MARKET, BY TYPE, 2020-2029 (UNITS)
TABLE 98 CHINA PRENATAL TESTING IN GENETIC TESTING MARKET, BY TYPE, 2020-2029 (ASP)
TABLE 99 CHINA NON-INVASIVE SCREENING IN GENETIC TESTING MARKET, BY SCREENING METHOD, 2020-2029 (USD MILLION)
TABLE 100 CHINA NON-INVASIVE SCREENING IN GENETIC TESTING MARKET, BY SCREENING METHOD, 2020-2029 (UNITS)
TABLE 101 CHINA NON-INVASIVE SCREENING IN GENETIC TESTING MARKET, BY SCREENING METHOD, 2020-2029 (ASP)
TABLE 102 CHINA NON-INVASIVE SCREENING IN GENETIC TESTING MARKET, BY CONDITION, 2020-2029 (USD MILLION)
TABLE 103 CHINA NON-INVASIVE SCREENING IN GENETIC TESTING MARKET, BY SCREENING TYPE, 2020-2029 (USD MILLION)
TABLE 104 CHINA NON-INVASIVE SCREENING IN GENETIC TESTING MARKET, BY SCREENING TYPE, 2020-2029 (UNITS)
TABLE 105 CHINA NON-INVASIVE SCREENING IN GENETIC TESTING MARKET, BY SCREENING TYPE, 2020-2029 (ASP)
TABLE 106 CHINA NEW-BORN SCREENING IN GENETIC TESTING MARKET, BY TYPE, 2020-2029 (USD MILLION)
TABLE 107 CHINA CARRIER TESTING IN GENETIC TESTING MARKET, BY TEST TYPE, 2020-2029 (USD MILLION)
TABLE 108 CHINA CARRIER TESTING IN GENETIC TESTING MARKET, BY TEST TYPE, 2020-2029 (UNITS)
TABLE 109 CHINA CARRIER TESTING IN GENETIC TESTING MARKET, BY TEST TYPE, 2020-2029 (ASP)
TABLE 110 CHINA CARRIER TESTING IN GENETIC TESTING MARKET, BY TYPE, 2020-2029 (USD MILLION)
TABLE 111 CHINA CARRIER TESTING IN GENETIC TESTING MARKET, BY TYPE, 2020-2029 (UNITS)
TABLE 112 CHINA CARRIER TESTING IN GENETIC TESTING MARKET, BY TYPE, 2020-2029 (ASP)
TABLE 113 CHINA EXPANDED CARRIER SCREENING IN GENETIC TESTING MARKET, BY TYPE, 2020-2029 (USD MILLION)
TABLE 114 CHINA EXPANDED CARRIER SCREENING IN GENETIC TESTING MARKET, BY TYPE, 2020-2029 (UNITS)
TABLE 115 CHINA EXPANDED CARRIER SCREENING IN GENETIC TESTING MARKET, BY TYPE, 2020-2029 (ASP)
TABLE 116 CHINA CARRIER TESTING IN GENETIC TESTING MARKET, BY MEDICAL CONDITION, 2020-2029 (USD MILLION)
TABLE 117 CHINA GENETIC TESTING MARKET, BY TECHNOLOGY, 2020-2029 (USD MILLION)
TABLE 118 CHINA POLYMERASE CHAIN REACTION IN GENETIC TESTING MARKET, BY TECHNOLOGY, 2020-2029 (USD MILLION)
TABLE 119 CHINA DNA SEQUENCING IN GENETIC TESTING MARKET, BY TECHNOLOGY, 2020-2029 (USD MILLION)
TABLE 120 CHINA MICROARRAYS IN GENETIC TESTING MARKET, BY TECHNOLOGY, 2020-2029 (USD MILLION)
TABLE 121 CHINA GENETIC TESTING MARKET, BY DISEASES, 2020-2029 (USD MILLION)
TABLE 122 CHINA RARE GENETIC DISORDER IN GENETIC TESTING MARKET, BY DISEASES, 2020-2029 (USD MILLION)
TABLE 123 CHINA CANCER IN GENETIC TESTING MARKET, BY DISEASES, 2020-2029 (USD MILLION)
TABLE 124 CHINA GENETIC TESTING MARKET, BY END USER, 2020-2029 (USD MILLION)
TABLE 125 JAPAN GENETIC TESTING MARKET, BY TYPE, 2020-2029 (USD MILLION)
TABLE 126 JAPAN GENETIC TESTING MARKET, BY TYPE, 2020-2029 (UNITS)
TABLE 127 JAPAN GENETIC TESTING MARKET, BY TYPE, 2020-2029 (ASP)
TABLE 128 JAPAN PRENATAL TESTING IN GENETIC TESTING MARKET, BY TYPE, 2020-2029 (USD MILLION)
TABLE 129 JAPAN PRENATAL TESTING IN GENETIC TESTING MARKET, BY TYPE, 2020-2029 (UNITS)
TABLE 130 JAPAN PRENATAL TESTING IN GENETIC TESTING MARKET, BY TYPE, 2020-2029 (ASP)
TABLE 131 JAPAN NON-INVASIVE SCREENING IN GENETIC TESTING MARKET, BY SCREENING METHOD, 2020-2029 (USD MILLION)
TABLE 132 JAPAN NON-INVASIVE SCREENING IN GENETIC TESTING MARKET, BY SCREENING METHOD, 2020-2029 (UNITS)
TABLE 133 JAPAN NON-INVASIVE SCREENING IN GENETIC TESTING MARKET, BY SCREENING METHOD, 2020-2029 (ASP)
TABLE 134 JAPAN NON-INVASIVE SCREENING IN GENETIC TESTING MARKET, BY CONDITION, 2020-2029 (USD MILLION)
TABLE 135 JAPAN NON-INVASIVE SCREENING IN GENETIC TESTING MARKET, BY SCREENING TYPE, 2020-2029 (USD MILLION)
TABLE 136 JAPAN NON-INVASIVE SCREENING IN GENETIC TESTING MARKET, BY SCREENING TYPE, 2020-2029 (UNITS)
TABLE 137 JAPAN NON-INVASIVE SCREENING IN GENETIC TESTING MARKET, BY SCREENING TYPE, 2020-2029 (ASP)
TABLE 138 JAPAN NEW-BORN SCREENING IN GENETIC TESTING MARKET, BY TYPE, 2020-2029 (USD MILLION)
TABLE 139 JAPAN CARRIER TESTING IN GENETIC TESTING MARKET, BY TEST TYPE, 2020-2029 (USD MILLION)
TABLE 140 JAPAN CARRIER TESTING IN GENETIC TESTING MARKET, BY TEST TYPE, 2020-2029 (UNITS)
TABLE 141 JAPAN CARRIER TESTING IN GENETIC TESTING MARKET, BY TEST TYPE, 2020-2029 (ASP)
TABLE 142 JAPAN CARRIER TESTING IN GENETIC TESTING MARKET, BY TYPE, 2020-2029 (USD MILLION)
TABLE 143 JAPAN CARRIER TESTING IN GENETIC TESTING MARKET, BY TYPE, 2020-2029 (UNITS)
TABLE 144 JAPAN CARRIER TESTING IN GENETIC TESTING MARKET, BY TYPE, 2020-2029 (ASP)
TABLE 145 JAPAN EXPANDED CARRIER SCREENING IN GENETIC TESTING MARKET, BY TYPE, 2020-2029 (USD MILLION)
TABLE 146 JAPAN EXPANDED CARRIER SCREENING IN GENETIC TESTING MARKET, BY TYPE, 2020-2029 (UNITS)
TABLE 147 JAPAN EXPANDED CARRIER SCREENING IN GENETIC TESTING MARKET, BY TYPE, 2020-2029 (ASP)
TABLE 148 JAPAN CARRIER TESTING IN GENETIC TESTING MARKET, BY MEDICAL CONDITION, 2020-2029 (USD MILLION)
TABLE 149 JAPAN GENETIC TESTING MARKET, BY TECHNOLOGY, 2020-2029 (USD MILLION)
TABLE 150 JAPAN POLYMERASE CHAIN REACTION IN GENETIC TESTING MARKET, BY TECHNOLOGY, 2020-2029 (USD MILLION)
TABLE 151 JAPAN DNA SEQUENCING IN GENETIC TESTING MARKET, BY TECHNOLOGY, 2020-2029 (USD MILLION)
TABLE 152 JAPAN MICROARRAYS IN GENETIC TESTING MARKET, BY TECHNOLOGY, 2020-2029 (USD MILLION)
TABLE 153 JAPAN GENETIC TESTING MARKET, BY DISEASES, 2020-2029 (USD MILLION)
TABLE 154 JAPAN RARE GENETIC DISORDER IN GENETIC TESTING MARKET, BY DISEASES, 2020-2029 (USD MILLION)
TABLE 155 JAPAN CANCER IN GENETIC TESTING MARKET, BY DISEASES, 2020-2029 (USD MILLION)
TABLE 156 JAPAN GENETIC TESTING MARKET, BY END USER, 2020-2029 (USD MILLION)
TABLE 157 INDIA GENETIC TESTING MARKET, BY TYPE, 2020-2029 (USD MILLION)
TABLE 158 INDIA GENETIC TESTING MARKET, BY TYPE, 2020-2029 (UNITS)
TABLE 159 INDIA GENETIC TESTING MARKET, BY TYPE, 2020-2029 (ASP)
TABLE 160 INDIA PRENATAL TESTING IN GENETIC TESTING MARKET, BY TYPE, 2020-2029 (USD MILLION)
TABLE 161 INDIA PRENATAL TESTING IN GENETIC TESTING MARKET, BY TYPE, 2020-2029 (UNITS)
TABLE 162 INDIA PRENATAL TESTING IN GENETIC TESTING MARKET, BY TYPE, 2020-2029 (ASP)
TABLE 163 INDIA NON-INVASIVE SCREENING IN GENETIC TESTING MARKET, BY SCREENING METHOD, 2020-2029 (USD MILLION)
TABLE 164 INDIA NON-INVASIVE SCREENING IN GENETIC TESTING MARKET, BY SCREENING METHOD, 2020-2029 (UNITS)
TABLE 165 INDIA NON-INVASIVE SCREENING IN GENETIC TESTING MARKET, BY SCREENING METHOD, 2020-2029 (ASP)
TABLE 166 INDIA NON-INVASIVE SCREENING IN GENETIC TESTING MARKET, BY CONDITION, 2020-2029 (USD MILLION)
TABLE 167 INDIA NON-INVASIVE SCREENING IN GENETIC TESTING MARKET, BY SCREENING TYPE, 2020-2029 (USD MILLION)
TABLE 168 INDIA NON-INVASIVE SCREENING IN GENETIC TESTING MARKET, BY SCREENING TYPE, 2020-2029 (UNITS)
TABLE 169 INDIA NON-INVASIVE SCREENING IN GENETIC TESTING MARKET, BY SCREENING TYPE, 2020-2029 (ASP)
TABLE 170 INDIA NEW-BORN SCREENING IN GENETIC TESTING MARKET, BY TYPE, 2020-2029 (USD MILLION)
TABLE 171 INDIA CARRIER TESTING IN GENETIC TESTING MARKET, BY TEST TYPE, 2020-2029 (USD MILLION)
TABLE 172 INDIA CARRIER TESTING IN GENETIC TESTING MARKET, BY TEST TYPE, 2020-2029 (UNITS)
TABLE 173 INDIA CARRIER TESTING IN GENETIC TESTING MARKET, BY TEST TYPE, 2020-2029 (ASP)
TABLE 174 INDIA CARRIER TESTING IN GENETIC TESTING MARKET, BY TYPE, 2020-2029 (USD MILLION)
TABLE 175 INDIA CARRIER TESTING IN GENETIC TESTING MARKET, BY TYPE, 2020-2029 (UNITS)
TABLE 176 INDIA CARRIER TESTING IN GENETIC TESTING MARKET, BY TYPE, 2020-2029 (ASP)
TABLE 177 INDIA EXPANDED CARRIER SCREENING IN GENETIC TESTING MARKET, BY TYPE, 2020-2029 (USD MILLION)
TABLE 178 INDIA EXPANDED CARRIER SCREENING IN GENETIC TESTING MARKET, BY TYPE, 2020-2029 (UNITS)
TABLE 179 INDIA EXPANDED CARRIER SCREENING IN GENETIC TESTING MARKET, BY TYPE, 2020-2029 (ASP)
TABLE 180 INDIA CARRIER TESTING IN GENETIC TESTING MARKET, BY MEDICAL CONDITION, 2020-2029 (USD MILLION)
TABLE 181 INDIA GENETIC TESTING MARKET, BY TECHNOLOGY, 2020-2029 (USD MILLION)
TABLE 182 INDIA POLYMERASE CHAIN REACTION IN GENETIC TESTING MARKET, BY TECHNOLOGY, 2020-2029 (USD MILLION)
TABLE 183 INDIA DNA SEQUENCING IN GENETIC TESTING MARKET, BY TECHNOLOGY, 2020-2029 (USD MILLION)
TABLE 184 INDIA MICROARRAYS IN GENETIC TESTING MARKET, BY TECHNOLOGY, 2020-2029 (USD MILLION)
TABLE 185 INDIA GENETIC TESTING MARKET, BY DISEASES, 2020-2029 (USD MILLION)
TABLE 186 INDIA RARE GENETIC DISORDER IN GENETIC TESTING MARKET, BY DISEASES, 2020-2029 (USD MILLION)
TABLE 187 INDIA CANCER IN GENETIC TESTING MARKET, BY DISEASES, 2020-2029 (USD MILLION)
TABLE 188 INDIA GENETIC TESTING MARKET, BY END USER, 2020-2029 (USD MILLION)
TABLE 189 SOUTH KOREA GENETIC TESTING MARKET, BY TYPE, 2020-2029 (USD MILLION)
TABLE 190 SOUTH KOREA GENETIC TESTING MARKET, BY TYPE, 2020-2029 (UNITS)
TABLE 191 SOUTH KOREA GENETIC TESTING MARKET, BY TYPE, 2020-2029 (ASP)
TABLE 192 SOUTH KOREA PRENATAL TESTING IN GENETIC TESTING MARKET, BY TYPE, 2020-2029 (USD MILLION)
TABLE 193 SOUTH KOREA PRENATAL TESTING IN GENETIC TESTING MARKET, BY TYPE, 2020-2029 (UNITS)
TABLE 194 SOUTH KOREA PRENATAL TESTING IN GENETIC TESTING MARKET, BY TYPE, 2020-2029 (ASP)
TABLE 195 SOUTH KOREA NON-INVASIVE SCREENING IN GENETIC TESTING MARKET, BY SCREENING METHOD, 2020-2029 (USD MILLION)
TABLE 196 SOUTH KOREA NON-INVASIVE SCREENING IN GENETIC TESTING MARKET, BY SCREENING METHOD, 2020-2029 (UNITS)
TABLE 197 SOUTH KOREA NON-INVASIVE SCREENING IN GENETIC TESTING MARKET, BY SCREENING METHOD, 2020-2029 (ASP)
TABLE 198 SOUTH KOREA NON-INVASIVE SCREENING IN GENETIC TESTING MARKET, BY CONDITION, 2020-2029 (USD MILLION)
TABLE 199 SOUTH KOREA NON-INVASIVE SCREENING IN GENETIC TESTING MARKET, BY SCREENING TYPE, 2020-2029 (USD MILLION)
TABLE 200 SOUTH KOREA NON-INVASIVE SCREENING IN GENETIC TESTING MARKET, BY SCREENING TYPE, 2020-2029 (UNITS)
TABLE 201 SOUTH KOREA NON-INVASIVE SCREENING IN GENETIC TESTING MARKET, BY SCREENING TYPE, 2020-2029 (ASP)
TABLE 202 SOUTH KOREA NEW-BORN SCREENING IN GENETIC TESTING MARKET, BY TYPE, 2020-2029 (USD MILLION)
TABLE 203 SOUTH KOREA CARRIER TESTING IN GENETIC TESTING MARKET, BY TEST TYPE, 2020-2029 (USD MILLION)
TABLE 204 SOUTH KOREA CARRIER TESTING IN GENETIC TESTING MARKET, BY TEST TYPE, 2020-2029 (UNITS)
TABLE 205 SOUTH KOREA CARRIER TESTING IN GENETIC TESTING MARKET, BY TEST TYPE, 2020-2029 (ASP)
TABLE 206 SOUTH KOREA CARRIER TESTING IN GENETIC TESTING MARKET, BY TYPE, 2020-2029 (USD MILLION)
TABLE 207 SOUTH KOREA CARRIER TESTING IN GENETIC TESTING MARKET, BY TYPE, 2020-2029 (UNITS)
TABLE 208 SOUTH KOREA CARRIER TESTING IN GENETIC TESTING MARKET, BY TYPE, 2020-2029 (ASP)
TABLE 209 SOUTH KOREA EXPANDED CARRIER SCREENING IN GENETIC TESTING MARKET, BY TYPE, 2020-2029 (USD MILLION)
TABLE 210 SOUTH KOREA EXPANDED CARRIER SCREENING IN GENETIC TESTING MARKET, BY TYPE, 2020-2029 (UNITS)
TABLE 211 SOUTH KOREA EXPANDED CARRIER SCREENING IN GENETIC TESTING MARKET, BY TYPE, 2020-2029 (ASP)
TABLE 212 SOUTH KOREA CARRIER TESTING IN GENETIC TESTING MARKET, BY MEDICAL CONDITION, 2020-2029 (USD MILLION)
TABLE 213 SOUTH KOREA GENETIC TESTING MARKET, BY TECHNOLOGY, 2020-2029 (USD MILLION)
TABLE 214 SOUTH KOREA POLYMERASE CHAIN REACTION IN GENETIC TESTING MARKET, BY TECHNOLOGY, 2020-2029 (USD MILLION)
TABLE 215 SOUTH KOREA DNA SEQUENCING IN GENETIC TESTING MARKET, BY TECHNOLOGY, 2020-2029 (USD MILLION)
TABLE 216 SOUTH KOREA MICROARRAYS IN GENETIC TESTING MARKET, BY TECHNOLOGY, 2020-2029 (USD MILLION)
TABLE 217 SOUTH KOREA GENETIC TESTING MARKET, BY DISEASES, 2020-2029 (USD MILLION)
TABLE 218 SOUTH KOREA RARE GENETIC DISORDER IN GENETIC TESTING MARKET, BY DISEASES, 2020-2029 (USD MILLION)
TABLE 219 SOUTH KOREA CANCER IN GENETIC TESTING MARKET, BY DISEASES, 2020-2029 (USD MILLION)
TABLE 220 SOUTH KOREA GENETIC TESTING MARKET, BY END USER, 2020-2029 (USD MILLION)
TABLE 221 AUSTRALIA GENETIC TESTING MARKET, BY TYPE, 2020-2029 (USD MILLION)
TABLE 222 AUSTRALIA GENETIC TESTING MARKET, BY TYPE, 2020-2029 (UNITS)
TABLE 223 AUSTRALIA GENETIC TESTING MARKET, BY TYPE, 2020-2029 (ASP)
TABLE 224 AUSTRALIA PRENATAL TESTING IN GENETIC TESTING MARKET, BY TYPE, 2020-2029 (USD MILLION)
TABLE 225 AUSTRALIA PRENATAL TESTING IN GENETIC TESTING MARKET, BY TYPE, 2020-2029 (UNITS)
TABLE 226 AUSTRALIA PRENATAL TESTING IN GENETIC TESTING MARKET, BY TYPE, 2020-2029 (ASP)
TABLE 227 AUSTRALIA NON-INVASIVE SCREENING IN GENETIC TESTING MARKET, BY SCREENING METHOD, 2020-2029 (USD MILLION)
TABLE 228 AUSTRALIA NON-INVASIVE SCREENING IN GENETIC TESTING MARKET, BY SCREENING METHOD, 2020-2029 (UNITS)
TABLE 229 AUSTRALIA NON-INVASIVE SCREENING IN GENETIC TESTING MARKET, BY SCREENING METHOD, 2020-2029 (ASP)
TABLE 230 AUSTRALIA NON-INVASIVE SCREENING IN GENETIC TESTING MARKET, BY CONDITION, 2020-2029 (USD MILLION)
TABLE 231 AUSTRALIA NON-INVASIVE SCREENING IN GENETIC TESTING MARKET, BY SCREENING TYPE, 2020-2029 (USD MILLION)
TABLE 232 AUSTRALIA NON-INVASIVE SCREENING IN GENETIC TESTING MARKET, BY SCREENING TYPE, 2020-2029 (UNITS)
TABLE 233 AUSTRALIA NON-INVASIVE SCREENING IN GENETIC TESTING MARKET, BY SCREENING TYPE, 2020-2029 (ASP)
TABLE 234 AUSTRALIA NEW-BORN SCREENING IN GENETIC TESTING MARKET, BY TYPE, 2020-2029 (USD MILLION)
TABLE 235 AUSTRALIA CARRIER TESTING IN GENETIC TESTING MARKET, BY TEST TYPE, 2020-2029 (USD MILLION)
TABLE 236 AUSTRALIA CARRIER TESTING IN GENETIC TESTING MARKET, BY TEST TYPE, 2020-2029 (UNITS)
TABLE 237 AUSTRALIA CARRIER TESTING IN GENETIC TESTING MARKET, BY TEST TYPE, 2020-2029 (ASP)
TABLE 238 AUSTRALIA CARRIER TESTING IN GENETIC TESTING MARKET, BY TYPE, 2020-2029 (USD MILLION)
TABLE 239 AUSTRALIA CARRIER TESTING IN GENETIC TESTING MARKET, BY TYPE, 2020-2029 (UNITS)
TABLE 240 AUSTRALIA CARRIER TESTING IN GENETIC TESTING MARKET, BY TYPE, 2020-2029 (ASP)
TABLE 241 AUSTRALIA EXPANDED CARRIER SCREENING IN GENETIC TESTING MARKET, BY TYPE, 2020-2029 (USD MILLION)
TABLE 242 AUSTRALIA EXPANDED CARRIER SCREENING IN GENETIC TESTING MARKET, BY TYPE, 2020-2029 (UNITS)
TABLE 243 AUSTRALIA EXPANDED CARRIER SCREENING IN GENETIC TESTING MARKET, BY TYPE, 2020-2029 (ASP)
TABLE 244 AUSTRALIA CARRIER TESTING IN GENETIC TESTING MARKET, BY MEDICAL CONDITION, 2020-2029 (USD MILLION)
TABLE 245 AUSTRALIA GENETIC TESTING MARKET, BY TECHNOLOGY, 2020-2029 (USD MILLION)
TABLE 246 AUSTRALIA POLYMERASE CHAIN REACTION IN GENETIC TESTING MARKET, BY TECHNOLOGY, 2020-2029 (USD MILLION)
TABLE 247 AUSTRALIA DNA SEQUENCING IN GENETIC TESTING MARKET, BY TECHNOLOGY, 2020-2029 (USD MILLION)
TABLE 248 AUSTRALIA MICROARRAYS IN GENETIC TESTING MARKET, BY TECHNOLOGY, 2020-2029 (USD MILLION)
TABLE 249 AUSTRALIA GENETIC TESTING MARKET, BY DISEASES, 2020-2029 (USD MILLION)
TABLE 250 AUSTRALIA RARE GENETIC DISORDER IN GENETIC TESTING MARKET, BY DISEASES, 2020-2029 (USD MILLION)
TABLE 251 AUSTRALIA CANCER IN GENETIC TESTING MARKET, BY DISEASES, 2020-2029 (USD MILLION)
TABLE 252 AUSTRALIA GENETIC TESTING MARKET, BY END USER, 2020-2029 (USD MILLION)
TABLE 253 SINGAPORE GENETIC TESTING MARKET, BY TYPE, 2020-2029 (USD MILLION)
TABLE 254 SINGAPORE GENETIC TESTING MARKET, BY TYPE, 2020-2029 (UNITS)
TABLE 255 SINGAPORE GENETIC TESTING MARKET, BY TYPE, 2020-2029 (ASP)
TABLE 256 SINGAPORE PRENATAL TESTING IN GENETIC TESTING MARKET, BY TYPE, 2020-2029 (USD MILLION)
TABLE 257 SINGAPORE PRENATAL TESTING IN GENETIC TESTING MARKET, BY TYPE, 2020-2029 (UNITS)
TABLE 258 SINGAPORE PRENATAL TESTING IN GENETIC TESTING MARKET, BY TYPE, 2020-2029 (ASP)
TABLE 259 SINGAPORE NON-INVASIVE SCREENING IN GENETIC TESTING MARKET, BY SCREENING METHOD, 2020-2029 (USD MILLION)
TABLE 260 SINGAPORE NON-INVASIVE SCREENING IN GENETIC TESTING MARKET, BY SCREENING METHOD, 2020-2029 (UNITS)
TABLE 261 SINGAPORE NON-INVASIVE SCREENING IN GENETIC TESTING MARKET, BY SCREENING METHOD, 2020-2029 (ASP)
TABLE 262 SINGAPORE NON-INVASIVE SCREENING IN GENETIC TESTING MARKET, BY CONDITION, 2020-2029 (USD MILLION)
TABLE 263 SINGAPORE NON-INVASIVE SCREENING IN GENETIC TESTING MARKET, BY SCREENING TYPE, 2020-2029 (USD MILLION)
TABLE 264 SINGAPORE NON-INVASIVE SCREENING IN GENETIC TESTING MARKET, BY SCREENING TYPE, 2020-2029 (UNITS)
TABLE 265 SINGAPORE NON-INVASIVE SCREENING IN GENETIC TESTING MARKET, BY SCREENING TYPE, 2020-2029 (ASP)
TABLE 266 SINGAPORE NEW-BORN SCREENING IN GENETIC TESTING MARKET, BY TYPE, 2020-2029 (USD MILLION)
TABLE 267 SINGAPORE CARRIER TESTING IN GENETIC TESTING MARKET, BY TEST TYPE, 2020-2029 (USD MILLION)
TABLE 268 SINGAPORE CARRIER TESTING IN GENETIC TESTING MARKET, BY TEST TYPE, 2020-2029 (UNITS)
TABLE 269 SINGAPORE CARRIER TESTING IN GENETIC TESTING MARKET, BY TEST TYPE, 2020-2029 (ASP)
TABLE 270 SINGAPORE CARRIER TESTING IN GENETIC TESTING MARKET, BY TYPE, 2020-2029 (USD MILLION)
TABLE 271 SINGAPORE CARRIER TESTING IN GENETIC TESTING MARKET, BY TYPE, 2020-2029 (UNITS)
TABLE 272 SINGAPORE CARRIER TESTING IN GENETIC TESTING MARKET, BY TYPE, 2020-2029 (ASP)
TABLE 273 SINGAPORE EXPANDED CARRIER SCREENING IN GENETIC TESTING MARKET, BY TYPE, 2020-2029 (USD MILLION)
TABLE 274 SINGAPORE EXPANDED CARRIER SCREENING IN GENETIC TESTING MARKET, BY TYPE, 2020-2029 (UNITS)
TABLE 275 SINGAPORE EXPANDED CARRIER SCREENING IN GENETIC TESTING MARKET, BY TYPE, 2020-2029 (ASP)
TABLE 276 SINGAPORE CARRIER TESTING IN GENETIC TESTING MARKET, BY MEDICAL CONDITION, 2020-2029 (USD MILLION)
TABLE 277 SINGAPORE GENETIC TESTING MARKET, BY TECHNOLOGY, 2020-2029 (USD MILLION)
TABLE 278 SINGAPORE POLYMERASE CHAIN REACTION IN GENETIC TESTING MARKET, BY TECHNOLOGY, 2020-2029 (USD MILLION)
TABLE 279 SINGAPORE DNA SEQUENCING IN GENETIC TESTING MARKET, BY TECHNOLOGY, 2020-2029 (USD MILLION)
TABLE 280 SINGAPORE MICROARRAYS IN GENETIC TESTING MARKET, BY TECHNOLOGY, 2020-2029 (USD MILLION)
TABLE 281 SINGAPORE GENETIC TESTING MARKET, BY DISEASES, 2020-2029 (USD MILLION)
TABLE 282 SINGAPORE RARE GENETIC DISORDER IN GENETIC TESTING MARKET, BY DISEASES, 2020-2029 (USD MILLION)
TABLE 283 SINGAPORE CANCER IN GENETIC TESTING MARKET, BY DISEASES, 2020-2029 (USD MILLION)
TABLE 284 SINGAPORE GENETIC TESTING MARKET, BY END USER, 2020-2029 (USD MILLION)
TABLE 285 THAILAND GENETIC TESTING MARKET, BY TYPE, 2020-2029 (USD MILLION)
TABLE 286 THAILAND GENETIC TESTING MARKET, BY TYPE, 2020-2029 (UNITS)
TABLE 287 THAILAND GENETIC TESTING MARKET, BY TYPE, 2020-2029 (ASP)
TABLE 288 THAILAND PRENATAL TESTING IN GENETIC TESTING MARKET, BY TYPE, 2020-2029 (USD MILLION)
TABLE 289 THAILAND PRENATAL TESTING IN GENETIC TESTING MARKET, BY TYPE, 2020-2029 (UNITS)
TABLE 290 THAILAND PRENATAL TESTING IN GENETIC TESTING MARKET, BY TYPE, 2020-2029 (ASP)
TABLE 291 THAILAND NON-INVASIVE SCREENING IN GENETIC TESTING MARKET, BY SCREENING METHOD, 2020-2029 (USD MILLION)
TABLE 292 THAILAND NON-INVASIVE SCREENING IN GENETIC TESTING MARKET, BY SCREENING METHOD, 2020-2029 (UNITS)
TABLE 293 THAILAND NON-INVASIVE SCREENING IN GENETIC TESTING MARKET, BY SCREENING METHOD, 2020-2029 (ASP)
TABLE 294 THAILAND NON-INVASIVE SCREENING IN GENETIC TESTING MARKET, BY CONDITION, 2020-2029 (USD MILLION)
TABLE 295 THAILAND NON-INVASIVE SCREENING IN GENETIC TESTING MARKET, BY SCREENING TYPE, 2020-2029 (USD MILLION)
TABLE 296 THAILAND NON-INVASIVE SCREENING IN GENETIC TESTING MARKET, BY SCREENING TYPE, 2020-2029 (UNITS)
TABLE 297 THAILAND NON-INVASIVE SCREENING IN GENETIC TESTING MARKET, BY SCREENING TYPE, 2020-2029 (ASP)
TABLE 298 THAILAND NEW-BORN SCREENING IN GENETIC TESTING MARKET, BY TYPE, 2020-2029 (USD MILLION)
TABLE 299 THAILAND CARRIER TESTING IN GENETIC TESTING MARKET, BY TEST TYPE, 2020-2029 (USD MILLION)
TABLE 300 THAILAND CARRIER TESTING IN GENETIC TESTING MARKET, BY TEST TYPE, 2020-2029 (UNITS)
TABLE 301 THAILAND CARRIER TESTING IN GENETIC TESTING MARKET, BY TEST TYPE, 2020-2029 (ASP)
TABLE 302 THAILAND CARRIER TESTING IN GENETIC TESTING MARKET, BY TYPE, 2020-2029 (USD MILLION)
TABLE 303 THAILAND CARRIER TESTING IN GENETIC TESTING MARKET, BY TYPE, 2020-2029 (UNITS)
TABLE 304 THAILAND CARRIER TESTING IN GENETIC TESTING MARKET, BY TYPE, 2020-2029 (ASP)
TABLE 305 THAILAND EXPANDED CARRIER SCREENING IN GENETIC TESTING MARKET, BY TYPE, 2020-2029 (USD MILLION)
TABLE 306 THAILAND EXPANDED CARRIER SCREENING IN GENETIC TESTING MARKET, BY TYPE, 2020-2029 (UNITS)
TABLE 307 THAILAND EXPANDED CARRIER SCREENING IN GENETIC TESTING MARKET, BY TYPE, 2020-2029 (ASP)
TABLE 308 THAILAND CARRIER TESTING IN GENETIC TESTING MARKET, BY MEDICAL CONDITION, 2020-2029 (USD MILLION)
TABLE 309 THAILAND GENETIC TESTING MARKET, BY TECHNOLOGY, 2020-2029 (USD MILLION)
TABLE 310 THAILAND POLYMERASE CHAIN REACTION IN GENETIC TESTING MARKET, BY TECHNOLOGY, 2020-2029 (USD MILLION)
TABLE 311 THAILAND DNA SEQUENCING IN GENETIC TESTING MARKET, BY TECHNOLOGY, 2020-2029 (USD MILLION)
TABLE 312 THAILAND MICROARRAYS IN GENETIC TESTING MARKET, BY TECHNOLOGY, 2020-2029 (USD MILLION)
TABLE 313 THAILAND GENETIC TESTING MARKET, BY DISEASES, 2020-2029 (USD MILLION)
TABLE 314 THAILAND RARE GENETIC DISORDER IN GENETIC TESTING MARKET, BY DISEASES, 2020-2029 (USD MILLION)
TABLE 315 THAILAND CANCER IN GENETIC TESTING MARKET, BY DISEASES, 2020-2029 (USD MILLION)
TABLE 316 THAILAND GENETIC TESTING MARKET, BY END USER, 2020-2029 (USD MILLION)
TABLE 317 INDONESIA GENETIC TESTING MARKET, BY TYPE, 2020-2029 (USD MILLION)
TABLE 318 INDONESIA GENETIC TESTING MARKET, BY TYPE, 2020-2029 (UNITS)
TABLE 319 INDONESIA GENETIC TESTING MARKET, BY TYPE, 2020-2029 (ASP)
TABLE 320 INDONESIA PRENATAL TESTING IN GENETIC TESTING MARKET, BY TYPE, 2020-2029 (USD MILLION)
TABLE 321 INDONESIA PRENATAL TESTING IN GENETIC TESTING MARKET, BY TYPE, 2020-2029 (UNITS)
TABLE 322 INDONESIA PRENATAL TESTING IN GENETIC TESTING MARKET, BY TYPE, 2020-2029 (ASP)
TABLE 323 INDONESIA NON-INVASIVE SCREENING IN GENETIC TESTING MARKET, BY SCREENING METHOD, 2020-2029 (USD MILLION)
TABLE 324 INDONESIA NON-INVASIVE SCREENING IN GENETIC TESTING MARKET, BY SCREENING METHOD, 2020-2029 (UNITS)
TABLE 325 INDONESIA NON-INVASIVE SCREENING IN GENETIC TESTING MARKET, BY SCREENING METHOD, 2020-2029 (ASP)
TABLE 326 INDONESIA NON-INVASIVE SCREENING IN GENETIC TESTING MARKET, BY CONDITION, 2020-2029 (USD MILLION)
TABLE 327 INDONESIA NON-INVASIVE SCREENING IN GENETIC TESTING MARKET, BY SCREENING TYPE, 2020-2029 (USD MILLION)
TABLE 328 INDONESIA NON-INVASIVE SCREENING IN GENETIC TESTING MARKET, BY SCREENING TYPE, 2020-2029 (UNITS)
TABLE 329 INDONESIA NON-INVASIVE SCREENING IN GENETIC TESTING MARKET, BY SCREENING TYPE, 2020-2029 (ASP)
TABLE 330 INDONESIA NEW-BORN SCREENING IN GENETIC TESTING MARKET, BY TYPE, 2020-2029 (USD MILLION)
TABLE 331 INDONESIA CARRIER TESTING IN GENETIC TESTING MARKET, BY TEST TYPE, 2020-2029 (USD MILLION)
TABLE 332 INDONESIA CARRIER TESTING IN GENETIC TESTING MARKET, BY TEST TYPE, 2020-2029 (UNITS)
TABLE 333 INDONESIA CARRIER TESTING IN GENETIC TESTING MARKET, BY TEST TYPE, 2020-2029 (ASP)
TABLE 334 INDONESIA CARRIER TESTING IN GENETIC TESTING MARKET, BY TYPE, 2020-2029 (USD MILLION)
TABLE 335 INDONESIA CARRIER TESTING IN GENETIC TESTING MARKET, BY TYPE, 2020-2029 (UNITS)
TABLE 336 INDONESIA CARRIER TESTING IN GENETIC TESTING MARKET, BY TYPE, 2020-2029 (ASP)
TABLE 337 INDONESIA EXPANDED CARRIER SCREENING IN GENETIC TESTING MARKET, BY TYPE, 2020-2029 (USD MILLION)
TABLE 338 INDONESIA EXPANDED CARRIER SCREENING IN GENETIC TESTING MARKET, BY TYPE, 2020-2029 (UNITS)
TABLE 339 INDONESIA EXPANDED CARRIER SCREENING IN GENETIC TESTING MARKET, BY TYPE, 2020-2029 (ASP)
TABLE 340 INDONESIA CARRIER TESTING IN GENETIC TESTING MARKET, BY MEDICAL CONDITION, 2020-2029 (USD MILLION)
TABLE 341 INDONESIA GENETIC TESTING MARKET, BY TECHNOLOGY, 2020-2029 (USD MILLION)
TABLE 342 INDONESIA POLYMERASE CHAIN REACTION IN GENETIC TESTING MARKET, BY TECHNOLOGY, 2020-2029 (USD MILLION)
TABLE 343 INDONESIA DNA SEQUENCING IN GENETIC TESTING MARKET, BY TECHNOLOGY, 2020-2029 (USD MILLION)
TABLE 344 INDONESIA MICROARRAYS IN GENETIC TESTING MARKET, BY TECHNOLOGY, 2020-2029 (USD MILLION)
TABLE 345 INDONESIA GENETIC TESTING MARKET, BY DISEASES, 2020-2029 (USD MILLION)
TABLE 346 INDONESIA RARE GENETIC DISORDER IN GENETIC TESTING MARKET, BY DISEASES, 2020-2029 (USD MILLION)
TABLE 347 INDONESIA CANCER IN GENETIC TESTING MARKET, BY DISEASES, 2020-2029 (USD MILLION)
TABLE 348 INDONESIA GENETIC TESTING MARKET, BY END USER, 2020-2029 (USD MILLION)
TABLE 349 PHILIPPINES GENETIC TESTING MARKET, BY TYPE, 2020-2029 (USD MILLION)
TABLE 350 PHILIPPINES GENETIC TESTING MARKET, BY TYPE, 2020-2029 (UNITS)
TABLE 351 PHILIPPINES GENETIC TESTING MARKET, BY TYPE, 2020-2029 (ASP)
TABLE 352 PHILIPPINES PRENATAL TESTING IN GENETIC TESTING MARKET, BY TYPE, 2020-2029 (USD MILLION)
TABLE 353 PHILIPPINES PRENATAL TESTING IN GENETIC TESTING MARKET, BY TYPE, 2020-2029 (UNITS)
TABLE 354 PHILIPPINES PRENATAL TESTING IN GENETIC TESTING MARKET, BY TYPE, 2020-2029 (ASP)
TABLE 355 PHILIPPINES NON-INVASIVE SCREENING IN GENETIC TESTING MARKET, BY SCREENING METHOD, 2020-2029 (USD MILLION)
TABLE 356 PHILIPPINES NON-INVASIVE SCREENING IN GENETIC TESTING MARKET, BY SCREENING METHOD, 2020-2029 (UNITS)
TABLE 357 PHILIPPINES NON-INVASIVE SCREENING IN GENETIC TESTING MARKET, BY SCREENING METHOD, 2020-2029 (ASP)
TABLE 358 PHILIPPINES NON-INVASIVE SCREENING IN GENETIC TESTING MARKET, BY CONDITION, 2020-2029 (USD MILLION)
TABLE 359 PHILIPPINES NON-INVASIVE SCREENING IN GENETIC TESTING MARKET, BY SCREENING TYPE, 2020-2029 (USD MILLION)
TABLE 360 PHILIPPINES NON-INVASIVE SCREENING IN GENETIC TESTING MARKET, BY SCREENING TYPE, 2020-2029 (UNITS)
TABLE 361 PHILIPPINES NON-INVASIVE SCREENING IN GENETIC TESTING MARKET, BY SCREENING TYPE, 2020-2029 (ASP)
TABLE 362 PHILIPPINES NEW-BORN SCREENING IN GENETIC TESTING MARKET, BY TYPE, 2020-2029 (USD MILLION)
TABLE 363 PHILIPPINES CARRIER TESTING IN GENETIC TESTING MARKET, BY TEST TYPE, 2020-2029 (USD MILLION)
TABLE 364 PHILIPPINES CARRIER TESTING IN GENETIC TESTING MARKET, BY TEST TYPE, 2020-2029 (UNITS)
TABLE 365 PHILIPPINES CARRIER TESTING IN GENETIC TESTING MARKET, BY TEST TYPE, 2020-2029 (ASP)
TABLE 366 PHILIPPINES CARRIER TESTING IN GENETIC TESTING MARKET, BY TYPE, 2020-2029 (USD MILLION)
TABLE 367 PHILIPPINES CARRIER TESTING IN GENETIC TESTING MARKET, BY TYPE, 2020-2029 (UNITS)
TABLE 368 PHILIPPINES CARRIER TESTING IN GENETIC TESTING MARKET, BY TYPE, 2020-2029 (ASP)
TABLE 369 PHILIPPINES EXPANDED CARRIER SCREENING IN GENETIC TESTING MARKET, BY TYPE, 2020-2029 (USD MILLION)
TABLE 370 PHILIPPINES EXPANDED CARRIER SCREENING IN GENETIC TESTING MARKET, BY TYPE, 2020-2029 (UNITS)
TABLE 371 PHILIPPINES EXPANDED CARRIER SCREENING IN GENETIC TESTING MARKET, BY TYPE, 2020-2029 (ASP)
TABLE 372 PHILIPPINES CARRIER TESTING IN GENETIC TESTING MARKET, BY MEDICAL CONDITION, 2020-2029 (USD MILLION)
TABLE 373 PHILIPPINES GENETIC TESTING MARKET, BY TECHNOLOGY, 2020-2029 (USD MILLION)
TABLE 374 PHILIPPINES POLYMERASE CHAIN REACTION IN GENETIC TESTING MARKET, BY TECHNOLOGY, 2020-2029 (USD MILLION)
TABLE 375 PHILIPPINES DNA SEQUENCING IN GENETIC TESTING MARKET, BY TECHNOLOGY, 2020-2029 (USD MILLION)
TABLE 376 PHILIPPINES MICROARRAYS IN GENETIC TESTING MARKET, BY TECHNOLOGY, 2020-2029 (USD MILLION)
TABLE 377 PHILIPPINES GENETIC TESTING MARKET, BY DISEASES, 2020-2029 (USD MILLION)
TABLE 378 PHILIPPINES RARE GENETIC DISORDER IN GENETIC TESTING MARKET, BY DISEASES, 2020-2029 (USD MILLION)
TABLE 379 PHILIPPINES CANCER IN GENETIC TESTING MARKET, BY DISEASES, 2020-2029 (USD MILLION)
TABLE 380 PHILIPPINES GENETIC TESTING MARKET, BY END USER, 2020-2029 (USD MILLION)
TABLE 381 MALAYSIA GENETIC TESTING MARKET, BY TYPE, 2020-2029 (USD MILLION)
TABLE 382 MALAYSIA GENETIC TESTING MARKET, BY TYPE, 2020-2029 (UNITS)
TABLE 383 MALAYSIA GENETIC TESTING MARKET, BY TYPE, 2020-2029 (ASP)
TABLE 384 MALAYSIA PRENATAL TESTING IN GENETIC TESTING MARKET, BY TYPE, 2020-2029 (USD MILLION)
TABLE 385 MALAYSIA PRENATAL TESTING IN GENETIC TESTING MARKET, BY TYPE, 2020-2029 (UNITS)
TABLE 386 MALAYSIA PRENATAL TESTING IN GENETIC TESTING MARKET, BY TYPE, 2020-2029 (ASP)
TABLE 387 MALAYSIA NON-INVASIVE SCREENING IN GENETIC TESTING MARKET, BY SCREENING METHOD, 2020-2029 (USD MILLION)
TABLE 388 MALAYSIA NON-INVASIVE SCREENING IN GENETIC TESTING MARKET, BY SCREENING METHOD, 2020-2029 (UNITS)
TABLE 389 MALAYSIA NON-INVASIVE SCREENING IN GENETIC TESTING MARKET, BY SCREENING METHOD, 2020-2029 (ASP)
TABLE 390 MALAYSIA NON-INVASIVE SCREENING IN GENETIC TESTING MARKET, BY CONDITION, 2020-2029 (USD MILLION)
TABLE 391 MALAYSIA NON-INVASIVE SCREENING IN GENETIC TESTING MARKET, BY SCREENING TYPE, 2020-2029 (USD MILLION)
TABLE 392 MALAYSIA NON-INVASIVE SCREENING IN GENETIC TESTING MARKET, BY SCREENING TYPE, 2020-2029 (UNITS)
TABLE 393 MALAYSIA NON-INVASIVE SCREENING IN GENETIC TESTING MARKET, BY SCREENING TYPE, 2020-2029 (ASP)
TABLE 394 MALAYSIA NEW-BORN SCREENING IN GENETIC TESTING MARKET, BY TYPE, 2020-2029 (USD MILLION)
TABLE 395 MALAYSIA CARRIER TESTING IN GENETIC TESTING MARKET, BY TEST TYPE, 2020-2029 (USD MILLION)
TABLE 396 MALAYSIA CARRIER TESTING IN GENETIC TESTING MARKET, BY TEST TYPE, 2020-2029 (UNITS)
TABLE 397 MALAYSIA CARRIER TESTING IN GENETIC TESTING MARKET, BY TEST TYPE, 2020-2029 (ASP)
TABLE 398 MALAYSIA CARRIER TESTING IN GENETIC TESTING MARKET, BY TYPE, 2020-2029 (USD MILLION)
TABLE 399 MALAYSIA CARRIER TESTING IN GENETIC TESTING MARKET, BY TYPE, 2020-2029 (UNITS)
TABLE 400 MALAYSIA CARRIER TESTING IN GENETIC TESTING MARKET, BY TYPE, 2020-2029 (ASP)
TABLE 401 MALAYSIA EXPANDED CARRIER SCREENING IN GENETIC TESTING MARKET, BY TYPE, 2020-2029 (USD MILLION)
TABLE 402 MALAYSIA EXPANDED CARRIER SCREENING IN GENETIC TESTING MARKET, BY TYPE, 2020-2029 (UNITS)
TABLE 403 MALAYSIA EXPANDED CARRIER SCREENING IN GENETIC TESTING MARKET, BY TYPE, 2020-2029 (ASP)
TABLE 404 MALAYSIA CARRIER TESTING IN GENETIC TESTING MARKET, BY MEDICAL CONDITION, 2020-2029 (USD MILLION)
TABLE 405 MALAYSIA GENETIC TESTING MARKET, BY TECHNOLOGY, 2020-2029 (USD MILLION)
TABLE 406 MALAYSIA POLYMERASE CHAIN REACTION IN GENETIC TESTING MARKET, BY TECHNOLOGY, 2020-2029 (USD MILLION)
TABLE 407 MALAYSIA DNA SEQUENCING IN GENETIC TESTING MARKET, BY TECHNOLOGY, 2020-2029 (USD MILLION)
TABLE 408 MALAYSIA MICROARRAYS IN GENETIC TESTING MARKET, BY TECHNOLOGY, 2020-2029 (USD MILLION)
TABLE 409 MALAYSIA GENETIC TESTING MARKET, BY DISEASES, 2020-2029 (USD MILLION)
TABLE 410 MALAYSIA RARE GENETIC DISORDER IN GENETIC TESTING MARKET, BY DISEASES, 2020-2029 (USD MILLION)
TABLE 411 MALAYSIA CANCER IN GENETIC TESTING MARKET, BY DISEASES, 2020-2029 (USD MILLION)
TABLE 412 MALAYSIA GENETIC TESTING MARKET, BY END USER, 2020-2029 (USD MILLION)
TABLE 413 VIETNAM GENETIC TESTING MARKET, BY TYPE, 2020-2029 (USD MILLION)
TABLE 414 VIETNAM GENETIC TESTING MARKET, BY TYPE, 2020-2029 (UNITS)
TABLE 415 VIETNAM GENETIC TESTING MARKET, BY TYPE, 2020-2029 (ASP)
TABLE 416 VIETNAM PRENATAL TESTING IN GENETIC TESTING MARKET, BY TYPE, 2020-2029 (USD MILLION)
TABLE 417 VIETNAM PRENATAL TESTING IN GENETIC TESTING MARKET, BY TYPE, 2020-2029 (UNITS)
TABLE 418 VIETNAM PRENATAL TESTING IN GENETIC TESTING MARKET, BY TYPE, 2020-2029 (ASP)
TABLE 419 VIETNAM NON-INVASIVE SCREENING IN GENETIC TESTING MARKET, BY SCREENING METHOD, 2020-2029 (USD MILLION)
TABLE 420 VIETNAM NON-INVASIVE SCREENING IN GENETIC TESTING MARKET, BY SCREENING METHOD, 2020-2029 (UNITS)
TABLE 421 VIETNAM NON-INVASIVE SCREENING IN GENETIC TESTING MARKET, BY SCREENING METHOD, 2020-2029 (ASP)
TABLE 422 VIETNAM NON-INVASIVE SCREENING IN GENETIC TESTING MARKET, BY CONDITION, 2020-2029 (USD MILLION)
TABLE 423 VIETNAM NON-INVASIVE SCREENING IN GENETIC TESTING MARKET, BY SCREENING TYPE, 2020-2029 (USD MILLION)
TABLE 424 VIETNAM NON-INVASIVE SCREENING IN GENETIC TESTING MARKET, BY SCREENING TYPE, 2020-2029 (UNITS)
TABLE 425 VIETNAM NON-INVASIVE SCREENING IN GENETIC TESTING MARKET, BY SCREENING TYPE, 2020-2029 (ASP)
TABLE 426 VIETNAM NEW-BORN SCREENING IN GENETIC TESTING MARKET, BY TYPE, 2020-2029 (USD MILLION)
TABLE 427 VIETNAM CARRIER TESTING IN GENETIC TESTING MARKET, BY TEST TYPE, 2020-2029 (USD MILLION)
TABLE 428 VIETNAM CARRIER TESTING IN GENETIC TESTING MARKET, BY TEST TYPE, 2020-2029 (UNITS)
TABLE 429 VIETNAM CARRIER TESTING IN GENETIC TESTING MARKET, BY TEST TYPE, 2020-2029 (ASP)
TABLE 430 VIETNAM CARRIER TESTING IN GENETIC TESTING MARKET, BY TYPE, 2020-2029 (USD MILLION)
TABLE 431 VIETNAM CARRIER TESTING IN GENETIC TESTING MARKET, BY TYPE, 2020-2029 (UNITS)
TABLE 432 VIETNAM CARRIER TESTING IN GENETIC TESTING MARKET, BY TYPE, 2020-2029 (ASP)
TABLE 433 VIETNAM EXPANDED CARRIER SCREENING IN GENETIC TESTING MARKET, BY TYPE, 2020-2029 (USD MILLION)
TABLE 434 VIETNAM EXPANDED CARRIER SCREENING IN GENETIC TESTING MARKET, BY TYPE, 2020-2029 (UNITS)
TABLE 435 VIETNAM EXPANDED CARRIER SCREENING IN GENETIC TESTING MARKET, BY TYPE, 2020-2029 (ASP)
TABLE 436 VIETNAM CARRIER TESTING IN GENETIC TESTING MARKET, BY MEDICAL CONDITION, 2020-2029 (USD MILLION)
TABLE 437 VIETNAM GENETIC TESTING MARKET, BY TECHNOLOGY, 2020-2029 (USD MILLION)
TABLE 438 VIETNAM POLYMERASE CHAIN REACTION IN GENETIC TESTING MARKET, BY TECHNOLOGY, 2020-2029 (USD MILLION)
TABLE 439 VIETNAM DNA SEQUENCING IN GENETIC TESTING MARKET, BY TECHNOLOGY, 2020-2029 (USD MILLION)
TABLE 440 VIETNAM MICROARRAYS IN GENETIC TESTING MARKET, BY TECHNOLOGY, 2020-2029 (USD MILLION)
TABLE 441 VIETNAM GENETIC TESTING MARKET, BY DISEASES, 2020-2029 (USD MILLION)
TABLE 442 VIETNAM RARE GENETIC DISORDER IN GENETIC TESTING MARKET, BY DISEASES, 2020-2029 (USD MILLION)
TABLE 443 VIETNAM CANCER IN GENETIC TESTING MARKET, BY DISEASES, 2020-2029 (USD MILLION)
TABLE 444 VIETNAM GENETIC TESTING MARKET, BY END USER, 2020-2029 (USD MILLION)
TABLE 445 REST OF ASIA-PACIFIC GENETIC TESTING MARKET, BY TYPE, 2020-2029 (USD MILLION)
TABLE 446 REST OF ASIA-PACIFIC GENETIC TESTING MARKET, BY TYPE, 2020-2029 (UNITS)
TABLE 447 REST OF ASIA-PACIFIC GENETIC TESTING MARKET, BY TYPE, 2020-2029 (ASP)
Lista de figuras
FIGURE 1 ASIA PACIFIC GENETIC TESTING MARKET: SEGMENTATION
FIGURE 2 ASIA PACIFIC GENETIC TESTING MARKET: DATA TRIANGULATION
FIGURE 3 ASIA PACIFIC GENETIC TESTING MARKET: DROC ANALYSIS
FIGURE 4 ASIA PACIFIC GENETIC TESTING MARKET: ASIA PACIFIC VS REGIONAL MARKET ANALYSIS
FIGURE 5 ASIA PACIFIC GENETIC TESTING MARKET: COMPANY RESEARCH ANALYSIS
FIGURE 6 ASIA PACIFIC GENETIC TESTING MARKET: INTERVIEW DEMOGRAPHICS
FIGURE 7 ASIA PACIFIC GENETIC TESTING MARKET: DBMR MARKET POSITION GRID
FIGURE 8 ASIA PACIFIC GENETIC TESTING MARKET: APPLICATION COVERAGE GRID
FIGURE 9 ASIA PACIFIC GENETIC TESTING MARKET: VENDOR SHARE ANALYSIS
FIGURE 10 ASIA PACIFIC GENETIC TESTING MARKET: SEGMENTATION
FIGURE 11 INCREASING PREVALENCE OF LYMPHEDEMA AND RISING HEALTHCARE EXPENDITURE ARE EXPECTED TO DRIVE THE ASIA PACIFIC GENETIC TESTING MARKET IN THE FORECAST PERIOD OF 2022 TO 2029
FIGURE 12 DIAGNOSTIC TESTING SEGMENT IS EXPECTED TO ACCOUNT FOR THE LARGEST SHARE OF THE ASIA PACIFIC GENETIC TESTING MARKET IN 2022 & 2029
FIGURE 13 NORTH AMERICA IS EXPECTED TO DOMINATE THE ASIA PACIFIC GENETIC TESTING MARKET AND ASIA-PACIFIC EXPECTED TO GROW WITH THE HIGHEST CAGR IN THE FORECAST PERIOD OF 2022 TO 2029
FIGURE 14 DRIVERS, RESTRAINTS, OPPORTUNITIES, AND CHALLENGES OF ASIA PACIFIC GENETIC TESTING MARKET
FIGURE 15 ASIA PACIFIC GENETIC TESTING MARKET: BY TYPE, 2021
FIGURE 16 ASIA PACIFIC GENETIC TESTING MARKET: BY TYPE, 2022-2029 (USD MILLION)
FIGURE 17 ASIA PACIFIC GENETIC TESTING MARKET: BY TYPE, CAGR (2022-2029)
FIGURE 18 ASIA PACIFIC GENETIC TESTING MARKET: BY TYPE, LIFELINE CURVE
FIGURE 19 ASIA PACIFIC GENETIC TESTING MARKET: BY TECHNOLOGY, 2021
FIGURE 20 ASIA PACIFIC GENETIC TESTING MARKET: BY TECHNOLOGY, 2022-2029 (USD MILLION)
FIGURE 21 ASIA PACIFIC GENETIC TESTING MARKET: BY TECHNOLOGY, CAGR (2022-2029)
FIGURE 22 ASIA PACIFIC GENETIC TESTING MARKET: BY TECHNOLOGY, LIFELINE CURVE
FIGURE 23 ASIA PACIFIC GENETIC TESTING MARKET: BY DISEASES, 2021
FIGURE 24 ASIA PACIFIC GENETIC TESTING MARKET: BY DISEASES, 2022-2029 (USD MILLION)
FIGURE 25 ASIA PACIFIC GENETIC TESTING MARKET: BY DISEASES, CAGR (2022-2029)
FIGURE 26 ASIA PACIFIC GENETIC TESTING MARKET: BY DISEASES, LIFELINE CURVE
FIGURE 27 ASIA PACIFIC GENETIC TESTING MARKET: BY END USER, 2021
FIGURE 28 ASIA PACIFIC GENETIC TESTING MARKET: BY END USER, 2022-2029 (USD MILLION)
FIGURE 29 ASIA PACIFIC GENETIC TESTING MARKET: BY END USER, CAGR (2022-2029)
FIGURE 30 ASIA PACIFIC GENETIC TESTING MARKET: BY END USER, LIFELINE CURVE
FIGURE 31 ASIA-PACIFIC GENETIC TESTING MARKET: SNAPSHOT (2021)
FIGURE 32 ASIA-PACIFIC GENETIC TESTING MARKET: BY COUNTRY (2021)
FIGURE 33 ASIA-PACIFIC GENETIC TESTING MARKET: BY COUNTRY (2022 & 2029)
FIGURE 34 ASIA-PACIFIC GENETIC TESTING MARKET: BY COUNTRY (2021 & 2029)
FIGURE 35 ASIA-PACIFIC GENETIC TESTING MARKET: BY TYPE (2022-2029)
FIGURE 36 ASIA PACIFIC GENETIC TESTING MARKET: COMPANY SHARE 2021 (%)
Metodología de investigación
La recopilación de datos y el análisis del año base se realizan utilizando módulos de recopilación de datos con muestras de gran tamaño. La etapa incluye la obtención de información de mercado o datos relacionados a través de varias fuentes y estrategias. Incluye el examen y la planificación de todos los datos adquiridos del pasado con antelación. Asimismo, abarca el examen de las inconsistencias de información observadas en diferentes fuentes de información. Los datos de mercado se analizan y estiman utilizando modelos estadísticos y coherentes de mercado. Además, el análisis de la participación de mercado y el análisis de tendencias clave son los principales factores de éxito en el informe de mercado. Para obtener más información, solicite una llamada de un analista o envíe su consulta.
La metodología de investigación clave utilizada por el equipo de investigación de DBMR es la triangulación de datos, que implica la extracción de datos, el análisis del impacto de las variables de datos en el mercado y la validación primaria (experto en la industria). Los modelos de datos incluyen cuadrícula de posicionamiento de proveedores, análisis de línea de tiempo de mercado, descripción general y guía del mercado, cuadrícula de posicionamiento de la empresa, análisis de patentes, análisis de precios, análisis de participación de mercado de la empresa, estándares de medición, análisis global versus regional y de participación de proveedores. Para obtener más información sobre la metodología de investigación, envíe una consulta para hablar con nuestros expertos de la industria.
Personalización disponible
Data Bridge Market Research es líder en investigación formativa avanzada. Nos enorgullecemos de brindar servicios a nuestros clientes existentes y nuevos con datos y análisis que coinciden y se adaptan a sus objetivos. El informe se puede personalizar para incluir análisis de tendencias de precios de marcas objetivo, comprensión del mercado de países adicionales (solicite la lista de países), datos de resultados de ensayos clínicos, revisión de literatura, análisis de mercado renovado y base de productos. El análisis de mercado de competidores objetivo se puede analizar desde análisis basados en tecnología hasta estrategias de cartera de mercado. Podemos agregar tantos competidores sobre los que necesite datos en el formato y estilo de datos que esté buscando. Nuestro equipo de analistas también puede proporcionarle datos en archivos de Excel sin procesar, tablas dinámicas (libro de datos) o puede ayudarlo a crear presentaciones a partir de los conjuntos de datos disponibles en el informe.

