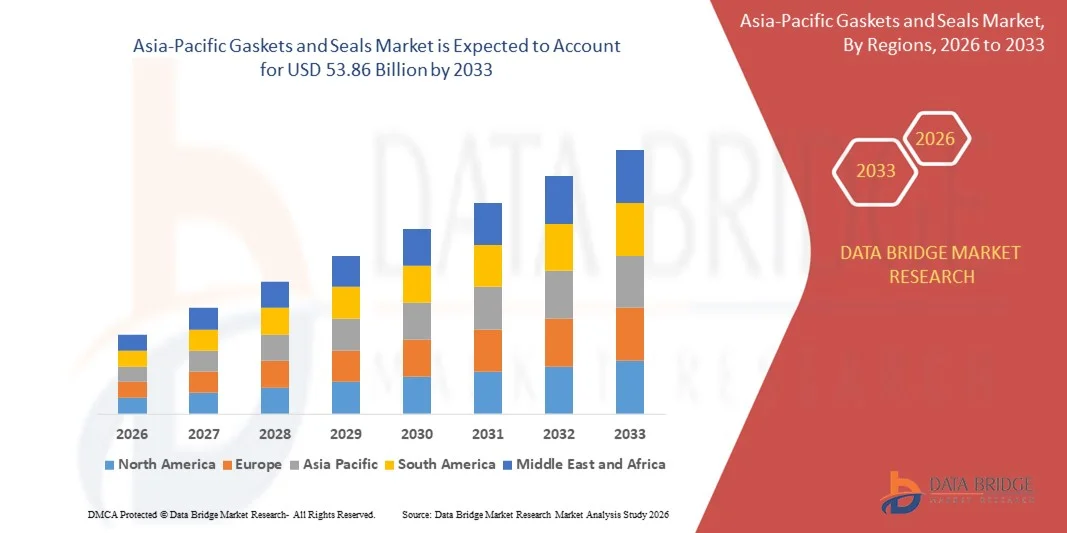
Image

Mercado de juntas y sellos de Asia y el Pacífico: tendencias de la industria y pronóstico para 2028

Químicos y Materiales

Image

Mercado de juntas y sellos de Asia y el Pacífico: tendencias de la industria y pronóstico para 2028

  • Químicos y Materiales
  • Informe publicado
  • marzo de 2021
  • Asia-Pacífico
  • 350 páginas
  • Número de mesas: 406
  • Número de figuras: 26

Mercado de juntas y sellos de Asia y el Pacífico, por tipo (juntas y sellos), aplicación (intercambiadores de calor, recipientes a presión, tapas de registro, pozos de registro, bonetes de válvulas, bridas de tuberías y otros), canal de distribución (OEM y posventa), industria (papel y Industria de celulosa, petróleo y gas, electricidad, automoción, aeroespacial, fabricación industrial, marina y ferroviaria y otros), país (Japón, China, Corea del Sur, India, Australia y Nueva Zelanda, Taiwán, Hong Kong, Singapur, Tailandia, Malasia , Indonesia, Filipinas y el resto de Asia-Pacífico) Tendencias de la industria y pronóstico hasta 2028

Asia-Pacific Gaskets and Seals MarketAnálisis e información del mercado: mercado de juntas y sellos de Asia y el Pacífico

Se espera que el mercado de juntas y sellos gane crecimiento en el período de pronóstico de 2021 a 2028. Data Bridge Market Research analiza que el mercado está creciendo con una CAGR del 6,4% en el período de pronóstico de 2021 a 2028 y se espera que alcance los USD 39.503,33 millones al 2028. Las crecientes ventajas de los sellos y juntas y la introducción de más vehículos electrónicos que aumentarán la demanda del producto juntas y sellos ayudarán a impulsar el mercado de juntas y sellos.

Las juntas sellan una conexión entre dos componentes y se utiliza para llenar los espacios vacíos entre dos superficies, lo que ayuda a evitar fugas y desperdicio de fluidos y gases en la aplicación. Los productos de juntas se utilizan principalmente como sellos estáticos. Los productos de sellos se utilizan entre piezas del motor, bombas y ejes que giran en lugar de aquellos que son estáticos. Las juntas y sellos están especialmente diseñados dependiendo del tipo de equipo y superficie de uso final.

El aumento de los equipos giratorios y de bombeo en la industria manufacturera aumentará la demanda de productos de juntas y sellos, lo que ayudará a impulsar el mercado de juntas y sellos. El creciente desperdicio de materia prima durante la producción de los diferentes tipos de productos de juntas y sellos frena el crecimiento del mercado de juntas y sellos en el período de pronóstico. La creciente innovación en la tecnología para el control de la calidad de juntas y productos de sellado será una oportunidad para el mercado de juntas y sellos. Debido a los crecientes cambios en los motores de automóviles, los fabricantes enfrentan muchas dificultades para pronosticar la demanda de productos particulares, lo que constituye el desafío para el mercado de juntas y sellos en el período de pronóstico.

Este informe de mercado de Juntas y sellos proporciona detalles de la participación de mercado, los nuevos desarrollos y el análisis de la cartera de productos, el impacto de los actores del mercado nacional y localizado, analiza las oportunidades en términos de bolsillos de ingresos emergentes, cambios en las regulaciones del mercado, aprobaciones de productos, decisiones estratégicas, lanzamientos de productos. , expansiones geográficas e innovaciones tecnológicas en el mercado. Para comprender el análisis y el escenario del mercado de juntas y sellos, comuníquese con Data Bridge Market Research para obtener un resumen del analista; nuestro equipo lo ayudará a crear una solución de impacto en los ingresos para lograr el objetivo deseado.

Asia-Pacific Gaskets and Seals MarketÁmbito de Mercado y Tamaño del mercado de Juntas y sellos de Asia y el Pacífico

El mercado de juntas y sellos se divide en cuatro segmentos notables que se basan en el tipo, la aplicación, el canal de distribución y la industria. El crecimiento entre segmentos le ayuda a analizar nichos de crecimiento y estrategias para acercarse al mercado y determinar sus áreas de aplicación principales y la diferencia en sus mercados objetivo.

  • Según el tipo, el mercado de juntas y sellos se segmenta en juntas y sellos. En 2021, el segmento de sellos dominará el mercado, ya que los productos de sellos son un componente que ahorra costos en el motor, lo que aumenta su demanda.
  • Según la aplicación, el mercado de juntas y sellos se segmenta en intercambiadores de calor, recipientes a presión, tapas de registro, pozos de registro, bonetes de válvulas, bridas de tuberías y otros. En 2021, el segmento de los intercambiadores de calor domina, ya que los intercambiadores de calor ayudan a mantener la presión del motor, lo que hace que los intercambiadores de calor dominen el mercado.
  • Según el canal de distribución, el mercado de juntas y sellos se segmenta en OEM y mercado de accesorios. En 2021, el segmento de OEM domina el mercado, ya que los OEM se dedican a la fabricación a granel de juntas y sellos, lo que hace que el segmento de OEM domine en la región.
  • Sobre la base de la industria, el mercado de juntas y sellos se segmenta en la industria del papel y la pulpa, petróleo y gas, eléctricos, automotrices, aeroespaciales, industriales, marítimos y ferroviarios y otros. En 2021, el segmento automotriz domina el mercado ya que en el motor se utilizan varios tipos de fluidos y lubricantes, lo que aumenta la demanda de sellos en la industria automotriz.

Juntas y sellos mercado Análisis a nivel de país

Se analiza el mercado de juntas y sellos de Asia y el Pacífico y se proporciona información sobre el tamaño del mercado según el país, el tipo, la aplicación, el canal de distribución y la industria como se menciona anteriormente.

Los países cubiertos en el informe del mercado de juntas y sellos de Asia y el Pacífico son Japón, China, Corea del Sur, India, Singapur, Tailandia, Indonesia, Malasia, Filipinas, Australia y Nueva Zelanda, Hong Kong, Taiwán y el resto de Asia y el Pacífico.

En el mercado de juntas y sellos de Asia y el Pacífico, China domina el mercado debido a la gran demanda de accesorios para automóviles en el país.

La sección de países del informe también proporciona factores que impactan el mercado individual y cambios en la regulación en el mercado a nivel nacional que impactan las tendencias actuales y futuras del mercado. Datos como ventas nuevas, ventas de reemplazo, demografía de los países, leyes regulatorias y aranceles de importación y exportación son algunos de los principales indicadores utilizados para pronosticar el escenario del mercado para cada país. Además, se consideran la presencia y disponibilidad de las marcas y los desafíos que enfrentan debido a la competencia grande o escasa de las marcas locales y nacionales, y el impacto de los canales de ventas, al tiempo que se proporciona un análisis de pronóstico de los datos del país.

Crecimientos en la industria de juntas y sellos

El mercado de juntas y sellos de Asia-Pacífico también le proporciona un análisis de mercado detallado para cada país, crecimiento en la base instalada de diferentes tipos de productos para el mercado de juntas y sellos, impacto de la tecnología que utiliza curvas de línea de vida y cambios en los escenarios regulatorios del mercado de juntas y sellos y sus Impacto en el mercado de juntas y sellos. Los datos están disponibles para el período histórico 2010 a 2019.

Panorama competitivo y cuota de mercado Análisis Juntas y sellos

El panorama competitivo del mercado de juntas y sellos proporciona detalles por competidor. Los detalles incluidos son descripción general de la empresa, finanzas de la empresa, ingresos generados, potencial de mercado, inversión en investigación y desarrollo, nuevas iniciativas de mercado, presencia global, sitios e instalaciones de producción, fortalezas y debilidades de la empresa, lanzamiento de productos, proyectos de pruebas de productos, aprobaciones de productos, patentes, ancho y amplitud del producto, dominio de la aplicación, curva de línea de vida de la tecnología. Los puntos de datos anteriores proporcionados sólo están relacionados con el enfoque de las empresas en el mercado de juntas y sellos.

Los principales actores cubiertos en el informe son SKF, Flowserve Corporation, John Crane (una subsidiaria de Smiths Group plc), BRUSS Sealing Systems GmbH, Trelleborg AB, ElringKlinger AG, Cooper Standard, GARLOCK FAMILY OF COMPANIES (una subsidiaria de EnPro Industries), Dätwyler Holding Inc., WL Gore & Associates, Inc e IDT otros actores nacionales y globales. Los analistas de DBMR comprenden las fortalezas competitivas y brindan análisis competitivos para cada competidor por separado.

Muchos desarrollos de productos también son iniciados por empresas de todo el mundo que también están acelerando el crecimiento del mercado de juntas y sellos.

Por ejemplo,

  • En julio de 2020, la empresa John Crane decidió introducir un nuevo refuerzo de gas de sellado de alta presión diseñado para utilizarse en los sellos de gas seco de los turbocompresores. Este desarrollo ayuda a la empresa a aumentar los ingresos.

Las asociaciones, empresas conjuntas y otras estrategias mejoran la participación de mercado de la empresa con una mayor cobertura y presencia. También brinda el beneficio a la organización de mejorar su oferta de juntas y sellos a través de una gama ampliada de tamaños.


SKU-

LISTA DE TABLAS

TABLA 1 DATOS DE IMPORTACIÓN DE JUNTAS, ARANDELAS Y OTROS SELLOS DE CAUCHO VULCANIZADO (EXCEPTO LOS DE CAUCHO DURO Y LOS DE CAUCHO CELULAR); CÓDIGO HS - 401693 (MILES DE USD)

CUADRO 2 DATOS DE EXPORTACIÓN DE JUNTAS, ARANDELAS Y OTROS SELLOS DE CAUCHO VULCANIZADO (EXCEPTO LOS DE CAUCHO DURO Y LOS DE CAUCHO CELULAR); CÓDIGO SA - 401693 (MILES DE USD)

TABLA 3 ANUNCIO DE NUEVO MODELO DE COCHES ELÉCTRICOS

TABLA 4 MERCADO DE JUNTAS Y SELLOS DE ASIA-PACÍFICO, POR TIPO, 2019-2028 (MILLONES DE USD)

TABLA 5 MERCADO DE JUNTAS Y SELLOS DE ASIA-PACÍFICO, POR TIPO, 2019-2028 (MILLONES DE UNIDADES)

TABLA 6 SELLOS EN EL MERCADO DE JUNTAS Y SELLOS DE ASIA-PACÍFICO, POR REGIÓN, 2019-2028 (MILLONES DE USD)

TABLA 7 SELLOS EN EL MERCADO DE JUNTAS Y SELLOS DE ASIA-PACÍFICO, POR REGIÓN, 2019-2028 (MILLONES DE UNIDADES)

TABLA 8 MERCADO DE JUNTAS Y SELLOS DE ASIA-PACÍFICO, SELLOS, POR FORMATO, 2019-2028 (MILLONES DE USD)

TABLA 9 MERCADO DE JUNTAS Y SELLOS DE ASIA-PACÍFICO, SELLOS, POR TIPO, 2019-2028 (MILLONES DE USD)

TABLA 10 MERCADO DE JUNTAS Y SELLOS DE ASIA-PACÍFICO, POR REGIÓN, 2019-2028 (MILLONES DE USD)

TABLA 11 ASIA-PACÍFICO JUNTAS EN EL MERCADO DE JUNTAS Y SELLOS, POR REGIÓN, 2019-2028 (MILLONES DE UNIDADES)

TABLA 12 MERCADO DE JUNTAS Y SELLOS DE ASIA-PACÍFICO, JUNTAS, POR TIPO, 2019-2028 (MILLONES DE USD)

TABLA 13 MERCADO DE JUNTAS Y SELLOS DE ASIA-PACÍFICO, METÁLICOS, POR MATERIALES, 2019-2028 (MILLONES DE USD)

TABLA 14 MERCADO DE JUNTAS Y SELLOS DE ASIA-PACÍFICO, NO METÁLICOS, POR MATERIALES, 2019-2028 (MILLONES DE USD)

TABLA 15 MERCADO DE JUNTAS Y SELLOS DE ASIA Y EL PACÍFICO, COMPUESTOS, POR MATERIALES, 2019-2028 (MILLONES DE USD)

TABLA 16 MERCADO DE JUNTAS Y SELLOS DE ASIA-PACÍFICO, JUNTAS, POR PRODUCTO, 2019-2028 (MILLONES DE USD)

TABLA 17 MERCADO DE JUNTAS Y SELLOS DE ASIA-PACÍFICO, JUNTAS DE LÁMINA, POR TIPO, 2019-2028 (MILLONES DE USD)

TABLA 18 MERCADO DE JUNTAS Y SELLOS DE ASIA Y EL PACÍFICO, JUNTA ENVESTIMADA, POR TIPO, 2019-2028 (MILLONES DE USD)

TABLA 19 MERCADO DE JUNTAS Y SELLOS DE ASIA-PACÍFICO, JUNTAS, POR SUPERFICIES PLANAS, 2019-2028 (MILLONES DE USD)

TABLA 20 MERCADO DE JUNTAS Y SELLOS DE ASIA-PACÍFICO, BRIDA, POR TIPO, 2019-2028 (MILLONES DE USD)

TABLA 21 MERCADO DE JUNTAS Y SELLOS DE ASIA-PACÍFICO, JUNTAS, POR FORMATO, 2019-2028 (MILLONES DE USD)

TABLA 22 MERCADO DE JUNTAS Y SELLOS DE ASIA-PACÍFICO, JUNTAS, POR ESPESOR, 2019-2028 (MILLONES DE USD)

TABLA 23 MERCADO DE JUNTAS Y SELLOS DE ASIA-PACÍFICO, POR APLICACIÓN, 2019-2028 (MILLONES DE USD)

TABLA 24 MERCADO DE INTERCAMBIADORES DE CALOR EN JUNTAS Y SELLOS DE ASIA-PACÍFICO, POR REGIÓN, 2019-2028 (MILLONES DE USD)

TABLA 25 MERCADO DE RECIPIENTES A PRESIÓN EN JUNTAS Y SELLOS DE ASIA-PACÍFICO, POR REGIÓN, 2019-2028 (MILLONES DE USD)

TABLA 26 MERCADO DE BRIDAS DE TUBERÍAS EN JUNTAS Y SELLOS DE ASIA Y EL PACÍFICO, POR REGIÓN, 2019-2028 (MILLONES DE USD)

TABLA 27 MERCADO DE BOTONES DE VÁLVULA EN JUNTAS Y SELLOS DE ASIA Y EL PACÍFICO, POR REGIÓN, 2019-2028 (MILLONES DE USD)

TABLA 28 MERCADO DE JUNTAS Y SELLOS DE ASIA Y PACÍFICO, POR REGIÓN, 2019-2028 (MILLONES DE USD)

TABLA 29 MERCADO DE TAPAS DE REGALO EN JUNTAS Y SELLOS DE ASIA Y EL PACÍFICO, POR REGIÓN, 2019-2028 (MILLONES DE USD)

TABLA 30 ASIA-PACÍFICO OTROS EN EL MERCADO DE JUNTAS Y SELLOS, POR REGIÓN, 2019-2028 (MILLONES DE USD)

TABLA 31 MERCADO DE JUNTAS Y SELLOS DE ASIA-PACÍFICO, POR CANAL DE DISTRIBUCIÓN, 2019-2028 (MILLONES DE USD)

TABLA 32 OEM DE ASIA Y EL PACÍFICO EN EL MERCADO DE JUNTAS Y SELLOS, POR REGIÓN, 2019-2028 (MILLONES DE USD)

TABLA 33 MERCADO DE POSTVENTA DE ASIA Y PACÍFICO EN JUNTAS Y SELLOS, POR REGIÓN, 2019-2028 (MILLONES DE USD)

TABLA 34 MERCADO DE JUNTAS Y SELLOS DE ASIA Y EL PACÍFICO, POR INDUSTRIA, 2019-2028 (MILLONES DE USD)

TABLA 35 MERCADO AUTOMOTRIZ EN JUNTAS Y SELLOS DE ASIA Y EL PACÍFICO, POR REGIÓN, 2019-2028 (MILLONES DE USD)

TABLA 36 MERCADO DE JUNTAS Y SELLOS DE ASIA-PACÍFICO, AUTOMOCIÓN, POR APLICACIÓN, 2019-2028 (MILLONES DE USD)

TABLA 37 MERCADO DE JUNTAS Y SELLOS DE ASIA-PACÍFICO, AUTOMOTRIZ, POR TIPO, 2019-2028 (MILLONES DE USD)

TABLA 38 MERCADO DE JUNTAS Y SELLOS MARINOS Y FERROVIARIOS DE ASIA Y EL PACÍFICO, POR REGIÓN, 2019-2028 (MILLONES DE USD)

TABLA 39 MERCADO DE JUNTAS Y SELLOS DE ASIA-PACÍFICO, MARINO Y FERROVIARIO, POR TIPO, 2019-2028 (MILLONES DE USD)

TABLA 40 MERCADO AEROESPACIAL DE JUNTAS Y SELLOS DE ASIA Y EL PACÍFICO, POR REGIÓN, 2019-2028 (MILLONES DE USD)

TABLA 41 MERCADO DE JUNTAS Y SELLOS DE ASIA Y EL PACÍFICO, AEROESPACIAL, POR TIPO, 2019-2028 (MILLONES DE USD)

TABLA 42 MERCADO DE PETRÓLEO Y GAS EN JUNTAS Y SELLOS DE ASIA Y PACÍFICO, POR REGIÓN, 2019-2028 (MILLONES DE USD)

TABLA 43 MERCADO DE JUNTAS Y SELLOS DE ASIA-PACÍFICO, PETRÓLEO Y GAS, POR TIPO, 2019-2028 (MILLONES DE USD)

TABLA 44 FABRICACIÓN INDUSTRIAL DE ASIA Y PACÍFICO EN EL MERCADO DE JUNTAS Y SELLOS, POR REGIÓN, 2019-2028 (MILLONES DE USD)

TABLA 45 MERCADO DE JUNTAS Y SELLOS DE ASIA-PACÍFICO, FABRICACIÓN INDUSTRIAL, POR TIPO, 2019-2028 (MILLONES DE USD)

TABLA 46 MERCADO DE JUNTAS Y SELLOS ELÉCTRICOS DE ASIA Y EL PACÍFICO, POR REGIÓN, 2019-2028 (MILLONES DE USD)

TABLA 47 MERCADO DE JUNTAS Y SELLOS DE ASIA-PACÍFICO, ELÉCTRICOS, POR TIPO, 2019-2028 (MILLONES DE USD)

TABLA 48 INDUSTRIA DE PAPEL Y PULPA DE ASIA Y EL PACÍFICO EN EL MERCADO DE JUNTAS Y SELLOS, POR REGIÓN, 2019-2028 (MILLONES DE USD)

TABLA 49 MERCADO DE JUNTAS Y SELLOS DE ASIA Y EL PACÍFICO, PAPEL Y PULPA, POR TIPO, 2019-2028 (MILLONES DE USD)

TABLA 50 ASIA-PACÍFICO OTROS EN EL MERCADO DE JUNTAS Y SELLOS, POR REGIÓN, 2019-2028 (MILLONES DE USD)

TABLA 51 MERCADO DE JUNTAS Y SELLOS DE ASIA-PACÍFICO, OTROS, POR TIPO, 2019-2028 (MILLONES DE USD)

TABLA 52 MERCADO DE JUNTAS Y SELLOS DE ASIA-PACÍFICO, POR PAÍS, 2019-2028 (MILLONES DE USD)

TABLA 53 MERCADO DE JUNTAS Y SELLOS DE ASIA-PACÍFICO, POR PAÍS, 2019-2028 (MILLONES DE UNIDADES)

TABLA 54 MERCADO DE JUNTAS Y SELLOS DE ASIA-PACÍFICO, POR TIPO, 2019-2028 (MILLONES DE USD)

TABLA 55 MERCADO DE JUNTAS Y SELLOS DE ASIA-PACÍFICO, POR TIPO, 2019-2028 (MILLONES DE UNIDADES)

TABLA 56 MERCADO DE JUNTAS Y SELLOS DE ASIA-PACÍFICO, JUNTAS, POR TIPO, 2019-2028 (MILLONES DE USD)

TABLA 57 MERCADO DE JUNTAS Y SELLOS DE ASIA Y EL PACÍFICO, METÁLICOS, POR MATERIALES, 2019-2028 (MILLONES DE USD)

TABLA 58 MERCADO DE JUNTAS Y SELLOS DE ASIA Y PACÍFICO, NO METÁLICOS, POR MATERIALES, 2019-2028 (MILLONES DE USD)

TABLA 59 MERCADO DE JUNTAS Y SELLOS DE ASIA Y EL PACÍFICO, COMPUESTOS, POR MATERIALES, 2019-2028 (MILLONES DE USD)

TABLA 60 MERCADO DE JUNTAS Y SELLOS DE ASIA-PACÍFICO, JUNTAS, POR PRODUCTO, 2019-2028 (MILLONES DE USD)

TABLA 61 MERCADO DE JUNTAS Y SELLOS DE ASIA-PACÍFICO, JUNTAS DE LÁMINA, POR TIPO, 2019-2028 (MILLONES DE USD)

TABLA 62 MERCADO DE JUNTAS Y SELLOS DE ASIA Y EL PACÍFICO, JUNTA ENVESTIMADA, POR TIPO, 2019-2028 (MILLONES DE USD)

TABLA 63 MERCADO DE JUNTAS Y SELLOS DE ASIA-PACÍFICO, JUNTAS, POR SUPERFICIES PLANAS, 2019-2028 (MILLONES DE USD)

TABLA 64 MERCADO DE JUNTAS Y SELLOS DE ASIA-PACÍFICO, BRIDA, POR TIPO, 2019-2028 (MILLONES DE USD)

TABLA 65 MERCADO DE JUNTAS Y SELLOS DE ASIA-PACÍFICO, JUNTAS, POR FORMATO, 2019-2028 (MILLONES DE USD)

TABLA 66 MERCADO DE JUNTAS Y SELLOS DE ASIA-PACÍFICO, JUNTAS, POR ESPESOR, 2019-2028 (MILLONES DE USD)

TABLA 67 MERCADO DE JUNTAS Y SELLOS DE ASIA-PACÍFICO, SELLOS, POR FORMATO, 2019-2028 (MILLONES DE USD)

TABLA 68 MERCADO DE JUNTAS Y SELLOS DE ASIA-PACÍFICO, SELLOS, POR TIPO, 2019-2028 (MILLONES DE USD)

TABLA 69 MERCADO DE JUNTAS Y SELLOS DE ASIA-PACÍFICO, POR APLICACIÓN, 2019-2028 (MILLONES DE USD)

TABLA 70 MERCADO DE JUNTAS Y SELLOS DE ASIA-PACÍFICO, POR CANAL DE DISTRIBUCIÓN, 2019-2028 (MILLONES DE USD)

TABLA 71 MERCADO DE JUNTAS Y SELLOS DE ASIA Y EL PACÍFICO, POR INDUSTRIA, 2019-2028 (MILLONES DE USD)

TABLA 72 MERCADO DE JUNTAS Y SELLOS DE ASIA-PACÍFICO, AUTOMOCIÓN, POR APLICACIÓN, 2019-2028 (MILLONES DE USD)

TABLA 73 MERCADO DE JUNTAS Y SELLOS DE ASIA-PACÍFICO, AUTOMOTRIZ, POR TIPO, 2019-2028 (MILLONES DE USD)

TABLA 74 MERCADO DE JUNTAS Y SELLOS DE ASIA-PACÍFICO, MARINO Y FERROVIARIO, POR TIPO, 2019-2028 (MILLONES DE USD)

TABLA 75 MERCADO DE JUNTAS Y SELLOS DE ASIA-PACÍFICO, AEROESPACIAL, POR TIPO, 2019-2028 (MILLONES DE USD)

TABLA 76 MERCADO DE JUNTAS Y SELLOS DE ASIA-PACÍFICO, PETRÓLEO Y GAS, POR TIPO, 2019-2028 (MILLONES DE USD)

TABLA 77 MERCADO DE JUNTAS Y SELLOS DE ASIA-PACÍFICO, FABRICACIÓN INDUSTRIAL, POR TIPO, 2019-2028 (MILLONES DE USD)

TABLA 78 MERCADO DE JUNTAS Y SELLOS DE ASIA-PACÍFICO, ELÉCTRICOS, POR TIPO, 2019-2028 (MILLONES DE USD)

TABLA 79 MERCADO DE JUNTAS Y SELLOS DE ASIA-PACÍFICO, PAPEL Y PULPA, POR TIPO, 2019-2028 (MILLONES DE USD)

TABLA 80 MERCADO DE JUNTAS Y SELLOS DE ASIA-PACÍFICO, OTROS, POR TIPO, 2019-2028 (MILLONES DE USD)

TABLA 81 MERCADO DE JUNTAS Y SELLOS DE CHINA, POR TIPO, 2019-2028 (MILLONES DE USD)

TABLA 82 MERCADO DE JUNTAS Y SELLOS DE CHINA, POR TIPO, 2019-2028 (MILLONES DE UNIDADES)

TABLA 83 MERCADO DE JUNTAS Y SELLOS DE CHINA, JUNTAS, POR TIPO, 2019-2028 (MILLONES DE USD)

TABLA 84 MERCADO DE JUNTAS Y SELLOS DE CHINA, METÁLICOS, POR MATERIALES, 2019-2028 (MILLONES DE USD)

TABLA 85 MERCADO CHINA DE JUNTAS Y SELLOS, NO METÁLICOS, POR MATERIALES, 2019-2028 (MILLONES DE USD)

TABLA 86 MERCADO DE JUNTAS Y SELLOS DE CHINA, COMPUESTOS, POR MATERIALES, 2019-2028 (MILLONES DE USD)

TABLA 87 MERCADO DE JUNTAS Y SELLOS DE CHINA, JUNTAS, POR PRODUCTO, 2019-2028 (MILLONES DE USD)

TABLA 88 MERCADO DE JUNTAS Y SELLOS DE CHINA, JUNTAS DE LÁMINA, POR TIPO, 2019-2028 (MILLONES DE USD)

TABLA 89 MERCADO DE JUNTAS Y SELLOS DE CHINA, JUNTA ENVESTIMADA, POR TIPO, 2019-2028 (MILLONES DE USD)

TABLA 90 MERCADO DE JUNTAS Y SELLOS DE CHINA, JUNTAS, POR SUPERFICIES PLANAS, 2019-2028 (MILLONES DE USD)

TABLA 91 MERCADO DE JUNTAS Y SELLOS DE CHINA, BRIDA, POR TIPO, 2019-2028 (MILLONES DE USD)

TABLA 92 MERCADO DE JUNTAS Y SELLOS DE CHINA, JUNTAS, POR FORMA, 2019-2028 (MILLONES DE USD)

TABLA 93 MERCADO DE JUNTAS Y SELLOS DE CHINA, JUNTAS, POR ESPESOR, 2019-2028 (MILLONES DE USD)

TABLA 94 MERCADO DE JUNTAS Y SELLOS DE CHINA, SELLOS, POR FORMATO, 2019-2028 (MILLONES DE USD)

TABLA 95 MERCADO DE JUNTAS Y SELLOS DE CHINA, SELLOS, POR TIPO, 2019-2028 (MILLONES DE USD)

TABLA 96 MERCADO DE JUNTAS Y SELLOS DE CHINA, POR APLICACIÓN, 2019-2028 (MILLONES DE USD)

CUADRO 97 MERCADO DE JUNTAS Y SELLOS DE CHINA, POR CANAL DE DISTRIBUCIÓN, 2019-2028 (MILLONES DE USD)

TABLA 98 MERCADO DE JUNTAS Y SELLOS DE CHINA, POR INDUSTRIA, 2019-2028 (MILLONES DE USD)

TABLA 99 MERCADO DE JUNTAS Y SELLOS DE CHINA, AUTOMOTRIZ, POR APLICACIÓN, 2019-2028 (MILLONES DE USD)

TABLA 100 MERCADO DE JUNTAS Y SELLOS DE CHINA, AUTOMOTRIZ, POR TIPO, 2019-2028 (MILLONES DE USD)

TABLA 101 MERCADO DE JUNTAS Y SELLOS DE CHINA, MARINO Y FERROVIARIO, POR TIPO, 2019-2028 (MILLONES DE USD)

TABLA 102 MERCADO DE JUNTAS Y SELLOS DE CHINA, AEROESPACIAL, POR TIPO, 2019-2028 (MILLONES DE USD)

TABLA 103 MERCADO DE JUNTAS Y SELLOS DE CHINA, PETRÓLEO Y GAS, POR TIPO, 2019-2028 (MILLONES DE USD)

TABLA 104 MERCADO DE JUNTAS Y SELLOS DE CHINA, FABRICACIÓN INDUSTRIAL, POR TIPO, 2019-2028 (MILLONES DE USD)

TABLA 105 MERCADO CHINA DE JUNTAS Y SELLOS, ELÉCTRICOS, POR TIPO, 2019-2028 (MILLONES DE USD)

CUADRO 106 MERCADO DE JUNTAS Y SELLOS DE CHINA, PAPEL Y PULPA, POR TIPO, 2019-2028 (MILLONES DE USD)

TABLA 107 MERCADO DE JUNTAS Y SELLOS DE CHINA, OTROS, POR TIPO, 2019-2028 (MILLONES DE USD)

TABLA 108 MERCADO DE JUNTAS Y SELLOS DE LA INDIA, POR TIPO, 2019-2028 (MILLONES DE USD)

TABLA 109 MERCADO DE JUNTAS Y SELLOS DE LA INDIA, POR TIPO, 2019-2028 (MILLONES DE UNIDADES)

TABLA 110 MERCADO DE JUNTAS Y SELLOS DE LA INDIA, JUNTAS, POR TIPO, 2019-2028 (MILLONES DE USD)

TABLA 111 MERCADO DE JUNTAS Y SELLOS DE LA INDIA, METÁLICOS, POR MATERIALES, 2019-2028 (MILLONES DE USD)

TABLA 112 MERCADO DE JUNTAS Y SELLOS DE LA INDIA, NO METÁLICOS, POR MATERIALES, 2019-2028 (MILLONES DE USD)

TABLA 113 MERCADO DE JUNTAS Y SELLOS DE LA INDIA, COMPUESTOS, POR MATERIALES, 2019-2028 (MILLONES DE USD)

TABLA 114 MERCADO DE JUNTAS Y SELLOS DE LA INDIA, JUNTAS, POR PRODUCTO, 2019-2028 (MILLONES DE USD)

TABLA 115 MERCADO DE JUNTAS Y SELLOS DE LA INDIA, JUNTAS DE LÁMINA, POR TIPO, 2019-2028 (MILLONES DE USD)

TABLA 116 MERCADO DE JUNTAS Y SELLOS DE LA INDIA, JUNTA ENVESTIMADA, POR TIPO, 2019-2028 (MILLONES DE USD)

TABLA 117 MERCADO DE JUNTAS Y SELLOS DE LA INDIA, JUNTAS, POR SUPERFICIES PLANAS, 2019-2028 (MILLONES DE USD)

TABLA 118 MERCADO DE JUNTAS Y SELLOS DE LA INDIA, BRIDA, POR TIPO, 2019-2028 (MILLONES DE USD)

TABLA 119 MERCADO DE JUNTAS Y SELLOS DE LA INDIA, JUNTAS, POR FORMATO, 2019-2028 (MILLONES DE USD)

TABLA 120 MERCADO DE JUNTAS Y SELLOS DE LA INDIA, JUNTAS, POR ESPESOR, 2019-2028 (MILLONES DE USD)

TABLA 121 MERCADO DE JUNTAS Y SELLOS DE LA INDIA, SELLOS, POR FORMATO, 2019-2028 (MILLONES DE USD)

TABLA 122 MERCADO DE JUNTAS Y SELLOS DE LA INDIA, SELLOS, POR TIPO, 2019-2028 (MILLONES DE USD)

TABLA 123 MERCADO DE JUNTAS Y SELLOS DE LA INDIA, POR APLICACIÓN, 2019-2028 (MILLONES DE USD)

TABLA 124 MERCADO DE JUNTAS Y SELLOS DE LA INDIA, POR CANAL DE DISTRIBUCIÓN, 2019-2028 (MILLONES DE USD)

TABLA 125 MERCADO DE JUNTAS Y SELLOS DE LA INDIA, POR INDUSTRIA, 2019-2028 (MILLONES DE USD)

TABLA 126 MERCADO DE JUNTAS Y SELLOS DE LA INDIA, AUTOMOCIÓN, POR APLICACIÓN, 2019-2028 (MILLONES DE USD)

TABLA 127 MERCADO DE JUNTAS Y SELLOS DE LA INDIA, AUTOMOTRIZ, POR TIPO, 2019-2028 (MILLONES DE USD)

TABLA 128 MERCADO DE JUNTAS Y SELLOS DE LA INDIA, MARINO Y FERROVIARIO, POR TIPO, 2019-2028 (MILLONES DE USD)

TABLA 129 MERCADO DE JUNTAS Y SELLOS DE LA INDIA, AEROESPACIAL, POR TIPO, 2019-2028 (MILLONES DE USD)

TABLA 130 MERCADO DE JUNTAS Y SELLOS DE LA INDIA, PETRÓLEO Y GAS, POR TIPO, 2019-2028 (MILLONES DE USD)

TABLA 131 MERCADO DE JUNTAS Y SELLOS DE LA INDIA, FABRICACIÓN INDUSTRIAL, POR TIPO, 2019-2028 (MILLONES DE USD)

TABLA 132 MERCADO DE JUNTAS Y SELLOS DE LA INDIA, ELÉCTRICOS, POR TIPO, 2019-2028 (MILLONES DE USD)

CUADRO 133 MERCADO DE JUNTAS Y SELLOS DE LA INDIA, PAPEL Y PULPA, POR TIPO, 2019-2028 (MILLONES DE USD)

TABLA 134 MERCADO DE JUNTAS Y SELLOS DE LA INDIA, OTROS, POR TIPO, 2019-2028 (MILLONES DE USD)

TABLA 135 MERCADO DE JUNTAS Y SELLOS DE JAPÓN, POR TIPO, 2019-2028 (MILLONES DE USD)

TABLA 136 MERCADO DE JUNTAS Y SELLOS DE JAPÓN, POR TIPO, 2019-2028 (MILLONES DE UNIDADES)

TABLA 137 MERCADO DE JUNTAS Y SELLOS DE JAPÓN, JUNTAS, POR TIPO, 2019-2028 (MILLONES DE USD)

TABLA 138 MERCADO JAPÓN DE JUNTAS Y SELLOS, METÁLICOS, POR MATERIALES, 2019-2028 (MILLONES DE USD)

TABLA 139 MERCADO JAPÓN DE JUNTAS Y SELLOS, NO METÁLICOS, POR MATERIALES, 2019-2028 (MILLONES DE USD)

TABLA 140 MERCADO DE JUNTAS Y SELLOS DE JAPÓN, COMPUESTOS, POR MATERIALES, 2019-2028 (MILLONES DE USD)

TABLA 141 MERCADO DE JUNTAS Y SELLOS DE JAPÓN, JUNTAS, POR PRODUCTO, 2019-2028 (MILLONES DE USD)

TABLA 142 MERCADO DE JUNTAS Y SELLOS DE JAPÓN, JUNTAS DE LÁMINA, POR TIPO, 2019-2028 (MILLONES DE USD)

TABLA 143 MERCADO DE JUNTAS Y SELLOS DE JAPÓN, JUNTA ENVESTIMADA, POR TIPO, 2019-2028 (MILLONES DE USD)

TABLA 144 MERCADO DE JUNTAS Y SELLOS DE JAPÓN, JUNTAS, POR SUPERFICIES PLANAS, 2019-2028 (MILLONES DE USD)

TABLA 145 MERCADO DE JUNTAS Y SELLOS DE JAPÓN, BRIDA, POR TIPO, 2019-2028 (MILLONES DE USD)

TABLA 146 MERCADO DE JUNTAS Y SELLOS DE JAPÓN, JUNTAS, POR FORMA, 2019-2028 (MILLONES DE USD)

TABLA 147 MERCADO DE JUNTAS Y SELLOS DE JAPÓN, JUNTAS, POR ESPESOR, 2019-2028 (MILLONES DE USD)

TABLA 148 MERCADO DE JUNTAS Y SELLOS DE JAPÓN, SELLOS, POR FORMATO, 2019-2028 (MILLONES DE USD)

TABLA 149 MERCADO DE JUNTAS Y SELLOS DE JAPÓN, SELLOS, POR TIPO, 2019-2028 (MILLONES DE USD)

TABLA 150 MERCADO DE JUNTAS Y SELLOS DE JAPÓN, POR APLICACIÓN, 2019-2028 (MILLONES DE USD)

TABLA 151 MERCADO DE JUNTAS Y SELLOS DE JAPÓN, POR CANAL DE DISTRIBUCIÓN, 2019-2028 (MILLONES DE USD)

TABLA 152 MERCADO DE JUNTAS Y SELLOS DE JAPÓN, POR INDUSTRIA, 2019-2028 (MILLONES DE USD)

TABLA 153 MERCADO DE JUNTAS Y SELLOS DE JAPÓN, AUTOMOTRIZ, POR APLICACIÓN, 2019-2028 (MILLONES DE USD)

TABLA 154 MERCADO DE JUNTAS Y SELLOS DE JAPÓN, AUTOMOTRIZ, POR TIPO, 2019-2028 (MILLONES DE USD)

TABLA 155 MERCADO DE JUNTAS Y SELLOS DE JAPÓN, MARINO Y FERROVIARIO, POR TIPO, 2019-2028 (MILLONES DE USD)

TABLA 156 MERCADO DE JUNTAS Y SELLOS DE JAPÓN, AEROESPACIAL, POR TIPO, 2019-2028 (MILLONES DE USD)

TABLA 157 MERCADO DE JUNTAS Y SELLOS DE JAPÓN, PETRÓLEO Y GAS, POR TIPO, 2019-2028 (MILLONES DE USD)

TABLA 158 MERCADO DE JUNTAS Y SELLOS DE JAPÓN, FABRICACIÓN INDUSTRIAL, POR TIPO, 2019-2028 (MILLONES DE USD)

TABLA 159 MERCADO JAPÓN DE JUNTAS Y SELLOS, ELÉCTRICOS, POR TIPO, 2019-2028 (MILLONES DE USD)

TABLA 160 MERCADO JAPÓN DE JUNTAS Y SELLOS, PAPEL Y PULPA, POR TIPO, 2019-2028 (MILLONES DE USD)

TABLA 161 MERCADO DE JUNTAS Y SELLOS DE JAPÓN, OTROS, POR TIPO, 2019-2028 (MILLONES DE USD)

TABLA 162 MERCADO DE JUNTAS Y SELLOS DE COREA DEL SUR, POR TIPO, 2019-2028 (MILLONES DE USD)

TABLA 163 MERCADO DE JUNTAS Y SELLOS DE COREA DEL SUR, POR TIPO, 2019-2028 (MILLONES DE UNIDADES)

TABLA 164 MERCADO DE JUNTAS Y SELLOS DE COREA DEL SUR, JUNTAS, POR TIPO, 2019-2028 (MILLONES DE USD)

TABLA 165 MERCADO DE JUNTAS Y SELLOS DE COREA DEL SUR, METÁLICOS, POR MATERIALES, 2019-2028 (MILLONES DE USD)

TABLA 166 MERCADO DE JUNTAS Y SELLOS DE COREA DEL SUR, NO METÁLICOS, POR MATERIALES, 2019-2028 (MILLONES DE USD)

TABLA 167 MERCADO DE JUNTAS Y SELLOS DE COREA DEL SUR, COMPUESTOS, POR MATERIALES, 2019-2028 (MILLONES DE USD)

TABLA 168 MERCADO DE JUNTAS Y SELLOS DE COREA DEL SUR, JUNTAS, POR PRODUCTO, 2019-2028 (MILLONES DE USD)

TABLA 169 MERCADO DE JUNTAS Y SELLOS DE COREA DEL SUR, JUNTAS DE LÁMINA, POR TIPO, 2019-2028 (MILLONES DE USD)

TABLA 170 MERCADO DE JUNTAS Y SELLOS DE COREA DEL SUR, JUNTA ENVESTIMADA, POR TIPO, 2019-2028 (MILLONES DE USD)

TABLA 171 MERCADO DE JUNTAS Y SELLOS DE COREA DEL SUR, JUNTAS, POR SUPERFICIES PLANAS, 2019-2028 (MILLONES DE USD)

TABLA 172 MERCADO DE JUNTAS Y SELLOS DE COREA DEL SUR, BRIDA, POR TIPO, 2019-2028 (MILLONES DE USD)

TABLA 173 MERCADO DE JUNTAS Y SELLOS DE COREA DEL SUR, JUNTAS, POR FORMATO, 2019-2028 (MILLONES DE USD)

TABLA 174 MERCADO DE JUNTAS Y SELLOS DE COREA DEL SUR, JUNTAS, POR ESPESOR, 2019-2028 (MILLONES DE USD)

TABLA 175 MERCADO DE JUNTAS Y SELLOS DE COREA DEL SUR, SELLOS, POR FORMATO, 2019-2028 (MILLONES DE USD)

TABLA 176 MERCADO DE JUNTAS Y SELLOS DE COREA DEL SUR, SELLOS, POR TIPO, 2019-2028 (MILLONES DE USD)

TABLA 177 MERCADO DE JUNTAS Y SELLOS DE COREA DEL SUR, POR APLICACIÓN, 2019-2028 (MILLONES DE USD)

TABLA 178 MERCADO DE JUNTAS Y SELLOS DE COREA DEL SUR, POR CANAL DE DISTRIBUCIÓN, 2019-2028 (MILLONES DE USD)

TABLA 179 MERCADO DE JUNTAS Y SELLOS DE COREA DEL SUR, POR INDUSTRIA, 2019-2028 (MILLONES DE USD)

TABLA 180 MERCADO DE JUNTAS Y SELLOS DE COREA DEL SUR, AUTOMOTRIZ, POR APLICACIÓN, 2019-2028 (MILLONES DE USD)

TABLA 181 MERCADO DE JUNTAS Y SELLOS DE COREA DEL SUR, AUTOMOTRIZ, POR TIPO, 2019-2028 (MILLONES DE USD)

TABLA 182 MERCADO DE JUNTAS Y SELLOS DE COREA DEL SUR, MARINO Y FERROVIARIO, POR TIPO, 2019-2028 (MILLONES DE USD)

TABLA 183 MERCADO DE JUNTAS Y SELLOS DE COREA DEL SUR, AEROESPACIAL, POR TIPO, 2019-2028 (MILLONES DE USD)

TABLA 184 MERCADO DE JUNTAS Y SELLOS DE COREA DEL SUR, PETRÓLEO Y GAS, POR TIPO, 2019-2028 (MILLONES DE USD)

TABLA 185 MERCADO DE JUNTAS Y SELLOS DE COREA DEL SUR, FABRICACIÓN INDUSTRIAL, POR TIPO, 2019-2028 (MILLONES DE USD)

TABLA 186 MERCADO DE JUNTAS Y SELLOS DE COREA DEL SUR, ELÉCTRICOS, POR TIPO, 2019-2028 (MILLONES DE USD)

CUADRO 187 MERCADO DE JUNTAS Y SELLOS DE COREA DEL SUR, PAPEL Y PULPA, POR TIPO, 2019-2028 (MILLONES DE USD)

TABLA 188 MERCADO DE JUNTAS Y SELLOS DE COREA DEL SUR, OTROS, POR TIPO, 2019-2028 (MILLONES DE USD)

TABLA 189 MERCADO DE JUNTAS Y SELLOS DE AUSTRALIA Y NUEVA ZELANDA, POR TIPO, 2019-2028 (MILLONES DE USD)

TABLA 190 MERCADO DE JUNTAS Y SELLOS DE AUSTRALIA Y NUEVA ZELANDA, POR TIPO, 2019-2028 (MILLONES DE UNIDADES)

TABLA 191 MERCADO DE JUNTAS Y SELLOS DE AUSTRALIA Y NUEVA ZELANDA, JUNTAS, POR TIPO, 2019-2028 (MILLONES DE USD)

TABLA 192 MERCADO DE JUNTAS Y SELLOS DE AUSTRALIA Y NUEVA ZELANDA, METÁLICOS, POR MATERIALES, 2019-2028 (MILLONES DE USD)

TABLA 193 MERCADO DE JUNTAS Y SELLOS DE AUSTRALIA Y NUEVA ZELANDA, NO METÁLICOS, POR MATERIALES, 2019-2028 (MILLONES DE USD)

TABLA 194 MERCADO DE JUNTAS Y SELLOS DE AUSTRALIA Y NUEVA ZELANDA, COMPUESTO, POR MATERIALES, 2019-2028 (MILLONES DE USD)

TABLA 195 MERCADO DE JUNTAS Y SELLOS DE AUSTRALIA Y NUEVA ZELANDA, JUNTAS, POR PRODUCTO, 2019-2028 (MILLONES DE USD)

TABLA 196 MERCADO DE JUNTAS Y SELLOS DE AUSTRALIA Y NUEVA ZELANDA, JUNTAS DE LÁMINA, POR TIPO, 2019-2028 (MILLONES DE USD)

TABLA 197 MERCADO DE JUNTAS Y SELLOS DE AUSTRALIA Y NUEVA ZELANDA, JUNTA ENVESTIMADA, POR TIPO, 2019-2028 (MILLONES DE USD)

TABLA 198 MERCADO DE JUNTAS Y SELLOS DE AUSTRALIA Y NUEVA ZELANDA, JUNTAS, POR SUPERFICIES PLANAS, 2019-2028 (MILLONES DE USD)

TABLA 199 MERCADO DE JUNTAS Y SELLOS DE AUSTRALIA Y NUEVA ZELANDA, BRIDA, POR TIPO, 2019-2028 (MILLONES DE USD)

TABLA 200 MERCADO DE JUNTAS Y SELLOS DE AUSTRALIA Y NUEVA ZELANDA, JUNTAS, POR FORMATO, 2019-2028 (MILLONES DE USD)

TABLA 201 MERCADO DE JUNTAS Y SELLOS DE AUSTRALIA Y NUEVA ZELANDA, JUNTAS, POR ESPESOR, 2019-2028 (MILLONES DE USD)

TABLA 202 MERCADO DE JUNTAS Y SELLOS DE AUSTRALIA Y NUEVA ZELANDA, SELLOS, POR FORMATO, 2019-2028 (MILLONES DE USD)

TABLA 203 MERCADO DE JUNTAS Y SELLOS DE AUSTRALIA Y NUEVA ZELANDA, SELLOS, POR TIPO, 2019-2028 (MILLONES DE USD)

TABLA 204 MERCADO DE JUNTAS Y SELLOS DE AUSTRALIA Y NUEVA ZELANDA, POR APLICACIÓN, 2019-2028 (MILLONES DE USD)

TABLA 205 MERCADO DE JUNTAS Y SELLOS DE AUSTRALIA Y NUEVA ZELANDA, POR CANAL DE DISTRIBUCIÓN, 2019-2028 (MILLONES DE USD)

TABLA 206 MERCADO DE JUNTAS Y SELLOS DE AUSTRALIA Y NUEVA ZELANDA, POR INDUSTRIA, 2019-2028 (MILLONES DE USD)

TABLA 207 MERCADO DE JUNTAS Y SELLOS DE AUSTRALIA Y NUEVA ZELANDA, AUTOMOCIÓN, POR APLICACIÓN, 2019-2028 (MILLONES DE USD)

TABLA 208 MERCADO DE JUNTAS Y SELLOS DE AUSTRALIA Y NUEVA ZELANDA, AUTOMOTRIZ, POR TIPO, 2019-2028 (MILLONES DE USD)

TABLA 209 MERCADO DE JUNTAS Y SELLOS DE AUSTRALIA Y NUEVA ZELANDA, MARINO Y FERROVIARIO, POR TIPO, 2019-2028 (MILLONES DE USD)

TABLA 210 MERCADO DE JUNTAS Y SELLOS DE AUSTRALIA Y NUEVA ZELANDA, AEROESPACIAL, POR TIPO, 2019-2028 (MILLONES DE USD)

TABLA 211 MERCADO DE JUNTAS Y SELLOS DE AUSTRALIA Y NUEVA ZELANDA, PETRÓLEO Y GAS, POR TIPO, 2019-2028 (MILLONES DE USD)

TABLA 212 MERCADO DE JUNTAS Y SELLOS DE AUSTRALIA Y NUEVA ZELANDA, FABRICACIÓN INDUSTRIAL, POR TIPO, 2019-2028 (MILLONES DE USD)

TABLA 213 MERCADO DE JUNTAS Y SELLOS DE AUSTRALIA Y NUEVA ZELANDA, ELÉCTRICOS, POR TIPO, 2019-2028 (MILLONES DE USD)

CUADRO 214 MERCADO DE JUNTAS Y SELLOS DE AUSTRALIA Y NUEVA ZELANDA, PAPEL Y PULPA, POR TIPO, 2019-2028 (MILLONES DE USD)

TABLA 215 MERCADO DE JUNTAS Y SELLOS DE AUSTRALIA Y NUEVA ZELANDA, OTROS, POR TIPO, 2019-2028 (MILLONES DE USD)

TABLA 216 MERCADO DE JUNTAS Y SELLOS DE INDONESIA, POR TIPO, 2019-2028 (MILLONES DE USD)

TABLA 217 MERCADO DE JUNTAS Y SELLOS DE INDONESIA, POR TIPO, 2019-2028 (MILLONES DE UNIDADES)

TABLA 218 MERCADO DE JUNTAS Y SELLOS DE INDONESIA, JUNTAS, POR TIPO, 2019-2028 (MILLONES DE USD)

TABLA 219 MERCADO DE JUNTAS Y SELLOS DE INDONESIA, METÁLICOS, POR MATERIALES, 2019-2028 (MILLONES DE USD)

TABLA 220 MERCADO DE JUNTAS Y SELLOS DE INDONESIA, NO METÁLICOS, POR MATERIALES, 2019-2028 (MILLONES DE USD)

TABLA 221 MERCADO DE JUNTAS Y SELLOS DE INDONESIA, COMPUESTOS, POR MATERIALES, 2019-2028 (MILLONES DE USD)

TABLA 222 MERCADO DE JUNTAS Y SELLOS DE INDONESIA, JUNTAS, POR PRODUCTO, 2019-2028 (MILLONES DE USD)

TABLA 223 MERCADO DE JUNTAS Y SELLOS DE INDONESIA, JUNTAS DE LÁMINA, POR TIPO, 2019-2028 (MILLONES DE USD)

TABLA 224 MERCADO DE JUNTAS Y SELLOS DE INDONESIA, JUNTA ENVESTIMADA, POR TIPO, 2019-2028 (MILLONES DE USD)

TABLA 225 MERCADO DE JUNTAS Y SELLOS DE INDONESIA, JUNTAS, POR SUPERFICIES PLANAS, 2019-2028 (MILLONES DE USD)

TABLA 226 MERCADO DE JUNTAS Y SELLOS DE INDONESIA, BRIDA, POR TIPO, 2019-2028 (MILLONES DE USD)

TABLA 227 MERCADO DE JUNTAS Y SELLOS DE INDONESIA, JUNTAS, POR FORMA, 2019-2028 (MILLONES DE USD)

TABLA 228 MERCADO DE JUNTAS Y SELLOS DE INDONESIA, JUNTAS, POR ESPESOR, 2019-2028 (MILLONES DE USD)

TABLA 229 MERCADO DE JUNTAS Y SELLOS DE INDONESIA, SELLOS, POR FORMATO, 2019-2028 (MILLONES DE USD)

TABLA 230 MERCADO DE JUNTAS Y SELLOS DE INDONESIA, SELLOS, POR TIPO, 2019-2028 (MILLONES DE USD)

TABLA 231 MERCADO DE JUNTAS Y SELLOS DE INDONESIA, POR APLICACIÓN, 2019-2028 (MILLONES DE USD)

TABLA 232 MERCADO DE JUNTAS Y SELLOS DE INDONESIA, POR CANAL DE DISTRIBUCIÓN, 2019-2028 (MILLONES DE USD)

TABLA 233 MERCADO DE JUNTAS Y SELLOS DE INDONESIA, POR INDUSTRIA, 2019-2028 (MILLONES DE USD)

TABLA 234 MERCADO DE JUNTAS Y SELLOS DE INDONESIA, AUTOMOCIÓN, POR APLICACIÓN, 2019-2028 (MILLONES DE USD)

TABLA 235 MERCADO DE JUNTAS Y SELLOS DE INDONESIA, AUTOMOTRIZ, POR TIPO, 2019-2028 (MILLONES DE USD)

TABLA 236 MERCADO DE JUNTAS Y SELLOS DE INDONESIA, MARINO Y FERROVIARIO, POR TIPO, 2019-2028 (MILLONES DE USD)

TABLA 237 MERCADO DE JUNTAS Y SELLOS DE INDONESIA, AEROESPACIAL, POR TIPO, 2019-2028 (MILLONES DE USD)

TABLA 238 MERCADO DE JUNTAS Y SELLOS DE INDONESIA, PETRÓLEO Y GAS, POR TIPO, 2019-2028 (MILLONES DE USD)

TABLA 239 MERCADO DE JUNTAS Y SELLOS DE INDONESIA, FABRICACIÓN INDUSTRIAL, POR TIPO, 2019-2028 (MILLONES DE USD)

TABLA 240 MERCADO DE JUNTAS Y SELLOS DE INDONESIA, ELÉCTRICOS, POR TIPO, 2019-2028 (MILLONES DE USD)

TABLA 241 MERCADO DE JUNTAS Y SELLOS DE INDONESIA, PAPEL Y PULPA, POR TIPO, 2019-2028 (MILLONES DE USD)

TABLA 242 MERCADO DE JUNTAS Y SELLOS DE INDONESIA, OTROS, POR TIPO, 2019-2028 (MILLONES DE USD)

TABLA 243 MERCADO DE JUNTAS Y SELLOS DE HONG KONG, POR TIPO, 2019-2028 (MILLONES DE USD)

TABLA 244 MERCADO DE JUNTAS Y SELLOS DE HONG KONG, POR TIPO, 2019-2028 (MILLONES DE UNIDADES)

TABLA 245 MERCADO DE JUNTAS Y SELLOS DE HONG KONG, JUNTAS, POR TIPO, 2019-2028 (MILLONES DE USD)

TABLA 246 MERCADO DE JUNTAS Y SELLOS DE HONG KONG, METÁLICOS, POR MATERIALES, 2019-2028 (MILLONES DE USD)

TABLA 247 MERCADO DE JUNTAS Y SELLOS DE HONG KONG, NO METÁLICOS, POR MATERIALES, 2019-2028 (MILLONES DE USD)

TABLA 248 MERCADO DE JUNTAS Y SELLOS DE HONG KONG, COMPUESTOS, POR MATERIALES, 2019-2028 (MILLONES DE USD)

TABLA 249 MERCADO DE JUNTAS Y SELLOS DE HONG KONG, JUNTAS, POR PRODUCTO, 2019-2028 (MILLONES DE USD)

TABLA 250 MERCADO DE JUNTAS Y SELLOS DE HONG KONG, JUNTAS DE LÁMINA, POR TIPO, 2019-2028 (MILLONES DE USD)

TABLA 251 MERCADO DE JUNTAS Y SELLOS DE HONG KONG, JUNTA ENVESTIMADA, POR TIPO, 2019-2028 (MILLONES DE USD)

TABLA 252 MERCADO DE JUNTAS Y SELLOS DE HONG KONG, JUNTAS, POR SUPERFICIES PLANAS, 2019-2028 (MILLONES DE USD)

TABLA 253 MERCADO DE JUNTAS Y SELLOS DE HONG KONG, BRIDA, POR TIPO, 2019-2028 (MILLONES DE USD)

TABLA 254 MERCADO DE JUNTAS Y SELLOS DE HONG KONG, JUNTAS, POR FORMATO, 2019-2028 (MILLONES DE USD)

TABLA 255 MERCADO DE JUNTAS Y SELLOS DE HONG KONG, JUNTAS, POR ESPESOR, 2019-2028 (MILLONES DE USD)

TABLA 256 MERCADO DE JUNTAS Y SELLOS DE HONG KONG, SELLOS, POR FORMATO, 2019-2028 (MILLONES DE USD)

TABLA 257 MERCADO DE JUNTAS Y SELLOS DE HONG KONG, SELLOS, POR TIPO, 2019-2028 (MILLONES DE USD)

TABLA 258 MERCADO DE JUNTAS Y SELLOS DE HONG KONG, POR APLICACIÓN, 2019-2028 (MILLONES DE USD)

TABLA 259 MERCADO DE JUNTAS Y SELLOS DE HONG KONG, POR CANAL DE DISTRIBUCIÓN, 2019-2028 (MILLONES DE USD)

TABLA 260 MERCADO DE JUNTAS Y SELLOS DE HONG KONG, POR INDUSTRIA, 2019-2028 (MILLONES DE USD)

TABLA 261 MERCADO DE JUNTAS Y SELLOS DE HONG KONG, AUTOMOCIÓN, POR APLICACIÓN, 2019-2028 (MILLONES DE USD)

TABLA 262 MERCADO DE JUNTAS Y SELLOS DE HONG KONG, AUTOMOTRIZ, POR TIPO, 2019-2028 (MILLONES DE USD)

TABLA 263 MERCADO DE JUNTAS Y SELLOS DE HONG KONG, MARINO Y FERROVIARIO, POR TIPO, 2019-2028 (MILLONES DE USD)

TABLA 264 MERCADO DE JUNTAS Y SELLOS DE HONG KONG, AEROESPACIAL, POR TIPO, 2019-2028 (MILLONES DE USD)

TABLA 265 MERCADO DE JUNTAS Y SELLOS DE HONG KONG, PETRÓLEO Y GAS, POR TIPO, 2019-2028 (MILLONES DE USD)

TABLA 266 MERCADO DE JUNTAS Y SELLOS DE HONG KONG, FABRICACIÓN INDUSTRIAL, POR TIPO, 2019-2028 (MILLONES DE USD)

TABLA 267 MERCADO DE JUNTAS Y SELLOS DE HONG KONG, ELÉCTRICOS, POR TIPO, 2019-2028 (MILLONES DE USD)

TABLA 268 MERCADO DE JUNTAS Y SELLOS DE HONG KONG, PAPEL Y PULPA, POR TIPO, 2019-2028 (MILLONES DE USD)

TABLA 269 MERCADO DE JUNTAS Y SELLOS DE HONG KONG, OTROS, POR TIPO, 2019-2028 (MILLONES DE USD)

TABLA 270 MERCADO DE JUNTAS Y SELLOS DE SINGAPUR, POR TIPO, 2019-2028 (MILLONES DE USD)

TABLA 271 MERCADO DE JUNTAS Y SELLOS DE SINGAPUR, POR TIPO, 2019-2028 (MILLONES DE UNIDADES)

TABLA 272 MERCADO DE JUNTAS Y SELLOS DE SINGAPUR, JUNTAS, POR TIPO, 2019-2028 (MILLONES DE USD)

TABLA 273 MERCADO DE JUNTAS Y SELLOS DE SINGAPUR, METÁLICOS, POR MATERIALES, 2019-2028 (MILLONES DE USD)

TABLA 274 MERCADO DE JUNTAS Y SELLOS DE SINGAPUR, NO METÁLICOS, POR MATERIALES, 2019-2028 (MILLONES DE USD)

TABLA 275 MERCADO DE JUNTAS Y SELLOS DE SINGAPUR, COMPUESTOS, POR MATERIALES, 2019-2028 (MILLONES DE USD)

TABLA 276 MERCADO DE JUNTAS Y SELLOS DE SINGAPUR, JUNTAS, POR PRODUCTO, 2019-2028 (MILLONES DE USD)

TABLA 277 MERCADO DE JUNTAS Y SELLOS DE SINGAPUR, JUNTAS DE LÁMINA, POR TIPO, 2019-2028 (MILLONES DE USD)

TABLA 278 MERCADO DE JUNTAS Y SELLOS DE SINGAPUR, JUNTA ENVESTIMADA, POR TIPO, 2019-2028 (MILLONES DE USD)

TABLA 279 MERCADO DE JUNTAS Y SELLOS DE SINGAPUR, JUNTAS, POR SUPERFICIES PLANAS, 2019-2028 (MILLONES DE USD)

TABLA 280 MERCADO DE JUNTAS Y SELLOS DE SINGAPUR, BRIDA, POR TIPO, 2019-2028 (MILLONES DE USD)

TABLA 281 MERCADO DE JUNTAS Y SELLOS DE SINGAPUR, JUNTAS, POR FORMATO, 2019-2028 (MILLONES DE USD)

TABLA 282 MERCADO DE JUNTAS Y SELLOS DE SINGAPUR, JUNTAS, POR ESPESOR, 2019-2028 (MILLONES DE USD)

TABLA 283 MERCADO DE JUNTAS Y SELLOS DE SINGAPUR, SELLOS, POR FORMATO, 2019-2028 (MILLONES DE USD)

TABLA 284 MERCADO DE JUNTAS Y SELLOS DE SINGAPUR, SELLOS, POR TIPO, 2019-2028 (MILLONES DE USD)

TABLA 285 MERCADO DE JUNTAS Y SELLOS DE SINGAPUR, POR APLICACIÓN, 2019-2028 (MILLONES DE USD)

TABLA 286 MERCADO DE JUNTAS Y SELLOS DE SINGAPUR, POR CANAL DE DISTRIBUCIÓN, 2019-2028 (MILLONES DE USD)

TABLA 287 MERCADO DE JUNTAS Y SELLOS DE SINGAPUR, POR INDUSTRIA, 2019-2028 (MILLONES DE USD)

TABLA 288 MERCADO DE JUNTAS Y SELLOS DE SINGAPUR, AUTOMOCIÓN, POR APLICACIÓN, 2019-2028 (MILLONES DE USD)

TABLA 289 MERCADO DE JUNTAS Y SELLOS DE SINGAPUR, AUTOMOTRIZ, POR TIPO, 2019-2028 (MILLONES DE USD)

TABLA 290 MERCADO DE JUNTAS Y SELLOS DE SINGAPUR, MARINO Y FERROVIARIO, POR TIPO, 2019-2028 (MILLONES DE USD)

TABLA 291 MERCADO DE JUNTAS Y SELLOS DE SINGAPUR, AEROESPACIAL, POR TIPO, 2019-2028 (MILLONES DE USD)

TABLA 292 MERCADO DE JUNTAS Y SELLOS DE SINGAPUR, PETRÓLEO Y GAS, POR TIPO, 2019-2028 (MILLONES DE USD)

TABLA 293 MERCADO DE JUNTAS Y SELLOS DE SINGAPUR, FABRICACIÓN INDUSTRIAL, POR TIPO, 2019-2028 (MILLONES DE USD)

TABLA 294 MERCADO DE JUNTAS Y SELLOS DE SINGAPUR, ELÉCTRICOS, POR TIPO, 2019-2028 (MILLONES DE USD)

TABLA 295 MERCADO DE JUNTAS Y SELLOS DE SINGAPUR, PAPEL Y PULPA, POR TIPO, 2019-2028 (MILLONES DE USD)

TABLA 296 MERCADO DE JUNTAS Y SELLOS DE SINGAPUR, OTROS, POR TIPO, 2019-2028 (MILLONES DE USD)

TABLA 297 MERCADO DE JUNTAS Y SELLOS DE MALASIA, POR TIPO, 2019-2028 (MILLONES DE USD)

TABLA 298 MERCADO DE JUNTAS Y SELLOS DE MALASIA, POR TIPO, 2019-2028 (MILLONES DE UNIDADES)

TABLA 299 MERCADO DE JUNTAS Y SELLOS DE MALASIA, JUNTAS, POR TIPO, 2019-2028 (MILLONES DE USD)

TABLA 300 MERCADO DE JUNTAS Y SELLOS DE MALASIA, METÁLICOS, POR MATERIALES, 2019-2028 (MILLONES DE USD)

TABLA 301 MERCADO DE JUNTAS Y SELLOS DE MALASIA, NO METÁLICOS, POR MATERIALES, 2019-2028 (MILLONES DE USD)

TABLA 302 MERCADO DE JUNTAS Y SELLOS DE MALASIA, COMPUESTOS, POR MATERIALES, 2019-2028 (MILLONES DE USD)

TABLA 303 MERCADO DE JUNTAS Y SELLOS DE MALASIA, JUNTAS, POR PRODUCTO, 2019-2028 (MILLONES DE USD)

TABLA 304 MERCADO DE JUNTAS Y SELLOS DE MALASIA, JUNTAS DE LÁMINA, POR TIPO, 2019-2028 (MILLONES DE USD)

TABLA 305 MERCADO DE JUNTAS Y SELLOS DE MALASIA, JUNTA ENVESTIMADA, POR TIPO, 2019-2028 (MILLONES DE USD)

TABLA 306 MERCADO DE JUNTAS Y SELLOS DE MALASIA, JUNTAS, POR SUPERFICIES PLANAS, 2019-2028 (MILLONES DE USD)

TABLA 307 MERCADO DE JUNTAS Y SELLOS DE MALASIA, BRIDA, POR TIPO, 2019-2028 (MILLONES DE USD)

TABLA 308 MERCADO DE JUNTAS Y SELLOS DE MALASIA, JUNTAS, POR FORMATO, 2019-2028 (MILLONES DE USD)

TABLA 309 MERCADO DE JUNTAS Y SELLOS DE MALASIA, JUNTAS, POR ESPESOR, 2019-2028 (MILLONES DE USD)

TABLA 310 MERCADO DE JUNTAS Y SELLOS DE MALASIA, SELLOS, POR FORMATO, 2019-2028 (MILLONES DE USD)

TABLA 311 MERCADO DE JUNTAS Y SELLOS DE MALASIA, SELLOS, POR TIPO, 2019-2028 (MILLONES DE USD)

TABLA 312 MERCADO DE JUNTAS Y SELLOS DE MALASIA, POR APLICACIÓN, 2019-2028 (MILLONES DE USD)

TABLA 313 MERCADO DE JUNTAS Y SELLOS DE MALASIA, POR CANAL DE DISTRIBUCIÓN, 2019-2028 (MILLONES DE USD)

TABLA 314 MERCADO DE JUNTAS Y SELLOS DE MALASIA, POR INDUSTRIA, 2019-2028 (MILLONES DE USD)

TABLA 315 MERCADO DE JUNTAS Y SELLOS DE MALASIA, AUTOMOCIÓN, POR APLICACIÓN, 2019-2028 (MILLONES DE USD)

TABLA 316 MERCADO DE JUNTAS Y SELLOS DE MALASIA, AUTOMOTRIZ, POR TIPO, 2019-2028 (MILLONES DE USD)

TABLA 317 MERCADO DE JUNTAS Y SELLOS DE MALASIA, MARINO Y FERROVIARIO, POR TIPO, 2019-2028 (MILLONES DE USD)

TABLA 318 MERCADO DE JUNTAS Y SELLOS DE MALASIA, AEROESPACIAL, POR TIPO, 2019-2028 (MILLONES DE USD)

TABLA 319 MERCADO DE JUNTAS Y SELLOS DE MALASIA, PETRÓLEO Y GAS, POR TIPO, 2019-2028 (MILLONES DE USD)

TABLA 320 MERCADO DE JUNTAS Y SELLOS DE MALASIA, FABRICACIÓN INDUSTRIAL, POR TIPO, 2019-2028 (MILLONES DE USD)

TABLA 321 MERCADO DE JUNTAS Y SELLOS DE MALASIA, ELÉCTRICOS, POR TIPO, 2019-2028 (MILLONES DE USD)

TABLA 322 MERCADO DE JUNTAS Y SELLOS DE MALASIA, PAPEL Y PULPA, POR TIPO, 2019-2028 (MILLONES DE USD)

TABLA 323 MERCADO DE JUNTAS Y SELLOS DE MALASIA, OTROS, POR TIPO, 2019-2028 (MILLONES DE USD)

TABLA 324 MERCADO DE JUNTAS Y SELLOS DE TAILANDIA, POR TIPO, 2019-2028 (MILLONES DE USD)

TABLA 325 MERCADO DE JUNTAS Y SELLOS DE TAILANDIA, POR TIPO, 2019-2028 (MILLONES DE UNIDADES)

TABLA 326 MERCADO DE JUNTAS Y SELLOS DE TAILANDIA, JUNTAS, POR TIPO, 2019-2028 (MILLONES DE USD)

TABLA 327 MERCADO DE JUNTAS Y SELLOS DE TAILANDIA, METÁLICOS, POR MATERIALES, 2019-2028 (MILLONES DE USD)

TABLA 328 MERCADO DE JUNTAS Y SELLOS DE TAILANDIA, NO METÁLICOS, POR MATERIALES, 2019-2028 (MILLONES DE USD)

TABLA 329 MERCADO DE JUNTAS Y SELLOS DE TAILANDIA, COMPUESTOS, POR MATERIALES, 2019-2028 (MILLONES DE USD)

TABLA 330 MERCADO DE JUNTAS Y SELLOS DE TAILANDIA, JUNTAS, POR PRODUCTO, 2019-2028 (MILLONES DE USD)

TABLA 331 MERCADO DE JUNTAS Y SELLOS DE TAILANDIA, JUNTAS DE LÁMINA, POR TIPO, 2019-2028 (MILLONES DE USD)

TABLA 332 MERCADO DE JUNTAS Y SELLOS DE TAILANDIA, JUNTA ENVESTIMADA, POR TIPO, 2019-2028 (MILLONES DE USD)

TABLA 333 MERCADO DE JUNTAS Y SELLOS DE TAILANDIA, JUNTAS, POR SUPERFICIES PLANAS, 2019-2028 (MILLONES DE USD)

TABLA 334 MERCADO DE JUNTAS Y SELLOS DE TAILANDIA, BRIDA, POR TIPO, 2019-2028 (MILLONES DE USD)

TABLA 335 MERCADO DE JUNTAS Y SELLOS DE TAILANDIA, JUNTAS, POR FORMATO, 2019-2028 (MILLONES DE USD)

TABLA 336 MERCADO DE JUNTAS Y SELLOS DE TAILANDIA, JUNTAS, POR ESPESOR, 2019-2028 (MILLONES DE USD)

TABLA 337 MERCADO DE JUNTAS Y SELLOS DE TAILANDIA, SELLOS, POR FORMATO, 2019-2028 (MILLONES DE USD)

TABLA 338 MERCADO DE JUNTAS Y SELLOS DE TAILANDIA, SELLOS, POR TIPO, 2019-2028 (MILLONES DE USD)

TABLA 339 MERCADO DE JUNTAS Y SELLOS DE TAILANDIA, POR APLICACIÓN, 2019-2028 (MILLONES DE USD)

TABLA 340 MERCADO DE JUNTAS Y SELLOS DE TAILANDIA, POR CANAL DE DISTRIBUCIÓN, 2019-2028 (MILLONES DE USD)

TABLA 341 MERCADO DE JUNTAS Y SELLOS DE TAILANDIA, POR INDUSTRIA, 2019-2028 (MILLONES DE USD)

TABLA 342 MERCADO DE JUNTAS Y SELLOS DE TAILANDIA, AUTOMOCIÓN, POR APLICACIÓN, 2019-2028 (MILLONES DE USD)

TABLA 343 MERCADO DE JUNTAS Y SELLOS DE TAILANDIA, AUTOMOTRIZ, POR TIPO, 2019-2028 (MILLONES DE USD)

TABLA 344 MERCADO DE JUNTAS Y SELLOS DE TAILANDIA, MARINO Y FERROVIARIO, POR TIPO, 2019-2028 (MILLONES DE USD)

TABLA 345 MERCADO DE JUNTAS Y SELLOS DE TAILANDIA, AEROESPACIAL, POR TIPO, 2019-2028 (MILLONES DE USD)

TABLA 346 MERCADO DE JUNTAS Y SELLOS DE TAILANDIA, PETRÓLEO Y GAS, POR TIPO, 2019-2028 (MILLONES DE USD)

TABLA 347 MERCADO DE JUNTAS Y SELLOS DE TAILANDIA, FABRICACIÓN INDUSTRIAL, POR TIPO, 2019-2028 (MILLONES DE USD)

TABLA 348 MERCADO DE JUNTAS Y SELLOS DE TAILANDIA, ELÉCTRICOS, POR TIPO, 2019-2028 (MILLONES DE USD)

TABLA 349 MERCADO DE JUNTAS Y SELLOS, PAPEL Y PULPA DE TAILANDIA, POR TIPO, 2019-2028 (MILLONES DE USD)

TABLA 350 MERCADO DE JUNTAS Y SELLOS DE TAILANDIA, OTROS, POR TIPO, 2019-2028 (MILLONES DE USD)

TABLA 351 MERCADO DE JUNTAS Y SELLOS DE FILIPINAS, POR TIPO, 2019-2028 (MILLONES DE USD)

TABLA 352 MERCADO DE JUNTAS Y SELLOS DE FILIPINAS, POR TIPO, 2019-2028 (MILLONES DE UNIDADES)

TABLA 353 MERCADO DE JUNTAS Y SELLOS DE FILIPINAS, JUNTAS, POR TIPO, 2019-2028 (MILLONES DE USD)

TABLA 354 MERCADO DE JUNTAS Y SELLOS DE FILIPINAS, METÁLICOS, POR MATERIALES, 2019-2028 (MILLONES DE USD)

TABLA 355 MERCADO DE JUNTAS Y SELLOS DE FILIPINAS, NO METÁLICOS, POR MATERIALES, 2019-2028 (MILLONES DE USD)

TABLA 356 MERCADO DE JUNTAS Y SELLOS DE FILIPINAS, COMPUESTOS, POR MATERIALES, 2019-2028 (MILLONES DE USD)

TABLA 357 MERCADO DE JUNTAS Y SELLOS DE FILIPINAS, JUNTAS, POR PRODUCTO, 2019-2028 (MILLONES DE USD)

TABLA 358 MERCADO DE JUNTAS Y SELLOS DE FILIPINAS, JUNTAS DE LÁMINA, POR TIPO, 2019-2028 (MILLONES DE USD)

TABLA 359 MERCADO DE JUNTAS Y SELLOS DE FILIPINAS, JUNTA ENVESTIMADA, POR TIPO, 2019-2028 (MILLONES DE USD)

TABLA 360 MERCADO DE JUNTAS Y SELLOS DE FILIPINAS, JUNTAS, POR SUPERFICIES PLANAS, 2019-2028 (MILLONES DE USD)

TABLA 361 MERCADO DE JUNTAS Y SELLOS DE FILIPINAS, BRIDA, POR TIPO, 2019-2028 (MILLONES DE USD)

TABLA 362 MERCADO DE JUNTAS Y SELLOS DE FILIPINAS, JUNTAS, POR FORMATO, 2019-2028 (MILLONES DE USD)

TABLA 363 MERCADO DE JUNTAS Y SELLOS DE FILIPINAS, JUNTAS, POR ESPESOR, 2019-2028 (MILLONES DE USD)

TABLA 364 MERCADO DE JUNTAS Y SELLOS DE FILIPINAS, SELLOS, POR FORMATO, 2019-2028 (MILLONES DE USD)

TABLA 365 MERCADO DE JUNTAS Y SELLOS DE FILIPINAS, SELLOS, POR TIPO, 2019-2028 (MILLONES DE USD)

TABLA 366 MERCADO DE JUNTAS Y SELLOS DE FILIPINAS, POR APLICACIÓN, 2019-2028 (MILLONES DE USD)

CUADRO 367 MERCADO DE JUNTAS Y SELLOS DE FILIPINAS, POR CANAL DE DISTRIBUCIÓN, 2019-2028 (MILLONES DE USD)

CUADRO 368 MERCADO DE JUNTAS Y SELLOS DE FILIPINAS, POR INDUSTRIA, 2019-2028 (MILLONES DE USD)

TABLA 369 MERCADO DE JUNTAS Y SELLOS DE FILIPINAS, AUTOMOTRIZ, POR APLICACIÓN, 2019-2028 (MILLONES DE USD)

TABLA 370 MERCADO DE JUNTAS Y SELLOS DE FILIPINAS, AUTOMOTRIZ, POR TIPO, 2019-2028 (MILLONES DE USD)

TABLA 371 MERCADO DE JUNTAS Y SELLOS DE FILIPINAS, MARINO Y FERROVIARIO, POR TIPO, 2019-2028 (MILLONES DE USD)

TABLA 372 MERCADO DE JUNTAS Y SELLOS DE FILIPINAS, AEROESPACIAL, POR TIPO, 2019-2028 (MILLONES DE USD)

TABLA 373 MERCADO DE JUNTAS Y SELLOS DE FILIPINAS, PETRÓLEO Y GAS, POR TIPO, 2019-2028 (MILLONES DE USD)

TABLA 374 MERCADO DE JUNTAS Y SELLOS DE FILIPINAS, FABRICACIÓN INDUSTRIAL, POR TIPO, 2019-2028 (MILLONES DE USD)

TABLA 375 MERCADO DE JUNTAS Y SELLOS DE FILIPINAS, ELÉCTRICOS, POR TIPO, 2019-2028 (MILLONES DE USD)

CUADRO 376 MERCADO DE JUNTAS Y SELLOS DE FILIPINAS, PAPEL Y PULPA, POR TIPO, 2019-2028 (MILLONES DE USD)

CUADRO 377 MERCADO DE JUNTAS Y SELLOS DE FILIPINAS, OTROS, POR TIPO, 2019-2028 (MILLONES DE USD)

TABLA 378 MERCADO DE JUNTAS Y SELLOS DE TAIWÁN, POR TIPO, 2019-2028 (MILLONES DE USD)

TABLA 379 MERCADO DE JUNTAS Y SELLOS DE TAIWÁN, POR TIPO, 2019-2028 (MILLONES DE UNIDADES)

TABLA 380 MERCADO DE JUNTAS Y SELLOS DE TAIWÁN, JUNTAS, POR TIPO, 2019-2028 (MILLONES DE USD)

TABLA 381 MERCADO DE JUNTAS Y SELLOS DE TAIWÁN, METÁLICOS, POR MATERIALES, 2019-2028 (MILLONES DE USD)

TABLA 382 MERCADO DE JUNTAS Y SELLOS DE TAIWÁN, NO METÁLICOS, POR MATERIALES, 2019-2028 (MILLONES DE USD)

TABLA 383 MERCADO DE JUNTAS Y SELLOS DE TAIWÁN, COMPUESTOS, POR MATERIALES, 2019-2028 (MILLONES DE USD)

TABLA 384 MERCADO DE JUNTAS Y SELLOS DE TAIWÁN, JUNTAS, POR PRODUCTO, 2019-2028 (MILLONES DE USD)

TABLA 385 MERCADO DE JUNTAS Y SELLOS DE TAIWÁN, JUNTAS DE LÁMINA, POR TIPO, 2019-2028 (MILLONES DE USD)

TABLA 386 MERCADO DE JUNTAS Y SELLOS DE TAIWÁN, JUNTA ENVESTIMADA, POR TIPO, 2019-2028 (MILLONES DE USD)

TABLA 387 MERCADO DE JUNTAS Y SELLOS DE TAIWÁN, JUNTAS, POR SUPERFICIES PLANAS, 2019-2028 (MILLONES DE USD)

TABLA 388 MERCADO DE JUNTAS Y SELLOS DE TAIWÁN, BRIDA, POR TIPO, 2019-2028 (MILLONES DE USD)

TABLA 389 MERCADO DE JUNTAS Y SELLOS DE TAIWÁN, JUNTAS, POR FORMATO, 2019-2028 (MILLONES DE USD)

TABLA 390 MERCADO DE JUNTAS Y SELLOS DE TAIWÁN, JUNTAS, POR ESPESOR, 2019-2028 (MILLONES DE USD)

TABLA 391 MERCADO DE JUNTAS Y SELLOS DE TAIWÁN, SELLOS, POR FORMATO, 2019-2028 (MILLONES DE USD)

TABLA 392 MERCADO DE JUNTAS Y SELLOS DE TAIWÁN, SELLOS, POR TIPO, 2019-2028 (MILLONES DE USD)

TABLA 393 MERCADO DE JUNTAS Y SELLOS DE TAIWÁN, POR APLICACIÓN, 2019-2028 (MILLONES DE USD)

TABLA 394 MERCADO DE JUNTAS Y SELLOS DE TAIWÁN, POR CANAL DE DISTRIBUCIÓN, 2019-2028 (MILLONES DE USD)

TABLA 395 MERCADO DE JUNTAS Y SELLOS DE TAIWÁN, POR INDUSTRIA, 2019-2028 (MILLONES DE USD)

TABLA 396 MERCADO DE JUNTAS Y SELLOS DE TAIWÁN, AUTOMOCIÓN, POR APLICACIÓN, 2019-2028 (MILLONES DE USD)

TABLA 397 MERCADO DE JUNTAS Y SELLOS DE TAIWÁN, AUTOMOTRIZ, POR TIPO, 2019-2028 (MILLONES DE USD)

TABLA 398 MERCADO DE JUNTAS Y SELLOS DE TAIWÁN, MARINO Y FERROVIARIO, POR TIPO, 2019-2028 (MILLONES DE USD)

TABLA 399 MERCADO DE JUNTAS Y SELLOS DE TAIWÁN, AEROESPACIAL, POR TIPO, 2019-2028 (MILLONES DE USD)

TABLA 400 MERCADO DE JUNTAS Y SELLOS DE TAIWÁN, PETRÓLEO Y GAS, POR TIPO, 2019-2028 (MILLONES DE USD)

TABLA 401 MERCADO DE JUNTAS Y SELLOS DE TAIWÁN, FABRICACIÓN INDUSTRIAL, POR TIPO, 2019-2028 (MILLONES DE USD)

TABLA 402 MERCADO DE JUNTAS Y SELLOS DE TAIWÁN, ELÉCTRICOS, POR TIPO, 2019-2028 (MILLONES DE USD)

TABLA 403 MERCADO DE JUNTAS Y SELLOS DE TAIWÁN, PAPEL Y PULPA, POR TIPO, 2019-2028 (MILLONES DE USD)

TABLA 404 MERCADO DE JUNTAS Y SELLOS DE TAIWÁN, OTROS, POR TIPO, 2019-2028 (MILLONES DE USD)

TABLA 405 RESTO DEL MERCADO DE JUNTAS Y SELLOS DE ASIA-PACÍFICO, POR TIPO, 2019-2028 (MILLONES DE USD)

TABLA 406 RESTO DEL MERCADO DE JUNTAS Y SELLOS DE ASIA-PACÍFICO, POR TIPO, 2019-2028 (MILLONES DE UNIDADES)


Por favor complete el siguiente formulario para Infografías

Al hacer clic en el botón "Enviar", usted acepta la investigación de mercado de Data Bridge. política de privacidad y Términos y condiciones

Metodología de investigación:

La recopilación de datos y el análisis del año base se realizan mediante módulos de recopilación de datos con muestras de gran tamaño. La etapa incluye la obtención de información de mercado o datos relacionados a través de diversas fuentes y estrategias. Incluye examinar y planificar de antemano todos los datos adquiridos del pasado. Asimismo, abarca el examen de las inconsistencias de la información observadas en diferentes fuentes de información. Los datos de mercado se analizan y estiman utilizando modelos estadísticos y coherentes de mercado. Además, el análisis de la cuota de mercado y el análisis de tendencias clave son los principales factores de éxito en el informe de mercado. Para saber más, solicite una llamada de analista o envíe su consulta.

La metodología de investigación clave utilizada por el equipo de investigación de DBMR es la triangulación de datos, que implica extracción de datos, análisis del impacto de las variables de datos en el mercado y validación primaria (experto de la industria). Los modelos de datos incluyen cuadrícula de posicionamiento de proveedores, análisis de la línea de tiempo del mercado, descripción general y guía del mercado, cuadrícula de posicionamiento de la empresa, análisis de patentes, análisis de precios, análisis de participación de mercado de la empresa, estándares de medición, análisis global versus regional y de participación de proveedores. Para saber más sobre la metodología de investigación, envíe una consulta para hablar con nuestros expertos de la industria.

Por favor complete el siguiente formulario para Metodología de Investigación

Al hacer clic en el botón "Enviar", usted acepta la investigación de mercado de Data Bridge. política de privacidad y Términos y condiciones

Personalización disponible:

Data Bridge Market Research es líder en investigación formativa avanzada. Estamos orgullosos de brindar servicios a nuestros clientes nuevos y existentes con datos y análisis que coinciden y se adaptan a sus objetivos. El informe se puede personalizar para incluir análisis de tendencias de precios de marcas objetivo que comprendan el mercado de países adicionales (solicite la lista de países), datos de resultados de ensayos clínicos, revisión de literatura, mercado renovado y análisis de la base de productos. El análisis de mercado de los competidores objetivo se puede analizar desde análisis basados ​​en tecnología hasta estrategias de cartera de mercado. Podemos agregar tantos competidores sobre los que necesite datos en el formato y estilo de datos que esté buscando. Nuestro equipo de analistas también puede proporcionarle datos en tablas dinámicas de archivos de Excel sin procesar (libro de datos) o puede ayudarlo a crear presentaciones a partir de los conjuntos de datos disponibles en el informe.

Complete el siguiente formulario para personalizar disponible

Al hacer clic en el botón "Enviar", usted acepta la investigación de mercado de Data Bridge. política de privacidad y Términos y condiciones

Informe de muestra gratuito

ELEGIR TIPO DE LICENCIA

  • 4200.00
  • 3500.00
  • 2000.00
  • 5500.00
  • 7500.00

Por qué elegirnos

Cobertura de la industria

DBMR trabaja en todo el mundo en múltiples industrias, lo que nos brinda conocimiento en todos los sectores verticales y brinda a nuestros clientes información no solo de su industria sino también de cómo otras industrias afectarán su ecosistema.

Cobertura Regional

La cobertura de Data Bridge no se limita a las economías desarrolladas o emergentes. Trabajamos en todo el mundo cubriendo la mayor variedad de países donde ninguna otra firma de investigación de mercado o consultoría de negocios ha realizado investigaciones; creando oportunidades de crecimiento para nuestros clientes en áreas aún desconocidas.

Cobertura Tecnológica

En el mundo actual, la tecnología impulsa el sentimiento del mercado, por lo que nuestra visión es brindarles a nuestros clientes información no solo sobre las tecnologías desarrolladas, sino también sobre los próximos y disruptivos cambios tecnológicos a lo largo del ciclo de vida del producto, brindándoles oportunidades imprevistas en el mercado que crearán disrupciones en su industria. . Esto lleva a la innovación y a que nuestros clientes salgan ganadores.

Soluciones orientadas a objetivos

El objetivo de DBMR es ayudar a nuestros clientes a alcanzar sus objetivos a través de nuestras soluciones; por lo tanto, creamos de manera formativa las soluciones más adecuadas para las necesidades de nuestros clientes, ahorrándoles tiempo y esfuerzos para impulsar sus grandes estrategias.

Soporte de analista incomparable

Nuestros analistas se enorgullecen del éxito de nuestros clientes. A diferencia de otros, creemos en trabajar junto a nuestros clientes para lograr sus objetivos con soporte de analistas las 24 horas para determinar las necesidades correctas e inspirar la innovación a través del servicio.

Banner

testimonios de clientes