

Mercado de juntas de Asia y el Pacífico, por tipo (juntas de contacto y juntas sin contacto), industria (automotriz, marina y ferroviaria, aeroespacial, petróleo y gas, fabricación industrial, eléctrica, industria del papel y la pulpa, y otras): tendencias de la industria y pronóstico hasta 2030.
Análisis y tamaño del mercado de juntas de Asia-Pacífico
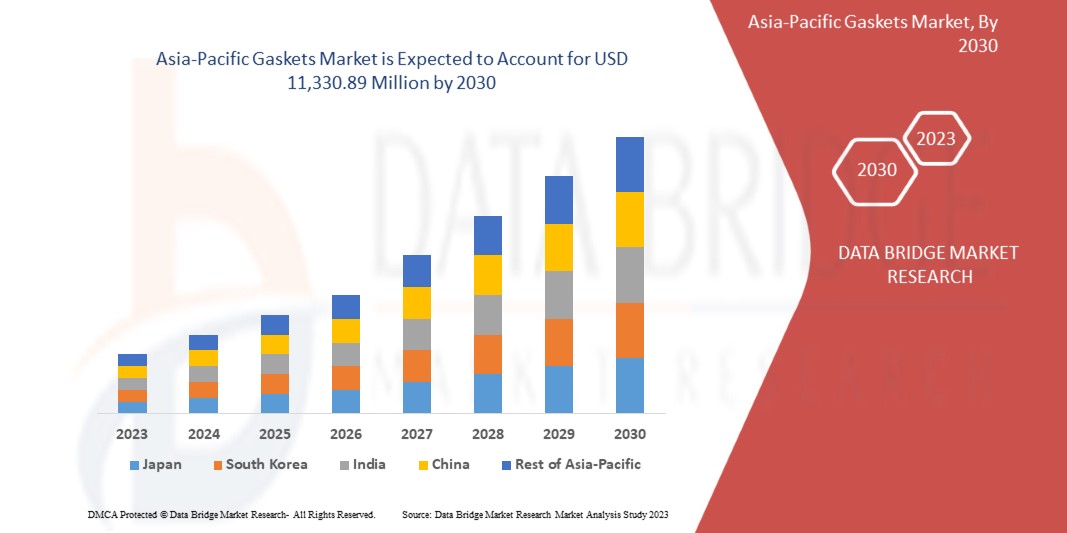
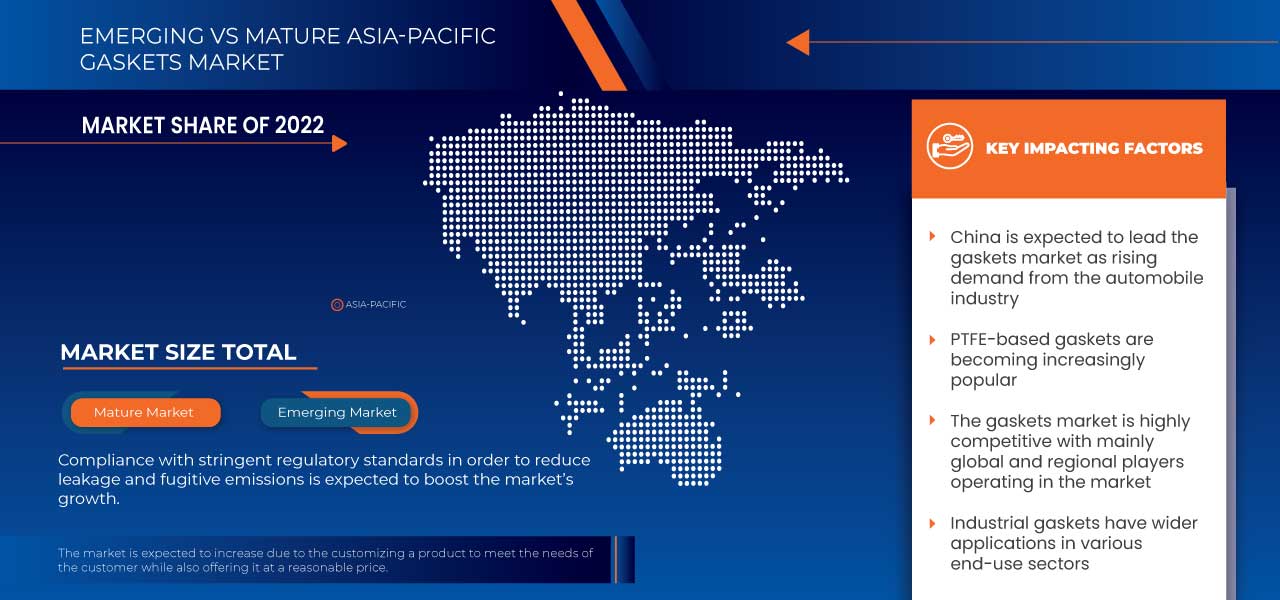
Se espera que el mercado de juntas de Asia-Pacífico gane un crecimiento significativo en el período de pronóstico de 2023 a 2030. Data Bridge Market Research analiza que el mercado está creciendo con una CAGR del 4,9% en el período de pronóstico de 2023 a 2030 y se espera que alcance los USD 11.330,89 millones para 2030. El principal factor que impulsa el crecimiento de las juntas es la creciente demanda de la industria automotriz, y las juntas industriales tienen aplicaciones más amplias en varios sectores de uso final que se espera que impulsen el crecimiento del mercado.
El informe del mercado de juntas de Asia-Pacífico proporciona detalles sobre la participación de mercado, los nuevos desarrollos y el impacto de los actores del mercado local y nacional, y analiza las oportunidades en términos de bolsas de ingresos emergentes, cambios en las regulaciones del mercado, aprobaciones de productos, decisiones estratégicas, lanzamientos de productos e innovaciones tecnológicas en el mercado. Para comprender el análisis y el escenario del mercado, contáctenos para obtener un resumen analítico. Nuestro equipo lo ayudará a crear una solución que tenga impacto en los ingresos para lograr su objetivo deseado.
|
Métrica del informe |
Detalles |
|
Período de pronóstico |
2023 a 2030 |
|
Año base |
2022 |
|
Años históricos |
2021 (Personalizable para 2020-2015) |
|
Unidades cuantitativas |
Ingresos en millones de USD |
|
Segmentos cubiertos |
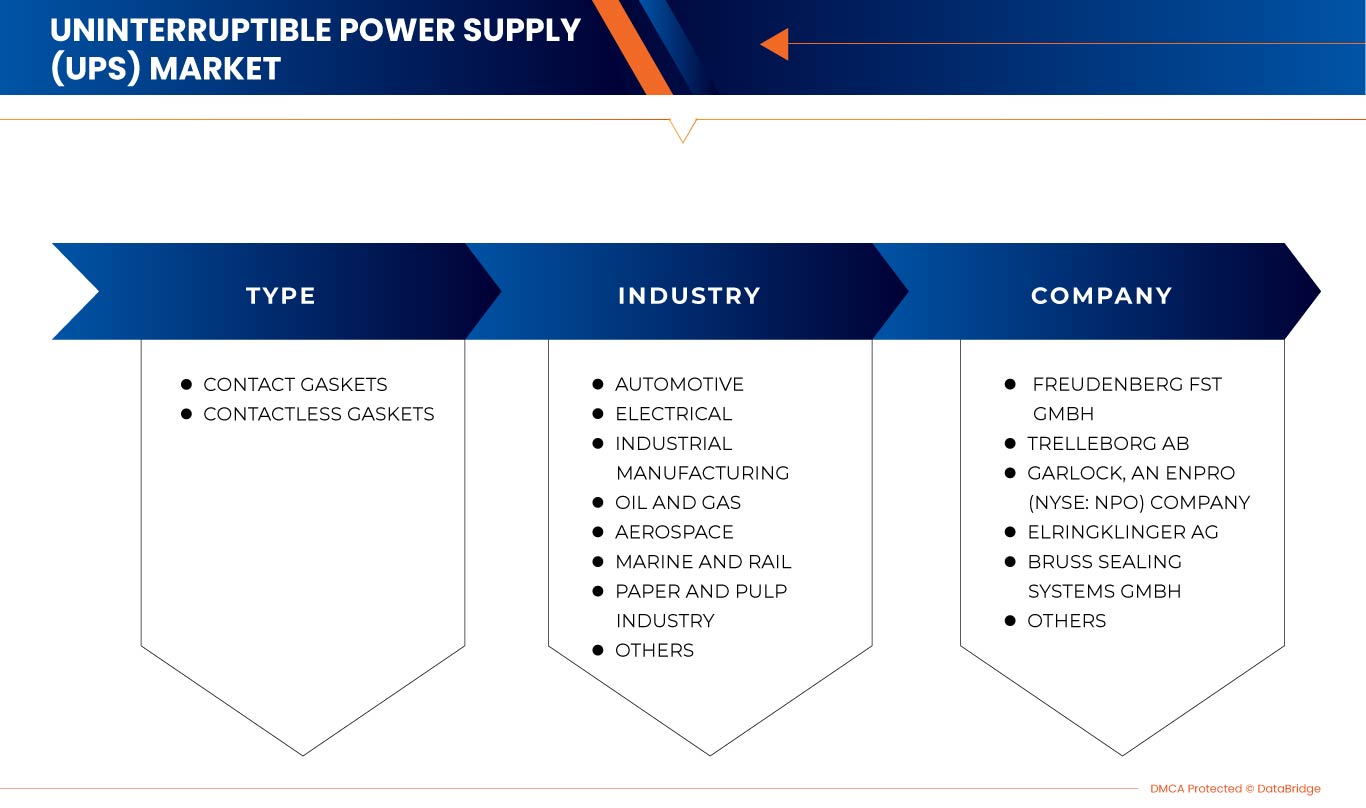
Por tipo (juntas de contacto y juntas sin contacto), industria (automotriz, marina y ferroviaria, aeroespacial, petróleo y gas, fabricación industrial, eléctrica, industria del papel y la pulpa, y otras) |
|
Países cubiertos |
China, Japón, Corea del Sur, India, Singapur, Tailandia, Indonesia, Malasia, Filipinas, Australia y Nueva Zelanda, y el resto de Asia-Pacífico |
|
Actores del mercado cubiertos |
Freudenberg FST GmbH, IDT GmbH, SSP Manufacturing Inc., AJ Rubber & sponge Ltd, BRUSS Sealing Systems GmbH, ElringKlinger AG, Garlock, una empresa de Enpro (NYSE: NPO), Lamons LGC US Asset Holdings, LLC, Trelleborg AB, WL Gore & Associates, Inc., Seal & Design Inc., GE MAO RUBBER INDUSTRIAL CO., LTD., HELIX ENGINEERING, The Topog-E Gasket Co y OHIO VALLEY GASKET INC., entre otras. |
Definición de mercado
Las juntas sellan una conexión entre dos componentes y se utilizan para llenar los espacios vacíos entre dos superficies, lo que ayuda a evitar fugas y desperdicios de fluidos y gases en la aplicación. Los productos de juntas se utilizan principalmente como sellos estáticos. Las juntas están especialmente diseñadas según el tipo de equipo y la superficie de uso final. Las juntas a menudo se cortan en una forma específica para adaptarse al componente al que se van a instalar. Las juntas están hechas de materiales como metales, caucho de grado industrial o una combinación de ambos. Por lo general, están equipadas con excelentes características antiquímicas, propiedades anticompresibilidad, resistencia a altas/bajas temperaturas y a la intemperie, y una resistencia superior al calor, al agua y a la abrasión. La creciente demanda de juntas automotrices está ganando popularidad debido a la demanda de automóviles.
Dinámica del mercado de juntas en Asia-Pacífico
Conductores
- Creciente demanda de la industria del automóvil
La industria del automóvil ha experimentado la conmoción más profunda de su historia durante la última década. Las ventas de automóviles en Asia-Pacífico aumentaron a aproximadamente 66,7 millones de vehículos en 2021, frente a los 63,8 millones de unidades de 2020. Este considerable crecimiento en las ventas de automóviles y otros vehículos de motor mejorará la fabricación de vehículos en Asia-Pacífico, lo que ayudará a impulsar el mercado de juntas.
Las juntas, que se utilizan para sellar el espacio entre dos componentes para garantizar que no haya fugas entre ellos durante la etapa de compresión, son un aspecto clave de prácticamente todos los motores de automóviles y componentes críticos de un vehículo. Están hechas de una pieza plana y precortada de material que se utiliza para sellar las superficies de contacto. La mayoría de los motores de vehículos, desde automóviles y camiones hasta furgonetas y tractocamiones, contienen juntas. Las juntas metálicas y las juntas no metálicas son los dos tipos de juntas automotrices. Las juntas se clasifican en dos tipos: juntas de contacto y juntas sin contacto. La junta de culata, la junta del colector y la junta del árbol de levas son los tipos de juntas más frecuentes que se utilizan en los motores.
- Las juntas basadas en PTFE son cada vez más populares
Una junta de PTFE, también conocida como junta de politetrafluoroetileno, es un sello mecánico que llena el área entre las superficies de conexión del sistema de tuberías. La alta temperatura de fusión, el bajo coeficiente de fricción, la alta resistencia a la corrosión, la alta resiliencia, la adaptabilidad, la vida útil prolongada del producto, el aislamiento eléctrico y térmico y las considerables cualidades aislantes son las propiedades fundamentales que definen la junta de PTFE. Esto aumenta su valor como material de sellado y lo hace adecuado para su uso en una variedad de sectores de uso final, incluidos la energía, la química y la petroquímica, la medicina y la farmacéutica, y el petróleo y el gas. Las juntas de PTFE ayudan al buen funcionamiento de las operaciones al reducir la vibración y crear un entorno libre de ruidos. Tienen un bajo coeficiente de fricción y son resistentes a ácidos, bases y disolventes. Se pueden crear productos de PTFE diseñados a medida utilizando grafito, elastómeros de caucho, rellenos sin amianto, metales corrugados y otros materiales. Debido a estos elementos de PTFE, se crearon nuevos productos e innovaciones en los existentes, lo que impulsó la expansión de los mercados de juntas.
- Las juntas industriales tienen aplicaciones más amplias en varios sectores de uso final.
Las juntas industriales se utilizan ampliamente en industrias de procesos como refinerías y plantas petroquímicas, generación de energía, química y minería, defensa, electrónica, tuberías, tratamiento de agua y fábricas de papel y pulpa, así como en una variedad de aplicaciones de ingeniería general. Se utilizan para evitar fugas de líquidos y gases, garantizar la seguridad del sistema, atributos físicos excepcionales y una vida útil más prolongada del producto.
Debido a su mayor resistencia a los productos químicos, a los álcalis, a los ácidos y a otros, así como a las altas temperaturas, a la presión extrema, a la capacidad de sobrevivir a diversas condiciones y a otras, la necesidad de juntas industriales está aumentando en las industrias antes mencionadas. Es probable que el creciente número de refinerías en los mercados emergentes impulse la demanda de juntas industriales.
Oportunidades
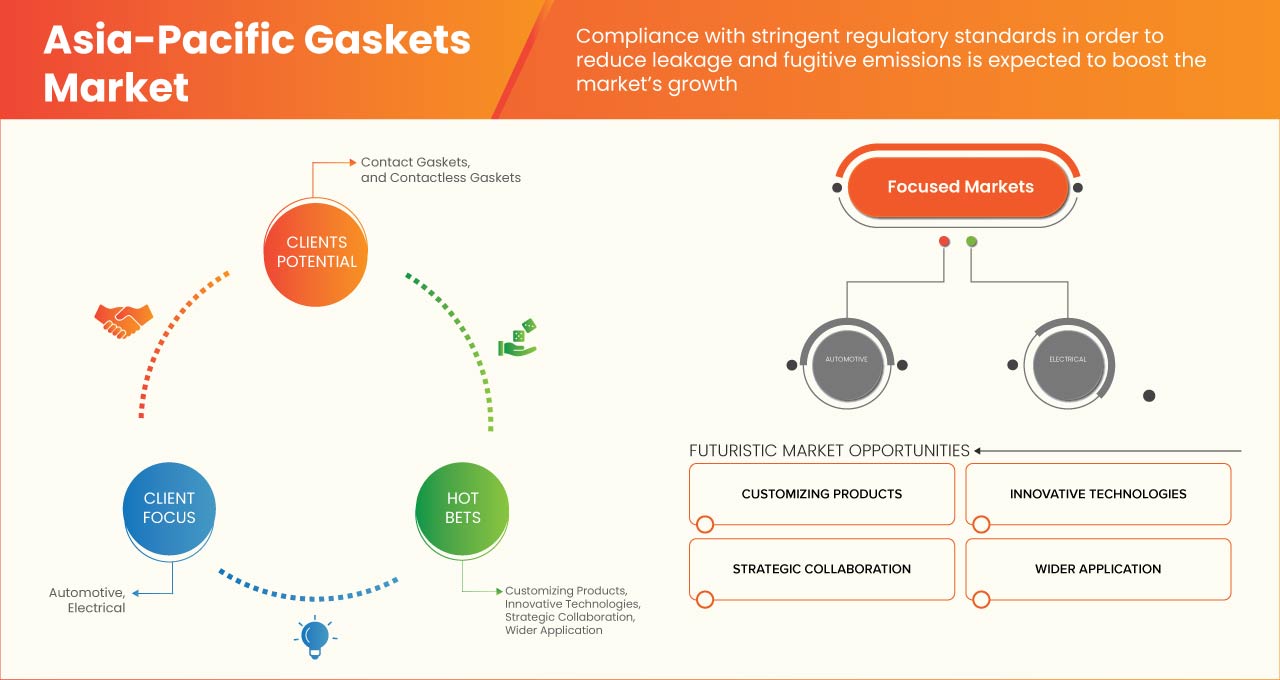
- Personalizar un producto para satisfacer las necesidades del cliente y al mismo tiempo ofrecerlo a un precio razonable.
La personalización de juntas se refiere a la personalización de un producto según las necesidades y preferencias del cliente. La personalización incluye funcionalidades exclusivas, plantillas y flexibilidad en el diseño del producto según las necesidades de la aplicación. La personalización es un elemento esencial para ofrecer una experiencia de cliente personalizada a diferentes segmentos de usuarios. Es el factor clave para impulsar la lealtad y la satisfacción del cliente.
A través de la personalización, habrá más demanda ya que las juntas son necesarias en varias aplicaciones en varias industrias, como petróleo y gas, productos farmacéuticos, alimentos, tratamiento de agua y otros. Con la aplicación de juntas personalizadas, habrá infinitas opciones de tipos de juntas con varias formas, tamaños y materiales según la necesidad del cliente en varias aplicaciones. Dado que cada empresa que utiliza el servicio de la junta tiene su propio conjunto único de criterios que deben especificarse de acuerdo con su necesidad y diseño, existe un alto alcance para ampliar el mercado debido a la posibilidad de personalización de acuerdo con la necesidad personal del cliente.
- Los lanzamientos de nuevos productos pueden representar importantes oportunidades de negocio
Con la necesidad y la demanda de nuevos diseños, existe la necesidad de lanzar nuevos diseños o modificar el producto actual y lanzarlos como una nueva versión. La actualización del nuevo producto impulsará las ventas y atraerá a los consumidores desde el primer día de lanzamiento exitoso de nuevos productos. Cuando se lanza un nuevo producto, se crean nuevas relaciones comerciales y asociaciones. El lanzamiento de un nuevo producto al mercado no solo atraerá a los productos particulares en el mercado, sino que también promocionará el producto ya existente. El nuevo producto también allana el camino para obtener más ganancias si el producto tiene éxito. También crea conciencia de marca y exposición en el mercado.
Restricciones/Desafíos
- Volatilidad de los precios de las materias primas
Las juntas se utilizan en diversas industrias, incluidas las industrias de agua potable, hospitales, industrias de tratamiento de aguas residuales, industrias automotrices, aeroespaciales y de gas y petróleo. Las materias primas para la junta son principalmente papel, caucho, corcho, silicona , fieltro, neopreno , fibra de vidrio, teflón o un polímero plástico, acero inoxidable , aluminio, bronce, titanio y PTFE. El caucho es la principal opción de materia prima para la fabricación de juntas. Una junta generalmente evita fugas y ayuda a mantener los dispositivos mecánicos para su resistencia y compatibilidad.
- Problemas relacionados con las juntas de alta temperatura
El caucho es el material más utilizado para fabricar juntas, por lo que existe una gran posibilidad de que el producto de la junta se deforme al exponerse a altas temperaturas durante un período de tiempo prolongado. Muchos cauchos funcionan a una temperatura de hasta +120 °C, mientras que los cauchos de silicona y Viton se pueden utilizar hasta +300 °C. Algunos cauchos flexibles pueden funcionar de forma continua con exposición a +300 °C. Con la exposición continua a altas temperaturas durante aproximadamente +500 °C, la flexibilidad de una junta se ve comprometida. Por lo tanto, es fundamental seleccionar el material de junta adecuado para su aplicación en una atmósfera de alta temperatura para lograr una unión confiable y un funcionamiento eficaz.
- Las regulaciones gubernamentales para la protección del medio ambiente pueden afectar el crecimiento de las juntas.
El hecho de que las juntas se utilicen en prácticamente todas las industrias del mundo, incluidas la automotriz, la petroquímica, el tratamiento de aguas, la alimentación, la farmacéutica y otras, puede contribuir a aumentar la contaminación. Varias normas regulatorias establecidas por diversos organismos reguladores están obstaculizando la expansión del sector de las juntas.
Las juntas no son invencibles. Están diseñadas para ser extremadamente resistentes y adecuadas para las circunstancias para las que están diseñadas, pero aun así son propensas a degradarse con el tiempo. Una combinación de variables como el oxígeno, el ozono, la luz, el calor, la humedad, los aceites, el agua, los disolventes, los ácidos y los vapores pueden provocar el deterioro de las juntas. Las condiciones ambientales extremas acabarán provocando daños en las juntas. La causticidad, las temperaturas extremas y la presión excesiva sobre las juntas son los riesgos más comunes para la integridad de las juntas en cualquier aplicación. Las juntas de amianto son las principales juntas que plantean una grave preocupación. Los trastornos relacionados con el amianto se han relacionado con la instalación y la retirada de juntas de amianto.
Desarrollo reciente
- En mayo de 2022, según Statista, Asia albergará la mayor cantidad de refinerías de petróleo en funcionamiento del mundo. En 2021, había 316 instalaciones de este tipo en todo el continente. Asia también tiene el mayor número de proyectos de expansión de refinerías en marcha. Hay aproximadamente 90 plantas de refinación en las etapas de planificación o construcción, impulsadas principalmente por la demanda de los consumidores de potencias económicas como China e India.
- En junio de 2020, Lamons presentó la junta DEFENDER HF, diseñada para aplicaciones extremadamente corrosivas, como el ácido fluorhídrico. Con este logro, la organización fortaleció su cartera.
Alcance del mercado de juntas de Asia y el Pacífico
El mercado de juntas de Asia-Pacífico se clasifica según el tipo y la industria. El crecimiento entre dos segmentos le ayudará a analizar los principales segmentos de crecimiento en las industrias y brindará a los usuarios una valiosa descripción general del mercado y conocimientos del mercado para tomar decisiones estratégicas para identificar las principales aplicaciones del mercado.
Tipo
- Juntas de contacto
- Juntas sin contacto
Según el tipo, el mercado de juntas de Asia-Pacífico se clasifica en dos segmentos: juntas de contacto y juntas sin contacto.
Industria
- Automotor
- Eléctrico
- Fabricación industrial
- Petróleo y gas
- Aeroespacial
- Marina y Ferrocarril
- Industria del papel y la pulpa
- Otros
Sobre la base de la industria, el mercado de juntas de Asia-Pacífico se clasifica en ocho segmentos: automotriz, eléctrico, fabricación industrial, petróleo y gas, aeroespacial, marino y ferroviario, industria de papel y pulpa, y otros.
Análisis y perspectivas regionales del mercado de juntas de Asia y el Pacífico
El mercado de juntas de Asia-Pacífico está segmentado según el tipo y la industria.
Los países del mercado de juntas de Asia-Pacífico son China, Japón, Corea del Sur, India, Singapur, Tailandia, Indonesia, Malasia, Filipinas, Australia y Nueva Zelanda, y el resto de Asia-Pacífico.
China está dominando el mercado de juntas de Asia-Pacífico en términos de participación de mercado e ingresos de mercado debido a un aumento en la demanda de la industria automotriz.
La sección de países del informe también proporciona factores individuales que impactan en el mercado y cambios en la regulación del mercado que afectan las tendencias actuales y futuras del mercado. El análisis de los puntos de datos de la cadena de valor aguas abajo y aguas arriba, las tendencias técnicas, el análisis de las cinco fuerzas de Porter y los estudios de casos son algunos de los indicadores utilizados para pronosticar el escenario del mercado para países individuales. Además, la presencia y disponibilidad de marcas de Asia-Pacífico y los desafíos que enfrentan debido a la gran o escasa competencia de las marcas locales y nacionales, el impacto de los aranceles nacionales y las rutas comerciales se consideran al proporcionar un análisis de pronóstico de los datos del país.
Análisis del panorama competitivo y de la cuota de mercado de las juntas en Asia-Pacífico
El panorama competitivo del mercado de juntas de Asia-Pacífico proporciona detalles por competidores. Los detalles incluidos son una descripción general de la empresa, las finanzas de la empresa, los ingresos generados, el potencial de mercado, la inversión en investigación y desarrollo, las nuevas iniciativas de mercado, los sitios e instalaciones de producción, las fortalezas y debilidades de la empresa, el lanzamiento de productos, las líneas de prueba de productos, las aprobaciones de productos, las patentes, la amplitud y la extensión de los productos, el dominio de las aplicaciones y la curva de la línea de vida de la tecnología. Los puntos de datos anteriores proporcionados solo están relacionados con el enfoque de las empresas en relación con el mercado de juntas de Asia-Pacífico.
Algunos de los principales actores que operan en el mercado de juntas de Asia-Pacífico son Freudenberg FST GmbH, IDT GmbH, SSP Manufacturing Inc., AJ Rubber & sponge Ltd, BRUSS Sealing Systems GmbH, ElringKlinger AG, Garlock, una empresa de Enpro (NYSE: NPO), Lamons LGC US Asset Holdings, LLC, Trelleborg AB, WL Gore & Associates, Inc., Seal & Design Inc., GE MAO RUBBER INDUSTRIAL CO., LTD., HELIX ENGINEERING, The Topog-E Gasket Co y OHIO VALLEY GASKET INC., entre otros.
SKU-
Obtenga acceso en línea al informe sobre la primera nube de inteligencia de mercado del mundo

- Panel de análisis de datos interactivo
- Panel de análisis de empresas para oportunidades con alto potencial de crecimiento
- Acceso de analista de investigación para personalización y consultas
- Análisis de la competencia con panel interactivo
- Últimas noticias, actualizaciones y análisis de tendencias
- Aproveche el poder del análisis de referencia para un seguimiento integral de la competencia
Tabla de contenido
1 INTRODUCTION
1.1 OBJECTIVES OF THE STUDY
1.2 MARKET DEFINITION
1.3 OVERVIEW OF THE ASIA PACIFIC GASKETS MARKET
1.4 LIMITATION
1.5 MARKETS COVERED
2 MARKET SEGMENTATION
2.1 MARKETS COVERED
2.2 GEOGRAPHICAL SCOPE
2.3 YEARS CONSIDERED FOR THE STUDY
2.4 CURRENCY AND PRICING
2.5 DBMR TRIPOD DATA VALIDATION MODEL
2.6 PRODUCT LIFELINE CURVE
2.7 MULTIVARIATE MODELING
2.8 PRIMARY INTERVIEWS WITH KEY OPINION LEADERS
2.9 DBMR MARKET POSITION GRID
2.1 DBMR MARKET CHALLENGE MATRIX
2.11 DBMR VENDOR SHARE ANALYSIS
2.12 SECONDARY SOURCES
2.13 ASSUMPTIONS
3 EXECUTIVE SUMMARY
4 PREMIUM INSIGHTS
4.1 CLIMATE CHANGE SCENARIO
4.1.1 ENVIRONMENTAL CONCERNS
4.1.2 GOVERNMENT’S ROLE
4.1.3 ANALYST RECOMMENDATION
4.2 IMPORT EXPORT SCENARIO
4.3 OVERVIEW OF PROFIT MARGIN/EBIT MARGIN FOR PRODUCTS
4.3.1 EBIT MARGIN
4.3.2 PROFIT MARGIN
4.4 PESTLE ANALYSIS
4.4.1 POLITICAL FACTORS
4.4.2 ECONOMIC FACTORS
4.4.3 SOCIAL FACTORS
4.4.4 TECHNOLOGICAL FACTORS
4.4.5 LEGAL FACTORS
4.4.6 ENVIRONMENTAL FACTORS
4.5 RAW MATERIAL PRODUCTION COVERAGE
4.5.1 NATURAL RUBBER
4.5.2 SILICONE RUBBER
4.5.3 NEOPRENE RUBBER
4.5.4 CORK
4.5.5 NON-ASBESTOS
4.6 TECHNOLOGICAL ADVANCEMENT BY MANUFACTURERS
4.7 VENDOR SELECTION CRITERIA
4.8 PORTER’S FIVE FORCES
4.8.1 THE THREAT OF NEW ENTRANTS
4.8.2 THREAT OF SUBSTITUTES
4.8.3 CUSTOMER BARGAINING POWER
4.8.4 SUPPLIER BARGAINING POWER
4.8.5 INTERNAL COMPETITION (RIVALRY)
4.9 ASIA PACIFIC GASKETS MARKET, PRODUCTION AND CONSUMPTION ANALYSIS
4.9.1 OVERVIEW
4.1 SUPPLY CHAIN ANALYSIS
4.10.1 RAW MATERIAL PROCUREMENT
4.10.2 MANUFACTURING AND PACKING
4.10.3 MARKETING AND DISTRIBUTION
4.10.4 END USERS
5 ASIA PACIFIC GASKETS MARKET: REGULATION COVERAGE
6 MARKET OVERVIEW
6.1 DRIVERS
6.1.1 RISING DEMAND FROM THE AUTOMOBILE INDUSTRY
6.1.2 PTFE-BASED GASKETS ARE BECOMING INCREASINGLY POPULAR
6.1.3 INDUSTRIAL GASKETS HAVE WIDER APPLICATIONS IN VARIOUS END-USE SECTORS
6.1.4 COMPLIANCE WITH STRINGENT REGULATORY STANDARDS IN ORDER TO REDUCE LEAKAGE AND FUGITIVE EMISSIONS
6.2 RESTRAINTS
6.2.1 PRICE VOLATILITY OF RAW MATERIALS
6.2.2 ISSUES REGARDING HIGH-TEMPERATURE GASKETS
6.3 OPPORTUNITIES
6.3.1 CUSTOMIZING A PRODUCT TO MEET THE NEEDS OF THE CUSTOMER WHILE ALSO OFFERING IT AT A REASONABLE PRICE
6.3.2 NEW PRODUCT LAUNCHES CAN POSE MAJOR BUSINESS OPPORTUNITIES
6.4 CHALLENGES
6.4.1 CHALLENGES ASSOCIATED WITH MANUFACTURING DESIGN, AND MATERIAL CONSTRUCTION
6.4.2 GOVERNMENT REGULATIONS FOR ENVIRONMENTAL PROTECTION MAY AFFECT GASKETS GROWTH
7 ASIA PACIFIC GASKETS MARKET, BY TYPE
7.1 OVERVIEW
7.2 CONTACT GASKETS
7.2.1 DYNAMIC GASKETS
7.2.1.1 SHAFT GASKETS (ROTARY GASKETS)
7.2.1.2 HYDRAULIC AND PNEUMATIC GASKETS
7.2.1.3 COMPRESSING GASKETS FITTINGS
7.2.1.4 MECHANICAL GASKETS
7.2.2 STATIC GASKETS
7.2.2.1 FLAT GASKETS AND GASKET PLATES
7.2.2.2 PROFILE GASKETS
7.2.2.3 O-RINGS
7.3 CONTACTLESS GASKETS
7.3.1 PRESSURE GASKETS
7.3.2 THROTTLE GASKETS
8 ASIA PACIFIC GASKETS MARKET, BY INDUSTRY
8.1 OVERVIEW
8.2 AUTOMOTIVE
8.2.1 CONTACT GASKETS
8.2.1.1 DYNAMIC GASKETS
8.2.1.1.1 HYDRAULIC AND PNEUMATIC GASKETS
8.2.1.1.2 SHAFT GASKETS (ROTARY GASKETS)
8.2.1.1.3 MECHANICAL GASKETS
8.2.1.1.4 COMPRESSING GASKETS FITTINGS
8.2.1.2 STATIC GASKETS
8.2.1.2.1 FLAT GASKETS AND GASKET PLATES
8.2.1.2.2 PROFILE GASKETS
8.2.1.2.3 O-RINGS
8.2.2 CONTACTLESS GASKETS
8.2.2.1 PRESSURE GASKETS
8.2.2.2 THROTTLE GASKETS
8.3 ELECTRICAL
8.3.1 CONTACT GASKETS
8.3.1.1 DYNAMIC GASKETS
8.3.1.1.1 COMPRESSING GASKETS FITTINGS
8.3.1.1.2 SHAFT GASKETS (ROTARY GASKETS)
8.3.1.1.3 HYDRAULIC AND PNEUMATIC GASKETS
8.3.1.1.4 MECHANICAL GASKETS
8.3.1.2 STATIC GASKETS
8.3.1.2.1 PROFILE GASKETS
8.3.1.2.2 O-RINGS
8.3.1.2.3 FLAT GASKETS AND GASKET PLATES
8.3.2 CONTACTLESS GASKETS
8.3.2.1 PRESSURE GASKETS
8.3.2.2 THROTTLE GASKETS
8.4 INDUSTRIAL MANUFACTURING
8.4.1 CONTACT GASKETS
8.4.1.1 DYNAMIC GASKETS
8.4.1.1.1 MECHANICAL GASKETS
8.4.1.1.2 SHAFT GASKETS (ROTARY GASKETS)
8.4.1.1.3 COMPRESSING GASKETS FITTINGS
8.4.1.1.4 HYDRAULIC AND PNEUMATIC GASKETS
8.4.1.2 STATIC GASKETS
8.4.1.2.1 O-RINGS
8.4.1.2.2 PROFILE GASKETS
8.4.1.2.3 FLAT GASKETS AND GASKET PLATES
8.4.2 CONTACTLESS GASKETS
8.4.2.1 PRESSURE GASKETS
8.4.2.2 THROTTLE GASKETS
8.5 OIL AND GAS
8.5.1 CONTACT GASKETS
8.5.1.1 DYNAMIC GASKETS
8.5.1.1.1 HYDRAULIC AND PNEUMATIC GASKETS
8.5.1.1.2 SHAFT GASKETS (ROTARY GASKETS)
8.5.1.1.3 COMPRESSING GASKETS FITTINGS
8.5.1.1.4 MECHANICAL GASKETS
8.5.1.2 STATIC GASKETS
8.5.1.2.1 O-RINGS
8.5.1.2.2 FLAT GASKETS AND GASKET PLATES
8.5.1.2.3 PROFILE GASKETS
8.5.2 CONTACTLESS GASKETS
8.5.2.1 PRESSURE GASKETS
8.5.2.2 THROTTLE GASKETS
8.6 AEROSPACE
8.6.1 CONTACT GASKETS
8.6.1.1 DYNAMIC GASKETS
8.6.1.1.1 COMPRESSING GASKETS FITTINGS
8.6.1.1.2 HYDRAULIC AND PNEUMATIC GASKETS
8.6.1.1.3 SHAFT GASKETS (ROTARY GASKETS)
8.6.1.1.4 MECHANICAL GASKETS
8.6.1.2 STATIC GASKETS
8.6.1.2.1 O-RINGS
8.6.1.2.2 PROFILE GASKETS
8.6.1.2.3 FLAT GASKETS AND GASKET PLATES
8.6.2 CONTACTLESS GASKETS
8.6.2.1 PRESSURE GASKETS
8.6.2.2 THROTTLE GASKETS
8.7 MARINE AND RAIL
8.7.1 CONTACT GASKETS
8.7.1.1 DYNAMIC GASKETS
8.7.1.1.1 HYDRAULIC AND PNEUMATIC GASKETS
8.7.1.1.2 SHAFT GASKETS (ROTARY GASKETS)
8.7.1.1.3 COMPRESSING GASKETS FITTINGS
8.7.1.1.4 MECHANICAL GASKETS
8.7.1.2 STATIC GASKETS
8.7.1.2.1 FLAT GASKETS AND GASKET PLATES
8.7.1.2.2 O-RINGS
8.7.1.2.3 PROFILE GASKETS
8.7.2 CONTACTLESS GASKETS
8.7.2.1 PRESSURE GASKETS
8.7.2.2 THROTTLE GASKETS
8.8 PAPER AND PULP INDUSTRY
8.8.1 CONTACT GASKETS
8.8.1.1 DYNAMIC GASKETS
8.8.1.1.1 MECHANICAL GASKETS
8.8.1.1.2 COMPRESSING GASKETS FITTINGS
8.8.1.1.3 HYDRAULIC AND PNEUMATIC GASKETS
8.8.1.1.4 SHAFT GASKETS (ROTARY GASKETS)
8.8.1.2 STATIC GASKETS
8.8.1.2.1 O-RINGS
8.8.1.2.2 PROFILE GASKETS
8.8.1.2.3 FLAT GASKETS AND GASKET PLATES
8.8.2 CONTACTLESS GASKETS
8.8.2.1 PRESSURE GASKETS
8.8.2.2 THROTTLE GASKETS
8.9 OTHERS
8.9.1 CONTACT GASKETS
8.9.1.1 DYNAMIC GASKETS
8.9.1.1.1 COMPRESSING GASKETS FITTINGS
8.9.1.1.2 SHAFT GASKETS (ROTARY GASKETS)
8.9.1.1.3 HYDRAULIC AND PNEUMATIC GASKETS
8.9.1.1.4 MECHANICAL GASKETS
8.9.1.2 STATIC GASKETS
8.9.1.2.1 O-RINGS
8.9.1.2.2 PROFILE GASKETS
8.9.1.2.3 FLAT GASKETS AND GASKET PLATES
8.9.2 CONTACTLESS GASKETS
8.9.2.1 PRESSURE GASKETS
8.9.2.2 THROTTLE GASKETS
9 ASIA PACIFIC GASKETS MARKET, BY REGION
9.1 ASIA-PACIFIC
9.1.1 CHINA
9.1.2 INDIA
9.1.3 JAPAN
9.1.4 SOUTH KOREA
9.1.5 THAILAND
9.1.6 SINGAPORE
9.1.7 INDONESIA
9.1.8 AUSTRALIA & NEW ZEALAND
9.1.9 PHILIPPINES
9.1.10 MALAYSIA
9.1.11 REST OF ASIA-PACIFIC
10 ASIA PACIFIC GASKETS MARKET COMPANY LANDSCAPE
10.1 COMPANY SHARE ANALYSIS:
10.2 ACHIEVEMENTS
10.3 CERTIFICATION
10.4 EXPANSION
10.5 ACQUISITIONS
10.6 AWARD
10.7 APPROVAL
10.8 NEW PRODUCT DEVELOPMENT
10.9 EVENT
11 SWOT ANALYSIS
12 COMPANY PROFILES
12.1 FREUDENBERG FST GMBH
12.1.1 COMPANY SNAPSHOT
12.1.2 REVENUE ANALYSIS
12.1.3 COMPANY SHARE ANALYSIS
12.1.4 SWOT
12.1.5 PRODUCT PORTFOLIO
12.1.6 RECENT DEVELOPMENTS
12.2 TRELLEBORG AB
12.2.1 COMPANY SNAPSHOT
12.2.2 REVENUE ANALYSIS
12.2.3 COMPANY SHARE ANALYSIS
12.2.4 SWOT
12.2.5 PRODUCT PORTFOLIO
12.2.6 RECENT DEVELOPMENTS
12.3 GARLOCK, AN ENPRO (NYSE: NPO) COMPANY
12.3.1 COMPANY SNAPSHOT
12.3.2 COMPANY SHARE ANALYSIS
12.3.3 SWOT
12.3.4 PRODUCT PORTFOLIO
12.3.5 RECENT DEVELOPMENT
12.4 ELRINGKLINGER AG
12.4.1 COMPANY SNAPSHOT
12.4.2 REVENUE ANALYSIS
12.4.3 COMPANY SHARE ANALYSIS
12.4.4 SWOT
12.4.5 PRODUCT PORTFOLIO
12.4.6 RECENT DEVELOPMENTS
12.5 BRUSS SEALING SYSTEMS GMBH
12.5.1 COMPANY SNAPSHOT
12.5.2 COMPANY SHARE ANALYSIS
12.5.3 SWOT
12.5.4 PRODUCT PORTFOLIO
12.5.5 RECENT DEVELOPMENT
12.6 A.J. RUBBER & SPONGE LTD.
12.6.1 COMPANY SNAPSHOT
12.6.2 SWOT
12.6.3 PRODUCT PORTFOLIO
12.6.4 RECENT DEVELOPMENT
12.7 GE MAO RUBBER INDUSTRIAL CO, LTD.
12.7.1 COMPANY SNAPSHOT
12.7.2 SWOT
12.7.3 PRODUCT PORTFOLIO
12.7.4 RECENT DEVELOPMENTS
12.8 HELIX ENGINEERING
12.8.1 COMPANY SNAPSHOT
12.8.2 SWOT
12.8.3 PRODUCT PORTFOLIO
12.8.4 RECENT DEVELOPMENT
12.9 IDT GMBH
12.9.1 COMPANY SNAPSHOT
12.9.2 SWOT
12.9.3 PRODUCT PORTFOLIO
12.9.4 RECENT DEVELOPMENTS
12.1 LAMONS LGC US ASSET HOLDINGS LLC
12.10.1 COMPANY SNAPSHOT
12.10.2 SWOT
12.10.3 PRODUCT PORTFOLIO
12.10.4 RECENT DEVELOPMENT
12.11 OHIO VALLEY GASKET INC.
12.11.1 COMPANY SNAPSHOT
12.11.2 SWOT
12.11.3 PRODUCT PORTFOLIO
12.11.4 RECENT DEVELOPMENT
12.12 SEAL & DESIGN INC.
12.12.1 COMPANY SNAPSHOT
12.12.2 SWOT
12.12.3 PRODUCT PORTFOLIO
12.12.4 RECENT DEVELOPMENT
12.13 SSP MANUFACTURING INC.
12.13.1 COMPANY SNAPSHOT
12.13.2 SWOT
12.13.3 PRODUCT PORTFOLIO
12.13.4 RECENT DEVELOPMENT
12.14 THE TOPOG-E-GASKET CO
12.14.1 COMPANY SNAPSHOT
12.14.2 SWOT
12.14.3 PRODUCT PORTFOLIO
12.14.4 RECENT DEVELOPMENT
12.15 W.L.GORE & ASSOCIATES, INC.
12.15.1 COMPANY SNAPSHOT
12.15.2 SWOT
12.15.3 PRODUCT PORTFOLIO
12.15.4 RECENT DEVELOPMENT
13 QUESTIONNAIRE
14 RELATED REPORTS
Lista de Tablas
TABLE 1 REGULATORY FRAMEWORK
TABLE 2 ASIA PACIFIC GASKETS MARKET, BY TYPE, 2021-2030 (USD MILLION)
TABLE 3 ASIA PACIFIC GASKETS MARKET, BY TYPE, 2021-2030 (MILLION UNITS)
TABLE 4 ASIA PACIFIC CONTACT GASKETS IN GASKETS MARKET, BY REGION, 2021-2030 (USD MILLION)
TABLE 5 ASIA PACIFIC CONTACT GASKETS IN GASKETS MARKET, BY REGION, 2021-2030 (MILLION UNITS)
TABLE 6 ASIA PACIFIC CONTACT GASKETS IN GASKETS MARKET, BY TYPE, 2021-2030 (USD MILLION)
TABLE 7 ASIA PACIFIC DYNAMIC GASKETS IN GASKETS MARKET, BY TYPE, 2021-2030 (USD MILLION)
TABLE 8 ASIA PACIFIC STATIC GASKETS IN GASKETS MARKET, BY TYPE, 2021-2030 (USD MILLION)
TABLE 9 ASIA PACIFIC CONTACTLESS GASKETS IN GASKETS MARKET, BY REGION, 2021-2030 (USD MILLION)
TABLE 10 ASIA PACIFIC CONTACTLESS GASKETS IN GASKETS MARKET, BY REGION, 2021-2030 (MILLION UNITS)
TABLE 11 ASIA PACIFIC CONTACTLESS GASKETS IN GASKETS MARKET, BY TYPE, 2021-2030 (USD MILLION)
TABLE 12 ASIA PACIFIC GASKETS MARKET, BY INDUSTRY, 2021-2030 (USD MILLION)
TABLE 13 ASIA PACIFIC AUTOMOTIVE IN GASKETS MARKET, BY REGION, 2021-2030 (USD MILLION)
TABLE 14 ASIA PACIFIC AUTOMOTIVE IN GASKETS MARKET, BY TYPE, 2021-2030 (USD MILLION)
TABLE 15 ASIA PACIFIC CONTACT GASKETS IN GASKETS MARKET, BY TYPE, 2021-2030 (USD MILLION)
TABLE 16 ASIA PACIFIC DYNAMIC GASKETS IN GASKETS MARKET, BY TYPE, 2021-2030 (USD MILLION)
TABLE 17 ASIA PACIFIC STATIC GASKETS IN GASKETS MARKET, BY TYPE, 2021-2030 (USD MILLION)
TABLE 18 ASIA PACIFIC CONTACTLESS GASKETS IN GASKETS MARKET, BY TYPE, 2021-2030 (USD MILLION)
TABLE 19 ASIA PACIFIC ELECTRICAL IN GASKETS MARKET, BY REGION, 2021-2030 (USD MILLION)
TABLE 20 ASIA PACIFIC ELECTRICAL IN GASKETS MARKET, BY TYPE, 2021-2030 (USD MILLION)
TABLE 21 ASIA PACIFIC CONTACT GASKETS IN GASKETS MARKET, BY TYPE, 2021-2030 (USD MILLION)
TABLE 22 ASIA PACIFIC DYNAMIC GASKETS IN GASKETS MARKET, BY TYPE, 2021-2030 (USD MILLION)
TABLE 23 ASIA PACIFIC STATIC GASKETS IN GASKETS MARKET, BY TYPE, 2021-2030 (USD MILLION)
TABLE 24 ASIA PACIFIC CONTACTLESS GASKETS IN GASKETS MARKET, BY TYPE, 2021-2030 (USD MILLION)
TABLE 25 ASIA PACIFIC INDUSTRIAL MANUFACTURING IN GASKETS MARKET, BY REGION, 2021-2030 (USD MILLION)
TABLE 26 ASIA PACIFIC INDUSTRIAL MANUFACTURING IN GASKETS MARKET, BY TYPE, 2021-2030 (USD MILLION)
TABLE 27 ASIA PACIFIC CONTACT GASKETS IN GASKETS MARKET, BY TYPE, 2021-2030 (USD MILLION)
TABLE 28 ASIA PACIFIC DYNAMIC GASKETS IN GASKETS MARKET, BY TYPE, 2021-2030 (USD MILLION)
TABLE 29 ASIA PACIFIC STATIC GASKETS IN GASKETS MARKET, BY TYPE, 2021-2030 (USD MILLION)
TABLE 30 ASIA PACIFIC CONTACTLESS GASKETS IN GASKETS MARKET, BY TYPE, 2021-2030 (USD MILLION)
TABLE 31 ASIA PACIFIC OIL AND GAS IN GASKETS MARKET, BY REGION, 2021-2030 (USD MILLION)
TABLE 32 ASIA PACIFIC OIL AND GAS IN GASKETS MARKET, BY TYPE, 2021-2030 (USD MILLION)
TABLE 33 ASIA PACIFIC CONTACT GASKETS IN GASKETS MARKET, BY TYPE, 2021-2030 (USD MILLION)
TABLE 34 ASIA PACIFIC DYNAMIC GASKETS IN GASKETS MARKET, BY TYPE, 2021-2030 (USD MILLION)
TABLE 35 ASIA PACIFIC STATIC GASKETS IN GASKETS MARKET, BY TYPE, 2021-2030 (USD MILLION)
TABLE 36 ASIA PACIFIC CONTACTLESS GASKETS IN GASKETS MARKET, BY TYPE, 2021-2030 (USD MILLION)
TABLE 37 ASIA PACIFIC AEROSPACE IN GASKETS MARKET, BY REGION, 2021-2030 (USD MILLION)
TABLE 38 ASIA PACIFIC AEROSPACE IN GASKETS MARKET, BY TYPE, 2021-2030 (USD MILLION)
TABLE 39 ASIA PACIFIC CONTACT GASKETS IN GASKETS MARKET, BY TYPE, 2021-2030 (USD MILLION)
TABLE 40 ASIA PACIFIC DYNAMIC GASKETS IN GASKETS MARKET, BY TYPE, 2021-2030 (USD MILLION)
TABLE 41 ASIA PACIFIC STATIC GASKETS IN GASKETS MARKET, BY TYPE, 2021-2030 (USD MILLION)
TABLE 42 ASIA PACIFIC CONTACTLESS GASKETS IN GASKETS MARKET, BY TYPE, 2021-2030 (USD MILLION)
TABLE 43 ASIA PACIFIC MARINE AND RAIL IN GASKETS MARKET, BY REGION, 2021-2030 (USD MILLION)
TABLE 44 ASIA PACIFIC MARINE AND RAIL IN GASKETS MARKET, BY TYPE, 2021-2030 (USD MILLION)
TABLE 45 ASIA PACIFIC CONTACT GASKETS IN GASKETS MARKET, BY TYPE, 2021-2030 (USD MILLION)
TABLE 46 ASIA PACIFIC DYNAMIC GASKETS IN GASKETS MARKET, BY TYPE, 2021-2030 (USD MILLION)
TABLE 47 ASIA PACIFIC STATIC GASKETS IN GASKETS MARKET, BY TYPE, 2021-2030 (USD MILLION)
TABLE 48 ASIA PACIFIC CONTACTLESS GASKETS IN GASKETS MARKET, BY TYPE, 2021-2030 (USD MILLION)
TABLE 49 ASIA PACIFIC PAPER AND PULP INDUSTRY IN GASKETS MARKET, BY REGION, 2021-2030 (USD MILLION)
TABLE 50 ASIA PACIFIC PAPER AND PULP INDUSTRY IN GASKETS MARKET, BY TYPE, 2021-2030 (USD MILLION)
TABLE 51 ASIA PACIFIC CONTACT GASKETS IN GASKETS MARKET, BY TYPE, 2021-2030 (USD MILLION)
TABLE 52 ASIA PACIFIC DYNAMIC GASKETS IN GASKETS MARKET, BY TYPE, 2021-2030 (USD MILLION)
TABLE 53 ASIA PACIFIC STATIC GASKETS IN GASKETS MARKET, BY TYPE, 2021-2030 (USD MILLION)
TABLE 54 ASIA PACIFIC CONTACTLESS GASKETS IN GASKETS MARKET, BY TYPE, 2021-2030 (USD MILLION)
TABLE 55 ASIA PACIFIC OTHERS IN GASKETS MARKET, BY REGION, 2021-2030 (USD MILLION)
TABLE 56 ASIA PACIFIC OTHERS IN GASKETS MARKET, BY TYPE, 2021-2030 (USD MILLION)
TABLE 57 ASIA PACIFIC CONTACT GASKETS IN GASKETS MARKET, BY TYPE, 2021-2030 (USD MILLION)
TABLE 58 ASIA PACIFIC DYNAMIC GASKETS IN GASKETS MARKET, BY TYPE, 2021-2030 (USD MILLION)
TABLE 59 ASIA PACIFIC STATIC GASKETS IN GASKETS MARKET, BY TYPE, 2021-2030 (USD MILLION)
TABLE 60 ASIA PACIFIC CONTACTLESS GASKETS IN GASKETS MARKET, BY TYPE, 2021-2030 (USD MILLION)
TABLE 61 ASIA-PACIFIC GASKETS MARKET, BY COUNTRY, 2021-2030 (USD MILLION)
TABLE 62 ASIA-PACIFIC GASKETS MARKET, BY COUNTRY, 2021-2030 (MILLION UNITS)
TABLE 63 ASIA-PACIFIC GASKETS MARKET, BY TYPE, 2021-2030 (USD MILLION)
TABLE 64 ASIA-PACIFIC GASKETS MARKET, BY TYPE, 2021-2030 (MILLION UNITS)
TABLE 65 ASIA-PACIFIC CONTACT GASKETS IN GASKETS MARKET, BY TYPE, 2021-2030 (USD MILLION)
TABLE 66 ASIA-PACIFIC STATIC GASKETS IN GASKETS MARKET, BY TYPE, 2021-2030 (USD MILLION)
TABLE 67 ASIA-PACIFIC DYNAMIC GASKETS IN GASKETS MARKET, BY TYPE, 2021-2030 (USD MILLION)
TABLE 68 ASIA-PACIFIC CONTACTLESS GASKETS IN GASKETS MARKET, BY TYPE, 2021-2030 (USD MILLION)
TABLE 69 ASIA-PACIFIC GASKETS MARKET, BY INDUSTRY, 2021-2030 (USD MILLION)
TABLE 70 ASIA-PACIFIC AUTOMOTIVE IN GASKETS MARKET, BY TYPE, 2021-2030 (USD MILLION)
TABLE 71 ASIA-PACIFIC CONTACT GASKETS IN GASKETS MARKET, BY TYPE, 2021-2030 (USD MILLION)
TABLE 72 ASIA-PACIFIC STATIC GASKETS IN GASKETS MARKET, BY TYPE, 2021-2030 (USD MILLION)
TABLE 73 ASIA-PACIFIC DYNAMIC GASKETS IN GASKETS MARKET, BY TYPE, 2021-2030 (USD MILLION)
TABLE 74 ASIA-PACIFIC CONTACTLESS GASKETS IN GASKETS MARKET, BY TYPE, 2021-2030 (USD MILLION)
TABLE 75 ASIA-PACIFIC ELECTRICAL IN GASKETS MARKET, BY TYPE, 2021-2030 (USD MILLION)
TABLE 76 ASIA-PACIFIC CONTACT GASKETS IN GASKETS MARKET, BY TYPE, 2021-2030 (USD MILLION)
TABLE 77 ASIA-PACIFIC STATIC GASKETS IN GASKETS MARKET, BY TYPE, 2021-2030 (USD MILLION)
TABLE 78 ASIA-PACIFIC DYNAMIC GASKETS IN GASKETS MARKET, BY TYPE, 2021-2030 (USD MILLION)
TABLE 79 ASIA-PACIFIC CONTACTLESS GASKETS IN GASKETS MARKET, BY TYPE, 2021-2030 (USD MILLION)
TABLE 80 ASIA-PACIFIC INDUSTRIAL MANUFACTURING IN GASKETS MARKET, BY TYPE, 2021-2030 (USD MILLION)
TABLE 81 ASIA-PACIFIC CONTACT GASKETS IN GASKETS MARKET, BY TYPE, 2021-2030 (USD MILLION)
TABLE 82 ASIA-PACIFIC STATIC GASKETS IN GASKETS MARKET, BY TYPE, 2021-2030 (USD MILLION)
TABLE 83 ASIA-PACIFIC DYNAMIC GASKETS IN GASKETS MARKET, BY TYPE, 2021-2030 (USD MILLION)
TABLE 84 ASIA-PACIFIC CONTACTLESS GASKETS IN GASKETS MARKET, BY TYPE, 2021-2030 (USD MILLION)
TABLE 85 ASIA-PACIFIC OIL AND GAS IN GASKETS MARKET, BY TYPE, 2021-2030 (USD MILLION)
TABLE 86 ASIA-PACIFIC CONTACT GASKETS IN GASKETS MARKET, BY TYPE, 2021-2030 (USD MILLION)
TABLE 87 ASIA-PACIFIC STATIC GASKETS IN GASKETS MARKET, BY TYPE, 2021-2030 (USD MILLION)
TABLE 88 ASIA-PACIFIC DYNAMIC GASKETS IN GASKETS MARKET, BY TYPE, 2021-2030 (USD MILLION)
TABLE 89 ASIA-PACIFIC CONTACTLESS GASKETS IN GASKETS MARKET, BY TYPE, 2021-2030 (USD MILLION)
TABLE 90 ASIA-PACIFIC AEROSPACE IN GASKETS MARKET, BY TYPE, 2021-2030 (USD MILLION)
TABLE 91 ASIA-PACIFIC CONTACT GASKETS IN GASKETS MARKET, BY TYPE, 2021-2030 (USD MILLION)
TABLE 92 ASIA-PACIFIC STATIC GASKETS IN GASKETS MARKET, BY TYPE, 2021-2030 (USD MILLION)
TABLE 93 ASIA-PACIFIC DYNAMIC GASKETS IN GASKETS MARKET, BY TYPE, 2021-2030 (USD MILLION)
TABLE 94 ASIA-PACIFIC CONTACTLESS GASKETS MARKET, BY TYPE, 2021-2030 (USD MILLION)
TABLE 95 ASIA-PACIFIC MARINE AND RAIL IN GASKETS MARKET, BY TYPE, 2021-2030 (USD MILLION)
TABLE 96 ASIA-PACIFIC CONTACT GASKETS IN GASKETS MARKET, BY TYPE, 2021-2030 (USD MILLION)
TABLE 97 ASIA-PACIFIC STATIC GASKETS IN GASKETS MARKET, BY TYPE, 2021-2030 (USD MILLION)
TABLE 98 ASIA-PACIFIC DYNAMIC GASKETS IN GASKETS MARKET, BY TYPE, 2021-2030 (USD MILLION)
TABLE 99 ASIA-PACIFIC CONTACTLESS GASKETS IN GASKETS MARKET, BY TYPE, 2021-2030 (USD MILLION)
TABLE 100 ASIA-PACIFIC PAPER AND PULP INDUSTRY IN GASKETS MARKET, BY TYPE, 2021-2030 (USD MILLION)
TABLE 101 ASIA-PACIFIC CONTACT GASKETS IN GASKETS MARKET, BY TYPE, 2021-2030 (USD MILLION)
TABLE 102 ASIA-PACIFIC STATIC GASKETS IN GASKETS MARKET, BY TYPE, 2021-2030 (USD MILLION)
TABLE 103 ASIA-PACIFIC DYNAMIC GASKETS IN GASKETS MARKET, BY TYPE, 2021-2030 (USD MILLION)
TABLE 104 ASIA-PACIFIC CONTACTLESS GASKETS IN GASKETS MARKET, BY TYPE, 2021-2030 (USD MILLION)
TABLE 105 ASIA-PACIFIC OTHERS IN GASKETS MARKET, BY TYPE, 2021-2030 (USD MILLION)
TABLE 106 ASIA-PACIFIC CONTACT GASKETS IN GASKETS MARKET, BY TYPE, 2021-2030 (USD MILLION)
TABLE 107 ASIA-PACIFIC STATIC GASKETS IN GASKETS MARKET, BY TYPE, 2021-2030 (USD MILLION)
TABLE 108 ASIA-PACIFIC DYNAMIC GASKETS IN GASKETS MARKET, BY TYPE, 2021-2030 (USD MILLION)
TABLE 109 ASIA-PACIFIC CONTACTLESS GASKETS IN GASKETS MARKET, BY TYPE, 2021-2030 (USD MILLION)
TABLE 110 CHINA GASKETS MARKET, BY TYPE, 2021-2030 (USD MILLION)
TABLE 111 CHINA GASKETS MARKET, BY TYPE, 2021-2030 (MILLION UNITS)
TABLE 112 CHINA CONTACT GASKETS IN GASKETS MARKET, BY TYPE, 2021-2030 (USD MILLION)
TABLE 113 CHINA STATIC GASKETS IN GASKETS MARKET, BY TYPE, 2021-2030 (USD MILLION)
TABLE 114 CHINA DYNAMIC GASKETS IN GASKETS MARKET, BY TYPE, 2021-2030 (USD MILLION)
TABLE 115 CHINA CONTACTLESS GASKETS IN GASKETS MARKET, BY TYPE, 2021-2030 (USD MILLION)
TABLE 116 CHINA GASKETS MARKET, BY INDUSTRY, 2021-2030 (USD MILLION)
TABLE 117 CHINA AUTOMOTIVE IN GASKETS MARKET, BY TYPE, 2021-2030 (USD MILLION)
TABLE 118 CHINA CONTACT GASKETS IN GASKETS MARKET, BY TYPE, 2021-2030 (USD MILLION)
TABLE 119 CHINA STATIC GASKETS IN GASKETS MARKET, BY TYPE, 2021-2030 (USD MILLION)
TABLE 120 CHINA DYNAMIC GASKETS IN GASKETS MARKET, BY TYPE, 2021-2030 (USD MILLION)
TABLE 121 CHINA CONTACTLESS GASKETS IN GASKETS MARKET, BY TYPE, 2021-2030 (USD MILLION)
TABLE 122 CHINA ELECTRICAL IN GASKETS MARKET, BY TYPE, 2021-2030 (USD MILLION)
TABLE 123 CHINA CONTACT GASKETS IN GASKETS MARKET, BY TYPE, 2021-2030 (USD MILLION)
TABLE 124 CHINA STATIC GASKETS IN GASKETS MARKET, BY TYPE, 2021-2030 (USD MILLION)
TABLE 125 CHINA DYNAMIC GASKETS IN GASKETS MARKET, BY TYPE, 2021-2030 (USD MILLION)
TABLE 126 CHINA CONTACTLESS GASKETS IN GASKETS MARKET, BY TYPE, 2021-2030 (USD MILLION)
TABLE 127 CHINA INDUSTRIAL MANUFACTURING IN GASKETS MARKET, BY TYPE, 2021-2030 (USD MILLION)
TABLE 128 CHINA CONTACT GASKETS IN GASKETS MARKET, BY TYPE, 2021-2030 (USD MILLION)
TABLE 129 CHINA STATIC GASKETS IN GASKETS MARKET, BY TYPE, 2021-2030 (USD MILLION)
TABLE 130 CHINA DYNAMIC GASKETS IN GASKETS MARKET, BY TYPE, 2021-2030 (USD MILLION)
TABLE 131 CHINA CONTACTLESS GASKETS IN GASKETS MARKET, BY TYPE, 2021-2030 (USD MILLION)
TABLE 132 CHINA OIL AND GAS IN GASKETS MARKET, BY TYPE, 2021-2030 (USD MILLION)
TABLE 133 CHINA CONTACT GASKETS IN GASKETS MARKET, BY TYPE, 2021-2030 (USD MILLION)
TABLE 134 CHINA STATIC GASKETS IN GASKETS MARKET, BY TYPE, 2021-2030 (USD MILLION)
TABLE 135 CHINA DYNAMIC GASKETS IN GASKETS MARKET, BY TYPE, 2021-2030 (USD MILLION)
TABLE 136 CHINA CONTACTLESS GASKETS IN GASKETS MARKET, BY TYPE, 2021-2030 (USD MILLION)
TABLE 137 CHINA AEROSPACE IN GASKETS MARKET, BY TYPE, 2021-2030 (USD MILLION)
TABLE 138 CHINA CONTACT GASKETS IN GASKETS MARKET, BY TYPE, 2021-2030 (USD MILLION)
TABLE 139 CHINA STATIC GASKETS IN GASKETS MARKET, BY TYPE, 2021-2030 (USD MILLION)
TABLE 140 CHINA DYNAMIC GASKETS IN GASKETS MARKET, BY TYPE, 2021-2030 (USD MILLION)
TABLE 141 CHINA CONTACTLESS GASKETS MARKET, BY TYPE, 2021-2030 (USD MILLION)
TABLE 142 CHINA MARINE AND RAIL IN GASKETS MARKET, BY TYPE, 2021-2030 (USD MILLION)
TABLE 143 CHINA CONTACT GASKETS IN GASKETS MARKET, BY TYPE, 2021-2030 (USD MILLION)
TABLE 144 CHINA STATIC GASKETS IN GASKETS MARKET, BY TYPE, 2021-2030 (USD MILLION)
TABLE 145 CHINA DYNAMIC GASKETS IN GASKETS MARKET, BY TYPE, 2021-2030 (USD MILLION)
TABLE 146 CHINA CONTACTLESS GASKETS IN GASKETS MARKET, BY TYPE, 2021-2030 (USD MILLION)
TABLE 147 CHINA PAPER AND PULP INDUSTRY IN GASKETS MARKET, BY TYPE, 2021-2030 (USD MILLION)
TABLE 148 CHINA CONTACT GASKETS IN GASKETS MARKET, BY TYPE, 2021-2030 (USD MILLION)
TABLE 149 CHINA STATIC GASKETS IN GASKETS MARKET, BY TYPE, 2021-2030 (USD MILLION)
TABLE 150 CHINA DYNAMIC GASKETS IN GASKETS MARKET, BY TYPE, 2021-2030 (USD MILLION)
TABLE 151 CHINA CONTACTLESS GASKETS IN GASKETS MARKET, BY TYPE, 2021-2030 (USD MILLION)
TABLE 152 CHINA OTHERS IN GASKETS MARKET, BY TYPE, 2021-2030 (USD MILLION)
TABLE 153 CHINA CONTACT GASKETS IN GASKETS MARKET, BY TYPE, 2021-2030 (USD MILLION)
TABLE 154 CHINA STATIC GASKETS IN GASKETS MARKET, BY TYPE, 2021-2030 (USD MILLION)
TABLE 155 CHINA DYNAMIC GASKETS IN GASKETS MARKET, BY TYPE, 2021-2030 (USD MILLION)
TABLE 156 CHINA CONTACTLESS GASKETS IN GASKETS MARKET, BY TYPE, 2021-2030 (USD MILLION)
TABLE 157 INDIA GASKETS MARKET, BY TYPE, 2021-2030 (USD MILLION)
TABLE 158 INDIA GASKETS MARKET, BY TYPE, 2021-2030 (MILLION UNITS)
TABLE 159 INDIA CONTACT GASKETS IN GASKETS MARKET, BY TYPE, 2021-2030 (USD MILLION)
TABLE 160 INDIA STATIC GASKETS IN GASKETS MARKET, BY TYPE, 2021-2030 (USD MILLION)
TABLE 161 INDIA DYNAMIC GASKETS IN GASKETS MARKET, BY TYPE, 2021-2030 (USD MILLION)
TABLE 162 INDIA CONTACTLESS GASKETS IN GASKETS MARKET, BY TYPE, 2021-2030 (USD MILLION)
TABLE 163 INDIA GASKETS MARKET, BY INDUSTRY, 2021-2030 (USD MILLION)
TABLE 164 INDIA AUTOMOTIVE IN GASKETS MARKET, BY TYPE, 2021-2030 (USD MILLION)
TABLE 165 INDIA CONTACT GASKETS IN GASKETS MARKET, BY TYPE, 2021-2030 (USD MILLION)
TABLE 166 INDIA STATIC GASKETS IN GASKETS MARKET, BY TYPE, 2021-2030 (USD MILLION)
TABLE 167 INDIA DYNAMIC GASKETS IN GASKETS MARKET, BY TYPE, 2021-2030 (USD MILLION)
TABLE 168 INDIA CONTACTLESS GASKETS IN GASKETS MARKET, BY TYPE, 2021-2030 (USD MILLION)
TABLE 169 INDIA ELECTRICAL IN GASKETS MARKET, BY TYPE, 2021-2030 (USD MILLION)
TABLE 170 INDIA CONTACT GASKETS IN GASKETS MARKET, BY TYPE, 2021-2030 (USD MILLION)
TABLE 171 INDIA STATIC GASKETS IN GASKETS MARKET, BY TYPE, 2021-2030 (USD MILLION)
TABLE 172 INDIA DYNAMIC GASKETS IN GASKETS MARKET, BY TYPE, 2021-2030 (USD MILLION)
TABLE 173 INDIA CONTACTLESS GASKETS IN GASKETS MARKET, BY TYPE, 2021-2030 (USD MILLION)
TABLE 174 INDIA INDUSTRIAL MANUFACTURING IN GASKETS MARKET, BY TYPE, 2021-2030 (USD MILLION)
TABLE 175 INDIA CONTACT GASKETS IN GASKETS MARKET, BY TYPE, 2021-2030 (USD MILLION)
TABLE 176 INDIA STATIC GASKETS IN GASKETS MARKET, BY TYPE, 2021-2030 (USD MILLION)
TABLE 177 INDIA DYNAMIC GASKETS IN GASKETS MARKET, BY TYPE, 2021-2030 (USD MILLION)
TABLE 178 INDIA CONTACTLESS GASKETS IN GASKETS MARKET, BY TYPE, 2021-2030 (USD MILLION)
TABLE 179 INDIA OIL AND GAS IN GASKETS MARKET, BY TYPE, 2021-2030 (USD MILLION)
TABLE 180 INDIA CONTACT GASKETS IN GASKETS MARKET, BY TYPE, 2021-2030 (USD MILLION)
TABLE 181 INDIA STATIC GASKETS IN GASKETS MARKET, BY TYPE, 2021-2030 (USD MILLION)
TABLE 182 INDIA DYNAMIC GASKETS IN GASKETS MARKET, BY TYPE, 2021-2030 (USD MILLION)
TABLE 183 INDIA CONTACTLESS GASKETS IN GASKETS MARKET, BY TYPE, 2021-2030 (USD MILLION)
TABLE 184 INDIA AEROSPACE IN GASKETS MARKET, BY TYPE, 2021-2030 (USD MILLION)
TABLE 185 INDIA CONTACT GASKETS IN GASKETS MARKET, BY TYPE, 2021-2030 (USD MILLION)
TABLE 186 INDIA STATIC GASKETS IN GASKETS MARKET, BY TYPE, 2021-2030 (USD MILLION)
TABLE 187 INDIA DYNAMIC GASKETS IN GASKETS MARKET, BY TYPE, 2021-2030 (USD MILLION)
TABLE 188 INDIA CONTACTLESS GASKETS MARKET, BY TYPE, 2021-2030 (USD MILLION)
TABLE 189 INDIA MARINE AND RAIL IN GASKETS MARKET, BY TYPE, 2021-2030 (USD MILLION)
TABLE 190 INDIA CONTACT GASKETS IN GASKETS MARKET, BY TYPE, 2021-2030 (USD MILLION)
TABLE 191 INDIA STATIC GASKETS IN GASKETS MARKET, BY TYPE, 2021-2030 (USD MILLION)
TABLE 192 INDIA DYNAMIC GASKETS IN GASKETS MARKET, BY TYPE, 2021-2030 (USD MILLION)
TABLE 193 INDIA CONTACTLESS GASKETS IN GASKETS MARKET, BY TYPE, 2021-2030 (USD MILLION)
TABLE 194 INDIA PAPER AND PULP INDUSTRY IN GASKETS MARKET, BY TYPE, 2021-2030 (USD MILLION)
TABLE 195 INDIA CONTACT GASKETS IN GASKETS MARKET, BY TYPE, 2021-2030 (USD MILLION)
TABLE 196 INDIA STATIC GASKETS IN GASKETS MARKET, BY TYPE, 2021-2030 (USD MILLION)
TABLE 197 INDIA DYNAMIC GASKETS IN GASKETS MARKET, BY TYPE, 2021-2030 (USD MILLION)
TABLE 198 INDIA CONTACTLESS GASKETS IN GASKETS MARKET, BY TYPE, 2021-2030 (USD MILLION)
TABLE 199 INDIA OTHERS IN GASKETS MARKET, BY TYPE, 2021-2030 (USD MILLION)
TABLE 200 INDIA CONTACT GASKETS IN GASKETS MARKET, BY TYPE, 2021-2030 (USD MILLION)
TABLE 201 INDIA STATIC GASKETS IN GASKETS MARKET, BY TYPE, 2021-2030 (USD MILLION)
TABLE 202 INDIA DYNAMIC GASKETS IN GASKETS MARKET, BY TYPE, 2021-2030 (USD MILLION)
TABLE 203 INDIA CONTACTLESS GASKETS IN GASKETS MARKET, BY TYPE, 2021-2030 (USD MILLION)
TABLE 204 JAPAN GASKETS MARKET, BY TYPE, 2021-2030 (USD MILLION)
TABLE 205 JAPAN GASKETS MARKET, BY TYPE, 2021-2030 (MILLION UNITS)
TABLE 206 JAPAN CONTACT GASKETS IN GASKETS MARKET, BY TYPE, 2021-2030 (USD MILLION)
TABLE 207 JAPAN STATIC GASKETS IN GASKETS MARKET, BY TYPE, 2021-2030 (USD MILLION)
TABLE 208 JAPAN DYNAMIC GASKETS IN GASKETS MARKET, BY TYPE, 2021-2030 (USD MILLION)
TABLE 209 JAPAN CONTACTLESS GASKETS IN GASKETS MARKET, BY TYPE, 2021-2030 (USD MILLION)
TABLE 210 JAPAN GASKETS MARKET, BY INDUSTRY, 2021-2030 (USD MILLION)
TABLE 211 JAPAN AUTOMOTIVE IN GASKETS MARKET, BY TYPE, 2021-2030 (USD MILLION)
TABLE 212 JAPAN CONTACT GASKETS IN GASKETS MARKET, BY TYPE, 2021-2030 (USD MILLION)
TABLE 213 JAPAN STATIC GASKETS IN GASKETS MARKET, BY TYPE, 2021-2030 (USD MILLION)
TABLE 214 JAPAN DYNAMIC GASKETS IN GASKETS MARKET, BY TYPE, 2021-2030 (USD MILLION)
TABLE 215 JAPAN CONTACTLESS GASKETS IN GASKETS MARKET, BY TYPE, 2021-2030 (USD MILLION)
TABLE 216 JAPAN ELECTRICAL IN GASKETS MARKET, BY TYPE, 2021-2030 (USD MILLION)
TABLE 217 JAPAN CONTACT GASKETS IN GASKETS MARKET, BY TYPE, 2021-2030 (USD MILLION)
TABLE 218 JAPAN STATIC GASKETS IN GASKETS MARKET, BY TYPE, 2021-2030 (USD MILLION)
TABLE 219 JAPAN DYNAMIC GASKETS IN GASKETS MARKET, BY TYPE, 2021-2030 (USD MILLION)
TABLE 220 JAPAN CONTACTLESS GASKETS IN GASKETS MARKET, BY TYPE, 2021-2030 (USD MILLION)
TABLE 221 JAPAN INDUSTRIAL MANUFACTURING IN GASKETS MARKET, BY TYPE, 2021-2030 (USD MILLION)
TABLE 222 JAPAN CONTACT GASKETS IN GASKETS MARKET, BY TYPE, 2021-2030 (USD MILLION)
TABLE 223 JAPAN STATIC GASKETS IN GASKETS MARKET, BY TYPE, 2021-2030 (USD MILLION)
TABLE 224 JAPAN DYNAMIC GASKETS IN GASKETS MARKET, BY TYPE, 2021-2030 (USD MILLION)
TABLE 225 JAPAN CONTACTLESS GASKETS IN GASKETS MARKET, BY TYPE, 2021-2030 (USD MILLION)
TABLE 226 JAPAN OIL AND GAS IN GASKETS MARKET, BY TYPE, 2021-2030 (USD MILLION)
TABLE 227 JAPAN CONTACT GASKETS IN GASKETS MARKET, BY TYPE, 2021-2030 (USD MILLION)
TABLE 228 JAPAN STATIC GASKETS IN GASKETS MARKET, BY TYPE, 2021-2030 (USD MILLION)
TABLE 229 JAPAN DYNAMIC GASKETS IN GASKETS MARKET, BY TYPE, 2021-2030 (USD MILLION)
TABLE 230 JAPAN CONTACTLESS GASKETS IN GASKETS MARKET, BY TYPE, 2021-2030 (USD MILLION)
TABLE 231 JAPAN AEROSPACE IN GASKETS MARKET, BY TYPE, 2021-2030 (USD MILLION)
TABLE 232 JAPAN CONTACT GASKETS IN GASKETS MARKET, BY TYPE, 2021-2030 (USD MILLION)
TABLE 233 JAPAN STATIC GASKETS IN GASKETS MARKET, BY TYPE, 2021-2030 (USD MILLION)
TABLE 234 JAPAN DYNAMIC GASKETS IN GASKETS MARKET, BY TYPE, 2021-2030 (USD MILLION)
TABLE 235 JAPAN CONTACTLESS GASKETS MARKET, BY TYPE, 2021-2030 (USD MILLION)
TABLE 236 JAPAN MARINE AND RAIL IN GASKETS MARKET, BY TYPE, 2021-2030 (USD MILLION)
TABLE 237 JAPAN CONTACT GASKETS IN GASKETS MARKET, BY TYPE, 2021-2030 (USD MILLION)
TABLE 238 JAPAN STATIC GASKETS IN GASKETS MARKET, BY TYPE, 2021-2030 (USD MILLION)
TABLE 239 JAPAN DYNAMIC GASKETS IN GASKETS MARKET, BY TYPE, 2021-2030 (USD MILLION)
TABLE 240 JAPAN CONTACTLESS GASKETS IN GASKETS MARKET, BY TYPE, 2021-2030 (USD MILLION)
TABLE 241 JAPAN PAPER AND PULP INDUSTRY IN GASKETS MARKET, BY TYPE, 2021-2030 (USD MILLION)
TABLE 242 JAPAN CONTACT GASKETS IN GASKETS MARKET, BY TYPE, 2021-2030 (USD MILLION)
TABLE 243 JAPAN STATIC GASKETS IN GASKETS MARKET, BY TYPE, 2021-2030 (USD MILLION)
TABLE 244 JAPAN DYNAMIC GASKETS IN GASKETS MARKET, BY TYPE, 2021-2030 (USD MILLION)
TABLE 245 JAPAN CONTACTLESS GASKETS IN GASKETS MARKET, BY TYPE, 2021-2030 (USD MILLION)
TABLE 246 JAPAN OTHERS IN GASKETS MARKET, BY TYPE, 2021-2030 (USD MILLION)
TABLE 247 JAPAN CONTACT GASKETS IN GASKETS MARKET, BY TYPE, 2021-2030 (USD MILLION)
TABLE 248 JAPAN STATIC GASKETS IN GASKETS MARKET, BY TYPE, 2021-2030 (USD MILLION)
TABLE 249 JAPAN DYNAMIC GASKETS IN GASKETS MARKET, BY TYPE, 2021-2030 (USD MILLION)
TABLE 250 JAPAN CONTACTLESS GASKETS IN GASKETS MARKET, BY TYPE, 2021-2030 (USD MILLION)
TABLE 251 SOUTH KOREA GASKETS MARKET, BY TYPE, 2021-2030 (USD MILLION)
TABLE 252 SOUTH KOREA GASKETS MARKET, BY TYPE, 2021-2030 (MILLION UNITS)
TABLE 253 SOUTH KOREA CONTACT GASKETS IN GASKETS MARKET, BY TYPE, 2021-2030 (USD MILLION)
TABLE 254 SOUTH KOREA STATIC GASKETS IN GASKETS MARKET, BY TYPE, 2021-2030 (USD MILLION)
TABLE 255 SOUTH KOREA DYNAMIC GASKETS IN GASKETS MARKET, BY TYPE, 2021-2030 (USD MILLION)
TABLE 256 SOUTH KOREA CONTACTLESS GASKETS IN GASKETS MARKET, BY TYPE, 2021-2030 (USD MILLION)
TABLE 257 SOUTH KOREA GASKETS MARKET, BY INDUSTRY, 2021-2030 (USD MILLION)
TABLE 258 SOUTH KOREA AUTOMOTIVE IN GASKETS MARKET, BY TYPE, 2021-2030 (USD MILLION)
TABLE 259 SOUTH KOREA CONTACT GASKETS IN GASKETS MARKET, BY TYPE, 2021-2030 (USD MILLION)
TABLE 260 SOUTH KOREA STATIC GASKETS IN GASKETS MARKET, BY TYPE, 2021-2030 (USD MILLION)
TABLE 261 SOUTH KOREA DYNAMIC GASKETS IN GASKETS MARKET, BY TYPE, 2021-2030 (USD MILLION)
TABLE 262 SOUTH KOREA CONTACTLESS GASKETS IN GASKETS MARKET, BY TYPE, 2021-2030 (USD MILLION)
TABLE 263 SOUTH KOREA ELECTRICAL IN GASKETS MARKET, BY TYPE, 2021-2030 (USD MILLION)
TABLE 264 SOUTH KOREA CONTACT GASKETS IN GASKETS MARKET, BY TYPE, 2021-2030 (USD MILLION)
TABLE 265 SOUTH KOREA STATIC GASKETS IN GASKETS MARKET, BY TYPE, 2021-2030 (USD MILLION)
TABLE 266 SOUTH KOREA DYNAMIC GASKETS IN GASKETS MARKET, BY TYPE, 2021-2030 (USD MILLION)
TABLE 267 SOUTH KOREA CONTACTLESS GASKETS IN GASKETS MARKET, BY TYPE, 2021-2030 (USD MILLION)
TABLE 268 SOUTH KOREA INDUSTRIAL MANUFACTURING IN GASKETS MARKET, BY TYPE, 2021-2030 (USD MILLION)
TABLE 269 SOUTH KOREA CONTACT GASKETS IN GASKETS MARKET, BY TYPE, 2021-2030 (USD MILLION)
TABLE 270 SOUTH KOREA STATIC GASKETS IN GASKETS MARKET, BY TYPE, 2021-2030 (USD MILLION)
TABLE 271 SOUTH KOREA DYNAMIC GASKETS IN GASKETS MARKET, BY TYPE, 2021-2030 (USD MILLION)
TABLE 272 SOUTH KOREA CONTACTLESS GASKETS IN GASKETS MARKET, BY TYPE, 2021-2030 (USD MILLION)
TABLE 273 SOUTH KOREA OIL AND GAS IN GASKETS MARKET, BY TYPE, 2021-2030 (USD MILLION)
TABLE 274 SOUTH KOREA CONTACT GASKETS IN GASKETS MARKET, BY TYPE, 2021-2030 (USD MILLION)
TABLE 275 SOUTH KOREA STATIC GASKETS IN GASKETS MARKET, BY TYPE, 2021-2030 (USD MILLION)
TABLE 276 SOUTH KOREA DYNAMIC GASKETS IN GASKETS MARKET, BY TYPE, 2021-2030 (USD MILLION)
TABLE 277 SOUTH KOREA CONTACTLESS GASKETS IN GASKETS MARKET, BY TYPE, 2021-2030 (USD MILLION)
TABLE 278 SOUTH KOREA AEROSPACE IN GASKETS MARKET, BY TYPE, 2021-2030 (USD MILLION)
TABLE 279 SOUTH KOREA CONTACT GASKETS IN GASKETS MARKET, BY TYPE, 2021-2030 (USD MILLION)
TABLE 280 SOUTH KOREA STATIC GASKETS IN GASKETS MARKET, BY TYPE, 2021-2030 (USD MILLION)
TABLE 281 SOUTH KOREA DYNAMIC GASKETS IN GASKETS MARKET, BY TYPE, 2021-2030 (USD MILLION)
TABLE 282 SOUTH KOREA CONTACTLESS GASKETS MARKET, BY TYPE, 2021-2030 (USD MILLION)
TABLE 283 SOUTH KOREA MARINE AND RAIL IN GASKETS MARKET, BY TYPE, 2021-2030 (USD MILLION)
TABLE 284 SOUTH KOREA CONTACT GASKETS IN GASKETS MARKET, BY TYPE, 2021-2030 (USD MILLION)
TABLE 285 SOUTH KOREA STATIC GASKETS IN GASKETS MARKET, BY TYPE, 2021-2030 (USD MILLION)
TABLE 286 SOUTH KOREA DYNAMIC GASKETS IN GASKETS MARKET, BY TYPE, 2021-2030 (USD MILLION)
TABLE 287 SOUTH KOREA CONTACTLESS GASKETS IN GASKETS MARKET, BY TYPE, 2021-2030 (USD MILLION)
TABLE 288 SOUTH KOREA PAPER AND PULP INDUSTRY IN GASKETS MARKET, BY TYPE, 2021-2030 (USD MILLION)
TABLE 289 SOUTH KOREA CONTACT GASKETS IN GASKETS MARKET, BY TYPE, 2021-2030 (USD MILLION)
TABLE 290 SOUTH KOREA STATIC GASKETS IN GASKETS MARKET, BY TYPE, 2021-2030 (USD MILLION)
TABLE 291 SOUTH KOREA DYNAMIC GASKETS IN GASKETS MARKET, BY TYPE, 2021-2030 (USD MILLION)
TABLE 292 SOUTH KOREA CONTACTLESS GASKETS IN GASKETS MARKET, BY TYPE, 2021-2030 (USD MILLION)
TABLE 293 SOUTH KOREA OTHERS IN GASKETS MARKET, BY TYPE, 2021-2030 (USD MILLION)
TABLE 294 SOUTH KOREA CONTACT GASKETS IN GASKETS MARKET, BY TYPE, 2021-2030 (USD MILLION)
TABLE 295 SOUTH KOREA STATIC GASKETS IN GASKETS MARKET, BY TYPE, 2021-2030 (USD MILLION)
TABLE 296 SOUTH KOREA DYNAMIC GASKETS IN GASKETS MARKET, BY TYPE, 2021-2030 (USD MILLION)
TABLE 297 SOUTH KOREA CONTACTLESS GASKETS IN GASKETS MARKET, BY TYPE, 2021-2030 (USD MILLION)
TABLE 298 THAILAND GASKETS MARKET, BY TYPE, 2021-2030 (USD MILLION)
TABLE 299 THAILAND GASKETS MARKET, BY TYPE, 2021-2030 (MILLION UNITS)
TABLE 300 THAILAND CONTACT GASKETS IN GASKETS MARKET, BY TYPE, 2021-2030 (USD MILLION)
TABLE 301 THAILAND STATIC GASKETS IN GASKETS MARKET, BY TYPE, 2021-2030 (USD MILLION)
TABLE 302 THAILAND DYNAMIC GASKETS IN GASKETS MARKET, BY TYPE, 2021-2030 (USD MILLION)
TABLE 303 THAILAND CONTACTLESS GASKETS IN GASKETS MARKET, BY TYPE, 2021-2030 (USD MILLION)
TABLE 304 THAILAND GASKETS MARKET, BY INDUSTRY, 2021-2030 (USD MILLION)
TABLE 305 THAILAND AUTOMOTIVE IN GASKETS MARKET, BY TYPE, 2021-2030 (USD MILLION)
TABLE 306 THAILAND CONTACT GASKETS IN GASKETS MARKET, BY TYPE, 2021-2030 (USD MILLION)
TABLE 307 THAILAND STATIC GASKETS IN GASKETS MARKET, BY TYPE, 2021-2030 (USD MILLION)
TABLE 308 THAILAND DYNAMIC GASKETS IN GASKETS MARKET, BY TYPE, 2021-2030 (USD MILLION)
TABLE 309 THAILAND CONTACTLESS GASKETS IN GASKETS MARKET, BY TYPE, 2021-2030 (USD MILLION)
TABLE 310 THAILAND ELECTRICAL IN GASKETS MARKET, BY TYPE, 2021-2030 (USD MILLION)
TABLE 311 THAILAND CONTACT GASKETS IN GASKETS MARKET, BY TYPE, 2021-2030 (USD MILLION)
TABLE 312 THAILAND STATIC GASKETS IN GASKETS MARKET, BY TYPE, 2021-2030 (USD MILLION)
TABLE 313 THAILAND DYNAMIC GASKETS IN GASKETS MARKET, BY TYPE, 2021-2030 (USD MILLION)
TABLE 314 THAILAND CONTACTLESS GASKETS IN GASKETS MARKET, BY TYPE, 2021-2030 (USD MILLION)
TABLE 315 THAILAND INDUSTRIAL MANUFACTURING IN GASKETS MARKET, BY TYPE, 2021-2030 (USD MILLION)
TABLE 316 THAILAND CONTACT GASKETS IN GASKETS MARKET, BY TYPE, 2021-2030 (USD MILLION)
TABLE 317 THAILAND STATIC GASKETS IN GASKETS MARKET, BY TYPE, 2021-2030 (USD MILLION)
TABLE 318 THAILAND DYNAMIC GASKETS IN GASKETS MARKET, BY TYPE, 2021-2030 (USD MILLION)
TABLE 319 THAILAND CONTACTLESS GASKETS IN GASKETS MARKET, BY TYPE, 2021-2030 (USD MILLION)
TABLE 320 THAILAND OIL AND GAS IN GASKETS MARKET, BY TYPE, 2021-2030 (USD MILLION)
TABLE 321 THAILAND CONTACT GASKETS IN GASKETS MARKET, BY TYPE, 2021-2030 (USD MILLION)
TABLE 322 THAILAND STATIC GASKETS IN GASKETS MARKET, BY TYPE, 2021-2030 (USD MILLION)
TABLE 323 THAILAND DYNAMIC GASKETS IN GASKETS MARKET, BY TYPE, 2021-2030 (USD MILLION)
TABLE 324 THAILAND CONTACTLESS GASKETS IN GASKETS MARKET, BY TYPE, 2021-2030 (USD MILLION)
TABLE 325 THAILAND AEROSPACE IN GASKETS MARKET, BY TYPE, 2021-2030 (USD MILLION)
TABLE 326 THAILAND CONTACT GASKETS IN GASKETS MARKET, BY TYPE, 2021-2030 (USD MILLION)
TABLE 327 THAILAND STATIC GASKETS IN GASKETS MARKET, BY TYPE, 2021-2030 (USD MILLION)
TABLE 328 THAILAND DYNAMIC GASKETS IN GASKETS MARKET, BY TYPE, 2021-2030 (USD MILLION)
TABLE 329 THAILAND CONTACTLESS GASKETS MARKET, BY TYPE, 2021-2030 (USD MILLION)
TABLE 330 THAILAND MARINE AND RAIL IN GASKETS MARKET, BY TYPE, 2021-2030 (USD MILLION)
TABLE 331 THAILAND CONTACT GASKETS IN GASKETS MARKET, BY TYPE, 2021-2030 (USD MILLION)
TABLE 332 THAILAND STATIC GASKETS IN GASKETS MARKET, BY TYPE, 2021-2030 (USD MILLION)
TABLE 333 THAILAND DYNAMIC GASKETS IN GASKETS MARKET, BY TYPE, 2021-2030 (USD MILLION)
TABLE 334 THAILAND CONTACTLESS GASKETS IN GASKETS MARKET, BY TYPE, 2021-2030 (USD MILLION)
TABLE 335 THAILAND PAPER AND PULP INDUSTRY IN GASKETS MARKET, BY TYPE, 2021-2030 (USD MILLION)
TABLE 336 THAILAND CONTACT GASKETS IN GASKETS MARKET, BY TYPE, 2021-2030 (USD MILLION)
TABLE 337 THAILAND STATIC GASKETS IN GASKETS MARKET, BY TYPE, 2021-2030 (USD MILLION)
TABLE 338 THAILAND DYNAMIC GASKETS IN GASKETS MARKET, BY TYPE, 2021-2030 (USD MILLION)
TABLE 339 THAILAND CONTACTLESS GASKETS IN GASKETS MARKET, BY TYPE, 2021-2030 (USD MILLION)
TABLE 340 THAILAND OTHERS IN GASKETS MARKET, BY TYPE, 2021-2030 (USD MILLION)
TABLE 341 THAILAND CONTACT GASKETS IN GASKETS MARKET, BY TYPE, 2021-2030 (USD MILLION)
TABLE 342 THAILAND STATIC GASKETS IN GASKETS MARKET, BY TYPE, 2021-2030 (USD MILLION)
TABLE 343 THAILAND DYNAMIC GASKETS IN GASKETS MARKET, BY TYPE, 2021-2030 (USD MILLION)
TABLE 344 THAILAND CONTACTLESS GASKETS IN GASKETS MARKET, BY TYPE, 2021-2030 (USD MILLION)
TABLE 345 SINGAPORE GASKETS MARKET, BY TYPE, 2021-2030 (USD MILLION)
TABLE 346 SINGAPORE GASKETS MARKET, BY TYPE, 2021-2030 (MILLION UNITS)
TABLE 347 SINGAPORE CONTACT GASKETS IN GASKETS MARKET, BY TYPE, 2021-2030 (USD MILLION)
TABLE 348 SINGAPORE STATIC GASKETS IN GASKETS MARKET, BY TYPE, 2021-2030 (USD MILLION)
TABLE 349 SINGAPORE DYNAMIC GASKETS IN GASKETS MARKET, BY TYPE, 2021-2030 (USD MILLION)
TABLE 350 SINGAPORE CONTACTLESS GASKETS IN GASKETS MARKET, BY TYPE, 2021-2030 (USD MILLION)
TABLE 351 SINGAPORE GASKETS MARKET, BY INDUSTRY, 2021-2030 (USD MILLION)
TABLE 352 SINGAPORE AUTOMOTIVE IN GASKETS MARKET, BY TYPE, 2021-2030 (USD MILLION)
TABLE 353 SINGAPORE CONTACT GASKETS IN GASKETS MARKET, BY TYPE, 2021-2030 (USD MILLION)
TABLE 354 SINGAPORE STATIC GASKETS IN GASKETS MARKET, BY TYPE, 2021-2030 (USD MILLION)
TABLE 355 SINGAPORE DYNAMIC GASKETS IN GASKETS MARKET, BY TYPE, 2021-2030 (USD MILLION)
TABLE 356 SINGAPORE CONTACTLESS GASKETS IN GASKETS MARKET, BY TYPE, 2021-2030 (USD MILLION)
TABLE 357 SINGAPORE ELECTRICAL IN GASKETS MARKET, BY TYPE, 2021-2030 (USD MILLION)
TABLE 358 SINGAPORE CONTACT GASKETS IN GASKETS MARKET, BY TYPE, 2021-2030 (USD MILLION)
TABLE 359 SINGAPORE STATIC GASKETS IN GASKETS MARKET, BY TYPE, 2021-2030 (USD MILLION)
TABLE 360 SINGAPORE DYNAMIC GASKETS IN GASKETS MARKET, BY TYPE, 2021-2030 (USD MILLION)
TABLE 361 SINGAPORE CONTACTLESS GASKETS IN GASKETS MARKET, BY TYPE, 2021-2030 (USD MILLION)
TABLE 362 SINGAPORE INDUSTRIAL MANUFACTURING IN GASKETS MARKET, BY TYPE, 2021-2030 (USD MILLION)
TABLE 363 SINGAPORE CONTACT GASKETS IN GASKETS MARKET, BY TYPE, 2021-2030 (USD MILLION)
TABLE 364 SINGAPORE STATIC GASKETS IN GASKETS MARKET, BY TYPE, 2021-2030 (USD MILLION)
TABLE 365 SINGAPORE DYNAMIC GASKETS IN GASKETS MARKET, BY TYPE, 2021-2030 (USD MILLION)
TABLE 366 SINGAPORE CONTACTLESS GASKETS IN GASKETS MARKET, BY TYPE, 2021-2030 (USD MILLION)
TABLE 367 SINGAPORE OIL AND GAS IN GASKETS MARKET, BY TYPE, 2021-2030 (USD MILLION)
TABLE 368 SINGAPORE CONTACT GASKETS IN GASKETS MARKET, BY TYPE, 2021-2030 (USD MILLION)
TABLE 369 SINGAPORE STATIC GASKETS IN GASKETS MARKET, BY TYPE, 2021-2030 (USD MILLION)
TABLE 370 SINGAPORE DYNAMIC GASKETS IN GASKETS MARKET, BY TYPE, 2021-2030 (USD MILLION)
TABLE 371 SINGAPORE CONTACTLESS GASKETS IN GASKETS MARKET, BY TYPE, 2021-2030 (USD MILLION)
TABLE 372 SINGAPORE AEROSPACE IN GASKETS MARKET, BY TYPE, 2021-2030 (USD MILLION)
TABLE 373 SINGAPORE CONTACT GASKETS IN GASKETS MARKET, BY TYPE, 2021-2030 (USD MILLION)
TABLE 374 SINGAPORE STATIC GASKETS IN GASKETS MARKET, BY TYPE, 2021-2030 (USD MILLION)
TABLE 375 SINGAPORE DYNAMIC GASKETS IN GASKETS MARKET, BY TYPE, 2021-2030 (USD MILLION)
TABLE 376 SINGAPORE CONTACTLESS GASKETS MARKET, BY TYPE, 2021-2030 (USD MILLION)
TABLE 377 SINGAPORE MARINE AND RAIL IN GASKETS MARKET, BY TYPE, 2021-2030 (USD MILLION)
TABLE 378 SINGAPORE CONTACT GASKETS IN GASKETS MARKET, BY TYPE, 2021-2030 (USD MILLION)
TABLE 379 SINGAPORE STATIC GASKETS IN GASKETS MARKET, BY TYPE, 2021-2030 (USD MILLION)
TABLE 380 SINGAPORE DYNAMIC GASKETS IN GASKETS MARKET, BY TYPE, 2021-2030 (USD MILLION)
TABLE 381 SINGAPORE CONTACTLESS GASKETS IN GASKETS MARKET, BY TYPE, 2021-2030 (USD MILLION)
TABLE 382 SINGAPORE PAPER AND PULP INDUSTRY IN GASKETS MARKET, BY TYPE, 2021-2030 (USD MILLION)
TABLE 383 SINGAPORE CONTACT GASKETS IN GASKETS MARKET, BY TYPE, 2021-2030 (USD MILLION)
TABLE 384 SINGAPORE STATIC GASKETS IN GASKETS MARKET, BY TYPE, 2021-2030 (USD MILLION)
TABLE 385 SINGAPORE DYNAMIC GASKETS IN GASKETS MARKET, BY TYPE, 2021-2030 (USD MILLION)
TABLE 386 SINGAPORE CONTACTLESS GASKETS IN GASKETS MARKET, BY TYPE, 2021-2030 (USD MILLION)
TABLE 387 SINGAPORE OTHERS IN GASKETS MARKET, BY TYPE, 2021-2030 (USD MILLION)
TABLE 388 SINGAPORE CONTACT GASKETS IN GASKETS MARKET, BY TYPE, 2021-2030 (USD MILLION)
TABLE 389 SINGAPORE STATIC GASKETS IN GASKETS MARKET, BY TYPE, 2021-2030 (USD MILLION)
TABLE 390 SINGAPORE DYNAMIC GASKETS IN GASKETS MARKET, BY TYPE, 2021-2030 (USD MILLION)
TABLE 391 SINGAPORE CONTACTLESS GASKETS IN GASKETS MARKET, BY TYPE, 2021-2030 (USD MILLION)
TABLE 392 INDONESIA GASKETS MARKET, BY TYPE, 2021-2030 (USD MILLION)
TABLE 393 INDONESIA GASKETS MARKET, BY TYPE, 2021-2030 (MILLION UNITS)
TABLE 394 INDONESIA CONTACT GASKETS IN GASKETS MARKET, BY TYPE, 2021-2030 (USD MILLION)
TABLE 395 INDONESIA STATIC GASKETS IN GASKETS MARKET, BY TYPE, 2021-2030 (USD MILLION)
TABLE 396 INDONESIA DYNAMIC GASKETS IN GASKETS MARKET, BY TYPE, 2021-2030 (USD MILLION)
TABLE 397 INDONESIA CONTACTLESS GASKETS IN GASKETS MARKET, BY TYPE, 2021-2030 (USD MILLION)
TABLE 398 INDONESIA GASKETS MARKET, BY INDUSTRY, 2021-2030 (USD MILLION)
TABLE 399 INDONESIA AUTOMOTIVE IN GASKETS MARKET, BY TYPE, 2021-2030 (USD MILLION)
TABLE 400 INDONESIA CONTACT GASKETS IN GASKETS MARKET, BY TYPE, 2021-2030 (USD MILLION)
TABLE 401 INDONESIA STATIC GASKETS IN GASKETS MARKET, BY TYPE, 2021-2030 (USD MILLION)
TABLE 402 INDONESIA DYNAMIC GASKETS IN GASKETS MARKET, BY TYPE, 2021-2030 (USD MILLION)
TABLE 403 INDONESIA CONTACTLESS GASKETS IN GASKETS MARKET, BY TYPE, 2021-2030 (USD MILLION)
TABLE 404 INDONESIA ELECTRICAL IN GASKETS MARKET, BY TYPE, 2021-2030 (USD MILLION)
TABLE 405 INDONESIA CONTACT GASKETS IN GASKETS MARKET, BY TYPE, 2021-2030 (USD MILLION)
TABLE 406 INDONESIA STATIC GASKETS IN GASKETS MARKET, BY TYPE, 2021-2030 (USD MILLION)
TABLE 407 INDONESIA DYNAMIC GASKETS IN GASKETS MARKET, BY TYPE, 2021-2030 (USD MILLION)
TABLE 408 INDONESIA CONTACTLESS GASKETS IN GASKETS MARKET, BY TYPE, 2021-2030 (USD MILLION)
TABLE 409 INDONESIA INDUSTRIAL MANUFACTURING IN GASKETS MARKET, BY TYPE, 2021-2030 (USD MILLION)
TABLE 410 INDONESIA CONTACT GASKETS IN GASKETS MARKET, BY TYPE, 2021-2030 (USD MILLION)
TABLE 411 INDONESIA STATIC GASKETS IN GASKETS MARKET, BY TYPE, 2021-2030 (USD MILLION)
TABLE 412 INDONESIA DYNAMIC GASKETS IN GASKETS MARKET, BY TYPE, 2021-2030 (USD MILLION)
TABLE 413 INDONESIA CONTACTLESS GASKETS IN GASKETS MARKET, BY TYPE, 2021-2030 (USD MILLION)
TABLE 414 INDONESIA OIL AND GAS IN GASKETS MARKET, BY TYPE, 2021-2030 (USD MILLION)
TABLE 415 INDONESIA CONTACT GASKETS IN GASKETS MARKET, BY TYPE, 2021-2030 (USD MILLION)
TABLE 416 INDONESIA STATIC GASKETS IN GASKETS MARKET, BY TYPE, 2021-2030 (USD MILLION)
TABLE 417 INDONESIA DYNAMIC GASKETS IN GASKETS MARKET, BY TYPE, 2021-2030 (USD MILLION)
TABLE 418 INDONESIA CONTACTLESS GASKETS IN GASKETS MARKET, BY TYPE, 2021-2030 (USD MILLION)
TABLE 419 INDONESIA AEROSPACE IN GASKETS MARKET, BY TYPE, 2021-2030 (USD MILLION)
TABLE 420 INDONESIA CONTACT GASKETS IN GASKETS MARKET, BY TYPE, 2021-2030 (USD MILLION)
TABLE 421 INDONESIA STATIC GASKETS IN GASKETS MARKET, BY TYPE, 2021-2030 (USD MILLION)
TABLE 422 INDONESIA DYNAMIC GASKETS IN GASKETS MARKET, BY TYPE, 2021-2030 (USD MILLION)
TABLE 423 INDONESIA CONTACTLESS GASKETS MARKET, BY TYPE, 2021-2030 (USD MILLION)
TABLE 424 INDONESIA MARINE AND RAIL IN GASKETS MARKET, BY TYPE, 2021-2030 (USD MILLION)
TABLE 425 INDONESIA CONTACT GASKETS IN GASKETS MARKET, BY TYPE, 2021-2030 (USD MILLION)
TABLE 426 INDONESIA STATIC GASKETS IN GASKETS MARKET, BY TYPE, 2021-2030 (USD MILLION)
TABLE 427 INDONESIA DYNAMIC GASKETS IN GASKETS MARKET, BY TYPE, 2021-2030 (USD MILLION)
TABLE 428 INDONESIA CONTACTLESS GASKETS IN GASKETS MARKET, BY TYPE, 2021-2030 (USD MILLION)
TABLE 429 INDONESIA PAPER AND PULP INDUSTRY IN GASKETS MARKET, BY TYPE, 2021-2030 (USD MILLION)
TABLE 430 INDONESIA CONTACT GASKETS IN GASKETS MARKET, BY TYPE, 2021-2030 (USD MILLION)
TABLE 431 INDONESIA STATIC GASKETS IN GASKETS MARKET, BY TYPE, 2021-2030 (USD MILLION)
TABLE 432 INDONESIA DYNAMIC GASKETS IN GASKETS MARKET, BY TYPE, 2021-2030 (USD MILLION)
TABLE 433 INDONESIA CONTACTLESS GASKETS IN GASKETS MARKET, BY TYPE, 2021-2030 (USD MILLION)
TABLE 434 INDONESIA OTHERS IN GASKETS MARKET, BY TYPE, 2021-2030 (USD MILLION)
TABLE 435 INDONESIA CONTACT GASKETS IN GASKETS MARKET, BY TYPE, 2021-2030 (USD MILLION)
TABLE 436 INDONESIA STATIC GASKETS IN GASKETS MARKET, BY TYPE, 2021-2030 (USD MILLION)
TABLE 437 INDONESIA DYNAMIC GASKETS IN GASKETS MARKET, BY TYPE, 2021-2030 (USD MILLION)
TABLE 438 INDONESIA CONTACTLESS GASKETS IN GASKETS MARKET, BY TYPE, 2021-2030 (USD MILLION)
TABLE 439 AUSTRALIA & NEW ZEALAND GASKETS MARKET, BY TYPE, 2021-2030 (USD MILLION)
TABLE 440 AUSTRALIA & NEW ZEALAND GASKETS MARKET, BY TYPE, 2021-2030 (MILLION UNITS)
TABLE 441 AUSTRALIA & NEW ZEALAND CONTACT GASKETS IN GASKETS MARKET, BY TYPE, 2021-2030 (USD MILLION)
TABLE 442 AUSTRALIA & NEW ZEALAND STATIC GASKETS IN GASKETS MARKET, BY TYPE, 2021-2030 (USD MILLION)
TABLE 443 AUSTRALIA & NEW ZEALAND DYNAMIC GASKETS IN GASKETS MARKET, BY TYPE, 2021-2030 (USD MILLION)
TABLE 444 AUSTRALIA & NEW ZEALAND CONTACTLESS GASKETS IN GASKETS MARKET, BY TYPE, 2021-2030 (USD MILLION)
TABLE 445 AUSTRALIA & NEW ZEALAND GASKETS MARKET, BY INDUSTRY, 2021-2030 (USD MILLION)
TABLE 446 AUSTRALIA & NEW ZEALAND AUTOMOTIVE IN GASKETS MARKET, BY TYPE, 2021-2030 (USD MILLION)
TABLE 447 AUSTRALIA & NEW ZEALAND CONTACT GASKETS IN GASKETS MARKET, BY TYPE, 2021-2030 (USD MILLION)
TABLE 448 AUSTRALIA & NEW ZEALAND STATIC GASKETS IN GASKETS MARKET, BY TYPE, 2021-2030 (USD MILLION)
TABLE 449 AUSTRALIA & NEW ZEALAND DYNAMIC GASKETS IN GASKETS MARKET, BY TYPE, 2021-2030 (USD MILLION)
TABLE 450 AUSTRALIA & NEW ZEALAND CONTACTLESS GASKETS IN GASKETS MARKET, BY TYPE, 2021-2030 (USD MILLION)
TABLE 451 AUSTRALIA & NEW ZEALAND ELECTRICAL IN GASKETS MARKET, BY TYPE, 2021-2030 (USD MILLION)
TABLE 452 AUSTRALIA & NEW ZEALAND CONTACT GASKETS IN GASKETS MARKET, BY TYPE, 2021-2030 (USD MILLION)
TABLE 453 AUSTRALIA & NEW ZEALAND STATIC GASKETS IN GASKETS MARKET, BY TYPE, 2021-2030 (USD MILLION)
TABLE 454 AUSTRALIA & NEW ZEALAND DYNAMIC GASKETS IN GASKETS MARKET, BY TYPE, 2021-2030 (USD MILLION)
TABLE 455 AUSTRALIA & NEW ZEALAND CONTACTLESS GASKETS IN GASKETS MARKET, BY TYPE, 2021-2030 (USD MILLION)
TABLE 456 AUSTRALIA & NEW ZEALAND INDUSTRIAL MANUFACTURING IN GASKETS MARKET, BY TYPE, 2021-2030 (USD MILLION)
TABLE 457 AUSTRALIA & NEW ZEALAND CONTACT GASKETS IN GASKETS MARKET, BY TYPE, 2021-2030 (USD MILLION)
TABLE 458 AUSTRALIA & NEW ZEALAND STATIC GASKETS IN GASKETS MARKET, BY TYPE, 2021-2030 (USD MILLION)
TABLE 459 AUSTRALIA & NEW ZEALAND DYNAMIC GASKETS IN GASKETS MARKET, BY TYPE, 2021-2030 (USD MILLION)
TABLE 460 AUSTRALIA & NEW ZEALAND CONTACTLESS GASKETS IN GASKETS MARKET, BY TYPE, 2021-2030 (USD MILLION)
TABLE 461 AUSTRALIA & NEW ZEALAND OIL AND GAS IN GASKETS MARKET, BY TYPE, 2021-2030 (USD MILLION)
TABLE 462 AUSTRALIA & NEW ZEALAND CONTACT GASKETS IN GASKETS MARKET, BY TYPE, 2021-2030 (USD MILLION)
TABLE 463 AUSTRALIA & NEW ZEALAND STATIC GASKETS IN GASKETS MARKET, BY TYPE, 2021-2030 (USD MILLION)
TABLE 464 AUSTRALIA & NEW ZEALAND DYNAMIC GASKETS IN GASKETS MARKET, BY TYPE, 2021-2030 (USD MILLION)
TABLE 465 AUSTRALIA & NEW ZEALAND CONTACTLESS GASKETS IN GASKETS MARKET, BY TYPE, 2021-2030 (USD MILLION)
TABLE 466 AUSTRALIA & NEW ZEALAND AEROSPACE IN GASKETS MARKET, BY TYPE, 2021-2030 (USD MILLION)
TABLE 467 AUSTRALIA & NEW ZEALAND CONTACT GASKETS IN GASKETS MARKET, BY TYPE, 2021-2030 (USD MILLION)
TABLE 468 AUSTRALIA & NEW ZEALAND STATIC GASKETS IN GASKETS MARKET, BY TYPE, 2021-2030 (USD MILLION)
TABLE 469 AUSTRALIA & NEW ZEALAND DYNAMIC GASKETS IN GASKETS MARKET, BY TYPE, 2021-2030 (USD MILLION)
TABLE 470 AUSTRALIA & NEW ZEALAND CONTACTLESS GASKETS MARKET, BY TYPE, 2021-2030 (USD MILLION)
TABLE 471 AUSTRALIA & NEW ZEALAND MARINE AND RAIL IN GASKETS MARKET, BY TYPE, 2021-2030 (USD MILLION)
TABLE 472 AUSTRALIA & NEW ZEALAND CONTACT GASKETS IN GASKETS MARKET, BY TYPE, 2021-2030 (USD MILLION)
TABLE 473 AUSTRALIA & NEW ZEALAND STATIC GASKETS IN GASKETS MARKET, BY TYPE, 2021-2030 (USD MILLION)
TABLE 474 AUSTRALIA & NEW ZEALAND DYNAMIC GASKETS IN GASKETS MARKET, BY TYPE, 2021-2030 (USD MILLION)
TABLE 475 AUSTRALIA & NEW ZEALAND CONTACTLESS GASKETS IN GASKETS MARKET, BY TYPE, 2021-2030 (USD MILLION)
TABLE 476 AUSTRALIA & NEW ZEALAND PAPER AND PULP INDUSTRY IN GASKETS MARKET, BY TYPE, 2021-2030 (USD MILLION)
TABLE 477 AUSTRALIA & NEW ZEALAND CONTACT GASKETS IN GASKETS MARKET, BY TYPE, 2021-2030 (USD MILLION)
TABLE 478 AUSTRALIA & NEW ZEALAND STATIC GASKETS IN GASKETS MARKET, BY TYPE, 2021-2030 (USD MILLION)
TABLE 479 AUSTRALIA & NEW ZEALAND DYNAMIC GASKETS IN GASKETS MARKET, BY TYPE, 2021-2030 (USD MILLION)
TABLE 480 AUSTRALIA & NEW ZEALAND CONTACTLESS GASKETS IN GASKETS MARKET, BY TYPE, 2021-2030 (USD MILLION)
TABLE 481 AUSTRALIA & NEW ZEALAND OTHERS IN GASKETS MARKET, BY TYPE, 2021-2030 (USD MILLION)
TABLE 482 AUSTRALIA & NEW ZEALAND CONTACT GASKETS IN GASKETS MARKET, BY TYPE, 2021-2030 (USD MILLION)
TABLE 483 AUSTRALIA & NEW ZEALAND STATIC GASKETS IN GASKETS MARKET, BY TYPE, 2021-2030 (USD MILLION)
TABLE 484 AUSTRALIA & NEW ZEALAND DYNAMIC GASKETS IN GASKETS MARKET, BY TYPE, 2021-2030 (USD MILLION)
TABLE 485 AUSTRALIA & NEW ZEALAND CONTACTLESS GASKETS IN GASKETS MARKET, BY TYPE, 2021-2030 (USD MILLION)
TABLE 486 PHILIPPINES GASKETS MARKET, BY TYPE, 2021-2030 (USD MILLION)
TABLE 487 PHILIPPINES GASKETS MARKET, BY TYPE, 2021-2030 (MILLION UNITS)
TABLE 488 PHILIPPINES CONTACT GASKETS IN GASKETS MARKET, BY TYPE, 2021-2030 (USD MILLION)
TABLE 489 PHILIPPINES STATIC GASKETS IN GASKETS MARKET, BY TYPE, 2021-2030 (USD MILLION)
TABLE 490 PHILIPPINES DYNAMIC GASKETS IN GASKETS MARKET, BY TYPE, 2021-2030 (USD MILLION)
TABLE 491 PHILIPPINES CONTACTLESS GASKETS IN GASKETS MARKET, BY TYPE, 2021-2030 (USD MILLION)
TABLE 492 PHILIPPINES GASKETS MARKET, BY INDUSTRY, 2021-2030 (USD MILLION)
TABLE 493 PHILIPPINES AUTOMOTIVE IN GASKETS MARKET, BY TYPE, 2021-2030 (USD MILLION)
TABLE 494 PHILIPPINES CONTACT GASKETS IN GASKETS MARKET, BY TYPE, 2021-2030 (USD MILLION)
TABLE 495 PHILIPPINES STATIC GASKETS IN GASKETS MARKET, BY TYPE, 2021-2030 (USD MILLION)
TABLE 496 PHILIPPINES DYNAMIC GASKETS IN GASKETS MARKET, BY TYPE, 2021-2030 (USD MILLION)
TABLE 497 PHILIPPINES CONTACTLESS GASKETS IN GASKETS MARKET, BY TYPE, 2021-2030 (USD MILLION)
TABLE 498 PHILIPPINES ELECTRICAL IN GASKETS MARKET, BY TYPE, 2021-2030 (USD MILLION)
TABLE 499 PHILIPPINES CONTACT GASKETS IN GASKETS MARKET, BY TYPE, 2021-2030 (USD MILLION)
TABLE 500 PHILIPPINES STATIC GASKETS IN GASKETS MARKET, BY TYPE, 2021-2030 (USD MILLION)
TABLE 501 PHILIPPINES DYNAMIC GASKETS IN GASKETS MARKET, BY TYPE, 2021-2030 (USD MILLION)
TABLE 502 PHILIPPINES CONTACTLESS GASKETS IN GASKETS MARKET, BY TYPE, 2021-2030 (USD MILLION)
TABLE 503 PHILIPPINES INDUSTRIAL MANUFACTURING IN GASKETS MARKET, BY TYPE, 2021-2030 (USD MILLION)
TABLE 504 PHILIPPINES CONTACT GASKETS IN GASKETS MARKET, BY TYPE, 2021-2030 (USD MILLION)
TABLE 505 PHILIPPINES STATIC GASKETS IN GASKETS MARKET, BY TYPE, 2021-2030 (USD MILLION)
TABLE 506 PHILIPPINES DYNAMIC GASKETS IN GASKETS MARKET, BY TYPE, 2021-2030 (USD MILLION)
TABLE 507 PHILIPPINES CONTACTLESS GASKETS IN GASKETS MARKET, BY TYPE, 2021-2030 (USD MILLION)
TABLE 508 PHILIPPINES OIL AND GAS IN GASKETS MARKET, BY TYPE, 2021-2030 (USD MILLION)
TABLE 509 PHILIPPINES CONTACT GASKETS IN GASKETS MARKET, BY TYPE, 2021-2030 (USD MILLION)
TABLE 510 PHILIPPINES STATIC GASKETS IN GASKETS MARKET, BY TYPE, 2021-2030 (USD MILLION)
TABLE 511 PHILIPPINES DYNAMIC GASKETS IN GASKETS MARKET, BY TYPE, 2021-2030 (USD MILLION)
TABLE 512 PHILIPPINES CONTACTLESS GASKETS IN GASKETS MARKET, BY TYPE, 2021-2030 (USD MILLION)
TABLE 513 PHILIPPINES AEROSPACE IN GASKETS MARKET, BY TYPE, 2021-2030 (USD MILLION)
TABLE 514 PHILIPPINES CONTACT GASKETS IN GASKETS MARKET, BY TYPE, 2021-2030 (USD MILLION)
TABLE 515 PHILIPPINES STATIC GASKETS IN GASKETS MARKET, BY TYPE, 2021-2030 (USD MILLION)
TABLE 516 PHILIPPINES DYNAMIC GASKETS IN GASKETS MARKET, BY TYPE, 2021-2030 (USD MILLION)
TABLE 517 PHILIPPINES CONTACTLESS GASKETS MARKET, BY TYPE, 2021-2030 (USD MILLION)
TABLE 518 PHILIPPINES MARINE AND RAIL IN GASKETS MARKET, BY TYPE, 2021-2030 (USD MILLION)
TABLE 519 PHILIPPINES CONTACT GASKETS IN GASKETS MARKET, BY TYPE, 2021-2030 (USD MILLION)
TABLE 520 PHILIPPINES STATIC GASKETS IN GASKETS MARKET, BY TYPE, 2021-2030 (USD MILLION)
TABLE 521 PHILIPPINES DYNAMIC GASKETS IN GASKETS MARKET, BY TYPE, 2021-2030 (USD MILLION)
TABLE 522 PHILIPPINES CONTACTLESS GASKETS IN GASKETS MARKET, BY TYPE, 2021-2030 (USD MILLION)
TABLE 523 PHILIPPINES PAPER AND PULP INDUSTRY IN GASKETS MARKET, BY TYPE, 2021-2030 (USD MILLION)
TABLE 524 PHILIPPINES CONTACT GASKETS IN GASKETS MARKET, BY TYPE, 2021-2030 (USD MILLION)
TABLE 525 PHILIPPINES STATIC GASKETS IN GASKETS MARKET, BY TYPE, 2021-2030 (USD MILLION)
TABLE 526 PHILIPPINES DYNAMIC GASKETS IN GASKETS MARKET, BY TYPE, 2021-2030 (USD MILLION)
TABLE 527 PHILIPPINES CONTACTLESS GASKETS IN GASKETS MARKET, BY TYPE, 2021-2030 (USD MILLION)
TABLE 528 PHILIPPINES OTHERS IN GASKETS MARKET, BY TYPE, 2021-2030 (USD MILLION)
TABLE 529 PHILIPPINES CONTACT GASKETS IN GASKETS MARKET, BY TYPE, 2021-2030 (USD MILLION)
TABLE 530 PHILIPPINES STATIC GASKETS IN GASKETS MARKET, BY TYPE, 2021-2030 (USD MILLION)
TABLE 531 PHILIPPINES DYNAMIC GASKETS IN GASKETS MARKET, BY TYPE, 2021-2030 (USD MILLION)
TABLE 532 PHILIPPINES CONTACTLESS GASKETS IN GASKETS MARKET, BY TYPE, 2021-2030 (USD MILLION)
TABLE 533 MALAYSIA GASKETS MARKET, BY TYPE, 2021-2030 (USD MILLION)
TABLE 534 MALAYSIA GASKETS MARKET, BY TYPE, 2021-2030 (MILLION UNITS)
TABLE 535 MALAYSIA CONTACT GASKETS IN GASKETS MARKET, BY TYPE, 2021-2030 (USD MILLION)
TABLE 536 MALAYSIA STATIC GASKETS IN GASKETS MARKET, BY TYPE, 2021-2030 (USD MILLION)
TABLE 537 MALAYSIA DYNAMIC GASKETS IN GASKETS MARKET, BY TYPE, 2021-2030 (USD MILLION)
TABLE 538 MALAYSIA CONTACTLESS GASKETS IN GASKETS MARKET, BY TYPE, 2021-2030 (USD MILLION)
TABLE 539 MALAYSIA GASKETS MARKET, BY INDUSTRY, 2021-2030 (USD MILLION)
TABLE 540 MALAYSIA AUTOMOTIVE IN GASKETS MARKET, BY TYPE, 2021-2030 (USD MILLION)
TABLE 541 MALAYSIA CONTACT GASKETS IN GASKETS MARKET, BY TYPE, 2021-2030 (USD MILLION)
TABLE 542 MALAYSIA STATIC GASKETS IN GASKETS MARKET, BY TYPE, 2021-2030 (USD MILLION)
TABLE 543 MALAYSIA DYNAMIC GASKETS IN GASKETS MARKET, BY TYPE, 2021-2030 (USD MILLION)
TABLE 544 MALAYSIA CONTACTLESS GASKETS IN GASKETS MARKET, BY TYPE, 2021-2030 (USD MILLION)
TABLE 545 MALAYSIA ELECTRICAL IN GASKETS MARKET, BY TYPE, 2021-2030 (USD MILLION)
TABLE 546 MALAYSIA CONTACT GASKETS IN GASKETS MARKET, BY TYPE, 2021-2030 (USD MILLION)
TABLE 547 MALAYSIA STATIC GASKETS IN GASKETS MARKET, BY TYPE, 2021-2030 (USD MILLION)
TABLE 548 MALAYSIA DYNAMIC GASKETS IN GASKETS MARKET, BY TYPE, 2021-2030 (USD MILLION)
TABLE 549 MALAYSIA CONTACTLESS GASKETS IN GASKETS MARKET, BY TYPE, 2021-2030 (USD MILLION)
TABLE 550 MALAYSIA INDUSTRIAL MANUFACTURING IN GASKETS MARKET, BY TYPE, 2021-2030 (USD MILLION)
TABLE 551 MALAYSIA CONTACT GASKETS IN GASKETS MARKET, BY TYPE, 2021-2030 (USD MILLION)
TABLE 552 MALAYSIA STATIC GASKETS IN GASKETS MARKET, BY TYPE, 2021-2030 (USD MILLION)
TABLE 553 MALAYSIA DYNAMIC GASKETS IN GASKETS MARKET, BY TYPE, 2021-2030 (USD MILLION)
TABLE 554 MALAYSIA CONTACTLESS GASKETS IN GASKETS MARKET, BY TYPE, 2021-2030 (USD MILLION)
TABLE 555 MALAYSIA OIL AND GAS IN GASKETS MARKET, BY TYPE, 2021-2030 (USD MILLION)
TABLE 556 MALAYSIA CONTACT GASKETS IN GASKETS MARKET, BY TYPE, 2021-2030 (USD MILLION)
TABLE 557 MALAYSIA STATIC GASKETS IN GASKETS MARKET, BY TYPE, 2021-2030 (USD MILLION)
TABLE 558 MALAYSIA DYNAMIC GASKETS IN GASKETS MARKET, BY TYPE, 2021-2030 (USD MILLION)
TABLE 559 MALAYSIA CONTACTLESS GASKETS IN GASKETS MARKET, BY TYPE, 2021-2030 (USD MILLION)
TABLE 560 MALAYSIA AEROSPACE IN GASKETS MARKET, BY TYPE, 2021-2030 (USD MILLION)
TABLE 561 MALAYSIA CONTACT GASKETS IN GASKETS MARKET, BY TYPE, 2021-2030 (USD MILLION)
TABLE 562 MALAYSIA STATIC GASKETS IN GASKETS MARKET, BY TYPE, 2021-2030 (USD MILLION)
TABLE 563 MALAYSIA DYNAMIC GASKETS IN GASKETS MARKET, BY TYPE, 2021-2030 (USD MILLION)
TABLE 564 MALAYSIA CONTACTLESS GASKETS MARKET, BY TYPE, 2021-2030 (USD MILLION)
TABLE 565 MALAYSIA MARINE AND RAIL IN GASKETS MARKET, BY TYPE, 2021-2030 (USD MILLION)
TABLE 566 MALAYSIA CONTACT GASKETS IN GASKETS MARKET, BY TYPE, 2021-2030 (USD MILLION)
TABLE 567 MALAYSIA STATIC GASKETS IN GASKETS MARKET, BY TYPE, 2021-2030 (USD MILLION)
TABLE 568 MALAYSIA DYNAMIC GASKETS IN GASKETS MARKET, BY TYPE, 2021-2030 (USD MILLION)
TABLE 569 MALAYSIA CONTACTLESS GASKETS IN GASKETS MARKET, BY TYPE, 2021-2030 (USD MILLION)
TABLE 570 MALAYSIA PAPER AND PULP INDUSTRY IN GASKETS MARKET, BY TYPE, 2021-2030 (USD MILLION)
TABLE 571 MALAYSIA CONTACT GASKETS IN GASKETS MARKET, BY TYPE, 2021-2030 (USD MILLION)
TABLE 572 MALAYSIA STATIC GASKETS IN GASKETS MARKET, BY TYPE, 2021-2030 (USD MILLION)
TABLE 573 MALAYSIA DYNAMIC GASKETS IN GASKETS MARKET, BY TYPE, 2021-2030 (USD MILLION)
TABLE 574 MALAYSIA CONTACTLESS GASKETS IN GASKETS MARKET, BY TYPE, 2021-2030 (USD MILLION)
TABLE 575 MALAYSIA OTHERS IN GASKETS MARKET, BY TYPE, 2021-2030 (USD MILLION)
TABLE 576 MALAYSIA CONTACT GASKETS IN GASKETS MARKET, BY TYPE, 2021-2030 (USD MILLION)
TABLE 577 MALAYSIA STATIC GASKETS IN GASKETS MARKET, BY TYPE, 2021-2030 (USD MILLION)
TABLE 578 MALAYSIA DYNAMIC GASKETS IN GASKETS MARKET, BY TYPE, 2021-2030 (USD MILLION)
TABLE 579 MALAYSIA CONTACTLESS GASKETS IN GASKETS MARKET, BY TYPE, 2021-2030 (USD MILLION)
TABLE 580 REST OF ASIA-PACIFIC GASKETS MARKET, BY TYPE, 2021-2030 (USD MILLION)
TABLE 581 REST OF ASIA-PACIFIC GASKETS MARKET, BY TYPE, 2021-2030 (MILLION UNITS)
Lista de figuras
FIGURE 1 ASIA PACIFIC GASKETS MARKET
FIGURE 2 ASIA PACIFIC GASKETS MARKET: DATA TRIANGULATION
FIGURE 3 ASIA PACIFIC GASKETS MARKET: DROC ANALYSIS
FIGURE 4 ASIA PACIFIC GASKETS MARKET: ASIA PACIFIC VS REGIONAL MARKET ANALYSIS
FIGURE 5 ASIA PACIFIC GASKETS MARKET: COMPANY RESEARCH ANALYSIS
FIGURE 6 ASIA PACIFIC GASKETS MARKET: THE TYPE LIFE LINE CURVE
FIGURE 7 ASIA PACIFIC GASKETS MARKET: MULTIVARIATE MODELLING
FIGURE 8 ASIA PACIFIC GASKETS MARKET: INTERVIEW DEMOGRAPHICS
FIGURE 9 ASIA PACIFIC GASKETS MARKET: DBMR MARKET POSITION GRID
FIGURE 10 ASIA PACIFIC GASKETS MARKET: THE MARKET CHALLENGE MATRIX
FIGURE 11 ASIA PACIFIC GASKETS MARKET: VENDOR SHARE ANALYSIS
FIGURE 12 ASIA PACIFIC GASKETS MARKET: SEGMENTATION
FIGURE 13 INDUSTRIAL GASKETS HAVE WIDER APPLICATIONS IN VARIOUS END-USE SECTORS IS EXPECTED TO DRIVE THE ASIA PACIFIC GASKETS MARKET IN THE FORECAST PERIOD
FIGURE 14 CONTACT GASKETS SEGMENT IS EXPECTED TO ACCOUNT FOR THE LARGEST SHARE OF THE ASIA PACIFIC GASKETS MARKET IN 2023 & 2030
FIGURE 15 IMPORT-EXPORT SCENARIO (USD THOUSAND)
FIGURE 16 ASIA PACIFIC GASKETS MARKET: PRODUCTION AND CONSUMPTION ANALYSIS, 2021-2023 (THOUSAND UNITS)
FIGURE 17 SUPPLY CHAIN ANALYSIS – ASIA PACIFIC GASKET MARKET
FIGURE 18 DRIVERS, RESTRAINTS, OPPORTUNITIES AND CHALLENGES OF THE ASIA PACIFIC GASKETS MARKET
FIGURE 19 ASIA PACIFIC GASKETS MARKET: BY TYPE, 2022
FIGURE 20 ASIA PACIFIC GASKETS MARKET: BY INDUSTRY, 2022
FIGURE 21 ASIA-PACIFIC GASKETS MARKET: SNAPSHOT (2022)
FIGURE 22 ASIA-PACIFIC GASKETS MARKET: BY COUNTRY (2022)
FIGURE 23 ASIA-PACIFIC GASKETS MARKET: BY COUNTRY (2023 & 2030)
FIGURE 24 ASIA-PACIFIC GASKETS MARKET: BY COUNTRY (2022 & 2030)
FIGURE 25 ASIA-PACIFIC GASKETS MARKET: BY TYPE (2023-2030)
FIGURE 26 ASIA PACIFIC GASKETS MARKET: COMPANY SHARE 2022 (%)
Metodología de investigación
La recopilación de datos y el análisis del año base se realizan utilizando módulos de recopilación de datos con muestras de gran tamaño. La etapa incluye la obtención de información de mercado o datos relacionados a través de varias fuentes y estrategias. Incluye el examen y la planificación de todos los datos adquiridos del pasado con antelación. Asimismo, abarca el examen de las inconsistencias de información observadas en diferentes fuentes de información. Los datos de mercado se analizan y estiman utilizando modelos estadísticos y coherentes de mercado. Además, el análisis de la participación de mercado y el análisis de tendencias clave son los principales factores de éxito en el informe de mercado. Para obtener más información, solicite una llamada de un analista o envíe su consulta.
La metodología de investigación clave utilizada por el equipo de investigación de DBMR es la triangulación de datos, que implica la extracción de datos, el análisis del impacto de las variables de datos en el mercado y la validación primaria (experto en la industria). Los modelos de datos incluyen cuadrícula de posicionamiento de proveedores, análisis de línea de tiempo de mercado, descripción general y guía del mercado, cuadrícula de posicionamiento de la empresa, análisis de patentes, análisis de precios, análisis de participación de mercado de la empresa, estándares de medición, análisis global versus regional y de participación de proveedores. Para obtener más información sobre la metodología de investigación, envíe una consulta para hablar con nuestros expertos de la industria.
Personalización disponible
Data Bridge Market Research es líder en investigación formativa avanzada. Nos enorgullecemos de brindar servicios a nuestros clientes existentes y nuevos con datos y análisis que coinciden y se adaptan a sus objetivos. El informe se puede personalizar para incluir análisis de tendencias de precios de marcas objetivo, comprensión del mercado de países adicionales (solicite la lista de países), datos de resultados de ensayos clínicos, revisión de literatura, análisis de mercado renovado y base de productos. El análisis de mercado de competidores objetivo se puede analizar desde análisis basados en tecnología hasta estrategias de cartera de mercado. Podemos agregar tantos competidores sobre los que necesite datos en el formato y estilo de datos que esté buscando. Nuestro equipo de analistas también puede proporcionarle datos en archivos de Excel sin procesar, tablas dinámicas (libro de datos) o puede ayudarlo a crear presentaciones a partir de los conjuntos de datos disponibles en el informe.

