

Mercado de G-CSF/PEG-G-CSF en Asia y el Pacífico, por indicación ( neutropenia , oncología, enfermedades crónicas y autoinmunes, trastornos sanguíneos, deficiencia de la armonía del crecimiento y otros), dosis (mono y combinada), vía de administración (intravenosa, subcutánea), embalaje (viales de un solo uso y jeringas precargadas), usuario final (hospitales y clínicas, institutos de investigación y académicos, centros quirúrgicos ambulatorios y otros), canal de distribución (farmacia hospitalaria, farmacia en línea, farmacia minorista y otros): tendencias de la industria y pronóstico hasta 2030.
Análisis y perspectivas del mercado de G-CSF/PEG-G-CSF en Asia-Pacífico
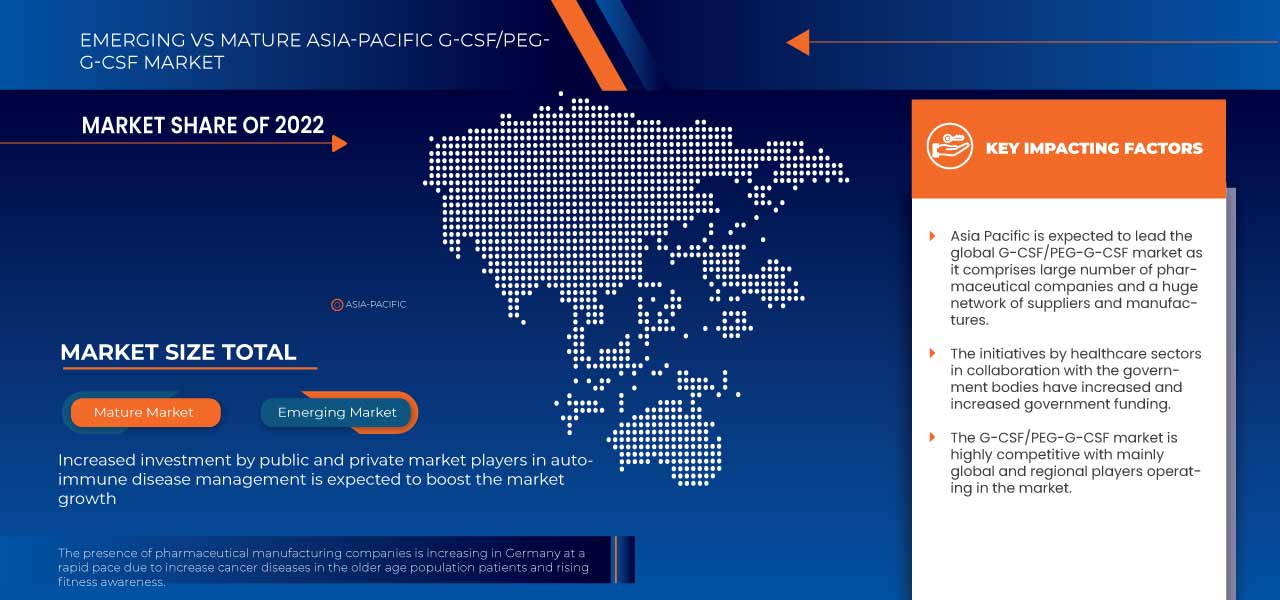
El aumento de la prevención del cáncer en los países desarrollados y los gobiernos han introducido iniciativas conscientes para educar sobre el tratamiento temprano, promoviendo el mercado de ventas de biosimilares G-CSF en Asia-Pacífico. Grafeel, Colstim, Neukine y Filcad, que son biosimilares aprobados y también son rentables y están fácilmente disponibles en los países en desarrollo, conducirán a un crecimiento significativo del mercado. China y la India son los países donde el número de pacientes con cáncer está aumentando, lo que probablemente impulsará el mercado de Asia-Pacífico. Por lo tanto, el uso de biosimilares ayuda a reducir los costos de atención médica de los pacientes en comparación con el uso de productos biológicos originales, lo que aumenta la demanda en el mercado de ventas de biosimilares G-CSF en Asia-Pacífico. Debido a los complejos procesos de fabricación biológica de los biosimilares individuales, los costos de los biosimilares no son tan bajos como los de los genéricos. Se espera que la creciente prevalencia de enfermedades autoinmunes y crónicas raras impulse el crecimiento del mercado segmentario.
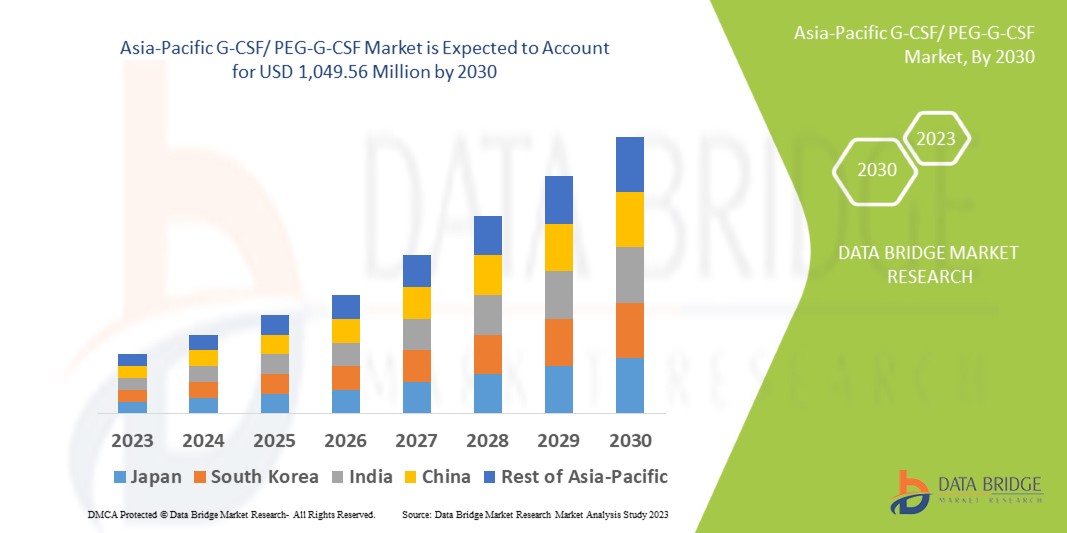
Data Bridge Market Research analiza que se espera que el mercado de G-CSF/PEG-G-CSF de Asia-Pacífico alcance un valor de USD 1049,56 millones para 2030, con una CAGR del 6,3 % durante el período de pronóstico. Este informe de mercado también cubre en profundidad el análisis de precios, el análisis de patentes y los avances tecnológicos.
|
Métrica del informe |
Detalles |
|
Período de pronóstico |
2023 a 2030 |
|
Año base |
2022 |
|
Años históricos |
2021 |
|
Unidades cuantitativas |
Ingresos en millones de USD, volúmenes en unidades, precios en USD |
|
Segmentos cubiertos |
Por indicación (neutropenia, oncología, enfermedades crónicas y autoinmunes, trastornos sanguíneos, deficiencia de la armonía del crecimiento y otros), dosis (mono y combinación), vía de administración (intravenosa, subcutánea), empaque (viales de un solo uso y jeringas precargadas), usuario final (hospitales y clínicas, institutos de investigación y académicos, centros quirúrgicos ambulatorios y otros), canal de distribución (farmacia hospitalaria, farmacia en línea, farmacia minorista y otros) |
|
Países cubiertos |
China, Japón, India, Australia, Nueva Zelanda, Indonesia, Tailandia, Vietnam, Singapur, Filipinas, Malasia, Resto de Asia-Pacífico |
|
Actores del mercado cubiertos |
Español Las siguientes empresas son: USV Private Limited, Viatris Inc., Biocon, Fresenius Kabi AG, Hangzhou Jiuyuan Gene Engineering Co., Ltd., Amgen Inc., Pfizer Inc., Sandoz International GmbH, Apotex Inc., Cadila Pharmaceuticals, Dr. Reddy's Laboratories Ltd., Amneal Pharmaceuticals LLC., Coherus BioSciences, Accord Healthcare, NAPP PHARMACEUTICALS LIMITED., Intas Pharmaceuticals Ltd., Mundipharma International, Teva Pharmaceutical Industries Ltd., Spectrum Pharmaceuticals, Inc., Kyowa Kirin Co., Ltd., Jiangsu Hengrui Pharmaceuticals Co., Ltd., entre otras. |
Definición del mercado de G-CSF/PEG-G-CSF en Asia y el Pacífico
El factor estimulante de colonias de granulocitos (G-CSF) es un medicamento que se utiliza para tratar la neutropenia, una enfermedad en la que el número de glóbulos blancos es inferior al promedio y que es causada por algunas formas de quimioterapia. Los principales tipos de G-CSF son lenograstim (Granocyte), filgrastim (Neupogen, zarzio, nivestim, accofil), filgrastim de acción prolongada (pegilado) (pegfilgrastim, neulasta, pelmeg, ziextenco) y lipegfilgrastim (lonquex). El lenograstim es un agente terapéutico recombinante glicosilado que es químicamente similar o idéntico al factor estimulante de colonias de granulocitos (G-CSF) humano natural. Entre los diversos productos, se incluyen comprimidos y cápsulas, y se utilizan para tratar el cáncer, los trastornos sanguíneos, la deficiencia de la hormona del crecimiento y las enfermedades crónicas y autoinmunes.
Dinámica del mercado de G-CSF/PEG-G-CSF en Asia-Pacífico
En esta sección se aborda la comprensión de los factores impulsores, las ventajas, las oportunidades, las limitaciones y los desafíos del mercado. Todo esto se analiza en detalle a continuación:
Conductores
- Aumento de la incidencia de cánceres de la sangre y enfermedades cancerosas
Cáncer es un término general para muchas enfermedades que pueden afectar cualquier parte del cuerpo. Otros términos utilizados para el cáncer son tumores malignos y neoplasia. Una de las características del cáncer es la rápida formación de células anormales que crecen más allá de los límites normales y pueden invadir partes vecinas del cuerpo y propagarse a otros órganos; este último proceso se denomina metástasis. Las metástasis extensas son la principal causa de muerte por cáncer.
El filgrastim es un factor estimulante de colonias de granulocitos (GCSF) que ayuda a aumentar la cantidad de neutrófilos en la sangre. El filgrastim y el pegfilgrastim se utilizan ampliamente para aumentar los glóbulos blancos después de la quimioterapia o la radioterapia contra el cáncer.
- Aumento de casos de neutropenia febril
La neutropenia febril se refiere a la fiebre durante una neutropenia significativa. Si un paciente es neutropénico, su riesgo de infección puede ser mayor de lo habitual, y la gravedad de una infección en particular también puede ser mayor. La neutropenia febril es la complicación potencialmente mortal más común del tratamiento del cáncer; su tratamiento a menudo es una emergencia oncológica.
La neutropenia febril es la neutropenia acompañada de fiebre. La neutropenia se refiere a una disminución en la concentración de neutrófilos en la sangre. Los neutrófilos son un tipo de glóbulo blanco que ayuda a combatir las infecciones como parte del sistema inmunológico. La Sociedad de Enfermedades Infecciosas de Estados Unidos define la neutropenia como un recuento absoluto de neutrófilos (RAN) de menos de 1500 células/mm3. El riesgo de infección y fiebre neutropénica aumenta drásticamente con la neutropenia grave, definida como un recuento absoluto de neutrófilos (RAN) de menos de 500 células/mm3. La fiebre se define como una temperatura oral única mayor o igual a 101 °F (38,3 °C) o una temperatura persistente mayor o igual a 100,4 °F (38,0 °C) o mayor durante una hora o más.
Restricción
- Regulaciones gubernamentales estrictas
Las compañías farmacéuticas que desarrollan biosimilares como el filgrastim se enfrentan a un gran desafío en el proceso de aprobación de sus productos. Cada país tiene un proceso de aprobación diferente para todos los medicamentos, tratamientos, vacunas y dispositivos médicos. Sin embargo, estos procedimientos de aprobación son difíciles de seguir. Esto se debe a las diversas regulaciones y pruebas necesarias para demostrar la eficacia y seguridad del producto.
Los requisitos regulatorios de la Agencia Europea de Medicamentos garantizan los mismos estándares de alta calidad, seguridad y eficacia para los biosimilares que para los productos biológicos originales. También incluyen un ejercicio riguroso de comparabilidad con el producto de referencia, pero no son aceptados universalmente por los organismos regulatorios fuera de la Unión Europea (UE). Cabe señalar que los "productos biológicos similares" aprobados en la India, los "biogenéricos" aprobados en Irán, los "medicamentos biológicos similares" aprobados en Argentina y los productos biológicos no originales aprobados en Sudáfrica podrían no haber sido autorizados si hubieran estado sujetos a los estrictos procesos regulatorios requeridos para la aprobación de biosimilares en la UE.
Oportunidad
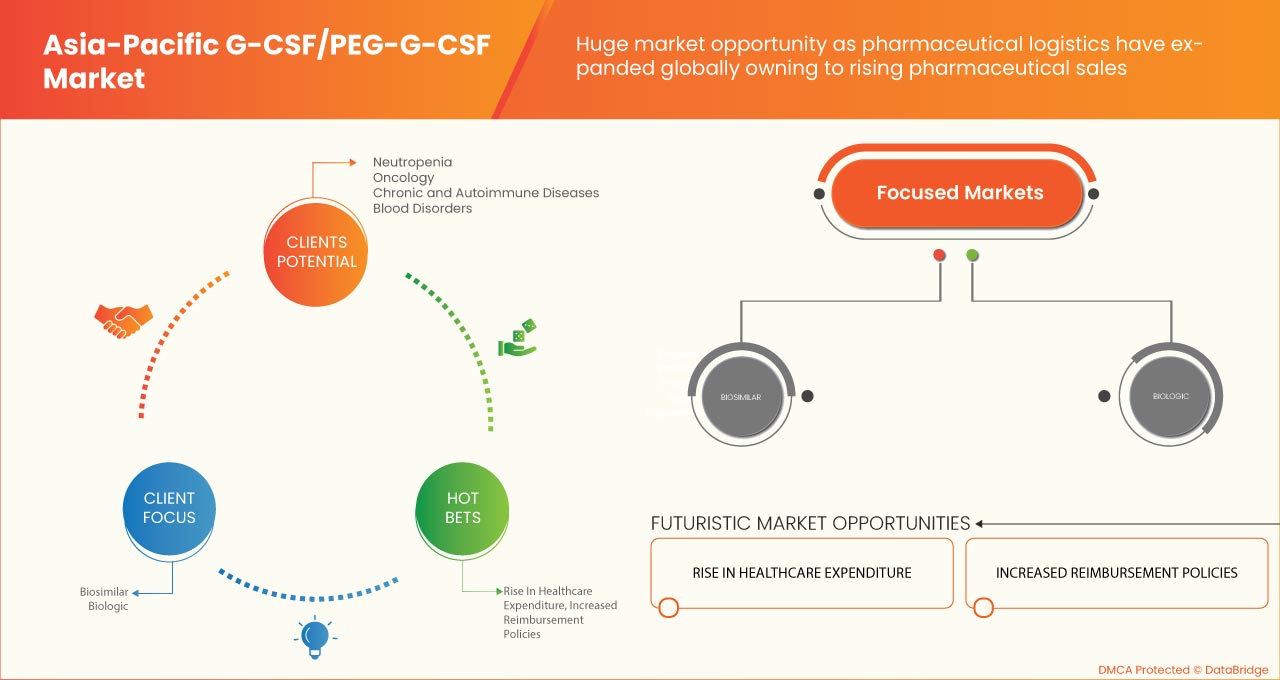
- El uso de biosimilares ayuda a reducir los costes sanitarios para los pacientes
Los biosimilares tienen el potencial de cambiar radicalmente la atención médica al ofrecer tratamientos más asequibles e igualmente eficaces para los pacientes y brindar más opciones de tratamiento a los médicos. El desarrollo de biosimilares requiere un análisis riguroso para demostrar su equivalencia con el producto de referencia y garantizar que no haya diferencias clínicamente significativas en su seguridad, eficacia y pureza. Como resultado, los sistemas de salud pueden canalizar los ahorros a largo plazo hacia mejoras generales en la atención al paciente. Para ayudar a crear un mercado de biosimilares próspero y garantizar el acceso de los pacientes, los responsables de las políticas pueden tomar medidas para reducir o eliminar el costo de los biosimilares y alentar a los médicos a recetar biosimilares en comparación con Europa.
Desafío
- Múltiples efectos secundarios del G-CSF
El factor estimulante de colonias de granulocitos (G-CSF) es un fármaco que se utiliza para tratar la neutropenia, un trastorno en el que ciertas formas de quimioterapia provocan una cantidad de glóbulos blancos inferior a la media. El G-CSF es un tipo de factor de crecimiento que hace que la médula ósea produzca más glóbulos blancos para reducir el riesgo de infección después de algunos tipos de tratamiento contra el cáncer. Pero el G-CSF tiene múltiples efectos secundarios, como dolor de huesos o músculos, hematomas, sangrado de encías o hemorragia nasal, diarrea, temperatura alta (fiebre), falta de aliento y palidez, dolor en la boca, la garganta, el intestino y el ano, entre otros. Estos efectos secundarios se pueden observar en más de 10 de cada 100 personas (más del 10%).
Según un estudio realizado por el NCBI, la mayoría de los donantes normales que reciben G-CSF experimentan efectos secundarios, pero estos son de grado leve a moderado. El noventa por ciento de los donantes experimentaron algún efecto secundario del G-CSF. Los efectos más frecuentes observados fueron dolor de huesos (83%), dolor de cabeza (39%), dolores corporales (23%), fatiga (14%) y náuseas y vómitos (12%), lo que se espera que actúe como un desafío para el crecimiento del mercado.
Impacto posterior a la COVID-19 en el mercado de G-CSF/PEG-G-CSF en Asia-Pacífico
La pandemia de COVID-19 ha tenido un impacto algo positivo en el mercado de G-CSF/PEG-G-CSF. La pandemia ha impuesto nuevas normas y regulaciones, como el distanciamiento social y los confinamientos, para prevenir la propagación del virus. Como resultado, las personas de todo el mundo se vieron obligadas a quedarse en casa, lo que dio lugar a nuevas tendencias, como el trabajo desde casa. Esta permanencia en casa ha provocado una disminución en el diagnóstico y el pronóstico de enfermedades. El mayor enfoque en el autocuidado, el ejercicio y la salud ha ayudado a que las aplicaciones y plataformas de fitness ganen una tracción significativa a raíz de la pandemia.
Los fabricantes están tomando diversas decisiones estratégicas para recuperarse tras la COVID-19. Los actores están llevando a cabo múltiples actividades de I+D y lanzamiento de productos y asociaciones estratégicas para mejorar la tecnología y los resultados de las pruebas involucradas en el mercado de diagnóstico de trasplantes.
Acontecimientos recientes
- En julio de 2018, Accord Healthcare, una subsidiaria de Intas Pharmaceuticals Ltd., lanzó un biosimilar de pegfilgrastim en toda Europa después de que el CHMP (Comité de Medicamentos de Uso Humano) diera luz verde a Pelgraz® (pegfilgrastim). Este lanzamiento ayudó a la empresa a expandir su negocio en toda Europa.
- En marzo de 2022, Kashiv Biosciences anunció la aprobación de su solicitud de licencia de productos biológicos (BLA) para filgrastim-ayow, un biosimilar que hace referencia a Neupogen, por parte de la Administración de Alimentos y Medicamentos de los Estados Unidos (FDA). El producto se comercializa con el nombre patentado RELEUKO.
Alcance del mercado de G-CSF/PEG-G-CSF en Asia-Pacífico
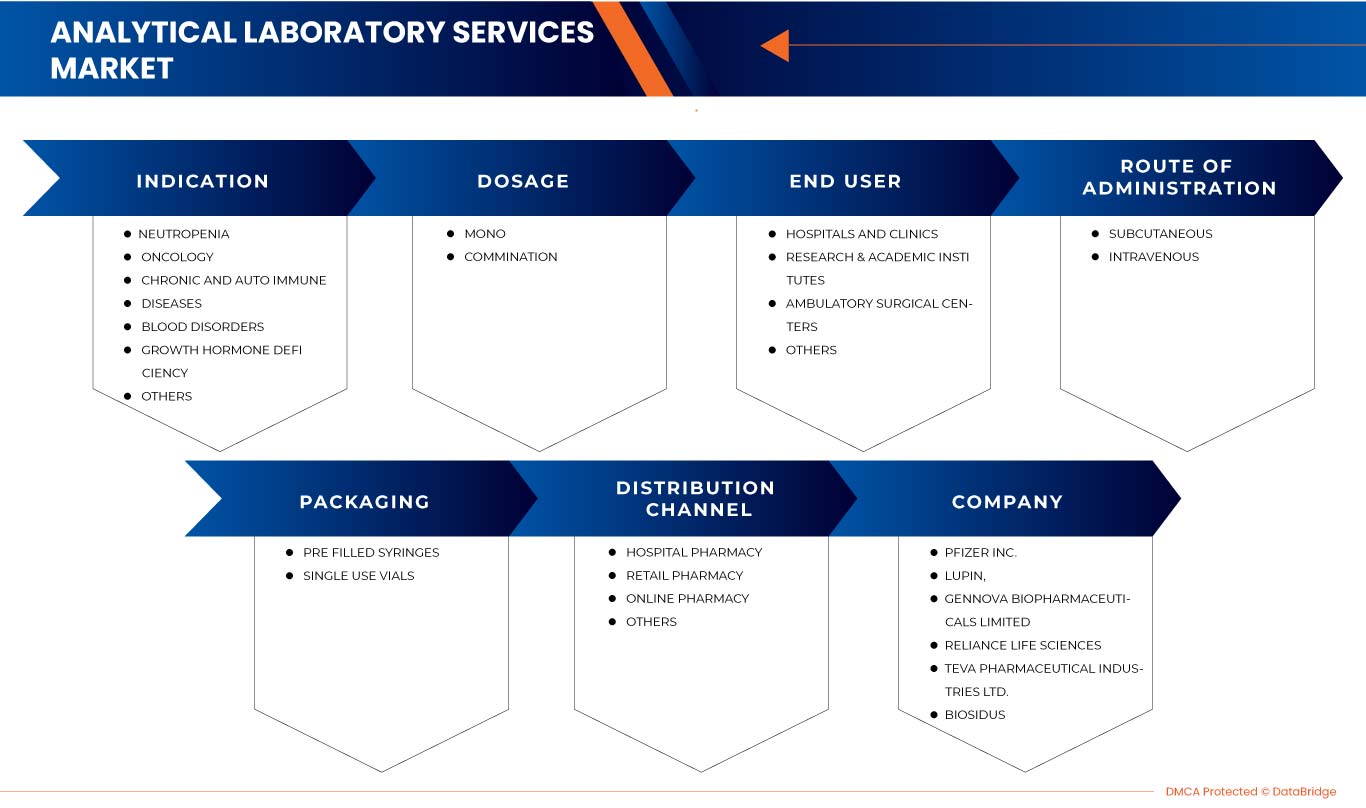
El mercado de G-CSF/PEG-G-CSF de Asia-Pacífico está segmentado por indicación, dosis, vía de administración, envase, usuario final y canal de distribución. El crecimiento entre segmentos le ayuda a analizar nichos de crecimiento y estrategias para abordar el mercado y determinar sus áreas de aplicación principales y la diferencia en sus mercados objetivo.
MERCADO DE G-CSF/PEG-G-CSF EN ASIA Y EL PACÍFICO, POR INDICACIÓN
- Neutropenia
- Oncología
- Enfermedades crónicas y autoinmunes
- Trastornos de la sangre
- Deficiencia de la hormona del crecimiento
- Otros
Sobre la base de la indicación, el G-CSF/PEG-G-CSF de Asia-Pacífico se segmenta además en neutropenia, oncología, enfermedades crónicas y autoinmunes, trastornos sanguíneos, deficiencia de la hormona del crecimiento y otros.
MERCADO DE G-CSF/PEG-G-CSF EN ASIA Y EL PACÍFICO, POR DOSIS
- Mononucleosis infecciosa
- Combinación
Sobre la base de la dosis, el G-CSF/PEG-G-CSF de Asia-Pacífico se segmenta además en mono y combinación.
MERCADO DE G-CSF/PEG-G-CSF EN ASIA Y EL PACÍFICO, POR VÍA DE ADMINISTRACIÓN
- Intravenoso
- Subcutáneo
Sobre la base de la vía de administración, el G-CSF/PEG-G-CSF de Asia-Pacífico se segmenta además en intravenoso y subcutáneo.
MERCADO DE G-CSF/PEG-G-CSF EN ASIA Y EL PACÍFICO, POR ENVASE
- Viales de un solo uso
- Jeringas precargadas
Sobre la base del envasado, el G-CSF/PEG-G-CSF de Asia-Pacífico se segmenta además en viales de un solo uso y jeringas precargadas.
MERCADO DE G-CSF/PEG-G-CSF EN ASIA Y EL PACÍFICO, POR USUARIO FINAL
- Hospitales y clínicas
- Institutos académicos y de investigación
- Centros de cirugía ambulatoria
- Otros
Sobre la base del usuario final, el G-CSF/PEG-G-CSF de Asia-Pacífico se segmenta además en hospitales y clínicas, institutos de investigación y académicos, centros quirúrgicos ambulatorios y otros.
MERCADO DE G-CSF/PEG-G-CSF EN ASIA Y EL PACÍFICO, POR CANAL DE DISTRIBUCIÓN
- Farmacia hospitalaria
- Farmacia en línea
- Farmacia minorista
- Otros
Sobre la base del canal de distribución, el G-CSF/PEG-G-CSF de Asia-Pacífico se segmenta además en farmacias hospitalarias, farmacias en línea, farmacias minoristas y otras.
Análisis y perspectivas regionales del mercado de G-CSF/PEG-G-CSF en Asia y el Pacífico
Se analiza el mercado de G-CSF/PEG-G-CSF de Asia-Pacífico y se proporciona información sobre el tamaño del mercado según el país, la indicación, la dosis, la vía de administración, el empaque, el usuario final y el canal de distribución.
El mercado de G-CSF/PEG-G-CSF de Asia-Pacífico comprende los países China, Japón, India, Australia, Nueva Zelanda, Indonesia, Tailandia, Vietnam, Singapur, Filipinas, Malasia y el resto de Asia-Pacífico.
China domina el mercado gracias a la presencia de actores clave en el mayor mercado de consumo con un PIB elevado. Se espera que China crezca debido a la creciente prevalencia de enfermedades crónicas y autoinmunes.
La sección de países del informe también proporciona factores de impacto individuales en el mercado y cambios en la regulación en el mercado a nivel nacional que afectan las tendencias actuales y futuras del mercado. Los puntos de datos como nuevas ventas, ventas de reemplazo, demografía del país, leyes regulatorias y aranceles de importación y exportación son algunos de los principales indicadores utilizados para pronosticar el escenario del mercado para países individuales. Además, se consideran la presencia y disponibilidad de marcas de Asia-Pacífico y los desafíos que enfrentan debido a la competencia grande o escasa de las marcas locales y nacionales, y el impacto de los canales de venta al proporcionar un análisis de pronóstico de los datos del país.
Análisis del panorama competitivo y de la cuota de mercado de G-CSF/PEG-G-CSF en Asia-Pacífico
El panorama competitivo del mercado de G-CSF/PEG-G-CSF en Asia-Pacífico proporciona detalles por competidor. Los detalles incluidos son una descripción general de la empresa, las finanzas de la empresa, los ingresos generados, el potencial de mercado, la inversión en I+D, las nuevas iniciativas de mercado, los sitios e instalaciones de producción, las fortalezas y debilidades de la empresa, el lanzamiento de productos, las líneas de prueba de productos, las aprobaciones de productos, las patentes, la amplitud y amplitud de los productos, el dominio de las aplicaciones y la curva de la línea de vida de la tecnología. Los puntos de datos anteriores proporcionados solo están relacionados con el enfoque de la empresa en el mercado de G-CSF/PEG-G-CSF en Asia-Pacífico.
Algunas de las principales empresas que operan en el mercado son USV Private Limited, Viatris Inc., Biocon, Fresenius Kabi AG, Hangzhou Jiuyuan Gene Engineering Co., Ltd., Amgen Inc., Pfizer Inc., Sandoz International GmbH, Apotex Inc., Cadila Pharmaceuticals, Dr. Reddy's Laboratories Ltd., Amneal Pharmaceuticals LLC., Coherus BioSciences, Accord Healthcare, NAPP PHARMACEUTICALS LIMITED., Intas Pharmaceuticals Ltd., Mundipharma International, Teva Pharmaceutical Industries Ltd., Spectrum Pharmaceuticals, Inc., Kyowa Kirin Co., Ltd., Jiangsu Hengrui Pharmaceuticals Co., Ltd., entre otras.
SKU-
Obtenga acceso en línea al informe sobre la primera nube de inteligencia de mercado del mundo

- Panel de análisis de datos interactivo
- Panel de análisis de empresas para oportunidades con alto potencial de crecimiento
- Acceso de analista de investigación para personalización y consultas
- Análisis de la competencia con panel interactivo
- Últimas noticias, actualizaciones y análisis de tendencias
- Aproveche el poder del análisis de referencia para un seguimiento integral de la competencia
Tabla de contenido
1 INTRODUCTION
1.1 OBJECTIVES OF THE STUDY
1.2 MARKET DEFINITION
1.3 OVERVIEW OF ASIA PACIFIC G-CSF / PEG-G-CSF MARKET
1.4 LIMITATIONS
1.5 MARKETS COVERED
2 MARKET SEGMENTATION
2.1 MARKETS COVERED
2.2 GEOGRAPHICAL SCOPE
2.3 YEARS CONSIDERED FOR THE STUDY
2.4 CURRENCY AND PRICING
2.5 DBMR TRIPOD DATA VALIDATION MODEL
2.6 MULTIVARIATE MODELLING
2.7 TYPE LIFELINE CURVE
2.8 PRIMARY INTERVIEWS WITH KEY OPINION LEADERS
2.9 DBMR MARKET POSITION GRID
2.1 MARKET END USER COVERAGE GRID
2.11 VENDOR SHARE ANALYSIS
2.12 SECONDARY SOURCES
2.13 ASSUMPTIONS
3 EXECUTIVE SUMMARY
4 PREMIUM INSIGHTS
4.1 PESTEL ANALYSIS
4.2 PORTER’S FIVE FORCES
4.3 ASIA PACIFIC G-CSF/PEG-G-CSF MARKET: MERGERS AND ACQUISITION
4.4 ASIA PACIFIC G-CSF / PEG-G-CSF MARKET
4.5 STRATEGIES TO THE ENTER THE MARKET
4.5.1 JOINT VENTURE (PARTNERSHIPS):
4.5.2 ACQUISITION:
4.5.3 LINE EXPANSION VIA COLLABORATION:
4.5.4 PRODUCT APPROVAL:
4.5.5 PRODUCT LAUNCH:
4.5.6 GEOGRAPHIC EXPANSION:
4.5.7 COST LEADERSHIP:
4.5.8 PRODUCT DEVELOPMENT:
4.6 ASIA PACIFIC G-CSF / PEG-G-CSF MARKET, INDUSTRY INSIGHTS
4.6.1 PATENT ANALYSIS
4.6.2 DRUG TREATMENT RATE BY MATURED MARKETS
4.6.3 DEMOGRAPHIC TRENDS: IMPACTS ON ALL INCIDENCE RATES
4.6.4 THERAPEUTIC ASSESSMENT
4.6.5 KEY PRICING STRATEGIES
4.6.6 KEY PATIENT ENROLLMENT STRATEGIES
4.6.7 CONCLUSION
4.7 PIPELINE ANALYSIS FOR ASIA PACIFIC G-CSF / PEG-G-CSF MARKET
5 EPIDEMIOLOGY
6 ASIA PACIFIC G-CSF / PEG-G-CSF MARKET: REGULATIONS
7 MARKET OVERVIEW
7.1 DRIVERS
7.1.1 GROWING INCIDENCES OF BLOOD CANCERS AND CANCER DISEASES
7.1.2 RISING INCIDENCES OF AUTOIMMUNE DISORDERS
7.1.3 INCREASING CASES OF FEBRILE NEUTROPENIA
7.1.4 INCREASING AWARENESS ABOUT FILGRASTIM AND PEGFILGRASTIM
7.2 RESTRAIN
7.2.1 STRINGENT GOVERNMENTAL REGULATIONS
7.2.2 AVAILABILITY OF ALTERNATIVES FOR THE CHEMOTHERAPY
7.3 OPPORTUNITIES
7.3.1 THE USE OF BIOSIMILARS HELPS REDUCE HEALTHCARE COSTS FOR PATIENTS
7.3.2 COST-EFFECTIVENESS AND PATENT EXPIRY OF BIOLOGICAL PRODUCTS
7.4 CHALLENGES
7.4.1 THE HIGH COST ASSOCIATED WITH BRANDED BIOLOGICS AND IMPROVED CHEMOTHERAPY
7.4.2 THE MULTIPLE SIDE EFFECTS OF G-CSF
8 ASIA PACIFIC G-CSF/ PEG-G-CSF MARKET, BY INDICATION
8.1 OVERVIEW
8.2 NEUTROPENIA
8.2.1 CHEMOTHERAPY INDUCED FEBRILE NEUTROPENIA (MYELOSUPPRESSIVE CHEMOTHERAPY TREATMENT)
8.2.2 SEVERE CHRONIC NEUTROPENIA
8.2.3 RADIOTHERAPY INDUCED NEUTROPENIA
8.2.4 NEUTROPENIA IN HIV PATIENTS
8.2.5 CLOZAPINE INDUCED NEUTROPENIA
8.2.6 NEUTROPENIA IN HEPATITIS C PATIENTS
8.2.7 CONGENITAL NEUTROPENIA
8.3 ONCOLOGY
8.3.1 ACUTE MYELOID LEUKEMIA RECEIVING CONSOLIDATION CHEMOTHERAPY
8.3.2 OTHERS
8.4 CHRONIC AND AUTO IMMUNE DISEASES
8.5 BLOOD DISORDERS
8.6 GROWTH HORMONE DEFICIENCY
8.7 OTHERS
9 ASIA PACIFIC G-CSF/ PEG-G-CSF MARKET, BY DOSAGE
9.1 OVERVIEW
9.2 MONO
9.3 COMBINATION
10 ASIA PACIFIC G-CSF/ PEG-G-CSF MARKET, BY ROUTE OF ADMINISTRATION
10.1 OVERVIEW
10.2 SUBCUTANEOUS
10.3 INTRAVENOUS
11 ASIA PACIFIC G-CSF/ PEG-G-CSF MARKET, BY PACKAGING
11.1 OVERVIEW
11.2 PRE FILLED SYRINGES
11.3 SINGLE USE VIALS
12 ASIA PACIFIC G-CSF/ PEG-G-CSF MARKET, BY END USER
12.1 OVERVIEW
12.2 HOSPITALS AND CLINICS
12.3 RESEARCH & ACADEMIC INSTITUTES
12.4 AMBULATORY SURGICAL CENTERS
12.5 OTHERS
13 ASIA PACIFIC G-CSF/ PEG-G-CSF MARKET, BY DISTRIBUTION CHANNEL
13.1 OVERVIEW
13.2 HOSPITALS PHARMACY
13.3 RETAIL PHARMACY
13.4 ONLINE PHARMACY
13.5 OTHERS
14 ASIA PACIFIC G-CSF/PEG-G-CSF MARKET, BY REGION
14.1 ASIA-PACIFIC
14.1.1 CHINA
14.1.2 INDIA
14.1.3 INDONESIA
14.1.4 THAILAND
14.1.5 VIETNAM
14.1.6 SINGAPORE
14.1.7 PHILIPPINES
14.1.8 MALAYSIA
15 ASIA PACIFIC G-CSF / PEG-G-CSF MARKET, COMPANY LANDSCAPE
15.1 COMPANY SHARE ANALYSIS: ASIA PACIFIC
16 SWOT ANALYSIS
17 COMPANY PROFILE
17.1 PFIZER INC.
17.1.1 COMPANY SNAPSHOT
17.1.2 REVENUE ANALYSIS
17.1.3 COMPANY SHARE ANALYSIS
17.1.4 PRODUCT PORTFOLIO
17.1.5 RECENT DEVELOPMENTS
17.2 VIATRIS INC.
17.2.1 COMPANY SNAPSHOT
17.2.2 REVENUE ANALYSIS
17.2.3 COMPANY SHARE ANALYSIS
17.2.4 PRODUCT PORTFOLIO
17.2.5 RECENT DEVELOPMENT
17.3 AMGEN INC.
17.3.1 COMPANY SNAPSHOT
17.3.2 REVENUE ANALYSIS
17.3.3 COMPANY SHARE ANALYSIS
17.3.4 PRODUCT PORTFOLIO
17.3.5 RECENT DEVELOPMENTS
17.4 STADA ARZENEIMITTEL AG
17.4.1 COMPANY SNAPSHOT
17.4.2 COMPANY SHARE ANALYSIS
17.4.3 PRODUCT PORTFOLIO
17.4.4 RECENT DEVELOPMENT
17.5 TEVA PHARMACEUTICAL INDUSTRIES LTD.
17.5.1 COMPANY SNAPSHOT
17.5.2 REVENUE ANALYSIS
17.5.3 COMPANY SHARE ANALYSIS
17.5.4 PRODUCT PORTFOLIO
17.5.5 RECENT DEVELOPMENTS
17.6 JIANGSU HENGRUI PHARMACEUTICALS CO., LTD.
17.6.1 COMPANY SNAPSHOT
17.6.2 PRODUCT PORTFOLIO
17.6.3 RECENT DEVELOPMENTS
17.7 ACCORD HEALTHCARE
17.7.1 COMPANY SNAPSHOT
17.7.2 PRODUCT PORTFOLIO
17.7.3 RECENT DEVELOPMENTS
17.8 AMNEAL PHARMACEUTICALS LLC.
17.8.1 COMPANY SNAPSHOT
17.8.2 REVENUE ANALYSIS
17.8.3 PRODUCT PORTFOLIO
17.8.4 RECENT DEVELOPMENTS
17.9 APOTEX INC.
17.9.1 COMPANY SNAPSHOT
17.9.2 PRODUCT PORTFOLIO
17.9.3 RECENT DEVELOPMENT
17.1 BIOCON
17.10.1 COMPANY SNAPSHOT
17.10.2 REVENUE ANALYSIS
17.10.3 PRODUCT PORTFOLIO
17.10.4 RECENT DEVELOPMENT
17.11 BIO SIDUS
17.11.1 COMPANY SNAPSHOT
17.11.2 PRODUCT PORTFOLIO
17.11.3 RECENT DEVELOPMENTS
17.12 CADILA PHARMACEUTICALS
17.12.1 COMPANY SNAPSHOT
17.12.2 PRODUCT PORTFOLIO
17.12.3 RECENT DEVELOPMENTS
17.13 COHERUS BIOSCIENCES
17.13.1 COMPANY SNAPSHOT
17.13.2 REVENUE ANALYSIS
17.13.3 PRODUCT PORTFOLIO
17.13.4 RECENT DEVELOPMENT
17.14 DR. REDDY’S LABORATORIES LTD
17.14.1 COMPANY SNAPSHOT
17.14.2 REVENUE ANALYSIS
17.14.3 PRODUCT PORTFOLIO
17.14.4 RECENT DEVELOPMENTS
17.15 FRESENIUS KABI AG
17.15.1 COMPANY SNAPSHOT
17.15.2 PRODUCT PORTFOLIO
17.15.3 RECENT DEVELOPMENT
17.16 GENNOVA BIOPHARMACEUTICALS LIMITED
17.16.1 COMPANY SNAPSHOT
17.16.2 PRODUCT PORTFOLIO
17.16.3 RECENT DEVELOPMENTS
17.17 HANGZHOU JIUYUAN GENE ENGINEERING CO., LTD.
17.17.1 COMPANY SNAPSHOT
17.17.2 PRODUCT PORTFOLIO
17.17.3 RECENT DEVELOPMENTS
17.18 INTAS PHARMACEUTICALS LTD.
17.18.1 COMPANY SNAPSHOT
17.18.2 PRODUCT PORTFOLIO
17.18.3 RECENT DEVELOPMENT
17.19 KASHIV BIOSCIENCES, LLC.
17.19.1 COMPANY SNAPSHOT
17.19.2 PRODUCT PORTFOLIO
17.19.3 RECENT DEVELOPMENT
17.2 KYOWA KIRIN CO., LTD.
17.20.1 COMPANY SNAPSHOT
17.20.2 REVENUE ANALYSIS
17.20.3 PRODUCT PORTFOLIO
17.20.4 RECENT DEVELOPMENT
17.21 LUPIN
17.21.1 COMPANY SNAPSHOT
17.21.2 REVENUE ANALYSIS
17.21.3 PRODUCT PORTFOLIO
17.21.4 RECENT DEVELOPMENT
17.22 MUNDIPHARMA INTERNATIONAL.
17.22.1 COMPANY SNAPSHOT
17.22.2 PRODUCT PORTFOLIO
17.22.3 RECENT DEVELOPMENT
17.23 NAPP PHARMACEUTICALS LIMITED
17.23.1 COMPANY SNAPSHOT
17.23.2 PRODUCT PORTFOLIO
17.23.3 RECENT DEVELOPMENT
17.24 RELIANCE LIFE SCIENCES
17.24.1 COMPANY SNAPSHOT
17.24.2 PRODUCT PORTFOLIO
17.24.3 RECENT DEVELOPMENTS
17.25 SANDOZ INTERNATIONAL GMBH
17.25.1 COMPANY SNAPSHOT
17.25.2 REVENUE ANALYSIS
17.25.3 PRODUCT PORTFOLIO
17.25.4 RECENT DEVELOPMENTS
17.26 SPECTRUM PHARMACEUTICALS, INC.
17.26.1 COMPANY SNAPSHOT
17.26.2 PRODUCT PORTFOLIO
17.26.3 RECENT DEVELOPMENT
17.27 USV PRIVATE LIMITED
17.27.1 COMPANY SNAPSHOT
17.27.2 PRODUCT PORTFOLIO
17.27.3 RECENT DEVELOPMENTS
18 QUESTIONNAIRE
19 RELATED REPORTS
Lista de Tablas
TABLE 1 BELOW ARE THE RULES AND REGULATIONS TO GET APPROVAL FOR USE IN THE MARKET:
TABLE 2 ASIA PACIFIC G-CSF/ PEG-G-CSF MARKET, BY INDICATION, 2021-2030 (USD MILLION)
TABLE 3 ASIA PACIFIC NEUTROPENIA IN G-CSF/ PEG-G-CSF MARKET, BY REGION, 2020-2029 (USD MILLION)
TABLE 4 ASIA PACIFIC NEUTROPENIA IN G-CSF/ PEG-G-CSF MARKET, BY INDICATION, 2021-2030 (USD MILLION)
TABLE 5 ASIA PACIFIC ONCOLOGY IN G-CSF/ PEG-G-CSF MARKET, BY REGION, 2020-2029 (USD MILLION)
TABLE 6 ASIA PACIFIC ONCOLOGY IN G-CSF/ PEG-G-CSF MARKET, BY INDICATION, 2021-2030 (USD MILLION)
TABLE 7 ASIA PACIFIC CHRONIC AND AUTO IMMUNE DISEASES IN G-CSF/ PEG-G-CSF MARKET, BY REGION, 2020-2029 (USD MILLION)
TABLE 8 ASIA PACIFIC BLOOD DISORDERS IN G-CSF/ PEG-G-CSF MARKET, BY REGION, 2020-2029 (USD MILLION)
TABLE 9 ASIA PACIFIC GROWTH HORMONE DEFICIENCY IN G-CSF/ PEG-G-CSF MARKET, BY REGION, 2020-2029 (USD MILLION)
TABLE 10 ASIA PACIFIC OTHERS IN G-CSF/ PEG-G-CSF MARKET, BY REGION, 2020-2029 (USD MILLION)
TABLE 11 ASIA PACIFIC G-CSF/ PEG-G-CSF MARKET, BY DOSAGE, 2020-2029 (USD MILLION)
TABLE 12 ASIA PACIFIC MONO IN G-CSF/ PEG-G-CSF MARKET, BY REGION, 2020-2029 (USD MILLION)
TABLE 13 ASIA PACIFIC COMBINATION IN G-CSF/ PEG-G-CSF MARKET, BY REGION, 2020-2029 (USD MILLION)
TABLE 14 ASIA PACIFIC G-CSF/ PEG-G-CSF MARKET, BY ROUTE OF ADMINISTRATION, 2020-2029 (USD MILLION)
TABLE 15 ASIA PACIFIC SUBCUTANEOUS IN G-CSF/ PEG-G-CSF MARKET, BY REGION, 2020-2029 (USD MILLION)
TABLE 16 ASIA PACIFIC INTRAVENOUS IN G-CSF/ PEG-G-CSF MARKET, BY REGION, 2020-2029 (USD MILLION)
TABLE 17 ASIA PACIFIC G-CSF/ PEG-G-CSF MARKET, BY PACKAGING, 2020-2029 (USD MILLION)
TABLE 18 ASIA PACIFIC PRE FILLED SYRINGES IN G-CSF/ PEG-G-CSF MARKET, BY REGION, 2020-2029 (USD MILLION)
TABLE 19 ASIA PACIFIC SINGLE USE VIALS IN G-CSF/ PEG-G-CSF MARKET, BY REGION, 2020-2029 (USD MILLION)
TABLE 20 ASIA PACIFIC G-CSF/ PEG-G-CSF MARKET, BY END USER, 2020-2029 (USD MILLION)
TABLE 21 ASIA PACIFIC HOSPITALS AND CLINICS IN G-CSF/ PEG-G-CSF MARKET, BY REGION, 2020-2029 (USD MILLION)
TABLE 22 ASIA PACIFIC RESEARCH & ACADEMIC INSTITUTES IN G-CSF/ PEG-G-CSF MARKET, BY REGION, 2020-2029 (USD MILLION)
TABLE 23 ASIA PACIFIC AMBULATORY SURGICAL CENTERS IN G-CSF/ PEG-G-CSFMARKET, BY REGION, 2020-2029 (USD MILLION)
TABLE 24 ASIA PACIFIC OTHERS IN G-CSF/ PEG-G-CSF MARKET, BY REGION, 2020-2029 (USD MILLION)
TABLE 25 ASIA PACIFIC G-CSF/ PEG-G-CSF MARKET, BY DISTRIBUTION CHANNEL, 2020-2029 (USD MILLION)
TABLE 26 ASIA PACIFIC HOSPITALS PHARMACY IN G-CSF/ PEG-G-CSF MARKET, BY REGION, 2020-2029 (USD MILLION)
TABLE 27 ASIA PACIFIC RETAIL PHARMACY IN G-CSF/ PEG-G-CSF MARKET, BY REGION, 2020-2029 (USD MILLION)
TABLE 28 ASIA PACIFIC ONLINE PHARMACY IN G-CSF/ PEG-G-CSFMARKET, BY REGION, 2020-2029 (USD MILLION)
TABLE 29 ASIA PACIFIC OTHERS IN G-CSF/ PEG-G-CSF MARKET, BY REGION, 2020-2029 (USD MILLION)
TABLE 30 ASIA-PACIFIC G-CSF / PEG-G-CSF MARKET, 2020-2030 (USD MILLION)
TABLE 31 ASIA-PACIFIC G-CSF / PEG-G-CSF MARKET, 2020-2030 (USD MILLION)
TABLE 32 ASIA-PACIFIC G-CSF / PEG-G-CSF MARKET, BY COUNTRY, 2020-2030 (USD MILLION)
TABLE 33 ASIA-PACIFIC G-CSF / PEG-G-CSF MARKET, BY INDICATION, 2020-2030 (USD MILLION)
TABLE 34 ASIA-PACIFIC NEUTROPENIA IN G-CSF / PEG-G-CSF MARKET, BY INDICATION, 2020-2030 (USD MILLION)
TABLE 35 ASIA-PACIFIC ONCOLOGY IN G-CSF / PEG-G-CSF MARKET, BY INDICATION, 2020-2030 (USD MILLION)
TABLE 36 ASIA-PACIFIC G-CSF / PEG-G-CSF MARKET, BY DOSAGE, 2020-2030 (USD MILLION)
TABLE 37 ASIA-PACIFIC G-CSF / PEG-G-CSF MARKET, BY ROUTE OF ADMINISTRATION, 2020-2030 (USD MILLION)
TABLE 38 ASIA-PACIFIC G-CSF / PEG-G-CSF MARKET, BY PACKAGING, 2020-2030 (USD MILLION)
TABLE 39 ASIA-PACIFIC G-CSF / PEG-G-CSF MARKET, BY END USER, 2020-2030 (USD MILLION)
TABLE 40 ASIA-PACIFIC G-CSF / PEG-G-CSF MARKET, BY DISTRIBUTION CHANNEL, 2020-2030 (USD MILLION)
TABLE 41 CHINA G-CSF / PEG-G-CSF MARKET, BY INDICATION, 2020-2030 (USD MILLION)
TABLE 42 CHINA NEUTROPENIA IN G-CSF / PEG-G-CSF MARKET, BY INDICATION, 2020-2030 (USD MILLION)
TABLE 43 CHINA ONCOLOGY IN G-CSF / PEG-G-CSF MARKET, BY INDICATION, 2020-2030 (USD MILLION)
TABLE 44 CHINA G-CSF / PEG-G-CSF MARKET, BY DOSAGE, 2020-2030 (USD MILLION)
TABLE 45 CHINA MONO IN G-CSF / PEG-G-CSF MARKET, BY BRAND, 2020-2030 (USD MILLION)
TABLE 46 CHINA G-CSF / PEG-G-CSF MARKET, BY ROUTE OF ADMINISTRATION, 2020-2030 (USD MILLION)
TABLE 47 CHINA SUBCUTANEOUS IN G-CSF / PEG-G-CSF MARKET, BY BRAND, 2020-2030 (USD MILLION)
TABLE 48 CHINA PRE FILLED SYRINGES IN G-CSF / PEG-G-CSF MARKET, BY BRAND, 2020-2030 (USD MILLION)
TABLE 49 CHINA G-CSF / PEG-G-CSF MARKET, BY END USER, 2020-2030 (USD MILLION)
TABLE 50 CHINA HOSPITAL AND CLINICS IN G-CSF / PEG-G-CSF MARKET, BY BRAND, 2020-2030 (USD MILLION)
TABLE 51 CHINA HOSPITAL AND CLINICS IN G-CSF / PEG-G-CSF MARKET, BY BRAND, 2020-2030 VOLUME (UNITS)
TABLE 52 CHINA RESEARCH AND ACADEMIC INSTITUTES IN G-CSF / PEG-G-CSF MARKET, BY BRAND, 2020-2030 (USD MILLION)
TABLE 53 CHINA RESEARCH AND ACADEMIC INSTITUTES IN G-CSF / PEG-G-CSF MARKET, BY BRAND, 2020-2030 ASP (USD)
TABLE 54 CHINA RESEARCH AND ACADEMIC INSTITUTES IN G-CSF / PEG-G-CSF MARKET, BY BRAND, 2020-2030 VOLUME (UNITS)
TABLE 55 CHINA AMBULATORY SURGICAL CENTERS IN G-CSF / PEG-G-CSF MARKET, BY BRAND, 2020-2030 (USD MILLION)
TABLE 56 CHINA AMBULATORY SURGICAL CENTERS IN G-CSF / PEG-G-CSF MARKET, BY BRAND, 2020-2030 ASP (USD)
TABLE 57 CHINA AMBULATORY SURGICAL CENTERS IN G-CSF / PEG-G-CSF MARKET, BY BRAND, 2020-2030 VOLUME (UNITS)
TABLE 58 CHINA G-CSF / PEG-G-CSF MARKET, BY DISTRIBUTION CHANNEL, 2020-2030 (USD MILLION)
TABLE 59 CHINA HOSPITAL PHARMACY IN G-CSF / PEG-G-CSF MARKET, BY BRAND, 2020-2030 (USD MILLION)
TABLE 60 CHINA HOSPITAL PHARMACY IN G-CSF / PEG-G-CSF MARKET, BY BRAND, 2020-2030 ASP (USD)
TABLE 61 CHINA HOSPITAL PHARMACY IN G-CSF / PEG-G-CSF MARKET, BY BRAND, 2020-2030 VOLUME (UNITS)
TABLE 62 CHINA RETAIL PHARMACY IN G-CSF / PEG-G-CSF MARKET, BY BRAND, 2020-2030 (USD MILLION)
TABLE 63 CHINA RETAIL PHARMACY IN G-CSF / PEG-G-CSF MARKET, BY BRAND, 2020-2030 ASP (USD)
TABLE 64 CHINA RETAIL PHARMACY IN G-CSF / PEG-G-CSF MARKET, BY BRAND, 2020-2030 VOLUME (UNITS)
TABLE 65 CHINA ONLINE PHARMACY IN G-CSF / PEG-G-CSF MARKET, BY BRAND, 2020-2030 (USD MILLION)
TABLE 66 CHINA ONLINE PHARMACY IN G-CSF / PEG-G-CSF MARKET, BY BRAND, 2020-2030 ASP (USD)
TABLE 67 CHINA ONLINE PHARMACY IN G-CSF / PEG-G-CSF MARKET, BY BRAND, 2020-2030 VOLUME (UNITS)
TABLE 68 INDIA G-CSF / PEG-G-CSF MARKET, BY INDICATION, 2020-2030 (USD MILLION)
TABLE 69 INDIA NEUTROPENIA IN G-CSF / PEG-G-CSF MARKET, BY INDICATION, 2020-2030 (USD MILLION)
TABLE 70 INDIA ONCOLOGY IN G-CSF / PEG-G-CSF MARKET, BY INDICATION, 2020-2030 (USD MILLION)
TABLE 71 INDIA G-CSF / PEG-G-CSF MARKET, BY DOSAGE, 2020-2030 (USD MILLION)
TABLE 72 INDIA MONO IN G-CSF / PEG-G-CSF MARKET, BY BRAND, 2020-2030 (USD MILLION)
TABLE 73 INDIA COMBINATION IN G-CSF / PEG-G-CSF MARKET, BY BRAND, 2020-2030 (USD MILLION)
TABLE 74 INDIA G-CSF / PEG-G-CSF MARKET, BY ROUTE OF ADMINISTRATION, 2020-2030 (USD MILLION)
TABLE 75 INDIA SUBCUTANEOUS IN G-CSF / PEG-G-CSF MARKET, BY BRAND, 2020-2030 (USD MILLION)
TABLE 76 INDIA G-CSF / PEG-G-CSF MARKET, BY PACKAGING, 2020-2030 (USD MILLION)
TABLE 77 INDIA PRE FILLED SYRINGES IN G-CSF / PEG-G-CSF MARKET, BY BRAND, 2020-2030 (USD MILLION)
TABLE 78 INDIA G-CSF / PEG-G-CSF MARKET, BY END USER, 2020-2030 (USD MILLION)
TABLE 79 INDIA HOSPITAL AND CLINICS IN G-CSF / PEG-G-CSF MARKET, BY BRAND, 2020-2030 (USD MILLION)
TABLE 80 INDIA HOSPITAL AND CLINICS IN G-CSF / PEG-G-CSF MARKET, BY BRAND, 2020-2030 ASP (USD)
TABLE 81 INDIA HOSPITAL AND CLINICS IN G-CSF / PEG-G-CSF MARKET, BY BRAND, 2020-2030 VOLUME (UNITS)
TABLE 82 INDIA RESEARCH AND ACADEMIC INSTITUTES IN G-CSF / PEG-G-CSF MARKET, BY BRAND, 2020-2030 (USD MILLION)
TABLE 83 INDIA RESEARCH AND ACADEMIC INSTITUTES IN G-CSF / PEG-G-CSF MARKET, BY BRAND, 2020-2030 ASP (USD)
TABLE 84 INDIA RESEARCH AND ACADEMIC INSTITUTES IN G-CSF / PEG-G-CSF MARKET, BY BRAND, 2020-2030 VOLUME (UNITS)
TABLE 85 INDIA AMBULATORY SURGICAL CENTERS IN G-CSF / PEG-G-CSF MARKET, BY BRAND, 2020-2030 (USD MILLION)
TABLE 86 INDIA AMBULATORY SURGICAL CENTERS IN G-CSF / PEG-G-CSF MARKET, BY BRAND, 2020-2030 ASP (USD)
TABLE 87 INDIA AMBULATORY SURGICAL CENTERS IN G-CSF / PEG-G-CSF MARKET, BY BRAND, 2020-2030 VOLUME (UNITS)
TABLE 88 INDIA G-CSF / PEG-G-CSF MARKET, BY DISTRIBUTION CHANNEL, 2020-2030 (USD MILLION)
TABLE 89 INDIA HOSPITAL PHARMACY IN G-CSF / PEG-G-CSF MARKET, BY BRAND, 2020-2030 (USD MILLION)
TABLE 90 INDIA HOSPITAL PHARMACY IN G-CSF / PEG-G-CSF MARKET, BY BRAND, 2020-2030 ASP (USD)
TABLE 91 INDIA HOSPITAL PHARMACY IN G-CSF / PEG-G-CSF MARKET, BY BRAND, 2020-2030 VOLUME (UNITS)
TABLE 92 INDIA RETAIL PHARMACY IN G-CSF / PEG-G-CSF MARKET, BY BRAND, 2020-2030 (USD MILLION)
TABLE 93 INDIA RETAIL PHARMACY IN G-CSF / PEG-G-CSF MARKET, BY BRAND, 2020-2030 ASP (USD)
TABLE 94 INDIA RETAIL PHARMACY IN G-CSF / PEG-G-CSF MARKET, BY BRAND, 2020-2030 VOLUME (UNITS)
TABLE 95 INDIA ONLINE PHARMACY IN G-CSF / PEG-G-CSF MARKET, BY BRAND, 2020-2030 (USD MILLION)
TABLE 96 INDIA ONLINE PHARMACY IN G-CSF / PEG-G-CSF MARKET, BY BRAND, 2020-2030 ASP (USD)
TABLE 97 INDIA ONLINE PHARMACY IN G-CSF / PEG-G-CSF MARKET, BY BRAND, 2020-2030 VOLUME (UNITS)
TABLE 98 INDONESIA G-CSF / PEG-G-CSF MARKET, BY INDICATION, 2020-2030 (USD MILLION)
TABLE 99 INDONESIA NEUTROPENIA IN G-CSF / PEG-G-CSF MARKET, BY INDICATION, 2020-2030 (USD MILLION)
TABLE 100 INDONESIA ONCOLOGY IN G-CSF / PEG-G-CSF MARKET, BY INDICATION, 2020-2030 (USD MILLION)
TABLE 101 INDONESIA G-CSF / PEG-G-CSF MARKET, BY DOSAGE, 2020-2030 (USD MILLION)
TABLE 102 INDONESIA MONO IN G-CSF / PEG-G-CSF MARKET, BY BRAND, 2020-2030 (USD MILLION)
TABLE 103 INDONESIA G-CSF / PEG-G-CSF MARKET, BY ROUTE OF ADMINISTRATION, 2020-2030 (USD MILLION)
TABLE 104 INDONESIA SUBCUTANEOUS IN G-CSF / PEG-G-CSF MARKET, BY BRAND, 2020-2030 (USD MILLION)
TABLE 105 INDONESIA INTRAVENOUS IN G-CSF / PEG-G-CSF MARKET, BY BRAND, 2020-2030 (USD MILLION)
TABLE 106 INDONESIA G-CSF / PEG-G-CSF MARKET, BY PACKAGING, 2020-2030 (USD MILLION)
TABLE 107 INDONESIA PRE FILLED SYRINGES IN G-CSF / PEG-G-CSF MARKET, BY BRAND, 2020-2030 (USD MILLION)
TABLE 108 INDONESIA SINGLE USE VIALS IN G-CSF / PEG-G-CSF MARKET, BY BRAND, 2020-2030 (USD MILLION)
TABLE 109 INDONESIA G-CSF / PEG-G-CSF MARKET, BY END USER, 2020-2030 (USD MILLION)
TABLE 110 INDONESIA HOSPITAL AND CLINICS IN G-CSF / PEG-G-CSF MARKET, BY BRAND, 2020-2030 (USD MILLION)
TABLE 111 INDONESIA HOSPITAL AND CLINICS IN G-CSF / PEG-G-CSF MARKET, BY BRAND, 2020-2030 ASP (USD)
TABLE 112 INDONESIA HOSPITAL AND CLINICS IN G-CSF / PEG-G-CSF MARKET, BY BRAND, 2020-2030 VOLUME (UNITS)
TABLE 113 INDONESIA RESEARCH AND ACADEMIC INSTITUTES IN G-CSF / PEG-G-CSF MARKET, BY BRAND, 2020-2030 (USD MILLION)
TABLE 114 INDONESIA RESEARCH AND ACADEMIC INSTITUTES IN G-CSF / PEG-G-CSF MARKET, BY BRAND, 2020-2030 ASP (USD)
TABLE 115 INDONESIA RESEARCH AND ACADEMIC INSTITUTES IN G-CSF / PEG-G-CSF MARKET, BY BRAND, 2020-2030 VOLUME (UNITS)
TABLE 116 INDONESIA AMBULATORY SURGICAL CENTERS IN G-CSF / PEG-G-CSF MARKET, BY BRAND, 2020-2030 (USD MILLION)
TABLE 117 INDONESIA AMBULATORY SURGICAL CENTERS IN G-CSF / PEG-G-CSF MARKET, BY BRAND, 2020-2030 ASP (USD)
TABLE 118 INDONESIA AMBULATORY SURGICAL CENTERS IN G-CSF / PEG-G-CSF MARKET, BY BRAND, 2020-2030 VOLUME (UNITS)
TABLE 119 INDONESIA G-CSF / PEG-G-CSF MARKET, BY DISTRIBUTION CHANNEL, 2020-2030 (USD MILLION)
TABLE 120 INDONESIA HOSPITAL PHARMACY IN G-CSF / PEG-G-CSF MARKET, BY BRAND, 2020-2030 (USD MILLION)
TABLE 121 INDONESIA HOSPITAL PHARMACY IN G-CSF / PEG-G-CSF MARKET, BY BRAND, 2020-2030 ASP (USD)
TABLE 122 INDONESIA HOSPITAL PHARMACY IN G-CSF / PEG-G-CSF MARKET, BY BRAND, 2020-2030 VOLUME (UNITS)
TABLE 123 INDONESIA RETAIL PHARMACY IN G-CSF / PEG-G-CSF MARKET, BY BRAND, 2020-2030 (USD MILLION)
TABLE 124 INDONESIA RETAIL PHARMACY IN G-CSF / PEG-G-CSF MARKET, BY BRAND, 2020-2030 ASP (USD)
TABLE 125 INDONESIA RETAIL PHARMACY IN G-CSF / PEG-G-CSF MARKET, BY BRAND, 2020-2030 VOLUME (UNITS)
TABLE 126 INDONESIA ONLINE PHARMACY IN G-CSF / PEG-G-CSF MARKET, BY BRAND, 2020-2030 (USD MILLION)
TABLE 127 INDONESIA ONLINE PHARMACY IN G-CSF / PEG-G-CSF MARKET, BY BRAND, 2020-2030 ASP (USD)
TABLE 128 INDONESIA ONLINE PHARMACY IN G-CSF / PEG-G-CSF MARKET, BY BRAND, 2020-2030 VOLUME (UNITS)
TABLE 129 THAILAND G-CSF / PEG-G-CSF MARKET, BY INDICATION, 2020-2030 (USD MILLION)
TABLE 130 THAILAND NEUTROPENIA IN G-CSF / PEG-G-CSF MARKET, BY INDICATION, 2020-2030 (USD MILLION)
TABLE 131 THAILAND ONCOLOGY IN G-CSF / PEG-G-CSF MARKET, BY INDICATION, 2020-2030 (USD MILLION)
TABLE 132 THAILAND G-CSF / PEG-G-CSF MARKET, BY DOSAGE, 2020-2030 (USD MILLION)
TABLE 133 THAILAND MONO IN G-CSF / PEG-G-CSF MARKET, BY BRAND, 2020-2030 (USD MILLION)
TABLE 134 THAILAND G-CSF / PEG-G-CSF MARKET, BY ROUTE OF ADMINISTRATION, 2020-2030 (USD MILLION)
TABLE 135 THAILAND SUBCUTANEOUS IN G-CSF / PEG-G-CSF MARKET, BY BRAND, 2020-2030 (USD MILLION)
TABLE 136 THAILAND G-CSF / PEG-G-CSF MARKET, BY PACKAGING, 2020-2030 (USD MILLION)
TABLE 137 THAILAND PRE FILLED SYRINGES IN G-CSF / PEG-G-CSF MARKET, BY BRAND, 2020-2030 (USD MILLION)
TABLE 138 THAILAND G-CSF / PEG-G-CSF MARKET, BY END USER, 2020-2030 (USD MILLION)
TABLE 139 THAILAND HOSPITAL AND CLINICS IN G-CSF / PEG-G-CSF MARKET, BY BRAND, 2020-2030 (USD MILLION)
TABLE 140 THAILAND HOSPITAL AND CLINICS IN G-CSF / PEG-G-CSF MARKET, BY BRAND, 2020-2030 ASP (USD)
TABLE 141 THAILAND HOSPITAL AND CLINICS IN G-CSF / PEG-G-CSF MARKET, BY BRAND, 2020-2030 VOLUME (UNITS)
TABLE 142 THAILAND RESEARCH AND ACADEMIC INSTITUTES IN G-CSF / PEG-G-CSF MARKET, BY BRAND, 2020-2030 (USD MILLION)
TABLE 143 THAILAND RESEARCH AND ACADEMIC INSTITUTES IN G-CSF / PEG-G-CSF MARKET, BY BRAND, 2020-2030 ASP (USD)
TABLE 144 THAILAND RESEARCH AND ACADEMIC INSTITUTES IN G-CSF / PEG-G-CSF MARKET, BY BRAND, 2020-2030 VOLUME (UNITS)
TABLE 145 THAILAND AMBULATORY SURGICAL CENTERS IN G-CSF / PEG-G-CSF MARKET, BY BRAND, 2020-2030 (USD MILLION)
TABLE 146 THAILAND AMBULATORY SURGICAL CENTERS IN G-CSF / PEG-G-CSF MARKET, BY BRAND, 2020-2030 ASP (USD)
TABLE 147 THAILAND AMBULATORY SURGICAL CENTERS IN G-CSF / PEG-G-CSF MARKET, BY BRAND, 2020-2030 VOLUME (UNITS)
TABLE 148 THAILAND G-CSF / PEG-G-CSF MARKET, BY DISTRIBUTION CHANNEL, 2020-2030 (USD MILLION)
TABLE 149 THAILAND HOSPITAL PHARMACY IN G-CSF / PEG-G-CSF MARKET, BY BRAND, 2020-2030 (USD MILLION)
TABLE 150 THAILAND HOSPITAL PHARMACY IN G-CSF / PEG-G-CSF MARKET, BY BRAND, 2020-2030 ASP (USD)
TABLE 151 THAILAND HOSPITAL PHARMACY IN G-CSF / PEG-G-CSF MARKET, BY BRAND, 2020-2030 VOLUME (UNITS)
TABLE 152 THAILAND RETAIL PHARMACY IN G-CSF / PEG-G-CSF MARKET, BY BRAND, 2020-2030 (USD MILLION)
TABLE 153 THAILAND RETAIL PHARMACY IN G-CSF / PEG-G-CSF MARKET, BY BRAND, 2020-2030 ASP (USD)
TABLE 154 THAILAND RETAIL PHARMACY IN G-CSF / PEG-G-CSF MARKET, BY BRAND, 2020-2030 VOLUME (UNITS)
TABLE 155 THAILAND ONLINE PHARMACY IN G-CSF / PEG-G-CSF MARKET, BY BRAND, 2020-2030 (USD MILLION)
TABLE 156 THAILAND ONLINE PHARMACY IN G-CSF / PEG-G-CSF MARKET, BY BRAND, 2020-2030 ASP (USD)
TABLE 157 THAILAND ONLINE PHARMACY IN G-CSF / PEG-G-CSF MARKET, BY BRAND, 2020-2030 VOLUME (UNITS)
TABLE 158 VIETNAM G-CSF / PEG-G-CSF MARKET, BY INDICATION, 2020-2030 (USD MILLION)
TABLE 159 VIETNAM NEUTROPENIA IN G-CSF / PEG-G-CSF MARKET, BY INDICATION, 2020-2030 (USD MILLION)
TABLE 160 VIETNAM ONCOLOGY IN G-CSF / PEG-G-CSF MARKET, BY INDICATION, 2020-2030 (USD MILLION)
TABLE 161 VIETNAM G-CSF / PEG-G-CSF MARKET, BY DOSAGE, 2020-2030 (USD MILLION)
TABLE 162 VIETNAM MONO IN G-CSF / PEG-G-CSF MARKET, BY BRAND, 2020-2030 (USD MILLION)
TABLE 163 VIETNAM G-CSF / PEG-G-CSF MARKET, BY ROUTE OF ADMINISTRATION, 2020-2030 (USD MILLION)
TABLE 164 VIETNAM SUBCUTANEOUS IN G-CSF / PEG-G-CSF MARKET, BY BRAND, 2020-2030 (USD MILLION)
TABLE 165 VIETNAM G-CSF / PEG-G-CSF MARKET, BY PACKAGING, 2020-2030 (USD MILLION)
TABLE 166 VIETNAM PRE FILLED SYRINGES IN G-CSF / PEG-G-CSF MARKET, BY BRAND, 2020-2030 (USD MILLION)
TABLE 167 VIETNAM G-CSF / PEG-G-CSF MARKET, BY END USER, 2020-2030 (USD MILLION)
TABLE 168 VIETNAM HOSPITAL AND CLINICS IN G-CSF / PEG-G-CSF MARKET, BY BRAND, 2020-2030 (USD MILLION)
TABLE 169 VIETNAM HOSPITAL AND CLINICS IN G-CSF / PEG-G-CSF MARKET, BY BRAND, 2020-2030 ASP (USD)
TABLE 170 VIETNAM HOSPITAL AND CLINICS IN G-CSF / PEG-G-CSF MARKET, BY BRAND, 2020-2030 VOLUME (UNITS)
TABLE 171 VIETNAM RESEARCH AND ACADEMIC INSTITUTES IN G-CSF / PEG-G-CSF MARKET, BY BRAND, 2020-2030 (USD MILLION)
TABLE 172 VIETNAM RESEARCH AND ACADEMIC INSTITUTES IN G-CSF / PEG-G-CSF MARKET, BY BRAND, 2020-2030 ASP (USD)
TABLE 173 VIETNAM RESEARCH AND ACADEMIC INSTITUTES IN G-CSF / PEG-G-CSF MARKET, BY BRAND, 2020-2030 VOLUME (UNITS)
TABLE 174 VIETNAM AMBULATORY SURGICAL CENTERS IN G-CSF / PEG-G-CSF MARKET, BY BRAND, 2020-2030 (USD MILLION)
TABLE 175 VIETNAM AMBULATORY SURGICAL CENTERS IN G-CSF / PEG-G-CSF MARKET, BY BRAND, 2020-2030 ASP (USD)
TABLE 176 VIETNAM AMBULATORY SURGICAL CENTERS IN G-CSF / PEG-G-CSF MARKET, BY BRAND, 2020-2030 VOLUME (UNITS)
TABLE 177 VIETNAM G-CSF / PEG-G-CSF MARKET, BY DISTRIBUTION CHANNEL, 2020-2030 (USD MILLION)
TABLE 178 VIETNAM HOSPITAL PHARMACY IN G-CSF / PEG-G-CSF MARKET, BY BRAND, 2020-2030 (USD MILLION)
TABLE 179 VIETNAM HOSPITAL PHARMACY IN G-CSF / PEG-G-CSF MARKET, BY BRAND, 2020-2030 ASP (USD)
TABLE 180 VIETNAM HOSPITAL PHARMACY IN G-CSF / PEG-G-CSF MARKET, BY BRAND, 2020-2030 VOLUME (UNITS)
TABLE 181 VIETNAM RETAIL PHARMACY IN G-CSF / PEG-G-CSF MARKET, BY BRAND, 2020-2030 (USD MILLION)
TABLE 182 VIETNAM RETAIL PHARMACY IN G-CSF / PEG-G-CSF MARKET, BY BRAND, 2020-2030 ASP (USD)
TABLE 183 VIETNAM RETAIL PHARMACY IN G-CSF / PEG-G-CSF MARKET, BY BRAND, 2020-2030 VOLUME (UNITS)
TABLE 184 VIETNAM ONLINE PHARMACY IN G-CSF / PEG-G-CSF MARKET, BY BRAND, 2020-2030 (USD MILLION)
TABLE 185 VIETNAM ONLINE PHARMACY IN G-CSF / PEG-G-CSF MARKET, BY BRAND, 2020-2030 ASP (USD)
TABLE 186 VIETNAM ONLINE PHARMACY IN G-CSF / PEG-G-CSF MARKET, BY BRAND, 2020-2030 VOLUME (UNITS)
TABLE 187 SINGAPORE G-CSF / PEG-G-CSF MARKET, BY INDICATION, 2020-2030 (USD MILLION)
TABLE 188 SINGAPORE NEUTROPENIA IN G-CSF / PEG-G-CSF MARKET, BY INDICATION, 2020-2030 (USD MILLION)
TABLE 189 SINGAPORE ONCOLOGY IN G-CSF / PEG-G-CSF MARKET, BY INDICATION, 2020-2030 (USD MILLION)
TABLE 190 SINGAPORE G-CSF / PEG-G-CSF MARKET, BY DOSAGE, 2020-2030 (USD MILLION)
TABLE 191 SINGAPORE MONO IN G-CSF / PEG-G-CSF MARKET, BY BRAND, 2020-2030 (USD MILLION)
TABLE 192 SINGAPORE G-CSF / PEG-G-CSF MARKET, BY ROUTE OF ADMINISTRATION, 2020-2030 (USD MILLION)
TABLE 193 SINGAPORE SUBCUTANEOUS IN G-CSF / PEG-G-CSF MARKET, BY BRAND, 2020-2030 (USD MILLION)
TABLE 194 SINGAPORE INTRAVENOUS IN G-CSF / PEG-G-CSF MARKET, BY BRAND, 2020-2030 (USD MILLION)
TABLE 195 SINGAPORE G-CSF / PEG-G-CSF MARKET, BY PACKAGING, 2020-2030 (USD MILLION)
TABLE 196 SINGAPORE PRE FILLED SYRINGES IN G-CSF / PEG-G-CSF MARKET, BY BRAND, 2020-2030 (USD MILLION)
TABLE 197 SINGAPORE SINGLE USE VIALS IN G-CSF / PEG-G-CSF MARKET, BY BRAND, 2020-2030 (USD MILLION)
TABLE 198 SINGAPORE G-CSF / PEG-G-CSF MARKET, BY END USER, 2020-2030 (USD MILLION)
TABLE 199 SINGAPORE HOSPITAL AND CLINICS IN G-CSF / PEG-G-CSF MARKET, BY BRAND, 2020-2030 (USD MILLION)
TABLE 200 SINGAPORE HOSPITAL AND CLINICS IN G-CSF / PEG-G-CSF MARKET, BY BRAND, 2020-2030 ASP (USD)
TABLE 201 SINGAPORE HOSPITAL AND CLINICS IN G-CSF / PEG-G-CSF MARKET, BY BRAND, 2020-2030 VOLUME (UNITS)
TABLE 202 SINGAPORE RESEARCH AND ACADEMIC INSTITUTES IN G-CSF / PEG-G-CSF MARKET, BY BRAND, 2020-2030 (USD MILLION)
TABLE 203 SINGAPORE RESEARCH AND ACADEMIC INSTITUTES IN G-CSF / PEG-G-CSF MARKET, BY BRAND, 2020-2030 ASP (USD)
TABLE 204 SINGAPORE RESEARCH AND ACADEMIC INSTITUTES IN G-CSF / PEG-G-CSF MARKET, BY BRAND, 2020-2030 VOLUME (UNITS)
TABLE 205 SINGAPORE AMBULATORY SURGICAL CENTERS IN G-CSF / PEG-G-CSF MARKET, BY BRAND, 2020-2030 (USD MILLION)
TABLE 206 SINGAPORE AMBULATORY SURGICAL CENTERS IN G-CSF / PEG-G-CSF MARKET, BY BRAND, 2020-2030 ASP (USD)
TABLE 207 SINGAPORE AMBULATORY SURGICAL CENTERS IN G-CSF / PEG-G-CSF MARKET, BY BRAND, 2020-2030 VOLUME (UNITS)
TABLE 208 SINGAPORE G-CSF / PEG-G-CSF MARKET, BY DISTRIBUTION CHANNEL, 2020-2030 (USD MILLION)
TABLE 209 SINGAPORE HOSPITAL PHARMACY IN G-CSF / PEG-G-CSF MARKET, BY BRAND, 2020-2030 (USD MILLION)
TABLE 210 SINGAPORE HOSPITAL PHARMACY IN G-CSF / PEG-G-CSF MARKET, BY BRAND, 2020-2030 ASP (USD)
TABLE 211 SINGAPORE HOSPITAL PHARMACY IN G-CSF / PEG-G-CSF MARKET, BY BRAND, 2020-2030 VOLUME (UNITS)
TABLE 212 SINGAPORE RETAIL PHARMACY IN G-CSF / PEG-G-CSF MARKET, BY BRAND, 2020-2030 (USD MILLION)
TABLE 213 SINGAPORE RETAIL PHARMACY IN G-CSF / PEG-G-CSF MARKET, BY BRAND, 2020-2030 ASP (USD)
TABLE 214 SINGAPORE RETAIL PHARMACY IN G-CSF / PEG-G-CSF MARKET, BY BRAND, 2020-2030 VOLUME (UNITS)
TABLE 215 SINGAPORE ONLINE PHARMACY IN G-CSF / PEG-G-CSF MARKET, BY BRAND, 2020-2030 (USD MILLION)
TABLE 216 SINGAPORE ONLINE PHARMACY IN G-CSF / PEG-G-CSF MARKET, BY BRAND, 2020-2030 ASP (USD)
TABLE 217 SINGAPORE ONLINE PHARMACY IN G-CSF / PEG-G-CSF MARKET, BY BRAND, 2020-2030 VOLUME (UNITS)
TABLE 218 PHILIPPINES G-CSF / PEG-G-CSF MARKET, BY INDICATION, 2020-2030 (USD MILLION)
TABLE 219 PHILIPPINES NEUTROPENIA IN G-CSF / PEG-G-CSF MARKET, BY INDICATION, 2020-2030 (USD MILLION)
TABLE 220 PHILIPPINES ONCOLOGY IN G-CSF / PEG-G-CSF MARKET, BY INDICATION, 2020-2030 (USD MILLION)
TABLE 221 PHILIPPINES G-CSF / PEG-G-CSF MARKET, BY DOSAGE, 2020-2030 (USD MILLION)
TABLE 222 PHILIPPINES MONO IN G-CSF / PEG-G-CSF MARKET, BY BRAND, 2020-2030 (USD MILLION)
TABLE 223 PHILIPPINES G-CSF / PEG-G-CSF MARKET, BY ROUTE OF ADMINISTRATION, 2020-2030 (USD MILLION)
TABLE 224 PHILIPPINES SUBCUTANEOUS IN G-CSF / PEG-G-CSF MARKET, BY BRAND, 2020-2030 (USD MILLION)
TABLE 225 PHILIPPINES G-CSF / PEG-G-CSF MARKET, BY PACKAGING, 2020-2030 (USD MILLION)
TABLE 226 PHILIPPINES PRE FILLED SYRINGES IN G-CSF / PEG-G-CSF MARKET, BY BRAND, 2020-2030 (USD MILLION)
TABLE 227 PHILIPPINES G-CSF / PEG-G-CSF MARKET, BY END USER, 2020-2030 (USD MILLION)
TABLE 228 PHILIPPINES HOSPITAL AND CLINICS IN G-CSF / PEG-G-CSF MARKET, BY BRAND, 2020-2030 (USD MILLION)
TABLE 229 PHILIPPINES HOSPITAL AND CLINICS IN G-CSF / PEG-G-CSF MARKET, BY BRAND, 2020-2030 ASP (USD)
TABLE 230 PHILIPPINES HOSPITAL AND CLINICS IN G-CSF / PEG-G-CSF MARKET, BY BRAND, 2020-2030 VOLUME (UNITS)
TABLE 231 PHILIPPINES RESEARCH AND ACADEMIC INSTITUTES IN G-CSF / PEG-G-CSF MARKET, BY BRAND, 2020-2030 (USD MILLION)
TABLE 232 PHILIPPINES RESEARCH AND ACADEMIC INSTITUTES IN G-CSF / PEG-G-CSF MARKET, BY BRAND, 2020-2030 ASP (USD)
TABLE 233 PHILIPPINES RESEARCH AND ACADEMIC INSTITUTES IN G-CSF / PEG-G-CSF MARKET, BY BRAND, 2020-2030 VOLUME (UNITS)
TABLE 234 PHILIPPINES AMBULATORY SURGICAL CENTERS IN G-CSF / PEG-G-CSF MARKET, BY BRAND, 2020-2030 (USD MILLION)
TABLE 235 PHILIPPINES AMBULATORY SURGICAL CENTERS IN G-CSF / PEG-G-CSF MARKET, BY BRAND, 2020-2030 ASP (USD)
TABLE 236 PHILIPPINES AMBULATORY SURGICAL CENTERS IN G-CSF / PEG-G-CSF MARKET, BY BRAND, 2020-2030 VOLUME (UNITS)
TABLE 237 PHILIPPINES G-CSF / PEG-G-CSF MARKET, BY DISTRIBUTION CHANNEL, 2020-2030 (USD MILLION)
TABLE 238 PHILIPPINES HOSPITAL PHARMACY IN G-CSF / PEG-G-CSF MARKET, BY BRAND, 2020-2030 (USD MILLION)
TABLE 239 PHILIPPINES HOSPITAL PHARMACY IN G-CSF / PEG-G-CSF MARKET, BY BRAND, 2020-2030 ASP (USD)
TABLE 240 PHILIPPINES HOSPITAL PHARMACY IN G-CSF / PEG-G-CSF MARKET, BY BRAND, 2020-2030 VOLUME (UNITS)
TABLE 241 PHILIPPINES RETAIL PHARMACY IN G-CSF / PEG-G-CSF MARKET, BY BRAND, 2020-2030 (USD MILLION)
TABLE 242 PHILIPPINES RETAIL PHARMACY IN G-CSF / PEG-G-CSF MARKET, BY BRAND, 2020-2030 ASP (USD)
TABLE 243 PHILIPPINES RETAIL PHARMACY IN G-CSF / PEG-G-CSF MARKET, BY BRAND, 2020-2030 VOLUME (UNITS)
TABLE 244 PHILIPPINES ONLINE PHARMACY IN G-CSF / PEG-G-CSF MARKET, BY BRAND, 2020-2030 (USD MILLION)
TABLE 245 PHILIPPINES ONLINE PHARMACY IN G-CSF / PEG-G-CSF MARKET, BY BRAND, 2020-2030 ASP (USD)
TABLE 246 PHILIPPINES ONLINE PHARMACY IN G-CSF / PEG-G-CSF MARKET, BY BRAND, 2020-2030 VOLUME (UNITS)
TABLE 247 MALAYSIA G-CSF / PEG-G-CSF MARKET, BY INDICATION, 2020-2030 (USD MILLION)
TABLE 248 MALAYSIA NEUTROPENIA IN G-CSF / PEG-G-CSF MARKET, BY INDICATION, 2020-2030 (USD MILLION)
TABLE 249 MALAYSIA ONCOLOGY IN G-CSF / PEG-G-CSF MARKET, BY INDICATION, 2020-2030 (USD MILLION)
TABLE 250 MALAYSIA G-CSF / PEG-G-CSF MARKET, BY DOSAGE, 2020-2030 (USD MILLION)
TABLE 251 MALAYSIA MONO IN G-CSF / PEG-G-CSF MARKET, BY BRAND, 2020-2030 (USD MILLION)
TABLE 252 MALAYSIA G-CSF / PEG-G-CSF MARKET, BY ROUTE OF ADMINISTRATION, 2020-2030 (USD MILLION)
TABLE 253 MALAYSIA SUBCUTANEOUS IN G-CSF / PEG-G-CSF MARKET, BY BRAND, 2020-2030 (USD MILLION)
TABLE 254 MALAYSIA G-CSF / PEG-G-CSF MARKET, BY PACKAGING, 2020-2030 (USD MILLION)
TABLE 255 MALAYSIA PRE FILLED SYRINGES IN G-CSF / PEG-G-CSF MARKET, BY BRAND, 2020-2030 (USD MILLION)
TABLE 256 MALAYSIA G-CSF / PEG-G-CSF MARKET, BY END USER, 2020-2030 (USD MILLION)
TABLE 257 MALAYSIA HOSPITAL AND CLINICS IN G-CSF / PEG-G-CSF MARKET, BY BRAND, 2020-2030 (USD MILLION)
TABLE 258 MALAYSIA HOSPITAL AND CLINICS IN G-CSF / PEG-G-CSF MARKET, BY BRAND, 2020-2030 ASP (USD)
TABLE 259 MALAYSIA HOSPITAL AND CLINICS IN G-CSF / PEG-G-CSF MARKET, BY BRAND, 2020-2030 VOLUME (UNITS)
TABLE 260 MALAYSIA RESEARCH AND ACADEMIC INSTITUTES IN G-CSF / PEG-G-CSF MARKET, BY BRAND, 2020-2030 (USD MILLION)
TABLE 261 MALAYSIA RESEARCH AND ACADEMIC INSTITUTES IN G-CSF / PEG-G-CSF MARKET, BY BRAND, 2020-2030 ASP (USD)
TABLE 262 MALAYSIA RESEARCH AND ACADEMIC INSTITUTES IN G-CSF / PEG-G-CSF MARKET, BY BRAND, 2020-2030 VOLUME (UNITS)
TABLE 263 MALAYSIA AMBULATORY SURGICAL CENTERS IN G-CSF / PEG-G-CSF MARKET, BY BRAND, 2020-2030 (USD MILLION)
TABLE 264 MALAYSIA AMBULATORY SURGICAL CENTERS IN G-CSF / PEG-G-CSF MARKET, BY BRAND, 2020-2030 ASP (USD)
TABLE 265 MALAYSIA AMBULATORY SURGICAL CENTERS IN G-CSF / PEG-G-CSF MARKET, BY BRAND, 2020-2030 VOLUME (UNITS)
TABLE 266 MALAYSIA G-CSF / PEG-G-CSF MARKET, BY DISTRIBUTION CHANNEL, 2020-2030 (USD MILLION)
TABLE 267 MALAYSIA HOSPITAL PHARMACY IN G-CSF / PEG-G-CSF MARKET, BY BRAND, 2020-2030 (USD MILLION)
TABLE 268 MALAYSIA HOSPITAL PHARMACY IN G-CSF / PEG-G-CSF MARKET, BY BRAND, 2020-2030 ASP (USD)
TABLE 269 MALAYSIA HOSPITAL PHARMACY IN G-CSF / PEG-G-CSF MARKET, BY BRAND, 2020-2030 VOLUME (UNITS)
TABLE 270 MALAYSIA RETAIL PHARMACY IN G-CSF / PEG-G-CSF MARKET, BY BRAND, 2020-2030 (USD MILLION)
TABLE 271 MALAYSIA RETAIL PHARMACY IN G-CSF / PEG-G-CSF MARKET, BY BRAND, 2020-2030 ASP (USD)
TABLE 272 MALAYSIA RETAIL PHARMACY IN G-CSF / PEG-G-CSF MARKET, BY BRAND, 2020-2030 VOLUME (UNITS)
TABLE 273 MALAYSIA ONLINE PHARMACY IN G-CSF / PEG-G-CSF MARKET, BY BRAND, 2020-2030 (USD MILLION)
TABLE 274 MALAYSIA ONLINE PHARMACY IN G-CSF / PEG-G-CSF MARKET, BY BRAND, 2020-2030 ASP (USD)
TABLE 275 MALAYSIA ONLINE PHARMACY IN G-CSF / PEG-G-CSF MARKET, BY BRAND, 2020-2030 VOLUME (UNITS)
Lista de figuras
FIGURE 1 ASIA PACIFIC G-CSF / PEG-G-CSF MARKET: SEGMENTATION
FIGURE 2 ASIA PACIFIC G-CSF / PEG-G-CSF MARKET: DATA TRIANGULATION
FIGURE 3 ASIA PACIFIC G-CSF / PEG-G-CSF MARKET: DROC ANALYSIS
FIGURE 4 ASIA PACIFIC G-CSF / PEG-G-CSF MARKET: ASIA PACIFIC VS REGIONAL MARKET ANALYSIS
FIGURE 5 ASIA PACIFIC G-CSF / PEG-G-CSF MARKET: COMPANY RESEARCH ANALYSIS
FIGURE 6 ASIA PACIFIC G-CSF / PEG-G-CSF MARKET: INTERVIEW DEMOGRAPHICS
FIGURE 7 ASIA PACIFIC G-CSF / PEG-G-CSF MARKET: DBMR MARKET POSITION GRID
FIGURE 8 ASIA PACIFIC G-CSF / PEG-G-CSF MARKET: MARKET END USER COVERAGE GRID
FIGURE 9 ASIA PACIFIC G-CSF / PEG-G-CSF MARKET: VENDOR SHARE ANALYSIS
FIGURE 10 ASIA PACIFIC G-CSF / PEG-G-CSF MARKET: SEGMENTATION
FIGURE 11 THE INCREASE IN CANCER PROPHYLAXIS IN DEVELOPED COUNTRIES AND INITIATIVES TAKEN BY GOVERNMENTS ARE TO DRIVE THE ASIA PACIFIC G-CSF / PEG-G-CSF MARKET FROM 2023 TO 2030
FIGURE 12 NEUTROPENIA SEGMENT IS EXPECTED TO ACCOUNT FOR THE LARGEST SHARE OF THE ASIA PACIFIC G-CSF / PEG-G-CSF MARKET IN 2023 & 2030
FIGURE 13 DRIVERS, RESTRAINTS, OPPORTUNITIES, AND CHALLENGES OF THE ASIA PACIFIC G-CSF / PEG-G-CSF MARKET
FIGURE 14 ASIA PACIFIC G-CSF/ PEG-G-CSF MARKET: BY INDICATION CATEGORY, 2022
FIGURE 15 ASIA PACIFIC G-CSF/ PEG-G-CSF MARKET: BY INDICATION CATEGORY, 2021-2030 (USD MILLION)
FIGURE 16 ASIA PACIFIC G-CSF/ PEG-G-CSF MARKET: BY INDICATION CATEGORY, CAGR (2022-2029)
FIGURE 17 ASIA PACIFIC G-CSF/ PEG-G-CSF MARKET: BY INDICATION CATEGORY, LIFELINE CURVE
FIGURE 18 ASIA PACIFIC G-CSF/ PEG-G-CSF MARKET: BY DOSAGE, 2022
FIGURE 19 ASIA PACIFIC G-CSF/ PEG-G-CSF MARKET: BY DOSAGE, 2021-2030 (USD MILLION)
FIGURE 20 ASIA PACIFIC G-CSF/ PEG-G-CSF MARKET: BY DOSAGE, CAGR (2023-2030)
FIGURE 21 ASIA PACIFIC G-CSF/ PEG-G-CSF MARKET: BY DOSAGE, LIFELINE CURVE
FIGURE 22 ASIA PACIFIC G-CSF/ PEG-G-CSF MARKET: BY ROUTE OF ADMINISTRATION, 2022
FIGURE 23 ASIA PACIFIC G-CSF/ PEG-G-CSF MARKET: BY ROUTE OF ADMINISTRATION, 2021-2030 (USD MILLION)
FIGURE 24 ASIA PACIFIC G-CSF/ PEG-G-CSF MARKET: BY ROUTE OF ADMINISTRATION, CAGR (2023-2030)
FIGURE 25 ASIA PACIFIC G-CSF/ PEG-G-CSF MARKET: BY ROUTE OF ADMINISTRATION, LIFELINE CURVE
FIGURE 26 ASIA PACIFIC G-CSF/ PEG-G-CSF MARKET: BY PACKAGING, 2022
FIGURE 27 ASIA PACIFIC G-CSF/ PEG-G-CSF MARKET: BY PACKAGING, 2021-2030 (USD MILLION)
FIGURE 28 ASIA PACIFIC G-CSF/ PEG-G-CSF MARKET: BY PACKAGING, CAGR (2023-2030)
FIGURE 29 ASIA PACIFIC G-CSF/ PEG-G-CSF MARKET: BY PACKAGING, LIFELINE CURVE
FIGURE 30 ASIA PACIFIC G-CSF/ PEG-G-CSF MARKET: BY END USER, 2022
FIGURE 31 ASIA PACIFIC G-CSF/ PEG-G-CSF MARKET: BY END USER, 2021-2030 (USD MILLION)
FIGURE 32 ASIA PACIFIC G-CSF/ PEG-G-CSF MARKET: BY END USER, CAGR (2023-2030)
FIGURE 33 ASIA PACIFIC G-CSF/ PEG-G-CSF MARKET: BY END USER, LIFELINE CURVE
FIGURE 34 ASIA PACIFIC G-CSF/ PEG-G-CSF MARKET: BY DISTRIBUTION CHANNEL, 2022
FIGURE 35 ASIA PACIFIC G-CSF/ PEG-G-CSF MARKET: BY DISTRIBUTION CHANNEL, 2021-2030 (USD MILLION)
FIGURE 36 ASIA PACIFIC G-CSF/ PEG-G-CSF MARKET: BY DISTRIBUTION CHANNEL, CAGR (2023-2030)
FIGURE 37 ASIA PACIFIC G-CSF/ PEG-G-CSF MARKET: BY DISTRIBUTION CHANNEL, LIFELINE CURVE
FIGURE 38 ASIA-PACIFIC G-CSF/PEG-G-CSF MARKET: SNAPSHOT (2022)
FIGURE 39 ASIA-PACIFIC G-CSF/PEG-G-CSF MARKET: BY COUNTRY (2022)
FIGURE 40 ASIA-PACIFIC G-CSF/PEG-G-CSF MARKET: BY COUNTRY (2022 & 2030)
FIGURE 41 ASIA-PACIFIC G-CSF/PEG-G-CSF MARKET: BY COUNTRY (2022 & 2030)
FIGURE 42 ASIA-PACIFIC G-CSF/PEG-G-CSF MARKET: BY INDICATION (2023-2030)
FIGURE 43 ASIA PACIFIC G-CSF / PEG-G-CSF MARKET: COMPANY SHARE 2022 (%)
Metodología de investigación
La recopilación de datos y el análisis del año base se realizan utilizando módulos de recopilación de datos con muestras de gran tamaño. La etapa incluye la obtención de información de mercado o datos relacionados a través de varias fuentes y estrategias. Incluye el examen y la planificación de todos los datos adquiridos del pasado con antelación. Asimismo, abarca el examen de las inconsistencias de información observadas en diferentes fuentes de información. Los datos de mercado se analizan y estiman utilizando modelos estadísticos y coherentes de mercado. Además, el análisis de la participación de mercado y el análisis de tendencias clave son los principales factores de éxito en el informe de mercado. Para obtener más información, solicite una llamada de un analista o envíe su consulta.
La metodología de investigación clave utilizada por el equipo de investigación de DBMR es la triangulación de datos, que implica la extracción de datos, el análisis del impacto de las variables de datos en el mercado y la validación primaria (experto en la industria). Los modelos de datos incluyen cuadrícula de posicionamiento de proveedores, análisis de línea de tiempo de mercado, descripción general y guía del mercado, cuadrícula de posicionamiento de la empresa, análisis de patentes, análisis de precios, análisis de participación de mercado de la empresa, estándares de medición, análisis global versus regional y de participación de proveedores. Para obtener más información sobre la metodología de investigación, envíe una consulta para hablar con nuestros expertos de la industria.
Personalización disponible
Data Bridge Market Research es líder en investigación formativa avanzada. Nos enorgullecemos de brindar servicios a nuestros clientes existentes y nuevos con datos y análisis que coinciden y se adaptan a sus objetivos. El informe se puede personalizar para incluir análisis de tendencias de precios de marcas objetivo, comprensión del mercado de países adicionales (solicite la lista de países), datos de resultados de ensayos clínicos, revisión de literatura, análisis de mercado renovado y base de productos. El análisis de mercado de competidores objetivo se puede analizar desde análisis basados en tecnología hasta estrategias de cartera de mercado. Podemos agregar tantos competidores sobre los que necesite datos en el formato y estilo de datos que esté buscando. Nuestro equipo de analistas también puede proporcionarle datos en archivos de Excel sin procesar, tablas dinámicas (libro de datos) o puede ayudarlo a crear presentaciones a partir de los conjuntos de datos disponibles en el informe.

