Asia Pacific Down Syndrome Market
Tamaño del mercado en miles de millones de dólares
Tasa de crecimiento anual compuesta (CAGR) :
% 
 USD
307.08 Million
USD
1,020.73 Million
2024
2032
USD
307.08 Million
USD
1,020.73 Million
2024
2032
| 2025 –2032 | |
| USD 307.08 Million | |
| USD 1,020.73 Million | |
| % | |
|
Segmentación del mercado del síndrome de Down en Asia-Pacífico, por tipo de enfermedad (trisomía 21, síndrome de Down por translocación y síndrome de Down en mosaico), tratamiento (diagnóstico y terapia), usuario final (hospital, clínicas, centros de atención domiciliaria, centros de terapia, etc.), canal de distribución (licitación directa, venta minorista, etc.): tendencias y pronóstico de la industria hasta 2032.
Tamaño del mercado del síndrome de Down en Asia-Pacífico
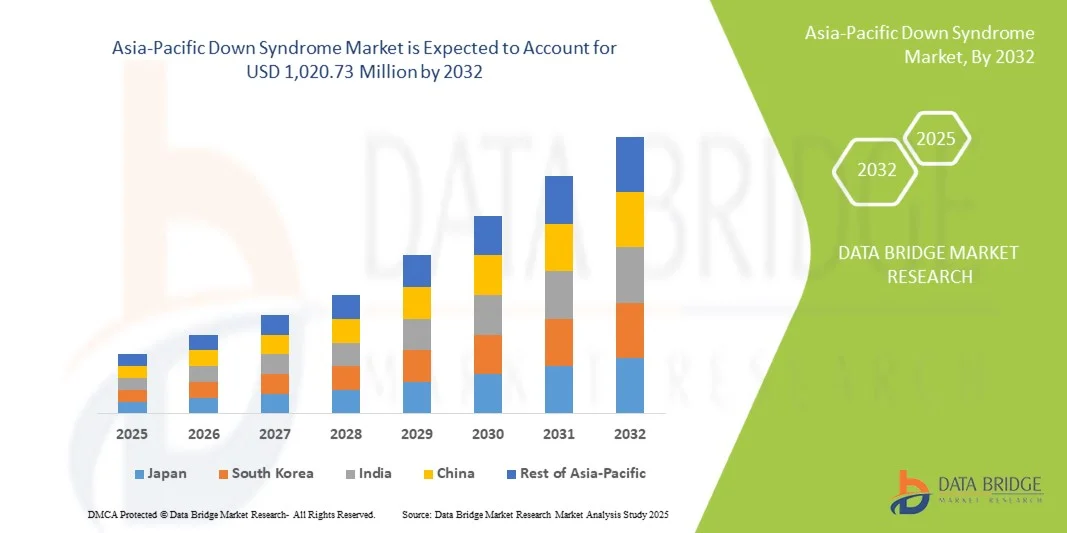
- El tamaño del mercado del síndrome de Down en Asia-Pacífico se valoró en USD 307,08 millones en 2024 y se espera que alcance los USD 1.020,73 millones para 2032 , con una CAGR del 16,2 % durante el período de pronóstico.
- El crecimiento del mercado está impulsado en gran medida por la creciente prevalencia del síndrome de Down y trastornos relacionados, junto con la creciente adopción de terapias efectivas y programas de intervención temprana en toda la región.
- Además, la creciente concienciación, la mejora de la infraestructura sanitaria y la mayor accesibilidad a los centros de diagnóstico y tratamiento están consolidando la atención integral del síndrome de Down como un objetivo clave en Asia-Pacífico. Estos factores convergentes están acelerando la adopción de tratamientos para el síndrome de Down, impulsando así significativamente el crecimiento de la industria.
Análisis del mercado del síndrome de Down en Asia-Pacífico
- La atención y el tratamiento del síndrome de Down, que abarcan terapias, programas de intervención temprana y servicios de atención médica de apoyo, son componentes cada vez más vitales del panorama de la atención médica de la región debido a su papel fundamental en la mejora de los resultados de los pacientes, el apoyo al desarrollo y la calidad de vida.
- La creciente demanda de soluciones para el manejo del síndrome de Down se ve impulsada principalmente por la creciente prevalencia de la enfermedad, la creciente concienciación entre los cuidadores y los profesionales sanitarios y el aumento de las iniciativas gubernamentales y no gubernamentales que apoyan el diagnóstico y el tratamiento tempranos.
- China dominó el mercado del síndrome de Down en Asia-Pacífico con la mayor participación en los ingresos del 38,7 % en 2024, caracterizado por una infraestructura de atención médica bien establecida, mayores niveles de concienciación y un fuerte apoyo gubernamental a los programas de atención médica genética y pediátrica, con un crecimiento sustancial en la adopción de terapias impulsada por innovaciones en tratamientos personalizados y servicios de intervención temprana.
- Se espera que India sea el país de más rápido crecimiento en el mercado del síndrome de Down en Asia-Pacífico durante el período de pronóstico, debido a la creciente accesibilidad a la atención médica, el aumento de los ingresos disponibles y la expansión de las iniciativas públicas y privadas para los trastornos genéticos pediátricos.
- El segmento de terapia dominó el mercado del síndrome de Down en Asia-Pacífico con una participación de mercado del 42,5 % en 2024, impulsado por su eficacia demostrada para mejorar los resultados del desarrollo y su creciente integración en los protocolos de atención estándar en hospitales y clínicas especializadas.
Alcance del informe y segmentación del mercado del síndrome de Down en Asia-Pacífico
|
Atributos |
Perspectivas clave del mercado del síndrome de Down en Asia-Pacífico |
|
Segmentos cubiertos |
|
|
Países cubiertos |
Asia-Pacífico
|
|
Actores clave del mercado |
|
|
Oportunidades de mercado |
|
|
Conjuntos de información de datos de valor añadido |
Además de los conocimientos sobre escenarios de mercado como valor de mercado, tasa de crecimiento, segmentación, cobertura geográfica y actores principales, los informes de mercado seleccionados por Data Bridge Market Research también incluyen análisis de expertos en profundidad, análisis de precios, análisis de participación de marca, encuesta de consumidores, análisis demográfico, análisis de la cadena de suministro, análisis de la cadena de valor, descripción general de materias primas/consumibles, criterios de selección de proveedores, análisis PESTLE, análisis de Porter y marco regulatorio. |
Tendencias del mercado del síndrome de Down en Asia-Pacífico
“Atención mejorada mediante intervención temprana y terapias personalizadas”
- Una tendencia significativa y en aceleración en el mercado del síndrome de Down en Asia-Pacífico es la creciente adopción de programas de intervención temprana y enfoques terapéuticos personalizados, que están mejorando los resultados del desarrollo y la calidad de vida general de los pacientes.
- Por ejemplo, los programas especializados de educación temprana en China incorporan planes de aprendizaje individualizados adaptados a las necesidades de desarrollo de cada niño, mejorando así sus habilidades cognitivas y motoras. De igual manera, los centros de terapia en la India ofrecen programas integrados de fisioterapia, logopedia y terapia ocupacional para una atención holística.
- Los enfoques de tratamiento personalizados permiten a los cuidadores y profesionales clínicos supervisar la evolución del paciente con mayor eficacia y ajustar las intervenciones, mejorando así los resultados a largo plazo. Por ejemplo, la asesoría genética, combinada con programas de fisioterapia personalizados, permite un apoyo específico para el desarrollo.
- La integración de servicios de terapia, educación y apoyo en un modelo de atención coordinada facilita el manejo integral del síndrome de Down en diversos entornos sanitarios y educativos. A través de un único plan coordinado, las familias pueden acceder simultáneamente a terapias, seguimiento clínico e intervenciones educativas.
- Esta tendencia hacia una atención más individualizada, integral y orientada a los resultados está redefiniendo las expectativas en el manejo del síndrome de Down. En consecuencia, organizaciones como la Asociación del Síndrome de Down de la India están ampliando sus programas con planes de terapia personalizados y servicios de apoyo holístico.
- La demanda de intervención temprana integrada y terapias personalizadas está creciendo rápidamente en las regiones urbanas y semiurbanas, a medida que los cuidadores priorizan cada vez más el apoyo eficaz al desarrollo y la calidad de vida de los niños con síndrome de Down.
Dinámica del mercado del síndrome de Down en Asia-Pacífico
Conductor
“La creciente concienciación y el acceso a la atención médica impulsan la adopción”
- La creciente prevalencia del síndrome de Down y la creciente concienciación entre las familias y los profesionales de la salud, junto con la mejora del acceso a centros de atención especializados, son un impulsor importante del mercado en Asia-Pacífico.
- Por ejemplo, en 2024, India lanzó campañas nacionales de concienciación y programas de capacitación para profesionales de la salud pediátrica, con el objetivo de mejorar el diagnóstico temprano y las intervenciones terapéuticas. Se espera que estas iniciativas, impulsadas por organizaciones clave, impulsen el crecimiento del mercado durante el período de pronóstico.
- A medida que las familias se vuelven más conscientes de las terapias y estrategias de intervención disponibles, buscan programas integrales que combinen apoyo médico, educativo y de desarrollo, lo que proporciona una mejora convincente con respecto a la atención fragmentada.
- Además, la expansión de la infraestructura de atención médica y los programas apoyados por el gobierno están haciendo que la atención del síndrome de Down sea más accesible, integrando servicios en hospitales, clínicas y centros educativos.
- La creciente adopción de programas de terapia coordinada, capacitación de cuidadores e iniciativas de intervención temprana, junto con el aumento de los ingresos disponibles en las áreas urbanas, son factores clave que impulsan el mercado en países como China e India.
Restricción/Desafío
“Alto costo de la terapia e instalaciones especializadas limitadas”
- El costo relativamente alto de las terapias integrales, sumado a la disponibilidad limitada de centros especializados en atención al síndrome de Down, representa un desafío significativo para una mayor penetración en el mercado de la región. Dado que las terapias a menudo requieren enfoques multidisciplinarios, muchas familias enfrentan barreras financieras y logísticas.
- Por ejemplo, en las zonas rurales de la India y el Sudeste Asiático, el acceso a centros de terapia certificados sigue siendo limitado, lo que hace que las familias duden en adoptar programas de intervención intensiva.
- Abordar estas preocupaciones de accesibilidad y asequibilidad mediante programas subsidiados, soluciones de teleterapia y apoyo gubernamental es crucial para una adopción más amplia. Organizaciones como la Federación de Síndrome de Down de China priorizan programas comunitarios asequibles y unidades de terapia móviles para llegar a las poblaciones desatendidas.
- Además, las deficiencias en profesionales capacitados y protocolos de atención estandarizados pueden obstaculizar la prestación constante de servicios terapéuticos, en particular en los países menos desarrollados, lo que limita la expansión del mercado.
- Superar estos desafíos mediante mejores políticas de atención sanitaria, mayor financiación para centros especializados y campañas de concienciación más amplias será vital para el crecimiento sostenido del mercado del síndrome de Down en Asia y el Pacífico.
Análisis del mercado del síndrome de Down en Asia-Pacífico
El mercado está segmentado según el tipo de enfermedad, el tratamiento, el usuario final y el canal de distribución.
- Por tipo de enfermedad
Según el tipo de enfermedad, el mercado del síndrome de Down en Asia-Pacífico se segmenta en trisomía 21, síndrome de Down por translocación y síndrome de Down en mosaico. El segmento de trisomía 21 dominó el mercado con la mayor participación en ingresos, un 65 %, en 2024, gracias a su alta prevalencia en países como China y Japón. La trisomía 21 representa la mayoría de los casos de síndrome de Down, lo que genera una mayor demanda de diagnóstico precoz, asesoramiento genético e intervenciones terapéuticas. Los gobiernos y las ONG priorizan las campañas de concienciación y los programas de apoyo dirigidos a la trisomía 21, lo que impulsa aún más la penetración en el mercado. Los centros de diagnóstico y los hospitales suelen centrarse en la trisomía 21 debido a las directrices clínicas establecidas y a una amplia base de protocolos de tratamiento. Las familias tienden a buscar paquetes terapéuticos integrales para niños con trisomía 21, lo que aumenta los ingresos recurrentes para los profesionales sanitarios. El mercado también se beneficia de la investigación y los estudios clínicos en curso destinados a mejorar los resultados terapéuticos y de desarrollo para este grupo.
Se prevé que el síndrome de Down en mosaico experimente la tasa de crecimiento más rápida, con una tasa de crecimiento anual compuesta (TCAC) del 18,2 % entre 2025 y 2032, impulsada por una mayor concienciación y mejores capacidades de diagnóstico en los centros urbanos. Los casos de mosaico son menos frecuentes, pero requieren un seguimiento especializado y una terapia adaptada a la gravedad variable de los síntomas. La creciente disponibilidad de pruebas genéticas y opciones de tratamiento personalizadas está ampliando el diagnóstico y el tratamiento en países como India y Corea del Sur. Los cuidadores prefieren cada vez más los programas de intervención temprana para pacientes con mosaico a fin de mejorar los resultados del desarrollo. Las clínicas y los centros de terapia están adoptando herramientas de evaluación avanzadas para identificar los casos de mosaico con mayor precisión. Este crecimiento también se ve respaldado por programas educativos y de apoyo que priorizan el reconocimiento temprano y los planes de atención personalizados.
- Por tratamiento
En función del tratamiento, el mercado se segmenta en Diagnóstico y Terapia. El segmento de terapia dominó el mercado con una participación en los ingresos del 42,5 % en 2024, impulsado por la creciente demanda de intervenciones multidisciplinarias, como logopedia, terapia ocupacional y fisioterapia. Las familias invierten cada vez más en programas de terapia a largo plazo para mejorar el desarrollo cognitivo y motor. Los centros de terapia en China, Japón y Australia están ampliando sus servicios para satisfacer la demanda, ofreciendo opciones tanto presenciales como teleterapia. La integración de la terapia con los programas de educación temprana garantiza mejores resultados en el desarrollo, lo que impulsa la preferencia del mercado. La cobertura de seguros y las subvenciones gubernamentales para programas terapéuticos impulsan aún más su adopción. Este segmento se beneficia de los avances tecnológicos en herramientas terapéuticas y planes de atención personalizados.
Se espera que el diagnóstico registre la tasa de crecimiento anual compuesta (TCAC) más rápida, del 19,3 %, durante el período de pronóstico, impulsada por las mejoras en las tecnologías de detección prenatal y posnatal. Las pruebas prenatales no invasivas (NIPT) y los análisis genéticos avanzados están cada vez más disponibles en países como India, Singapur y Corea del Sur. La creciente concienciación sobre los beneficios del diagnóstico temprano y la mayor disponibilidad de centros de diagnóstico contribuyen al crecimiento del segmento. Hospitales y clínicas están adoptando protocolos de pruebas genéticas rápidas para facilitar intervenciones oportunas. El segmento también se beneficia de los programas de detección financiados por el gobierno y de las iniciativas de salud pública que promueven la detección temprana.
- Por el usuario final
Según el usuario final, el mercado se segmenta en hospitales, clínicas, centros de atención domiciliaria, centros de terapia y otros. Los hospitales dominaron el mercado con una participación en los ingresos del 45% en 2024, impulsados por su infraestructura consolidada, el acceso a atención pediátrica especializada y la disponibilidad de servicios integrados de diagnóstico y terapia. Hospitales en China, Japón y Corea del Sur sirven como centros de atención primaria para el manejo del síndrome de Down. Las familias a menudo prefieren los programas hospitalarios para el diagnóstico inicial, el asesoramiento y las sesiones de terapia estructurada. Los hospitales también colaboran con ONG y programas gubernamentales para aumentar la difusión y la concienciación. El equipo avanzado y los especialistas capacitados en los hospitales garantizan una mayor adopción de protocolos de tratamiento estandarizados. Los grandes hospitales también ofrecen programas de seguimiento y clínicas multidisciplinarias para el manejo a largo plazo de los pacientes.
Se prevé que los centros de terapia registren la tasa de crecimiento anual compuesta (TCAC) más rápida, del 20 %, entre 2025 y 2032, impulsada por la creciente demanda de programas de terapia personalizados, intensivos y continuos. Los centros de terapia en la India y el Sudeste Asiático se están expandiendo rápidamente para atender a la creciente población pediátrica. Las familias buscan cada vez más centros especializados en logopedia, terapia ocupacional y fisioterapia. La integración de servicios de teleterapia y terapia móvil mejora aún más la accesibilidad. Estos centros también ofrecen seguimiento estructurado del progreso y planes de atención individualizados, lo que los hace atractivos para los cuidadores. La expansión de las cadenas privadas de terapia está impulsando el crecimiento del mercado organizado en las zonas urbanas.
- Por canal de distribución
Según el canal de distribución, el mercado se segmenta en licitación directa, ventas minoristas y otros. El segmento de licitación directa dominó el mercado con una participación en los ingresos del 52 % en 2024, impulsado por la adquisición de kits de diagnóstico, herramientas terapéuticas y material educativo por parte de gobiernos y ONG. La adquisición directa garantiza un suministro constante a hospitales, clínicas y centros de terapia. Países como China e India aprovechan las licitaciones gubernamentales masivas para ofrecer programas de terapia asequibles. La distribución mediante licitación directa también reduce la dependencia de intermediarios, garantizando la calidad y la entrega puntual. Los contratos a largo plazo con instituciones sanitarias estabilizan aún más los flujos de ingresos. Este segmento se beneficia del aumento de las iniciativas de salud pública que apoyan la atención y la terapia del síndrome de Down.
Se espera que las ventas minoristas registren la tasa de crecimiento anual compuesta (TCAC) más rápida, del 17,8 %, entre 2025 y 2032, impulsada por la creciente adopción de kits de atención domiciliaria, ayudas terapéuticas y dispositivos de asistencia para la gestión en el hogar. Las plataformas de venta minorista en línea y los canales de comercio electrónico en países como India, China y Australia han mejorado la accesibilidad para los cuidadores. La comodidad, la asequibilidad y la creciente concienciación impulsan el crecimiento de las ventas minoristas. La disponibilidad de kits compatibles con teleterapia y herramientas educativas fomenta la adopción. El segmento también se beneficia de la creciente preferencia de los consumidores por la atención domiciliaria, junto con los programas de terapia profesional.
Análisis regional del mercado del síndrome de Down en Asia-Pacífico
- China dominó el mercado del síndrome de Down en Asia-Pacífico con la mayor participación en los ingresos del 38,7 % en 2024, caracterizado por una infraestructura de atención médica bien establecida, mayores niveles de concienciación y un fuerte apoyo gubernamental a los programas de atención médica genética y pediátrica, con un crecimiento sustancial en la adopción de terapias impulsada por innovaciones en tratamientos personalizados y servicios de intervención temprana.
- Las familias y los proveedores de atención médica del país valoran mucho la accesibilidad a centros de terapia especializada, servicios de diagnóstico integrales y modelos de atención integrados, que mejoran los resultados del desarrollo y la calidad de vida de los pacientes.
- Esta adopción generalizada se ve respaldada además por el aumento de los ingresos disponibles, la creciente urbanización y la expansión de las iniciativas de atención sanitaria pública y privada, lo que establece a China como el mercado líder para el tratamiento del síndrome de Down en la región de Asia y el Pacífico, tanto para la atención residencial como clínica.
Perspectivas del mercado del síndrome de Down en Japón
El mercado japonés del síndrome de Down está cobrando impulso gracias a la avanzada infraestructura sanitaria del país, su alto nivel de concienciación y su fuerte enfoque en la intervención temprana. Este mercado se ve impulsado por la creciente demanda de programas de terapia personalizada y servicios de apoyo al desarrollo para niños con síndrome de Down. Los hospitales y centros de terapia están adoptando enfoques innovadores que integran la educación y la atención médica. Se espera que el envejecimiento de la población japonesa y las iniciativas sanitarias impulsadas por el gobierno impulsen la demanda de sistemas de atención y apoyo especializados. Además, la integración de programas de asesoramiento genético y detección temprana está contribuyendo a la expansión del mercado.
Perspectivas del mercado del síndrome de Down en India
El mercado indio del síndrome de Down representó la mayor cuota de mercado en ingresos en Asia-Pacífico después de China en 2024, gracias a la rápida urbanización, la creciente concienciación y la mayor accesibilidad a la atención médica. El país está experimentando un aumento en el número de centros de terapia, clínicas especializadas y servicios de apoyo domiciliario para niños con síndrome de Down. Las iniciativas gubernamentales y los programas liderados por ONG que promueven el diagnóstico temprano, la intervención y la capacitación de cuidadores son impulsores clave del crecimiento. El aumento de los ingresos disponibles y la expansión de la clase media urbana impulsan aún más la adopción. Las soluciones terapéuticas asequibles y el creciente número de servicios de teleterapia están ampliando el alcance tanto en zonas urbanas como semiurbanas.
Perspectivas del mercado del síndrome de Down en Corea del Sur
Se espera que el mercado surcoreano del síndrome de Down crezca a una tasa de crecimiento anual compuesta (TCAC) notable durante el período de pronóstico, impulsado por los avances tecnológicos en herramientas de diagnóstico y programas terapéuticos. El país prioriza la detección temprana y la intervención personalizada, integrando los servicios de salud con el apoyo educativo. La creciente concienciación entre padres y cuidadores sobre los beneficios de la intervención temprana está impulsando su adopción. Las colaboraciones entre el gobierno y el sector privado están ampliando el acceso a centros de terapia y apoyo domiciliario. Además, el sólido ecosistema digital de salud de Corea del Sur facilita la monitorización remota y los servicios de teleterapia, lo que impulsa aún más el crecimiento del mercado.
Cuota de mercado del síndrome de Down en Asia-Pacífico
La industria del síndrome de Down en Asia-Pacífico está liderada principalmente por empresas bien establecidas, entre las que se incluyen:
- Aelis Farma (Francia)
- AC Immune SA (Suiza)
- Annovis Bio, Inc. (EE. UU.)
- Alzheon, Inc. (EE. UU.)
- Perha Pharmaceuticals (Francia)
- Natera, Inc. (EE. UU.)
- Myriad Genetics, Inc. (EE. UU.)
- Thermo Fisher Scientific Inc. (EE. UU.)
- F. Hoffmann-La Roche Ltd (Suiza)
- Eisai Co., Ltd. (Japón)
- Illumina, Inc. (EE. UU.)
- Abbott (EE. UU.)
- Genómica de bayas (China)
- KingMed Diagnostics (China)
- Inmedi (China)
- Zhejiang Shaoxing Dingjing Biopharmaceutical Technology Co., Ltd. (China)
- Annoroad Gene Technology (Beijing) Co., Ltd. (China)
- Sanvalley (China)
- Gen Yinfeng (China)
¿Cuáles son los desarrollos recientes en el mercado del síndrome de Down en Asia-Pacífico?
- En agosto de 2025, Amanda D'Silva, una joven de 22 años de origen indio y residente en Dubái con síndrome de Down, apareció en las pantallas gigantes de Times Square, Nueva York, como parte de una campaña global de concienciación sobre el síndrome de Down. Fue seleccionada entre más de 2600 candidaturas para la presentación anual de la Sociedad Nacional del Síndrome de Down, que promueve la inclusión y la representación de las personas con síndrome de Down.
- En agosto de 2025, investigadores de la Universidad de Mie (Japón) utilizaron la tecnología de edición genética CRISPR-Cas9 para eliminar el cromosoma 21 adicional, responsable del síndrome de Down, en células humanas cultivadas en laboratorio. Este estudio pionero, publicado en PNAS Nexus, marca un paso significativo hacia posibles intervenciones terapéuticas para el síndrome de Down.
- En marzo de 2025, el tema del Día Mundial del Síndrome de Down 2025 fue "Mejorar nuestros sistemas de apoyo", centrándose en fortalecer los sistemas de apoyo inclusivos para garantizar que las personas con síndrome de Down reciban la atención, la educación y las oportunidades que merecen.
- En marzo de 2024, la Comisión Nacional de Salud de China anunció mejoras en los tratamientos para embarazos de alto riesgo y mayores pruebas de detección de defectos congénitos de nacimiento, incluido el síndrome de Down, como parte de los esfuerzos para abordar el creciente número de madres mayores y un énfasis en la atención de calidad para los recién nacidos.
- En marzo de 2023, Adidas se asoció con FCB para diseñar una zapatilla de alto rendimiento diseñada para corredores con síndrome de Down. Esta zapatilla presenta un diseño único que se adapta a las necesidades específicas de las personas con síndrome de Down, promoviendo la inclusión en el deporte y la actividad física.
SKU-
Obtenga acceso en línea al informe sobre la primera nube de inteligencia de mercado del mundo
- Panel de análisis de datos interactivo
- Panel de análisis de empresas para oportunidades con alto potencial de crecimiento
- Acceso de analista de investigación para personalización y consultas
- Análisis de la competencia con panel interactivo
- Últimas noticias, actualizaciones y análisis de tendencias
- Aproveche el poder del análisis de referencia para un seguimiento integral de la competencia
Metodología de investigación
La recopilación de datos y el análisis del año base se realizan utilizando módulos de recopilación de datos con muestras de gran tamaño. La etapa incluye la obtención de información de mercado o datos relacionados a través de varias fuentes y estrategias. Incluye el examen y la planificación de todos los datos adquiridos del pasado con antelación. Asimismo, abarca el examen de las inconsistencias de información observadas en diferentes fuentes de información. Los datos de mercado se analizan y estiman utilizando modelos estadísticos y coherentes de mercado. Además, el análisis de la participación de mercado y el análisis de tendencias clave son los principales factores de éxito en el informe de mercado. Para obtener más información, solicite una llamada de un analista o envíe su consulta.
La metodología de investigación clave utilizada por el equipo de investigación de DBMR es la triangulación de datos, que implica la extracción de datos, el análisis del impacto de las variables de datos en el mercado y la validación primaria (experto en la industria). Los modelos de datos incluyen cuadrícula de posicionamiento de proveedores, análisis de línea de tiempo de mercado, descripción general y guía del mercado, cuadrícula de posicionamiento de la empresa, análisis de patentes, análisis de precios, análisis de participación de mercado de la empresa, estándares de medición, análisis global versus regional y de participación de proveedores. Para obtener más información sobre la metodología de investigación, envíe una consulta para hablar con nuestros expertos de la industria.
Personalización disponible
Data Bridge Market Research es líder en investigación formativa avanzada. Nos enorgullecemos de brindar servicios a nuestros clientes existentes y nuevos con datos y análisis que coinciden y se adaptan a sus objetivos. El informe se puede personalizar para incluir análisis de tendencias de precios de marcas objetivo, comprensión del mercado de países adicionales (solicite la lista de países), datos de resultados de ensayos clínicos, revisión de literatura, análisis de mercado renovado y base de productos. El análisis de mercado de competidores objetivo se puede analizar desde análisis basados en tecnología hasta estrategias de cartera de mercado. Podemos agregar tantos competidores sobre los que necesite datos en el formato y estilo de datos que esté buscando. Nuestro equipo de analistas también puede proporcionarle datos en archivos de Excel sin procesar, tablas dinámicas (libro de datos) o puede ayudarlo a crear presentaciones a partir de los conjuntos de datos disponibles en el informe.