

Mercado de software de gestión de la construcción de Asia y el Pacífico, por oferta ( solución , servicios), tipo de dispositivo (teléfono inteligente, computadora), modelo de precios (basado en licencia, basado en suscripción), aplicación (preconstrucción, gestión de proyectos , gestión de recursos, gestión financiera, software de gestión de relaciones con el cliente, otros), vertical (contratistas de construcción residencial, contratistas de construcción comercial, contratista de paisajismo , gerente de construcción, ingeniero , arquitecto, otros), tendencias de la industria y pronóstico hasta 2029.
Análisis y tamaño del mercado
El sector de la construcción está atrasado en comparación con otras industrias en lo que se refiere al uso y adopción de nuevas tecnologías. En años anteriores, la construcción se realizaba con métodos tradicionales y herramientas y equipos tradicionales, lo que ponía en riesgo la vida de las personas y causaba un gran impacto en el medio ambiente. Sin embargo, a medida que ha pasado el tiempo, la sociedad ha desarrollado métodos más seguros y precisos para una construcción segura. En 1917, Henry Gantt creó un diagrama de programación llamado diagrama de Gantt. En ese momento, era una herramienta revolucionaria y, gradualmente, su importancia aumentó en la década de 1920. El proyecto de la presa Hoover, que comenzó en 1931, fue uno de los primeros beneficiarios del diagrama de Gantt. Además, la Asociación Estadounidense de Ingenieros de Costos está formada por los primeros profesionales de la gestión de proyectos y aquellos involucrados en la planificación y programación, costos y cronogramas y estimación de costos.

El software de gestión de proyectos de construcción se puede implementar en PC o dispositivos móviles (iOS o Android) y en software basado en la nube. Algunos de los beneficios del software de gestión de proyectos de construcción incluyen comunicación y colaboración en tiempo real, planificación eficaz de recursos, gestión optimizada de presupuestos, uso compartido y control de documentos, entre otros.
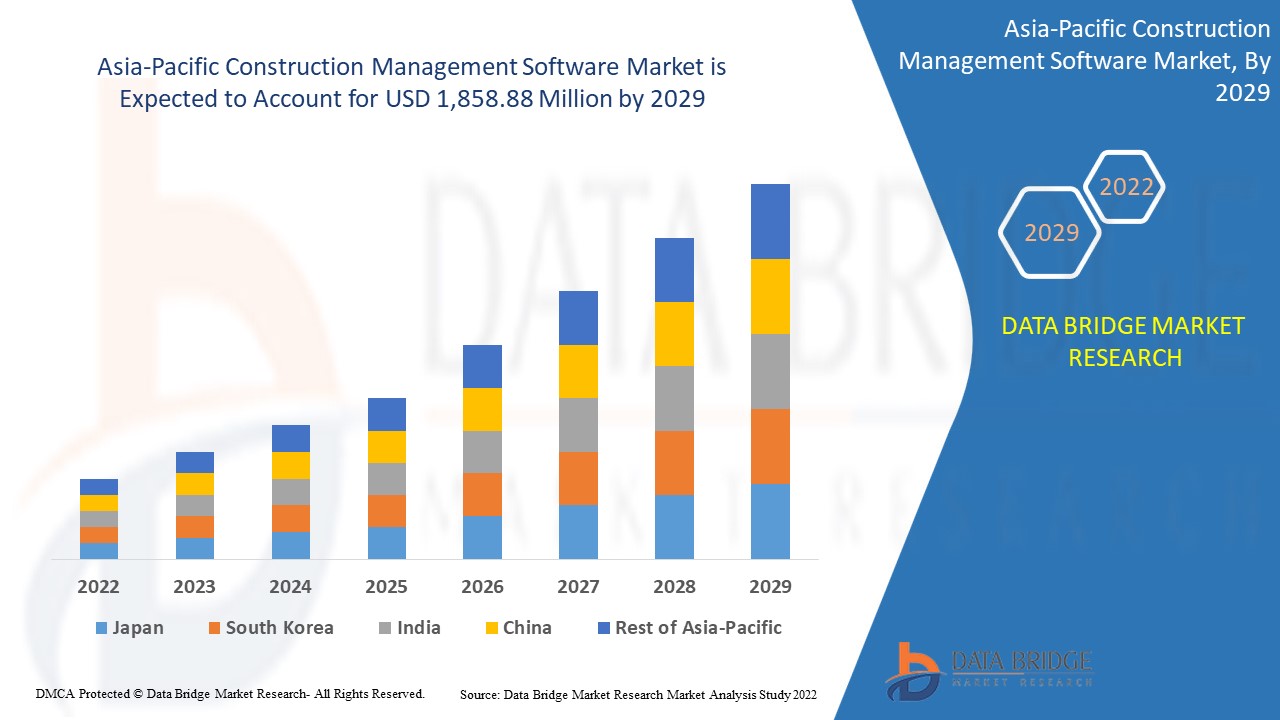
Data Bridge Market Research analiza que se espera que el mercado de software de gestión de la construcción de Asia-Pacífico alcance un valor de USD 1.858,88 millones para 2029, con una CAGR del 7,7 % durante el período de pronóstico. El informe del mercado de software de gestión de la construcción también cubre en profundidad el análisis de precios, el análisis de patentes y los avances tecnológicos.
|
Métrica del informe |
Detalles |
|
Período de pronóstico |
2022 a 2029 |
|
Año base |
2021 |
|
Años históricos |
2020 |
|
Unidades cuantitativas |
Ingresos en millones de USD, precios en USD |
|
Segmentos cubiertos |
Por oferta (solución, servicios), tipo de dispositivo (teléfono inteligente, computadora), modelo de precios (basado en licencia, basado en suscripción), aplicación (preconstrucción, gestión de proyectos, gestión de recursos, gestión financiera, software de gestión de relaciones con el cliente, otros), vertical (contratistas de construcción residencial, contratistas de construcción comercial, contratista de paisajismo, gerente de construcción, ingeniero, arquitecto, otros) |
|
Países cubiertos |
China, Japón, India, Corea del Sur, Singapur, Malasia, Australia, Tailandia, Indonesia, Filipinas, Resto de Asia-Pacífico (APAC) |
|
Actores del mercado cubiertos |
Entre los proveedores de servicios de consultoría de Oracle se encuentran Oracle, Procore Technologies, Inc., Intuit Inc., Trimble Inc., ConstructConnect, Sage Group plc, Autodesk Inc., Buildertrend, Smartsheet Inc., Branch Metrics, monday.com, Epicor Software, organización, Jonas Construction Software Inc., Wrike, Inc., Finalcad SARL, Constellation HomeBuilder Systems, CMiC, ITAakash Strategic Soft.(P) Ltd., RIB CCS, V Plan, CoConstruct, UDA Technologies, STACK Construction Technologies, Systemates, Inc., Tilos Americas, INSPECTIVITY PTY LTD., ClockShark, LLC, MITEK INC., EZOfficeInventory, BENTLEY SYSTEMS, INCORPORATED, entre otros. |
El software de gestión de la construcción es una herramienta que utilizan los profesionales para agilizar las tareas diarias y mejorar la ejecución de los proyectos. Ayuda a las empresas en la gestión presupuestaria, la comunicación, la toma de decisiones, la programación de trabajos y otros aspectos. Lo utilizan los contratistas y los directores de construcción para mejorar la productividad y cumplir con los plazos de los proyectos dentro del límite presupuestario.
El software de gestión de proyectos de construcción se puede implementar en PC o dispositivos móviles (iOS o Android) y en software basado en la nube. Algunos de los beneficios del software de gestión de proyectos de construcción incluyen comunicación y colaboración en tiempo real, planificación eficaz de recursos, gestión optimizada de presupuestos, uso compartido y control de documentos, entre otros.
Dinámica del mercado del software de gestión de la construcción
En esta sección se aborda la comprensión de los factores impulsores del mercado, las ventajas, las oportunidades, las limitaciones y los desafíos. Todo esto se analiza en detalle a continuación:
Impulsores/Oportunidades
- Aumento de la adopción de tecnología basada en la nube en el software de gestión de proyectos
La adopción de tecnología basada en la nube en el software de gestión está añadiendo más valor al proceso de gestión de la construcción debido a la accesibilidad y las técnicas de usuario, lo que genera importantes beneficios a largo plazo. Los beneficios a largo plazo son que los profesionales de la construcción estén al tanto y dispuestos a adoptar la tecnología. Por lo tanto, la adopción de tecnología basada en la nube tiene una gran demanda debido al aumento de la demanda de digitalización para proyectos de construcción, lo que conduce al crecimiento del mercado de software de gestión de la construcción de Asia-Pacífico.
- Creciente importancia de la gestión lean para reducir los costes operativos mediante la adopción de software
La construcción lean incluye características esenciales para lograr un conjunto de objetivos que apuntan a la eficiencia del proyecto mediante la optimización de los recursos, lo cual es muy fácil de implementar con la ayuda del diseño, la planificación, la activación y el mantenimiento. La implementación de este proceso es difícil y complicada de monitorear en la realidad, por lo que la integración de tecnología simplificará la gestión lean en el proceso de gestión de la construcción, lo que impulsa directamente el mercado de software de gestión de la construcción de Asia y el Pacífico.
- Alta exigencia de gestión eficaz de herramientas
La gestión eficaz de las herramientas permitirá aumentar la eficiencia de los costes del proyecto de construcción y, por tanto, las empresas constructoras podrán aumentar sus márgenes de beneficio junto con el aumento de la eficiencia laboral. Estas herramientas se gestionan fácilmente a través de programas de software que ofrecen funciones de diagrama de Gantt para programar el uso de las herramientas y el equipo, lo que contribuirá directamente al crecimiento del mercado de software de gestión de la construcción de Asia y el Pacífico.
- Digitalización en el sector de la construcción
La digitalización supone una importante ventaja para la industria de la construcción y para el crecimiento de la economía de Asia-Pacífico. Esto impulsará la adopción de software y aplicaciones para mejorar la productividad en la construcción y, por lo tanto, ayudará directamente al crecimiento del mercado de software de gestión de la construcción en Asia-Pacífico.
- Aumenta el apoyo gubernamental a las asociaciones de desarrollo de infraestructura
El papel principal del gobierno para el desarrollo de cualquier nación comienza con el desarrollo de la infraestructura y debe garantizar la cooperación con el sector privado para construir de manera eficiente la infraestructura necesaria, en particular en materia de energía, carreteras, telecomunicaciones, suministro de agua, ferrocarriles, salud y muchas otras, para impulsar el crecimiento positivo de la economía. Por lo tanto, los gobiernos de todo el mundo apoyan a la industria de la construcción, lo que apoyará directamente el crecimiento del mercado de software de gestión de la construcción en Asia y el Pacífico.
Restricciones/Desafíos
- Alto costo inicial del software de gestión de la construcción
Los proyectos de construcción están asociados con sorpresas y, en consecuencia, el precio del software varía. En la etapa inicial de adopción del software, habrá un precio de instalación que puede incluir el costo de los dispositivos utilizados para la interfaz, la accesibilidad y la introducción de datos, y hay un cargo de suscripción independiente que los usuarios deben pagar de forma recurrente mensual o anual. El costo inicial será muy alto en comparación con las tarifas de suscripción y, por lo tanto, se espera que restrinja el crecimiento del mercado de software de gestión de la construcción de Asia y el Pacífico.
- Complejidad asociada al desarrollo de software
El desarrollo de diferentes software de gestión de la construcción dará lugar a numerosos problemas para los desarrolladores de software que no están familiarizados con las obras de campo. Esta puede ser una de las principales razones de las dificultades a las que se enfrentan los desarrolladores y cada proyecto es diferente, por lo que debe haber un nuevo desarrollo de software que dé lugar a nuevos errores y acelere el tiempo de desarrollo, lo que genera complejidad. Por lo tanto, una mayor complejidad en el desarrollo de software obstaculizará directamente el crecimiento de la industria de la construcción y, por lo tanto, limitará el crecimiento del mercado de software de gestión de la construcción de Asia y el Pacífico.
Impacto posterior al COVID-19 en el mercado de software de gestión de la construcción
La COVID-19 ha tenido un gran impacto en el mercado de software de gestión de la construcción, ya que casi todos los países han optado por cerrar todas las instalaciones de producción, excepto las que se dedican a la producción de bienes esenciales. El gobierno ha tomado algunas medidas estrictas, como el cierre de la producción y la venta de bienes no esenciales, el bloqueo del comercio internacional y muchas más para evitar la propagación de la COVID-19. Las únicas empresas que se enfrentan a esta situación de pandemia son los servicios esenciales a los que se les permite abrir y ejecutar los procesos.
El crecimiento del mercado de software de gestión de la construcción se atribuye a la creciente demanda de desarrollo de infraestructura e inversiones gubernamentales para proyectos de construcción en todas las regiones y países. Aunque la industria de la construcción enfrentó grandes problemas durante la pandemia, ya que estuvo completamente cerrada, luego se reanudó a un ritmo mayor y continúa creciendo.
Los proveedores de software están tomando diversas decisiones estratégicas para recuperarse tras la COVID-19. Los actores están llevando a cabo múltiples actividades de investigación y desarrollo para mejorar la tecnología involucrada en las operaciones de construcción para integrar y automatizar los procesos de trabajo. Con esto, las empresas traerán tecnologías avanzadas al mercado. Además, las iniciativas gubernamentales para grandes proyectos comerciales han llevado al crecimiento del mercado.
Acontecimientos recientes
- En mayo de 2022, Oracle anunció la asociación con Deloitte para establecer mejores aplicaciones de Oracle. Esta asociación ayudará a la empresa a desarrollar tecnología de aplicaciones y en la nube para ofrecer una mejor cartera de soluciones a los clientes y mejorar el valor de la marca.
- En mayo de 2022, Procore Technologies, Inc. anunció que la empresa había sido reconocida como el producto de construcción mejor calificado por TrsutRadius por sus productos tecnológicos. Este reconocimiento ayudará a la empresa a aumentar el valor de su marca en el mercado y la confianza entre los clientes, lo que puede ayudar a acelerar el crecimiento de las ventas de la empresa.
Alcance del mercado de software de gestión de la construcción en Asia-Pacífico
El mercado de software de gestión de la construcción está segmentado en función de la oferta, el tipo de dispositivo, el modelo de precios, la aplicación y el sector vertical. El crecimiento entre estos segmentos le ayudará a analizar los segmentos de crecimiento reducido de las industrias y brindará a los usuarios una valiosa descripción general del mercado y conocimientos del mercado para ayudarlos a tomar decisiones estratégicas para identificar las principales aplicaciones del mercado.
Ofrenda
- Solución
- Servicios
Sobre la base de la oferta, el mercado de software de gestión de construcción de Asia-Pacífico está segmentado en soluciones y servicios.
Tipo de dispositivo
- Teléfono inteligente
- Computadora
Sobre la base del tipo de dispositivo, el mercado de software de gestión de construcción de Asia-Pacífico se ha segmentado en teléfonos inteligentes y computadoras.
Modelo de precios
- Basado en licencia
- Basado en suscripción
Sobre la base del modelo de precios, el mercado de software de gestión de construcción de Asia-Pacífico se ha segmentado en basado en licencias y basado en suscripciones.
Solicitud
- Pre-construcción
- Gestión de proyectos
- Gestión de recursos
- Gestión financiera
- Software de gestión de relaciones con el cliente
- Otros
Sobre la base de la aplicación, el mercado de software de gestión de construcción de Asia-Pacífico se ha segmentado en software de preconstrucción, gestión de proyectos, gestión de recursos, gestión financiera, gestión de relaciones con los clientes y otros.
Vertical
- Contratistas de construcción residencial
- Contratistas de construcción comercial
- Contratista de paisajismo
- Gerente de construcción
- Ingeniero
- Arquitecto
- Otros
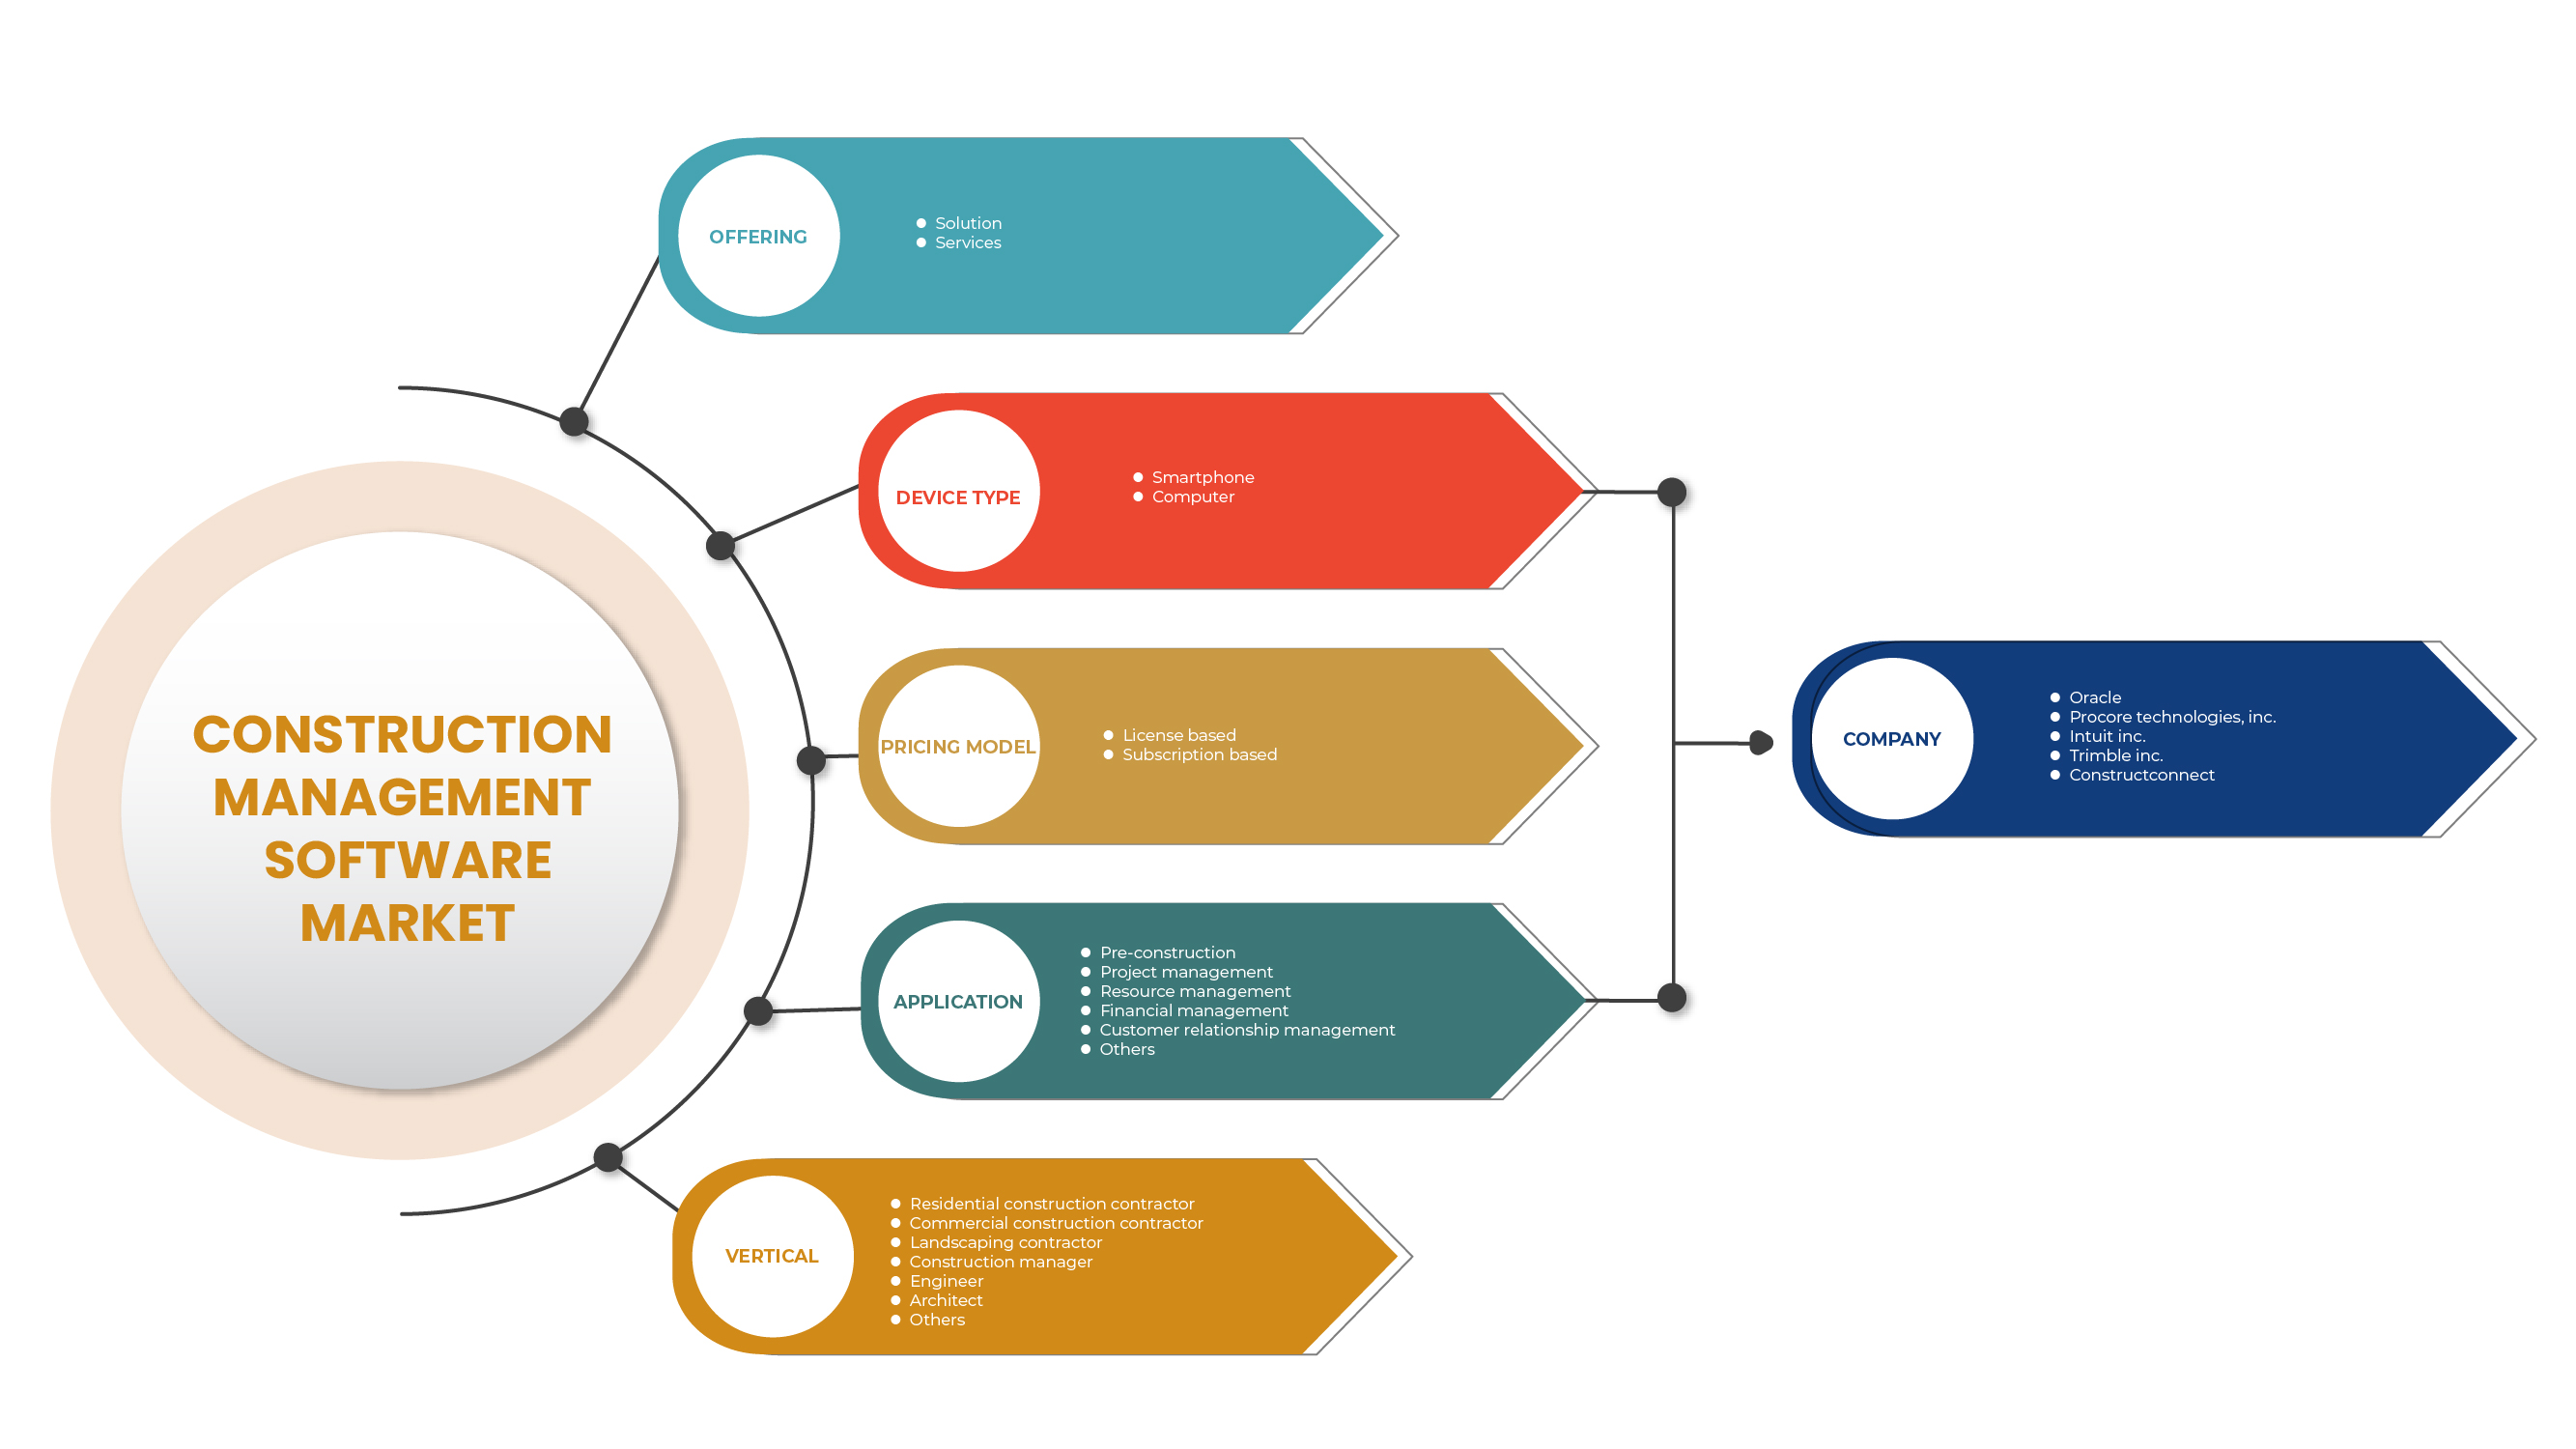
Sobre la base vertical, el mercado de software de gestión de construcción de Asia-Pacífico se ha segmentado en contratistas de construcción residencial, contratistas de construcción comercial, contratistas de paisajismo, gerente de construcción, ingeniero, arquitecto y otros.
Análisis y perspectivas regionales del mercado de software de gestión de la construcción
Se analiza el mercado de software de gestión de la construcción y se proporcionan información y tendencias del tamaño del mercado por país, oferta, tipo de dispositivo, modelo de precios, aplicación y vertical como se menciona anteriormente.
Los países cubiertos en el informe del mercado de software de gestión de la construcción son China, Japón, Corea del Sur, India, Singapur, Tailandia, Malasia, Indonesia, Filipinas y el resto de Asia-Pacífico (APAC).
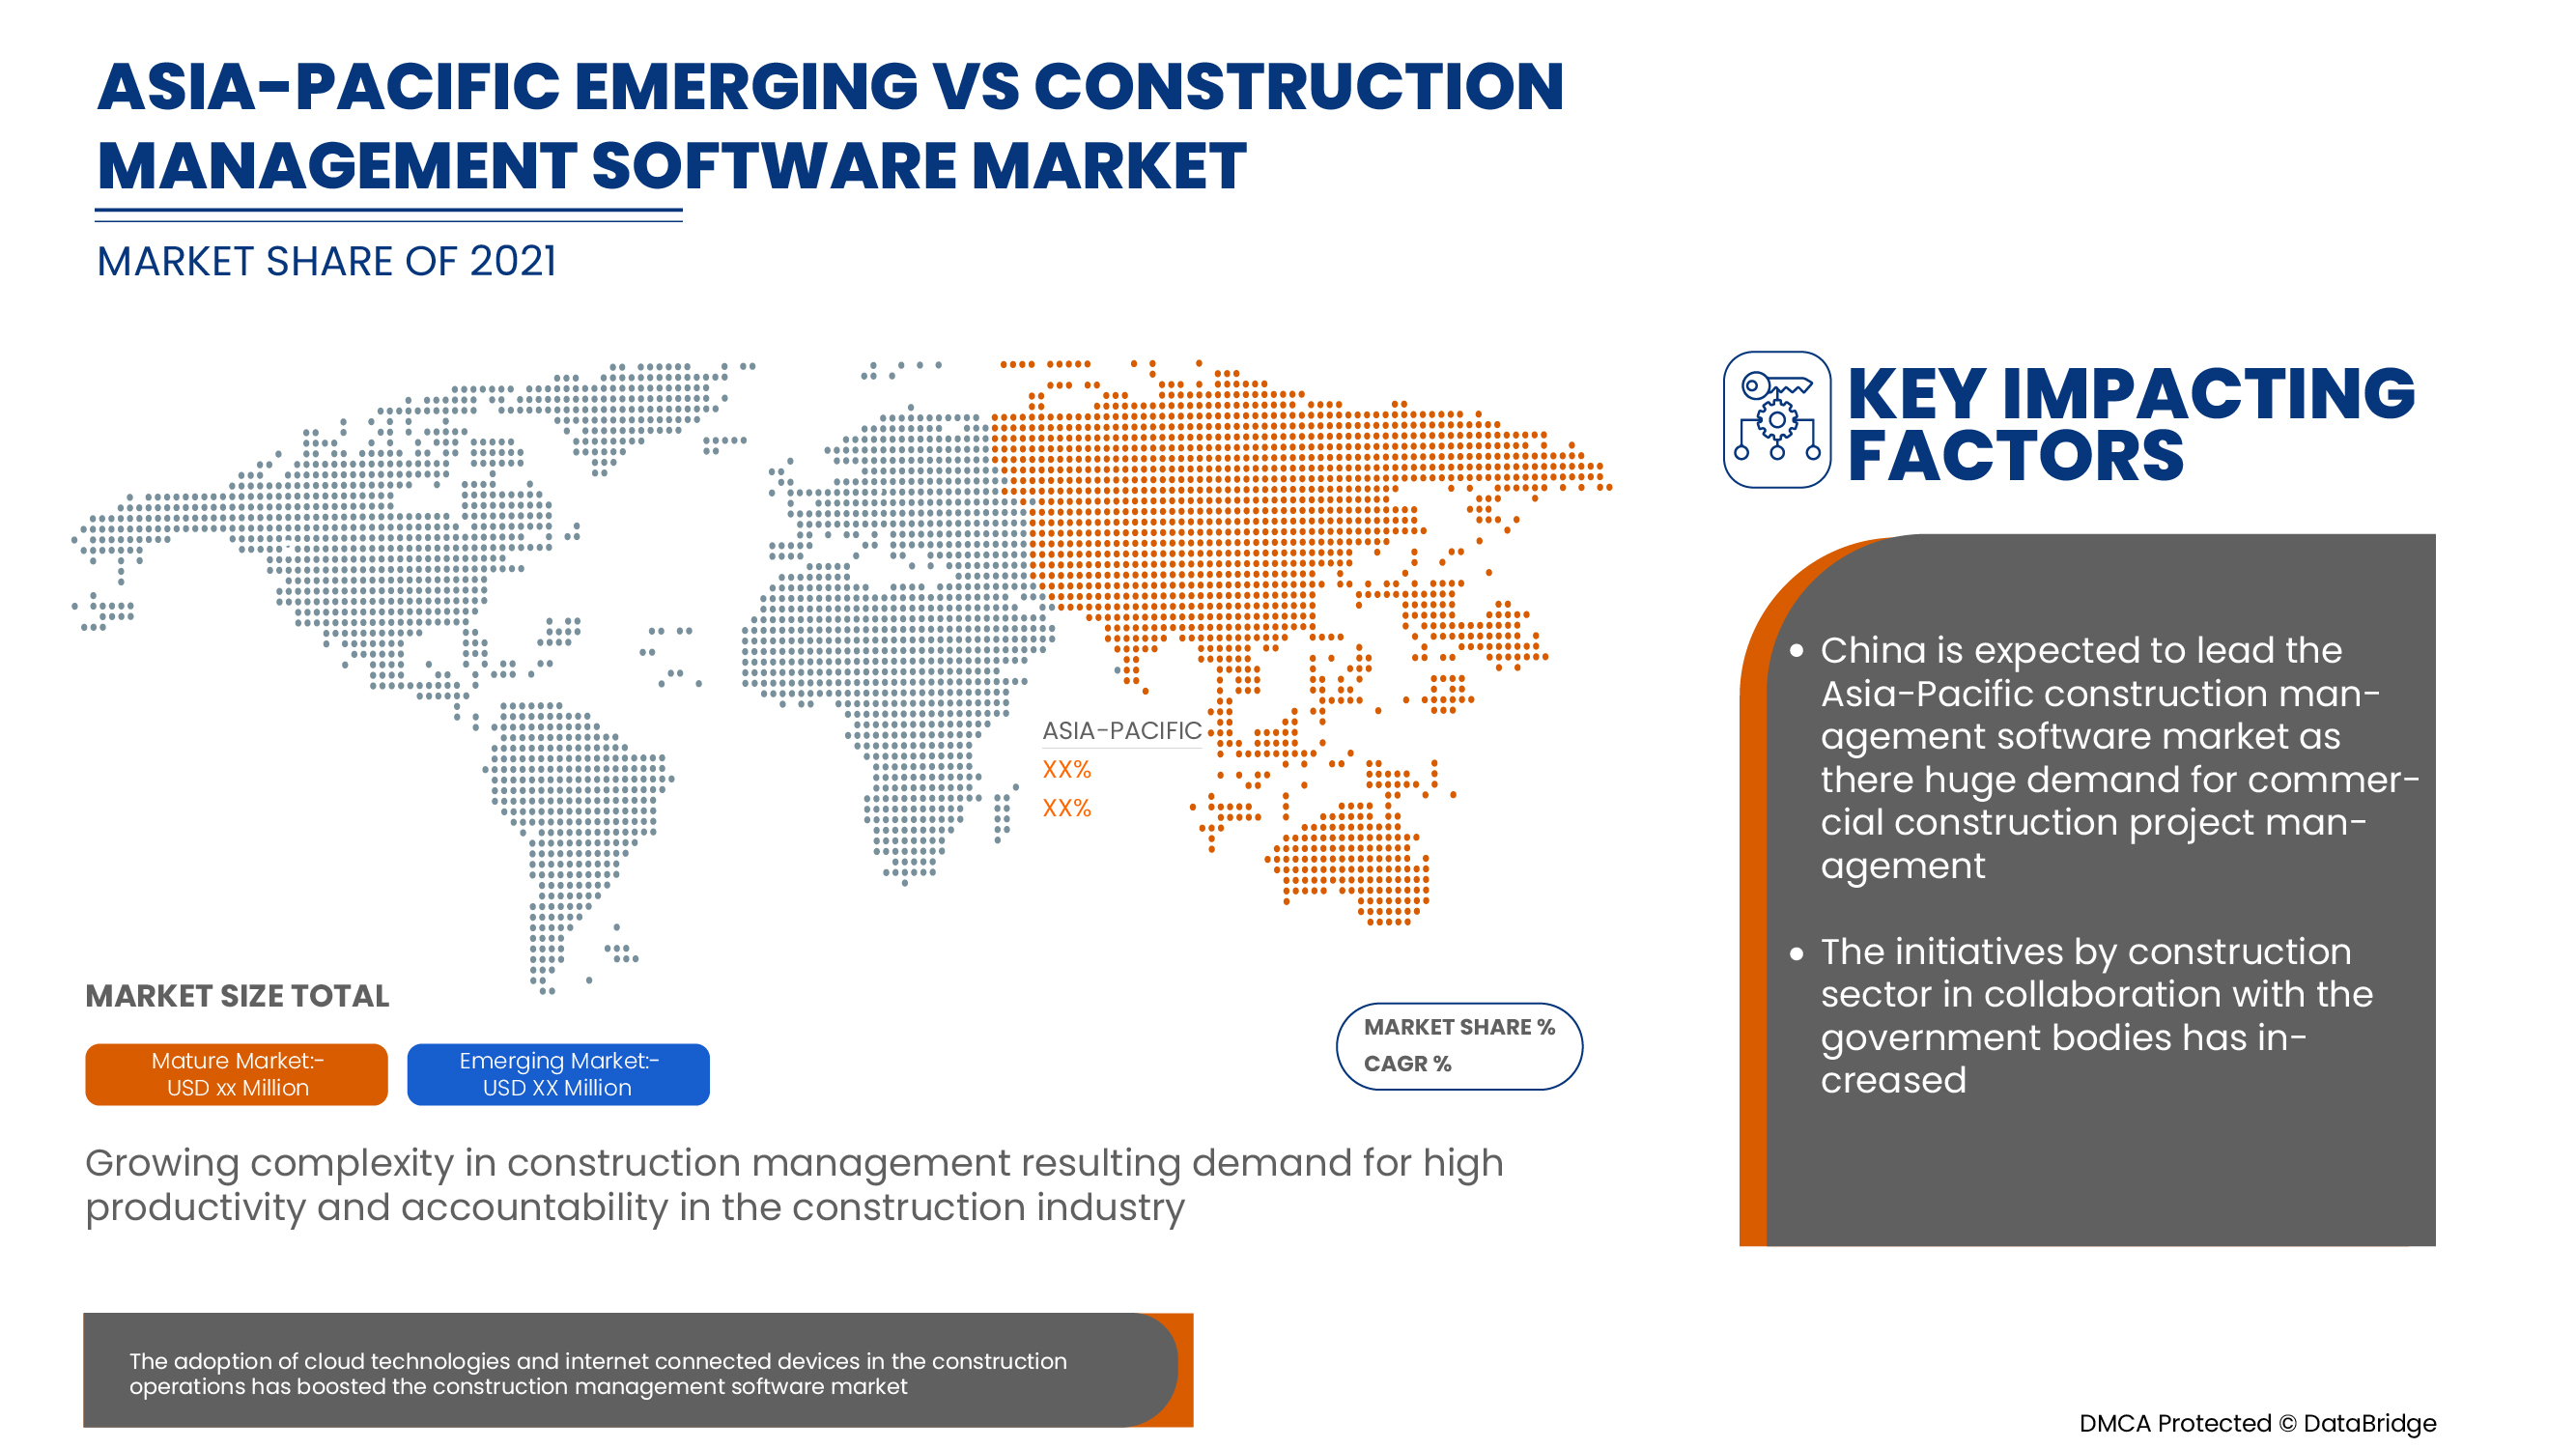
China domina el mercado de software de gestión de la construcción en Asia-Pacífico. Es probable que China sea el mercado de software de gestión de la construcción de Asia-Pacífico que crece más rápidamente. La principal razón detrás de esto es el aumento de contratistas de construcción comerciales del gobierno de China.
La sección de países del informe también proporciona factores de impacto de mercado individuales y cambios en la regulación del mercado que afectan las tendencias actuales y futuras del mercado. Los puntos de datos como el análisis de la cadena de valor ascendente y descendente, las tendencias técnicas y el análisis de las cinco fuerzas de Porter, los estudios de casos son algunos de los indicadores utilizados para pronosticar el escenario del mercado para países individuales. Además, la presencia y disponibilidad de marcas de Asia-Pacífico y sus desafíos enfrentados debido a la gran o escasa competencia de las marcas locales y nacionales, el impacto de los aranceles nacionales y las rutas comerciales se consideran al proporcionar un análisis de pronóstico de los datos del país.
Análisis de la cuota de mercado del software de gestión de la construcción y panorama competitivo
El panorama competitivo del mercado de software de gestión de la construcción proporciona detalles por competidor. Los detalles incluidos son una descripción general de la empresa, las finanzas de la empresa, los ingresos generados, el potencial de mercado, la inversión en investigación y desarrollo, las nuevas iniciativas de mercado, la presencia en Asia-Pacífico, los sitios e instalaciones de producción, las capacidades de producción, las fortalezas y debilidades de la empresa, el lanzamiento de productos, la amplitud y la variedad de productos, y el dominio de las aplicaciones. Los puntos de datos anteriores proporcionados solo están relacionados con el enfoque de las empresas en relación con el mercado de software de gestión de la construcción.
Algunos de los principales actores que operan en el mercado de software de gestión de la construcción son Oracle, Procore Technologies, Inc., Intuit Inc., Trimble Inc., ConstructConnect, Sage Group plc, Autodesk Inc., Buildertrend, Smartsheet Inc., Branch Metrics, monday.com, Epicor Software, orporation, Jonas Construction Software Inc., Wrike, Inc., Finalcad SARL, Constellation HomeBuilder Systems, CMiC, ITAakash Strategic Soft.(P) Ltd., RIB CCS, V Plan, CoConstruct, UDA Technologies, STACK Construction Technologies, Systemates, Inc., Tilos Americas, INSPECTIVITY PTY LTD., ClockShark, LLC, MITEK INC., EZOfficeInventory, BENTLEY SYSTEMS, INCORPORATED entre otros.
SKU-
Obtenga acceso en línea al informe sobre la primera nube de inteligencia de mercado del mundo

- Panel de análisis de datos interactivo
- Panel de análisis de empresas para oportunidades con alto potencial de crecimiento
- Acceso de analista de investigación para personalización y consultas
- Análisis de la competencia con panel interactivo
- Últimas noticias, actualizaciones y análisis de tendencias
- Aproveche el poder del análisis de referencia para un seguimiento integral de la competencia
Tabla de contenido
1 INTRODUCTION
1.1 OBJECTIVES OF THE STUDY
1.2 MARKET DEFINITION
1.3 OVERVIEW OF ASIA PACIFIC CONSTRUCTION MANAGEMENT SOFTWARE MARKET
1.4 CURRENCY AND PRICING
1.5 LIMITATIONS
1.6 MARKETS COVERED
2 MARKET SEGMENTATION
2.1 MARKETS COVERED
2.2 GEOGRAPHICAL SCOPE
2.3 YEARS CONSIDERED FOR THE STUDY
2.4 DBMR TRIPOD DATA VALIDATION MODEL
2.5 PRIMARY INTERVIEWS WITH KEY OPINION LEADERS
2.6 DBMR MARKET POSITION GRID
2.7 VENDOR SHARE ANALYSIS
2.8 OFFERING TYPE TIMELINE CURVE
2.9 MULTIVARIATE MODELING
2.1 MARKET APPLICATION COVERAGE GRID
2.11 SECONDARY SOURCES
2.12 ASSUMPTIONS
3 EXECUTIVE SUMMARY
4 PREMIUM INSIGHTS
5 MARKET OVERVIEW
5.1 DRIVERS
5.1.1 RISE IN CLOUD-BASED TECHNOLOGY ADOPTION IN PROJECT MANAGEMENT SOFTWARE
5.1.2 RISE IN THE TREND OF URBANIZATION AND CONSTRUCTION INVESTMENTS
5.1.3 GROWING IMPORTANCE OF LEAN MANAGEMENT TO REDUCE OPERATING COSTS THROUGH THE ADOPTION OF SOFTWARE
5.1.4 HIGH REQUIREMENT FOR EFFECTIVE TOOL MANAGEMENT
5.1.5 RISE IN INCLINATION OF CONSTRUCTION INDUSTRY TOWARDS EFFICIENCY AND ACCOUNTABILITY
5.2 RESTRAINTS
5.2.1 HIGH INITIAL COST OF CONSTRUCTION MANAGEMENT SOFTWARE
5.2.2 LACK OF TECHNICAL EXPERTISE
5.2.3 HIGHER PROBABILITY OF COMPLICATIONS OF SIMPLE PROJECTS
5.3 OPPORTUNITIES
5.3.1 DIGITALIZATION IN THE CONSTRUCTION SECTOR
5.3.2 RISE IN GOVERNMENT SUPPORT FOR INFRASTRUCTURE DEVELOPMENT ASSOCIATIONS
5.3.3 RISE IN THE NUMBER OF SMARTPHONE APPLICATIONS RELATED TO THE CONSTRUCTION INDUSTRY
5.3.4 UPSURGE OF INTEGRATION OF AI-DRIVEN CONSTRUCTION MANAGEMENT SOFTWARE
5.4 CHALLENGES
5.4.1 COMPLEXITY ASSOCIATED WITH THE DEVELOPMENT OF SOFTWARE
5.4.2 LACK OF STANDARDIZATION IN MANAGING LARGE DATA
6 ASIA PACIFIC CONSTRUCTION MANAGEMENT SOFTWARE MARKET, BY OFFERING
6.1 OVERVIEW
6.2 SOLUTION
6.2.1 INTEGRATED
6.2.2 CHANNEL IN A BOX
6.3 SERVICES
6.3.1 MANAGED SERVICES
6.3.2 PROFESSIONAL SERVICES
6.3.2.1 CONSULTING
6.3.2.2 IMPLEMENTATION
6.3.2.3 SUPPORT AND MAINTENANCE
7 ASIA PACIFIC CONSTRUCTION MANAGEMENT SOFTWARE MARKET, BY DEVICE TYPE
7.1 OVERVIEW
7.2 COMPUTER
7.2.1 WINDOWS
7.2.2 MAC
7.2.3 LINUX
7.2.4 OTHERS
7.3 SMARTPHONE
7.3.1 ANDROID
7.3.2 IOS
7.3.3 OTHERS
8 ASIA PACIFIC CONSTRUCTION MANAGEMENT SOFTWARE MARKET, BY PRICING MODULE
8.1 OVERVIEW
8.2 LICENSE BASED
8.3 SUBSCRIPTION BASED
8.3.1 MONTHLY SUBSCRIPTION
8.3.2 ANNUAL SUBSCRIPTION
9 ASIA PACIFIC CONSTRUCTION MANAGEMENT SOFTWARE MARKET, BY APPLICATION
9.1 OVERVIEW
9.2 FINANCIAL MANAGEMENT
9.2.1 PROJECT FINANCIALS
9.2.2 INVOICE MANAGEMENT
9.2.3 ACCOUNTING INTEGRATIONS
9.3 PROJECT MANAGEMENT
9.3.1 QUALITY & SAFETY
9.3.2 DESIGN COORDINATION
9.3.3 BIM
9.4 RESOURCE MANAGEMENT
9.5 CUSTOMER RELATIONSHIP MANAGEMENT SOFTWARE
9.6 PRE-CONSTRUCTION
9.6.1 ORDER MANAGEMENT
9.6.2 ESTIMATING SOFTWARE
9.6.3 BID MANAGEMENT
9.6.4 PREQUALIFICATION
9.7 OTHERS
10 ASIA PACIFIC CONSTRUCTION MANAGEMENT SOFTWARE MARKET, BY VERTICAL
10.1 OVERVIEW
10.2 RESIDENTIAL CONSTRUCTION CONTRACTORS
10.2.1 BY TYPE
10.2.1.1 REMODELING CONTRACTORS
10.2.1.2 GENERAL CONTRACTORS
10.2.1.3 SIDING OR ROOFING CONTRACTOR
10.2.2 BY DEPLOYMENT
10.2.2.1 CLOUD
10.2.2.2 ON-PREMISE
10.3 COMMERCIAL CONSTRUCTION CONTRACTORS
10.3.1 CLOUD
10.3.2 ON-PREMISE
10.4 LANDSCAPING CONTRACTOR
10.4.1 CLOUD
10.4.2 ON-PREMISE
10.5 ARCHITECTS
10.5.1 CLOUD
10.5.2 ON-PREMISE
10.6 ENGINEERS
10.6.1 CLOUD
10.6.2 ON-PREMISE
10.7 CONSTRUCTION MANAGERS
10.7.1 CLOUD
10.7.2 ON-PREMISE
10.8 OTHERS
10.8.1 CLOUD
10.8.2 ON-PREMISE
11 ASIA PACIFIC CONSTRUCTION MANAGEMENT SOFTWARE MARKET, BY REGION
11.1 ASIA-PACIFIC
11.1.1 CHINA
11.1.2 JAPAN
11.1.3 SOUTH KOREA
11.1.4 INDIA
11.1.5 AUSTRALIA
11.1.6 SINGAPORE
11.1.7 THAILAND
11.1.8 MALAYSIA
11.1.9 INDONESIA
11.1.10 PHILIPPINES
11.1.11 REST OF ASIA-PACIFIC
12 ASIA PACIFIC CONSTRUCTION MANAGEMENT SOFTWARE MARKET, COMPANY LANDSCAPE
12.1 COMPANY SHARE ANALYSIS: ASIA PACIFIC
13 SWOT ANALYSIS
14 COMPANY PROFILE
14.1 ORACLE
14.1.1 COMPANY SNAPSHOT
14.1.2 REVENUE ANALYSIS
14.1.3 COMPANY SHARE ANALYSIS
14.1.4 PRODUCT PORTFOLIO
14.1.5 RECENT DEVELOPMENTS
14.2 PROCORE TECHNOLOGIES, INC.
14.2.1 COMPANY SNAPSHOT
14.2.2 REVENUE ANALYSIS
14.2.3 COMPANY SHARE ANALYSIS
14.2.4 PRODUCT PORTFOLIO
14.2.5 RECENT DEVELOPMENTS
14.3 INTUIT INC.
14.3.1 COMPANY SNAPSHOT
14.3.2 REVENUE ANALYSIS
14.3.3 COMPANY SHARE ANALYSIS
14.3.4 PRODUCT PORTFOLIO
14.3.5 RECENT DEVELOPMENTS
14.4 TRIMBLE INC.
14.4.1 COMPANY SNAPSHOT
14.4.2 REVENUE ANALYSIS
14.4.3 COMPANY SHARE ANALYSIS
14.4.4 PRODUCT PORTFOLIO
14.4.5 RECENT DEVELOPMENTS
14.5 CONSTRUCTCONNECT
14.5.1 COMPANY SNAPSHOT
14.5.2 PRODUCT PORTFOLIO
14.5.3 RECENT DEVELOPMENTS
14.6 AUTODESK INC.
14.6.1 COMPANY SNAPSHOT
14.6.2 REVENUE ANALYSIS
14.6.3 PRODUCT PORTFOLIO
14.6.4 RECENT DEVELOPMENTS
14.7 BENTLEY SYSTEMS, INCORPORATED
14.7.1 COMPANY SNAPSHOT
14.7.2 REVENUE ANALYSIS
14.7.3 PRODUCT PORTFOLIO
14.7.4 RECENT DEVELOPMENTS
14.8 BRANCH METRICS
14.8.1 COMPANY SNAPSHOT
14.8.2 PRODUCT PORTFOLIO
14.8.3 RECENT DEVELOPMENTS
14.9 BUILDERTREND
14.9.1 COMPANY SNAPSHOT
14.9.2 PRODUCT PORTFOLIO
14.9.3 RECENT DEVELOPMENTS
14.1 CLOCKSHARK, LLC
14.10.1 COMPANY SNAPSHOT
14.10.2 PRODUCT PORTFOLIO
14.10.3 RECENT DEVELOPMENTS
14.11 CMIC
14.11.1 COMPANY SNAPSHOT
14.11.2 PRODUCT PORTFOLIO
14.11.3 RECENT DEVELOPMENTS
14.12 COCONSTRUCT
14.12.1 COMPANY SNAPSHOT
14.12.2 PRODUCT PORTFOLIO
14.12.3 RECENT DEVELOPMENT
14.13 CONSTELLATION HOMEBUILDER SYSTEMS
14.13.1 COMPANY SNAPSHOT
14.13.2 PRODUCT PORTFOLIO
14.13.3 RECENT DEVELOPMENTS
14.14 EPICOR SOFTWARE CORPORATION
14.14.1 COMPANY SNAPSHOT
14.14.2 PRODUCT PORTFOLIO
14.14.3 RECENT DEVELOPMENTS
14.15 EZOFFICEINVENTORY
14.15.1 COMPANY SNAPSHOT
14.15.2 PRODUCT PORTFOLIO
14.15.3 RECENT DEVELOPMENTS
14.16 FINALCAD SARL
14.16.1 COMPANY SNAPSHOT
14.16.2 PRODUCT PORTFOLIO
14.16.3 RECENT DEVELOPMENTS
14.17 INSPECTIVITY PTY LTD
14.17.1 COMPANY SNAPSHOT
14.17.2 PRODUCT PORTFOLIO
14.17.3 RECENT DEVELOPMENTS
14.18 ITAAKASH STRATEGIC SOFT. (P) LTD.
14.18.1 COMPANY SNAPSHOT
14.18.2 PRODUCT PORTFOLIO
14.18.3 RECENT DEVELOPMENT
14.19 JONAS CONSTRUCTION SOFTWARE INC.
14.19.1 COMPANY SNAPSHOT
14.19.2 PRODUCT PORTFOLIO
14.19.3 RECENT DEVELOPMENTS
14.2 MITEK INC.
14.20.1 COMPANY SNAPSHOT
14.20.2 PRODUCT PORTFOLIO
14.20.3 RECENT DEVELOPMENT
14.21 MONDAY.COM
14.21.1 COMPANY SNAPSHOT
14.21.2 REVENUE ANALYSIS
14.21.3 PRODUCT PORTFOLIO
14.21.4 RECENT DEVELOPMENTS
14.22 RIB CCS
14.22.1 COMPANY SNAPSHOT
14.22.2 PRODUCT PORTFOLIO
14.22.3 RECENT DEVELOPMENTS
14.23 SAGE GROUP PLC
14.23.1 COMPANY SNAPSHOT
14.23.2 REVENUE ANALYSIS
14.23.3 PRODUCT PORTFOLIO
14.23.4 RECENT DEVELOPMENTS
14.24 SMARTSHEET INC.
14.24.1 COMPANY SNAPSHOT
14.24.2 REVENUE ANALYSIS
14.24.3 PRODUCT PORTFOLIO
14.24.4 RECENT DEVELOPMENTS
14.25 STACK CONSTRUCTION TECHNOLOGIES
14.25.1 COMPANY SNAPSHOT
14.25.2 PRODUCT PORTFOLIO
14.25.3 RECENT DEVELOPMENTS
14.26 SYSTEMATES, INC.
14.26.1 COMPANY SNAPSHOT
14.26.2 PRODUCT PORTFOLIO
14.26.3 RECENT DEVELOPMENTS
14.27 TILOS AMERICAS
14.27.1 COMPANY SNAPSHOT
14.27.2 PRODUCT PORTFOLIO
14.27.3 RECENT DEVELOPMENT
14.28 UDA TECHNOLOGIES
14.28.1 COMPANY SNAPSHOT
14.28.2 PRODUCT PORTFOLIO
14.28.3 RECENT DEVELOPMENT
14.29 V PLAN
14.29.1 COMPANY SNAPSHOT
14.29.2 PRODUCT PORTFOLIO
14.29.3 RECENT DEVELOPMENT
14.3 WRIKE, INC.
14.30.1 COMPANY SNAPSHOT
14.30.2 PRODUCT PORTFOLIO
14.30.3 RECENT DEVELOPMENTS
15 QUESTIONNAIRE
16 RELATED REPORTS
Lista de Tablas
TABLE 1 ASIA PACIFIC CONSTRUCTION MANAGEMENT SOFTWARE MARKET, BY OFFERING, 2020-2029 (USD MILLION)
TABLE 2 ASIA PACIFIC SOLUTION IN CONSTRUCTION MANAGEMENT SOFTWARE MARKET, BY REGION, 2020-2029 (USD MILLION)
TABLE 3 ASIA PACIFIC SOLUTION IN CONSTRUCTION MANAGEMENT SOFTWARE MARKET, BY OFFERING, 2020-2029 (USD MILLION)
TABLE 4 ASIA PACIFIC SERVICES IN CONSTRUCTION MANAGEMENT SOFTWARE MARKET, BY REGION, 2020-2029 (USD MILLION)
TABLE 5 ASIA PACIFIC SERVICES IN CONSTRUCTION MANAGEMENT SOFTWARE MARKET, BY OFFERING, 2020-2029 (USD MILLION)
TABLE 6 ASIA PACIFIC PROFESSIONAL SERVICES IN CONSTRUCTION MANAGEMENT SOFTWARE MARKET, BY OFFERING, 2020-2029 (USD MILLION)
TABLE 7 ASIA PACIFIC CONSTRUCTION MANAGEMENT SOFTWARE MARKET, BY DEVICE TYPE, 2020-2029 (USD MILLION)
TABLE 8 ASIA PACIFIC COMPUTER IN CONSTRUCTION MANAGEMENT SOFTWARE MARKET, BY REGION, 2020-2029 (USD MILLION)
TABLE 9 ASIA PACIFIC COMPUTER IN CONSTRUCTION MANAGEMENT SOFTWARE MARKET, BY DEVICE TYPE, 2020-2029 (USD MILLION)
TABLE 10 ASIA PACIFIC SMARTPHONE IN CONSTRUCTION MANAGEMENT SOFTWARE MARKET, BY REGION, 2020-2029 (USD MILLION)
TABLE 11 ASIA PACIFIC SMARTPHONE IN CONSTRUCTION MANAGEMENT SOFTWARE MARKET, BY DEVICE TYPE, 2020-2029 (USD MILLION)
TABLE 12 ASIA PACIFIC CONSTRUCTION MANAGEMENT SOFTWARE MARKET, BY PRICING MODULE, 2020-2029 (USD MILLION)
TABLE 13 ASIA PACIFIC LICENSE BASED IN CONSTRUCTION MANAGEMENT SOFTWARE MARKET, BY REGION, 2020-2029 (USD MILLION)
TABLE 14 ASIA PACIFIC SUBSCRIPTION BASED IN CONSTRUCTION MANAGEMENT SOFTWARE MARKET, BY REGION, 2020-2029 (USD MILLION)
TABLE 15 ASIA PACIFIC SUBSCRIPTION BASED IN CONSTRUCTION MANAGEMENT SOFTWARE MARKET, BY PRICING MODULE, 2020-2029 (USD MILLION)
TABLE 16 ASIA PACIFIC CONSTRUCTION MANAGEMENT SOFTWARE MARKET, BY APPLICATION, 2020-2029 (USD MILLION)
TABLE 17 ASIA PACIFIC FINANCIAL MANAGEMENT IN CONSTRUCTION MANAGEMENT SOFTWARE MARKET, BY REGION, 2020-2029 (USD MILLION)
TABLE 18 ASIA PACIFIC FINANCIAL MANAGEMENT IN CONSTRUCTION MANAGEMENT SOFTWARE MARKET, BY APPLICATION, 2020-2029 (USD MILLION)
TABLE 19 ASIA PACIFIC PROJECT MANAGEMENT IN CONSTRUCTION MANAGEMENT SOFTWARE MARKET, BY REGION, 2020-2029 (USD MILLION)
TABLE 20 ASIA PACIFIC PROJECT MANAGEMENT IN CONSTRUCTION MANAGEMENT SOFTWARE MARKET, BY APPLICATION, 2020-2029 (USD MILLION)
TABLE 21 ASIA PACIFIC RESOURCE MANAGEMENT IN CONSTRUCTION MANAGEMENT SOFTWARE MARKET, BY REGION, 2020-2029 (USD MILLION)
TABLE 22 ASIA PACIFIC CUSTOMER RELATIONSHIP MANAGEMENT SOFTWARE IN CONSTRUCTION MANAGEMENT SOFTWARE MARKET, BY REGION, 2020-2029 (USD MILLION)
TABLE 23 ASIA PACIFIC PRE-CONSTRUCTION IN CONSTRUCTION MANAGEMENT SOFTWARE MARKET, BY REGION, 2020-2029 (USD MILLION)
TABLE 24 ASIA PACIFIC PRE-CONSTRUCTION IN CONSTRUCTION MANAGEMENT SOFTWARE MARKET, BY APPLICATION, 2020-2029 (USD MILLION)
TABLE 25 ASIA PACIFIC OTHERS IN CONSTRUCTION MANAGEMENT SOFTWARE MARKET, BY REGION, 2020-2029 (USD MILLION)
TABLE 26 ASIA PACIFIC CONSTRUCTION MANAGEMENT SOFTWARE MARKET, BY VERTICAL, 2020-2029 (USD MILLION)
TABLE 27 ASIA PACIFIC RESIDENTIAL CONSTRUCTION CONTRACTORS IN CONSTRUCTION MANAGEMENT SOFTWARE MARKET, BY REGION, 2020-2029 (USD MILLION)
TABLE 28 ASIA PACIFIC RESIDENTIAL CONSTRUCTION CONTRACTORS IN CONSTRUCTION MANAGEMENT SOFTWARE MARKET, BY TYPE, 2020-2029 (USD MILLION)
TABLE 29 ASIA PACIFIC RESIDENTIAL CONSTRUCTION CONTRACTORS IN CONSTRUCTION MANAGEMENT SOFTWARE MARKET, BY DEPLOYMENT, 2020-2029 (USD MILLION)
TABLE 30 ASIA PACIFIC COMMERCIAL CONSTRUCTION CONTRACTORS IN CONSTRUCTION MANAGEMENT SOFTWARE MARKET, BY REGION, 2020-2029 (USD MILLION)
TABLE 31 ASIA PACIFIC COMMERCIAL CONSTRUCTION CONTRACTORS IN CONSTRUCTION MANAGEMENT SOFTWARE MARKET, BY DEPLOYMENT, 2020-2029 (USD MILLION)
TABLE 32 ASIA PACIFIC LANDSCAPING CONTRACTORS IN CONSTRUCTION MANAGEMENT SOFTWARE MARKET, BY REGION, 2020-2029 (USD MILLION)
TABLE 33 ASIA PACIFIC LANDSCAPING CONTRACTORS IN CONSTRUCTION MANAGEMENT SOFTWARE MARKET, BY DEPLOYMENT, 2020-2029 (USD MILLION)
TABLE 34 ASIA PACIFIC ARCHITECTS IN CONSTRUCTION MANAGEMENT SOFTWARE MARKET, BY REGION, 2020-2029 (USD MILLION)
TABLE 35 ASIA PACIFIC ARCHITECTS IN CONSTRUCTION MANAGEMENT SOFTWARE MARKET, BY DEPLOYMENT, 2020-2029 (USD MILLION)
TABLE 36 ASIA PACIFIC ENGINEERS IN CONSTRUCTION MANAGEMENT SOFTWARE MARKET, BY REGION, 2020-2029 (USD MILLION)
TABLE 37 ASIA PACIFIC ENGINEERS IN CONSTRUCTION MANAGEMENT SOFTWARE MARKET, BY DEPLOYMENT, 2020-2029 (USD MILLION)
TABLE 38 ASIA PACIFIC CONSTRUCTION MANAGERS IN CONSTRUCTION MANAGEMENT SOFTWARE MARKET, BY REGION, 2020-2029 (USD MILLION)
TABLE 39 ASIA PACIFIC CONSTRUCTION MANAGERS IN CONSTRUCTION MANAGEMENT SOFTWARE MARKET, BY DEPLOYMENT, 2020-2029 (USD MILLION)
TABLE 40 ASIA PACIFIC OTHERS IN CONSTRUCTION MANAGEMENT SOFTWARE MARKET, BY REGION, 2020-2029 (USD MILLION)
TABLE 41 ASIA PACIFIC OTHERS IN CONSTRUCTION MANAGEMENT SOFTWARE MARKET, BY DEPLOYMENT, 2020-2029 (USD MILLION)
TABLE 42 ASIA-PACIFIC CONSTRUCTION MANAGEMENT SOFTWARE MARKET, BY COUNTRY, 2020-2029 (USD MILLION)
TABLE 43 ASIA-PACIFIC CONSTRUCTION MANAGEMENT SOFTWARE MARKET, BY OFFERING, 2020-2029 (USD MILLION)
TABLE 44 ASIA-PACIFIC SOLUTION IN CONSTRUCTION MANAGEMENT SOFTWARE MARKET, BY OFFERING, 2020-2029 (USD MILLION)
TABLE 45 ASIA-PACIFIC SERVICES IN CONSTRUCTION MANAGEMENT SOFTWARE MARKET, BY OFFERING, 2020-2029 (USD MILLION)
TABLE 46 ASIA-PACIFIC PROFESSIONAL SERVICES IN CONSTRUCTION MANAGEMENT SOFTWARE MARKET, BY OFFERING, 2020-2029 (USD MILLION)
TABLE 47 ASIA-PACIFIC CONSTRUCTION MANAGEMENT SOFTWARE MARKET, BY DEVICE TYPE, 2020-2029 (USD MILLION)
TABLE 48 ASIA-PACIFIC COMPUTER IN CONSTRUCTION MANAGEMENT SOFTWARE MARKET, BY TYPE, 2020-2029 (USD MILLION)
TABLE 49 ASIA-PACIFIC SMARTPHONE IN CONSTRUCTION MANAGEMENT SOFTWARE MARKET, BY TYPE, 2020-2029 (USD MILLION)
TABLE 50 ASIA-PACIFIC CONSTRUCTION MANAGEMENT SOFTWARE MARKET, BY PRICING MODULE, 2020-2029 (USD MILLION)
TABLE 51 ASIA-PACIFIC SUBSCRIPTION BASED IN CONSTRUCTION MANAGEMENT SOFTWARE MARKET, BY PRICING MODULE, 2020-2029 (USD MILLION)
TABLE 52 ASIA-PACIFIC CONSTRUCTION MANAGEMENT SOFTWARE MARKET, BY APPLICATION, 2020-2029 (USD MILLION)
TABLE 53 ASIA-PACIFIC FINANCIAL MANAGEMENT IN CONSTRUCTION MANAGEMENT SOFTWARE MARKET, BY TYPE, 2020-2029 (USD MILLION)
TABLE 54 ASIA-PACIFIC PROJECT MANAGEMENT IN CONSTRUCTION MANAGEMENT SOFTWARE MARKET, BY TYPE, 2020-2029 (USD MILLION)
TABLE 55 ASIA-PACIFIC PRECONSTRUCTION IN CONSTRUCTION MANAGEMENT SOFTWARE MARKET, BY TYPE, 2020-2029 (USD MILLION)
TABLE 56 ASIA-PACIFIC CONSTRUCTION MANAGEMENT SOFTWARE MARKET, BY VERTICAL, 2020-2029 (USD MILLION)
TABLE 57 ASIA-PACIFIC RESIDENTIAL CONSTRUCTION CONTRACTORS IN CONSTRUCTION MANAGEMENT SOFTWARE MARKET, BY TYPE, 2020-2029 (USD MILLION)
TABLE 58 ASIA-PACIFIC RESIDENTIAL CONSTRUCTION CONTRACTORS IN CONSTRUCTION MANAGEMENT SOFTWARE MARKET, BY DEPLOYMENT, 2020-2029 (USD MILLION)
TABLE 59 ASIA-PACIFIC COMMERCIAL CONSTRUCTION CONTRACTORS IN CONSTRUCTION MANAGEMENT SOFTWARE MARKET, BY DEPLOYMENT, 2020-2029 (USD MILLION)
TABLE 60 ASIA-PACIFIC LANDSCAPING CONTRACTORS IN CONSTRUCTION MANAGEMENT SOFTWARE MARKET, BY DEPLOYMENT, 2020-2029 (USD MILLION)
TABLE 61 ASIA-PACIFIC ARCHITECTS IN CONSTRUCTION MANAGEMENT SOFTWARE MARKET, BY DEPLOYMENT, 2020-2029 (USD MILLION)
TABLE 62 ASIA-PACIFIC ENGINEERS IN CONSTRUCTION MANAGEMENT SOFTWARE MARKET, BY DEPLOYMENT, 2020-2029 (USD MILLION)
TABLE 63 ASIA-PACIFIC CONSTRUCTION MANAGERS IN CONSTRUCTION MANAGEMENT SOFTWARE MARKET, BY DEPLOYMENT, 2020-2029 (USD MILLION)
TABLE 64 ASIA-PACIFIC OTHERS IN CONSTRUCTION MANAGEMENT SOFTWARE MARKET, BY DEPLOYMENT, 2020-2029 (USD MILLION)
TABLE 65 CHINA CONSTRUCTION MANAGEMENT SOFTWARE MARKET, BY OFFERING, 2020-2029 (USD MILLION)
TABLE 66 CHINA SOLUTION IN CONSTRUCTION MANAGEMENT SOFTWARE MARKET, BY OFFERING, 2020-2029 (USD MILLION)
TABLE 67 CHINA SERVICES IN CONSTRUCTION MANAGEMENT SOFTWARE MARKET, BY OFFERING, 2020-2029 (USD MILLION)
TABLE 68 CHINA PROFESSIONAL SERVICES IN CONSTRUCTION MANAGEMENT SOFTWARE MARKET, BY OFFERING, 2020-2029 (USD MILLION)
TABLE 69 CHINA CONSTRUCTION MANAGEMENT SOFTWARE MARKET, BY DEVICE TYPE, 2020-2029 (USD MILLION)
TABLE 70 CHINA COMPUTER IN CONSTRUCTION MANAGEMENT SOFTWARE MARKET, BY TYPE, 2020-2029 (USD MILLION)
TABLE 71 CHINA SMARTPHONE IN CONSTRUCTION MANAGEMENT SOFTWARE MARKET, BY TYPE, 2020-2029 (USD MILLION)
TABLE 72 CHINA CONSTRUCTION MANAGEMENT SOFTWARE MARKET, BY PRICING MODULE, 2020-2029 (USD MILLION)
TABLE 73 CHINA SUBSCRIPTION BASED IN CONSTRUCTION MANAGEMENT SOFTWARE MARKET, BY PRICING MODULE, 2020-2029 (USD MILLION)
TABLE 74 CHINA CONSTRUCTION MANAGEMENT SOFTWARE MARKET, BY APPLICATION, 2020-2029 (USD MILLION)
TABLE 75 CHINA FINANCIAL MANAGEMENT IN CONSTRUCTION MANAGEMENT SOFTWARE MARKET, BY TYPE, 2020-2029 (USD MILLION)
TABLE 76 CHINA PROJECT MANAGEMENT IN CONSTRUCTION MANAGEMENT SOFTWARE MARKET, BY TYPE, 2020-2029 (USD MILLION)
TABLE 77 CHINA PRECONSTRUCTION IN CONSTRUCTION MANAGEMENT SOFTWARE MARKET, BY TYPE, 2020-2029 (USD MILLION)
TABLE 78 CHINA CONSTRUCTION MANAGEMENT SOFTWARE MARKET, BY VERTICAL, 2020-2029 (USD MILLION)
TABLE 79 CHINA RESIDENTIAL CONSTRUCTION CONTRACTORS IN CONSTRUCTION MANAGEMENT SOFTWARE MARKET, BY TYPE, 2020-2029 (USD MILLION)
TABLE 80 CHINA RESIDENTIAL CONSTRUCTION CONTRACTORS IN CONSTRUCTION MANAGEMENT SOFTWARE MARKET, BY DEPLOYMENT, 2020-2029 (USD MILLION)
TABLE 81 CHINA COMMERCIAL CONSTRUCTION CONTRACTORS IN CONSTRUCTION MANAGEMENT SOFTWARE MARKET, BY DEPLOYMENT, 2020-2029 (USD MILLION)
TABLE 82 CHINA LANDSCAPING CONTRACTORS IN CONSTRUCTION MANAGEMENT SOFTWARE MARKET, BY DEPLOYMENT, 2020-2029 (USD MILLION)
TABLE 83 CHINA ARCHITECTS IN CONSTRUCTION MANAGEMENT SOFTWARE MARKET, BY DEPLOYMENT, 2020-2029 (USD MILLION)
TABLE 84 CHINA ENGINEERS IN CONSTRUCTION MANAGEMENT SOFTWARE MARKET, BY DEPLOYMENT, 2020-2029 (USD MILLION)
TABLE 85 CHINA CONSTRUCTION MANAGERS IN CONSTRUCTION MANAGEMENT SOFTWARE MARKET, BY DEPLOYMENT, 2020-2029 (USD MILLION)
TABLE 86 CHINA OTHERS IN CONSTRUCTION MANAGEMENT SOFTWARE MARKET, BY DEPLOYMENT, 2020-2029 (USD MILLION)
TABLE 87 JAPAN CONSTRUCTION MANAGEMENT SOFTWARE MARKET, BY OFFERING, 2020-2029 (USD MILLION)
TABLE 88 JAPAN SOLUTION IN CONSTRUCTION MANAGEMENT SOFTWARE MARKET, BY OFFERING, 2020-2029 (USD MILLION)
TABLE 89 JAPAN SERVICES IN CONSTRUCTION MANAGEMENT SOFTWARE MARKET, BY OFFERING, 2020-2029 (USD MILLION)
TABLE 90 JAPAN PROFESSIONAL SERVICES IN CONSTRUCTION MANAGEMENT SOFTWARE MARKET, BY OFFERING, 2020-2029 (USD MILLION)
TABLE 91 JAPAN CONSTRUCTION MANAGEMENT SOFTWARE MARKET, BY DEVICE TYPE, 2020-2029 (USD MILLION)
TABLE 92 JAPAN COMPUTER IN CONSTRUCTION MANAGEMENT SOFTWARE MARKET, BY TYPE, 2020-2029 (USD MILLION)
TABLE 93 JAPAN SMARTPHONE IN CONSTRUCTION MANAGEMENT SOFTWARE MARKET, BY TYPE, 2020-2029 (USD MILLION)
TABLE 94 JAPAN CONSTRUCTION MANAGEMENT SOFTWARE MARKET, BY PRICING MODULE, 2020-2029 (USD MILLION)
TABLE 95 JAPAN SUBSCRIPTION BASED IN CONSTRUCTION MANAGEMENT SOFTWARE MARKET, BY PRICING MODULE, 2020-2029 (USD MILLION)
TABLE 96 JAPAN CONSTRUCTION MANAGEMENT SOFTWARE MARKET, BY APPLICATION, 2020-2029 (USD MILLION)
TABLE 97 JAPAN FINANCIAL MANAGEMENT IN CONSTRUCTION MANAGEMENT SOFTWARE MARKET, BY TYPE, 2020-2029 (USD MILLION)
TABLE 98 JAPAN PROJECT MANAGEMENT IN CONSTRUCTION MANAGEMENT SOFTWARE MARKET, BY TYPE, 2020-2029 (USD MILLION)
TABLE 99 JAPAN PRECONSTRUCTION IN CONSTRUCTION MANAGEMENT SOFTWARE MARKET, BY TYPE, 2020-2029 (USD MILLION)
TABLE 100 JAPAN CONSTRUCTION MANAGEMENT SOFTWARE MARKET, BY VERTICAL, 2020-2029 (USD MILLION)
TABLE 101 JAPAN RESIDENTIAL CONSTRUCTION CONTRACTORS IN CONSTRUCTION MANAGEMENT SOFTWARE MARKET, BY TYPE, 2020-2029 (USD MILLION)
TABLE 102 JAPAN RESIDENTIAL CONSTRUCTION CONTRACTORS IN CONSTRUCTION MANAGEMENT SOFTWARE MARKET, BY DEPLOYMENT, 2020-2029 (USD MILLION)
TABLE 103 JAPAN COMMERCIAL CONSTRUCTION CONTRACTORS IN CONSTRUCTION MANAGEMENT SOFTWARE MARKET, BY DEPLOYMENT, 2020-2029 (USD MILLION)
TABLE 104 JAPAN LANDSCAPING CONTRACTORS IN CONSTRUCTION MANAGEMENT SOFTWARE MARKET, BY DEPLOYMENT, 2020-2029 (USD MILLION)
TABLE 105 JAPAN ARCHITECTS IN CONSTRUCTION MANAGEMENT SOFTWARE MARKET, BY DEPLOYMENT, 2020-2029 (USD MILLION)
TABLE 106 JAPAN ENGINEERS IN CONSTRUCTION MANAGEMENT SOFTWARE MARKET, BY DEPLOYMENT, 2020-2029 (USD MILLION)
TABLE 107 JAPAN CONSTRUCTION MANAGERS IN CONSTRUCTION MANAGEMENT SOFTWARE MARKET, BY DEPLOYMENT, 2020-2029 (USD MILLION)
TABLE 108 JAPAN OTHERS IN CONSTRUCTION MANAGEMENT SOFTWARE MARKET, BY DEPLOYMENT, 2020-2029 (USD MILLION)
TABLE 109 SOUTH KOREA CONSTRUCTION MANAGEMENT SOFTWARE MARKET, BY OFFERING, 2020-2029 (USD MILLION)
TABLE 110 SOUTH KOREA SOLUTION IN CONSTRUCTION MANAGEMENT SOFTWARE MARKET, BY OFFERING, 2020-2029 (USD MILLION)
TABLE 111 SOUTH KOREA SERVICES IN CONSTRUCTION MANAGEMENT SOFTWARE MARKET, BY OFFERING, 2020-2029 (USD MILLION)
TABLE 112 SOUTH KOREA PROFESSIONAL SERVICES IN CONSTRUCTION MANAGEMENT SOFTWARE MARKET, BY OFFERING, 2020-2029 (USD MILLION)
TABLE 113 SOUTH KOREA CONSTRUCTION MANAGEMENT SOFTWARE MARKET, BY DEVICE TYPE, 2020-2029 (USD MILLION)
TABLE 114 SOUTH KOREA COMPUTER IN CONSTRUCTION MANAGEMENT SOFTWARE MARKET, BY TYPE, 2020-2029 (USD MILLION)
TABLE 115 SOUTH KOREA SMARTPHONE IN CONSTRUCTION MANAGEMENT SOFTWARE MARKET, BY TYPE, 2020-2029 (USD MILLION)
TABLE 116 SOUTH KOREA CONSTRUCTION MANAGEMENT SOFTWARE MARKET, BY PRICING MODULE, 2020-2029 (USD MILLION)
TABLE 117 SOUTH KOREA SUBSCRIPTION BASED IN CONSTRUCTION MANAGEMENT SOFTWARE MARKET, BY PRICING MODULE, 2020-2029 (USD MILLION)
TABLE 118 SOUTH KOREA CONSTRUCTION MANAGEMENT SOFTWARE MARKET, BY APPLICATION, 2020-2029 (USD MILLION)
TABLE 119 SOUTH KOREA FINANCIAL MANAGEMENT IN CONSTRUCTION MANAGEMENT SOFTWARE MARKET, BY TYPE, 2020-2029 (USD MILLION)
TABLE 120 SOUTH KOREA PROJECT MANAGEMENT IN CONSTRUCTION MANAGEMENT SOFTWARE MARKET, BY TYPE, 2020-2029 (USD MILLION)
TABLE 121 SOUTH KOREA PRECONSTRUCTION IN CONSTRUCTION MANAGEMENT SOFTWARE MARKET, BY TYPE, 2020-2029 (USD MILLION)
TABLE 122 SOUTH KOREA CONSTRUCTION MANAGEMENT SOFTWARE MARKET, BY VERTICAL, 2020-2029 (USD MILLION)
TABLE 123 SOUTH KOREA RESIDENTIAL CONSTRUCTION CONTRACTORS IN CONSTRUCTION MANAGEMENT SOFTWARE MARKET, BY TYPE, 2020-2029 (USD MILLION)
TABLE 124 SOUTH KOREA RESIDENTIAL CONSTRUCTION CONTRACTORS IN CONSTRUCTION MANAGEMENT SOFTWARE MARKET, BY DEPLOYMENT, 2020-2029 (USD MILLION)
TABLE 125 SOUTH KOREA COMMERCIAL CONSTRUCTION CONTRACTORS IN CONSTRUCTION MANAGEMENT SOFTWARE MARKET, BY DEPLOYMENT, 2020-2029 (USD MILLION)
TABLE 126 SOUTH KOREA LANDSCAPING CONTRACTORS IN CONSTRUCTION MANAGEMENT SOFTWARE MARKET, BY DEPLOYMENT, 2020-2029 (USD MILLION)
TABLE 127 SOUTH KOREA ARCHITECTS IN CONSTRUCTION MANAGEMENT SOFTWARE MARKET, BY DEPLOYMENT, 2020-2029 (USD MILLION)
TABLE 128 SOUTH KOREA ENGINEERS IN CONSTRUCTION MANAGEMENT SOFTWARE MARKET, BY DEPLOYMENT, 2020-2029 (USD MILLION)
TABLE 129 SOUTH KOREA CONSTRUCTION MANAGERS IN CONSTRUCTION MANAGEMENT SOFTWARE MARKET, BY DEPLOYMENT, 2020-2029 (USD MILLION)
TABLE 130 SOUTH KOREA OTHERS IN CONSTRUCTION MANAGEMENT SOFTWARE MARKET, BY DEPLOYMENT, 2020-2029 (USD MILLION)
TABLE 131 INDIA CONSTRUCTION MANAGEMENT SOFTWARE MARKET, BY OFFERING, 2020-2029 (USD MILLION)
TABLE 132 INDIA SOLUTION IN CONSTRUCTION MANAGEMENT SOFTWARE MARKET, BY OFFERING, 2020-2029 (USD MILLION)
TABLE 133 INDIA SERVICES IN CONSTRUCTION MANAGEMENT SOFTWARE MARKET, BY OFFERING, 2020-2029 (USD MILLION)
TABLE 134 INDIA PROFESSIONAL SERVICES IN CONSTRUCTION MANAGEMENT SOFTWARE MARKET, BY OFFERING, 2020-2029 (USD MILLION)
TABLE 135 INDIA CONSTRUCTION MANAGEMENT SOFTWARE MARKET, BY DEVICE TYPE, 2020-2029 (USD MILLION)
TABLE 136 INDIA COMPUTER IN CONSTRUCTION MANAGEMENT SOFTWARE MARKET, BY TYPE, 2020-2029 (USD MILLION)
TABLE 137 INDIA SMARTPHONE IN CONSTRUCTION MANAGEMENT SOFTWARE MARKET, BY TYPE, 2020-2029 (USD MILLION)
TABLE 138 INDIA CONSTRUCTION MANAGEMENT SOFTWARE MARKET, BY PRICING MODULE, 2020-2029 (USD MILLION)
TABLE 139 INDIA SUBSCRIPTION BASED IN CONSTRUCTION MANAGEMENT SOFTWARE MARKET, BY PRICING MODULE, 2020-2029 (USD MILLION)
TABLE 140 INDIA CONSTRUCTION MANAGEMENT SOFTWARE MARKET, BY APPLICATION, 2020-2029 (USD MILLION)
TABLE 141 INDIA FINANCIAL MANAGEMENT IN CONSTRUCTION MANAGEMENT SOFTWARE MARKET, BY TYPE, 2020-2029 (USD MILLION)
TABLE 142 INDIA PROJECT MANAGEMENT IN CONSTRUCTION MANAGEMENT SOFTWARE MARKET, BY TYPE, 2020-2029 (USD MILLION)
TABLE 143 INDIA PRECONSTRUCTION IN CONSTRUCTION MANAGEMENT SOFTWARE MARKET, BY TYPE, 2020-2029 (USD MILLION)
TABLE 144 INDIA CONSTRUCTION MANAGEMENT SOFTWARE MARKET, BY VERTICAL, 2020-2029 (USD MILLION)
TABLE 145 INDIA RESIDENTIAL CONSTRUCTION CONTRACTORS IN CONSTRUCTION MANAGEMENT SOFTWARE MARKET, BY TYPE, 2020-2029 (USD MILLION)
TABLE 146 INDIA RESIDENTIAL CONSTRUCTION CONTRACTORS IN CONSTRUCTION MANAGEMENT SOFTWARE MARKET, BY DEPLOYMENT, 2020-2029 (USD MILLION)
TABLE 147 INDIA COMMERCIAL CONSTRUCTION CONTRACTORS IN CONSTRUCTION MANAGEMENT SOFTWARE MARKET, BY DEPLOYMENT, 2020-2029 (USD MILLION)
TABLE 148 INDIA LANDSCAPING CONTRACTORS IN CONSTRUCTION MANAGEMENT SOFTWARE MARKET, BY DEPLOYMENT, 2020-2029 (USD MILLION)
TABLE 149 INDIA ARCHITECTS IN CONSTRUCTION MANAGEMENT SOFTWARE MARKET, BY DEPLOYMENT, 2020-2029 (USD MILLION)
TABLE 150 INDIA ENGINEERS IN CONSTRUCTION MANAGEMENT SOFTWARE MARKET, BY DEPLOYMENT, 2020-2029 (USD MILLION)
TABLE 151 INDIA CONSTRUCTION MANAGERS IN CONSTRUCTION MANAGEMENT SOFTWARE MARKET, BY DEPLOYMENT, 2020-2029 (USD MILLION)
TABLE 152 INDIA OTHERS IN CONSTRUCTION MANAGEMENT SOFTWARE MARKET, BY DEPLOYMENT, 2020-2029 (USD MILLION)
TABLE 153 AUSTRALIA CONSTRUCTION MANAGEMENT SOFTWARE MARKET, BY OFFERING, 2020-2029 (USD MILLION)
TABLE 154 AUSTRALIA SOLUTION IN CONSTRUCTION MANAGEMENT SOFTWARE MARKET, BY OFFERING, 2020-2029 (USD MILLION)
TABLE 155 AUSTRALIA SERVICES IN CONSTRUCTION MANAGEMENT SOFTWARE MARKET, BY OFFERING, 2020-2029 (USD MILLION)
TABLE 156 AUSTRALIA PROFESSIONAL SERVICES IN CONSTRUCTION MANAGEMENT SOFTWARE MARKET, BY OFFERING, 2020-2029 (USD MILLION)
TABLE 157 AUSTRALIA CONSTRUCTION MANAGEMENT SOFTWARE MARKET, BY DEVICE TYPE, 2020-2029 (USD MILLION)
TABLE 158 AUSTRALIA COMPUTER IN CONSTRUCTION MANAGEMENT SOFTWARE MARKET, BY TYPE, 2020-2029 (USD MILLION)
TABLE 159 AUSTRALIA SMARTPHONE IN CONSTRUCTION MANAGEMENT SOFTWARE MARKET, BY TYPE, 2020-2029 (USD MILLION)
TABLE 160 AUSTRALIA CONSTRUCTION MANAGEMENT SOFTWARE MARKET, BY PRICING MODULE, 2020-2029 (USD MILLION)
TABLE 161 AUSTRALIA SUBSCRIPTION BASED IN CONSTRUCTION MANAGEMENT SOFTWARE MARKET, BY PRICING MODULE, 2020-2029 (USD MILLION)
TABLE 162 AUSTRALIA CONSTRUCTION MANAGEMENT SOFTWARE MARKET, BY APPLICATION, 2020-2029 (USD MILLION)
TABLE 163 AUSTRALIA FINANCIAL MANAGEMENT IN CONSTRUCTION MANAGEMENT SOFTWARE MARKET, BY TYPE, 2020-2029 (USD MILLION)
TABLE 164 AUSTRALIA PROJECT MANAGEMENT IN CONSTRUCTION MANAGEMENT SOFTWARE MARKET, BY TYPE, 2020-2029 (USD MILLION)
TABLE 165 AUSTRALIA PRECONSTRUCTION IN CONSTRUCTION MANAGEMENT SOFTWARE MARKET, BY TYPE, 2020-2029 (USD MILLION)
TABLE 166 AUSTRALIA CONSTRUCTION MANAGEMENT SOFTWARE MARKET, BY VERTICAL, 2020-2029 (USD MILLION)
TABLE 167 AUSTRALIA RESIDENTIAL CONSTRUCTION CONTRACTORS IN CONSTRUCTION MANAGEMENT SOFTWARE MARKET, BY TYPE, 2020-2029 (USD MILLION)
TABLE 168 AUSTRALIA RESIDENTIAL CONSTRUCTION CONTRACTORS IN CONSTRUCTION MANAGEMENT SOFTWARE MARKET, BY DEPLOYMENT, 2020-2029 (USD MILLION)
TABLE 169 AUSTRALIA COMMERCIAL CONSTRUCTION CONTRACTORS IN CONSTRUCTION MANAGEMENT SOFTWARE MARKET, BY DEPLOYMENT, 2020-2029 (USD MILLION)
TABLE 170 AUSTRALIA LANDSCAPING CONTRACTORS IN CONSTRUCTION MANAGEMENT SOFTWARE MARKET, BY DEPLOYMENT, 2020-2029 (USD MILLION)
TABLE 171 AUSTRALIA ARCHITECTS IN CONSTRUCTION MANAGEMENT SOFTWARE MARKET, BY DEPLOYMENT, 2020-2029 (USD MILLION)
TABLE 172 AUSTRALIA ENGINEERS IN CONSTRUCTION MANAGEMENT SOFTWARE MARKET, BY DEPLOYMENT, 2020-2029 (USD MILLION)
TABLE 173 AUSTRALIA CONSTRUCTION MANAGERS IN CONSTRUCTION MANAGEMENT SOFTWARE MARKET, BY DEPLOYMENT, 2020-2029 (USD MILLION)
TABLE 174 AUSTRALIA OTHERS IN CONSTRUCTION MANAGEMENT SOFTWARE MARKET, BY DEPLOYMENT, 2020-2029 (USD MILLION)
TABLE 175 SINGAPORE CONSTRUCTION MANAGEMENT SOFTWARE MARKET, BY OFFERING, 2020-2029 (USD MILLION)
TABLE 176 SINGAPORE SOLUTION IN CONSTRUCTION MANAGEMENT SOFTWARE MARKET, BY OFFERING, 2020-2029 (USD MILLION)
TABLE 177 SINGAPORE SERVICES IN CONSTRUCTION MANAGEMENT SOFTWARE MARKET, BY OFFERING, 2020-2029 (USD MILLION)
TABLE 178 SINGAPORE PROFESSIONAL SERVICES IN CONSTRUCTION MANAGEMENT SOFTWARE MARKET, BY OFFERING, 2020-2029 (USD MILLION)
TABLE 179 SINGAPORE CONSTRUCTION MANAGEMENT SOFTWARE MARKET, BY DEVICE TYPE, 2020-2029 (USD MILLION)
TABLE 180 SINGAPORE COMPUTER IN CONSTRUCTION MANAGEMENT SOFTWARE MARKET, BY TYPE, 2020-2029 (USD MILLION)
TABLE 181 SINGAPORE SMARTPHONE IN CONSTRUCTION MANAGEMENT SOFTWARE MARKET, BY TYPE, 2020-2029 (USD MILLION)
TABLE 182 SINGAPORE CONSTRUCTION MANAGEMENT SOFTWARE MARKET, BY PRICING MODULE, 2020-2029 (USD MILLION)
TABLE 183 SINGAPORE SUBSCRIPTION BASED IN CONSTRUCTION MANAGEMENT SOFTWARE MARKET, BY PRICING MODULE, 2020-2029 (USD MILLION)
TABLE 184 SINGAPORE CONSTRUCTION MANAGEMENT SOFTWARE MARKET, BY APPLICATION, 2020-2029 (USD MILLION)
TABLE 185 SINGAPORE FINANCIAL MANAGEMENT IN CONSTRUCTION MANAGEMENT SOFTWARE MARKET, BY TYPE, 2020-2029 (USD MILLION)
TABLE 186 SINGAPORE PROJECT MANAGEMENT IN CONSTRUCTION MANAGEMENT SOFTWARE MARKET, BY TYPE, 2020-2029 (USD MILLION)
TABLE 187 SINGAPORE PRECONSTRUCTION IN CONSTRUCTION MANAGEMENT SOFTWARE MARKET, BY TYPE, 2020-2029 (USD MILLION)
TABLE 188 SINGAPORE CONSTRUCTION MANAGEMENT SOFTWARE MARKET, BY VERTICAL, 2020-2029 (USD MILLION)
TABLE 189 SINGAPORE RESIDENTIAL CONSTRUCTION CONTRACTORS IN CONSTRUCTION MANAGEMENT SOFTWARE MARKET, BY TYPE, 2020-2029 (USD MILLION)
TABLE 190 SINGAPORE RESIDENTIAL CONSTRUCTION CONTRACTORS IN CONSTRUCTION MANAGEMENT SOFTWARE MARKET, BY DEPLOYMENT, 2020-2029 (USD MILLION)
TABLE 191 SINGAPORE COMMERCIAL CONSTRUCTION CONTRACTORS IN CONSTRUCTION MANAGEMENT SOFTWARE MARKET, BY DEPLOYMENT, 2020-2029 (USD MILLION)
TABLE 192 SINGAPORE LANDSCAPING CONTRACTORS IN CONSTRUCTION MANAGEMENT SOFTWARE MARKET, BY DEPLOYMENT, 2020-2029 (USD MILLION)
TABLE 193 SINGAPORE ARCHITECTS IN CONSTRUCTION MANAGEMENT SOFTWARE MARKET, BY DEPLOYMENT, 2020-2029 (USD MILLION)
TABLE 194 SINGAPORE ENGINEERS IN CONSTRUCTION MANAGEMENT SOFTWARE MARKET, BY DEPLOYMENT, 2020-2029 (USD MILLION)
TABLE 195 SINGAPORE CONSTRUCTION MANAGERS IN CONSTRUCTION MANAGEMENT SOFTWARE MARKET, BY DEPLOYMENT, 2020-2029 (USD MILLION)
TABLE 196 SINGAPORE OTHERS IN CONSTRUCTION MANAGEMENT SOFTWARE MARKET, BY DEPLOYMENT, 2020-2029 (USD MILLION)
TABLE 197 THAILAND CONSTRUCTION MANAGEMENT SOFTWARE MARKET, BY OFFERING, 2020-2029 (USD MILLION)
TABLE 198 THAILAND SOLUTION IN CONSTRUCTION MANAGEMENT SOFTWARE MARKET, BY OFFERING, 2020-2029 (USD MILLION)
TABLE 199 THAILAND SERVICES IN CONSTRUCTION MANAGEMENT SOFTWARE MARKET, BY OFFERING, 2020-2029 (USD MILLION)
TABLE 200 THAILAND PROFESSIONAL SERVICES IN CONSTRUCTION MANAGEMENT SOFTWARE MARKET, BY OFFERING, 2020-2029 (USD MILLION)
TABLE 201 THAILAND CONSTRUCTION MANAGEMENT SOFTWARE MARKET, BY DEVICE TYPE, 2020-2029 (USD MILLION)
TABLE 202 THAILAND COMPUTER IN CONSTRUCTION MANAGEMENT SOFTWARE MARKET, BY TYPE, 2020-2029 (USD MILLION)
TABLE 203 THAILAND SMARTPHONE IN CONSTRUCTION MANAGEMENT SOFTWARE MARKET, BY TYPE, 2020-2029 (USD MILLION)
TABLE 204 THAILAND CONSTRUCTION MANAGEMENT SOFTWARE MARKET, BY PRICING MODULE, 2020-2029 (USD MILLION)
TABLE 205 THAILAND SUBSCRIPTION BASED IN CONSTRUCTION MANAGEMENT SOFTWARE MARKET, BY PRICING MODULE, 2020-2029 (USD MILLION)
TABLE 206 THAILAND CONSTRUCTION MANAGEMENT SOFTWARE MARKET, BY APPLICATION, 2020-2029 (USD MILLION)
TABLE 207 THAILAND FINANCIAL MANAGEMENT IN CONSTRUCTION MANAGEMENT SOFTWARE MARKET, BY TYPE, 2020-2029 (USD MILLION)
TABLE 208 THAILAND PROJECT MANAGEMENT IN CONSTRUCTION MANAGEMENT SOFTWARE MARKET, BY TYPE, 2020-2029 (USD MILLION)
TABLE 209 THAILAND PRECONSTRUCTION IN CONSTRUCTION MANAGEMENT SOFTWARE MARKET, BY TYPE, 2020-2029 (USD MILLION)
TABLE 210 THAILAND CONSTRUCTION MANAGEMENT SOFTWARE MARKET, BY VERTICAL, 2020-2029 (USD MILLION)
TABLE 211 THAILAND RESIDENTIAL CONSTRUCTION CONTRACTORS IN CONSTRUCTION MANAGEMENT SOFTWARE MARKET, BY TYPE, 2020-2029 (USD MILLION)
TABLE 212 THAILAND RESIDENTIAL CONSTRUCTION CONTRACTORS IN CONSTRUCTION MANAGEMENT SOFTWARE MARKET, BY DEPLOYMENT, 2020-2029 (USD MILLION)
TABLE 213 THAILAND COMMERCIAL CONSTRUCTION CONTRACTORS IN CONSTRUCTION MANAGEMENT SOFTWARE MARKET, BY DEPLOYMENT, 2020-2029 (USD MILLION)
TABLE 214 THAILAND LANDSCAPING CONTRACTORS IN CONSTRUCTION MANAGEMENT SOFTWARE MARKET, BY DEPLOYMENT, 2020-2029 (USD MILLION)
TABLE 215 THAILAND ARCHITECTS IN CONSTRUCTION MANAGEMENT SOFTWARE MARKET, BY DEPLOYMENT, 2020-2029 (USD MILLION)
TABLE 216 THAILAND ENGINEERS IN CONSTRUCTION MANAGEMENT SOFTWARE MARKET, BY DEPLOYMENT, 2020-2029 (USD MILLION)
TABLE 217 THAILAND CONSTRUCTION MANAGERS IN CONSTRUCTION MANAGEMENT SOFTWARE MARKET, BY DEPLOYMENT, 2020-2029 (USD MILLION)
TABLE 218 THAILAND OTHERS IN CONSTRUCTION MANAGEMENT SOFTWARE MARKET, BY DEPLOYMENT, 2020-2029 (USD MILLION)
TABLE 219 MALAYSIA CONSTRUCTION MANAGEMENT SOFTWARE MARKET, BY OFFERING, 2020-2029 (USD MILLION)
TABLE 220 MALAYSIA SOLUTION IN CONSTRUCTION MANAGEMENT SOFTWARE MARKET, BY OFFERING, 2020-2029 (USD MILLION)
TABLE 221 MALAYSIA SERVICES IN CONSTRUCTION MANAGEMENT SOFTWARE MARKET, BY OFFERING, 2020-2029 (USD MILLION)
TABLE 222 MALAYSIA PROFESSIONAL SERVICES IN CONSTRUCTION MANAGEMENT SOFTWARE MARKET, BY OFFERING, 2020-2029 (USD MILLION)
TABLE 223 MALAYSIA CONSTRUCTION MANAGEMENT SOFTWARE MARKET, BY DEVICE TYPE, 2020-2029 (USD MILLION)
TABLE 224 MALAYSIA COMPUTER IN CONSTRUCTION MANAGEMENT SOFTWARE MARKET, BY TYPE, 2020-2029 (USD MILLION)
TABLE 225 MALAYSIA SMARTPHONE IN CONSTRUCTION MANAGEMENT SOFTWARE MARKET, BY TYPE, 2020-2029 (USD MILLION)
TABLE 226 MALAYSIA CONSTRUCTION MANAGEMENT SOFTWARE MARKET, BY PRICING MODULE, 2020-2029 (USD MILLION)
TABLE 227 MALAYSIA SUBSCRIPTION BASED IN CONSTRUCTION MANAGEMENT SOFTWARE MARKET, BY PRICING MODULE, 2020-2029 (USD MILLION)
TABLE 228 MALAYSIA CONSTRUCTION MANAGEMENT SOFTWARE MARKET, BY APPLICATION, 2020-2029 (USD MILLION)
TABLE 229 MALAYSIA FINANCIAL MANAGEMENT IN CONSTRUCTION MANAGEMENT SOFTWARE MARKET, BY TYPE, 2020-2029 (USD MILLION)
TABLE 230 MALAYSIA PROJECT MANAGEMENT IN CONSTRUCTION MANAGEMENT SOFTWARE MARKET, BY TYPE, 2020-2029 (USD MILLION)
TABLE 231 MALAYSIA PRECONSTRUCTION IN CONSTRUCTION MANAGEMENT SOFTWARE MARKET, BY TYPE, 2020-2029 (USD MILLION)
TABLE 232 MALAYSIA CONSTRUCTION MANAGEMENT SOFTWARE MARKET, BY VERTICAL, 2020-2029 (USD MILLION)
TABLE 233 MALAYSIA RESIDENTIAL CONSTRUCTION CONTRACTORS IN CONSTRUCTION MANAGEMENT SOFTWARE MARKET, BY TYPE, 2020-2029 (USD MILLION)
TABLE 234 MALAYSIA RESIDENTIAL CONSTRUCTION CONTRACTORS IN CONSTRUCTION MANAGEMENT SOFTWARE MARKET, BY DEPLOYMENT, 2020-2029 (USD MILLION)
TABLE 235 MALAYSIA COMMERCIAL CONSTRUCTION CONTRACTORS IN CONSTRUCTION MANAGEMENT SOFTWARE MARKET, BY DEPLOYMENT, 2020-2029 (USD MILLION)
TABLE 236 MALAYSIA LANDSCAPING CONTRACTORS IN CONSTRUCTION MANAGEMENT SOFTWARE MARKET, BY DEPLOYMENT, 2020-2029 (USD MILLION)
TABLE 237 MALAYSIA ARCHITECTS IN CONSTRUCTION MANAGEMENT SOFTWARE MARKET, BY DEPLOYMENT, 2020-2029 (USD MILLION)
TABLE 238 MALAYSIA ENGINEERS IN CONSTRUCTION MANAGEMENT SOFTWARE MARKET, BY DEPLOYMENT, 2020-2029 (USD MILLION)
TABLE 239 MALAYSIA CONSTRUCTION MANAGERS IN CONSTRUCTION MANAGEMENT SOFTWARE MARKET, BY DEPLOYMENT, 2020-2029 (USD MILLION)
TABLE 240 MALAYSIA OTHERS IN CONSTRUCTION MANAGEMENT SOFTWARE MARKET, BY DEPLOYMENT, 2020-2029 (USD MILLION)
TABLE 241 INDONESIA CONSTRUCTION MANAGEMENT SOFTWARE MARKET, BY OFFERING, 2020-2029 (USD MILLION)
TABLE 242 INDONESIA SOLUTION IN CONSTRUCTION MANAGEMENT SOFTWARE MARKET, BY OFFERING, 2020-2029 (USD MILLION)
TABLE 243 INDONESIA SERVICES IN CONSTRUCTION MANAGEMENT SOFTWARE MARKET, BY OFFERING, 2020-2029 (USD MILLION)
TABLE 244 INDONESIA PROFESSIONAL SERVICES IN CONSTRUCTION MANAGEMENT SOFTWARE MARKET, BY OFFERING, 2020-2029 (USD MILLION)
TABLE 245 INDONESIA CONSTRUCTION MANAGEMENT SOFTWARE MARKET, BY DEVICE TYPE, 2020-2029 (USD MILLION)
TABLE 246 INDONESIA COMPUTER IN CONSTRUCTION MANAGEMENT SOFTWARE MARKET, BY TYPE, 2020-2029 (USD MILLION)
TABLE 247 INDONESIA SMARTPHONE IN CONSTRUCTION MANAGEMENT SOFTWARE MARKET, BY TYPE, 2020-2029 (USD MILLION)
TABLE 248 INDONESIA CONSTRUCTION MANAGEMENT SOFTWARE MARKET, BY PRICING MODULE, 2020-2029 (USD MILLION)
TABLE 249 INDONESIA SUBSCRIPTION BASED IN CONSTRUCTION MANAGEMENT SOFTWARE MARKET, BY PRICING MODULE, 2020-2029 (USD MILLION)
TABLE 250 INDONESIA CONSTRUCTION MANAGEMENT SOFTWARE MARKET, BY APPLICATION, 2020-2029 (USD MILLION)
TABLE 251 INDONESIA FINANCIAL MANAGEMENT IN CONSTRUCTION MANAGEMENT SOFTWARE MARKET, BY TYPE, 2020-2029 (USD MILLION)
TABLE 252 INDONESIA PROJECT MANAGEMENT IN CONSTRUCTION MANAGEMENT SOFTWARE MARKET, BY TYPE, 2020-2029 (USD MILLION)
TABLE 253 INDONESIA PRECONSTRUCTION IN CONSTRUCTION MANAGEMENT SOFTWARE MARKET, BY TYPE, 2020-2029 (USD MILLION)
TABLE 254 INDONESIA CONSTRUCTION MANAGEMENT SOFTWARE MARKET, BY VERTICAL, 2020-2029 (USD MILLION)
TABLE 255 INDONESIA RESIDENTIAL CONSTRUCTION CONTRACTORS IN CONSTRUCTION MANAGEMENT SOFTWARE MARKET, BY TYPE, 2020-2029 (USD MILLION)
TABLE 256 INDONESIA RESIDENTIAL CONSTRUCTION CONTRACTORS IN CONSTRUCTION MANAGEMENT SOFTWARE MARKET, BY DEPLOYMENT, 2020-2029 (USD MILLION)
TABLE 257 INDONESIA COMMERCIAL CONSTRUCTION CONTRACTORS IN CONSTRUCTION MANAGEMENT SOFTWARE MARKET, BY DEPLOYMENT, 2020-2029 (USD MILLION)
TABLE 258 INDONESIA LANDSCAPING CONTRACTORS IN CONSTRUCTION MANAGEMENT SOFTWARE MARKET, BY DEPLOYMENT, 2020-2029 (USD MILLION)
TABLE 259 INDONESIA ARCHITECTS IN CONSTRUCTION MANAGEMENT SOFTWARE MARKET, BY DEPLOYMENT, 2020-2029 (USD MILLION)
TABLE 260 INDONESIA ENGINEERS IN CONSTRUCTION MANAGEMENT SOFTWARE MARKET, BY DEPLOYMENT, 2020-2029 (USD MILLION)
TABLE 261 INDONESIA CONSTRUCTION MANAGERS IN CONSTRUCTION MANAGEMENT SOFTWARE MARKET, BY DEPLOYMENT, 2020-2029 (USD MILLION)
TABLE 262 INDONESIA OTHERS IN CONSTRUCTION MANAGEMENT SOFTWARE MARKET, BY DEPLOYMENT, 2020-2029 (USD MILLION)
TABLE 263 PHILIPPINES CONSTRUCTION MANAGEMENT SOFTWARE MARKET, BY OFFERING, 2020-2029 (USD MILLION)
TABLE 264 PHILIPPINES SOLUTION IN CONSTRUCTION MANAGEMENT SOFTWARE MARKET, BY OFFERING, 2020-2029 (USD MILLION)
TABLE 265 PHILIPPINES SERVICES IN CONSTRUCTION MANAGEMENT SOFTWARE MARKET, BY OFFERING, 2020-2029 (USD MILLION)
TABLE 266 PHILIPPINES PROFESSIONAL SERVICES IN CONSTRUCTION MANAGEMENT SOFTWARE MARKET, BY OFFERING, 2020-2029 (USD MILLION)
TABLE 267 PHILIPPINES CONSTRUCTION MANAGEMENT SOFTWARE MARKET, BY DEVICE TYPE, 2020-2029 (USD MILLION)
TABLE 268 PHILIPPINES COMPUTER IN CONSTRUCTION MANAGEMENT SOFTWARE MARKET, BY TYPE, 2020-2029 (USD MILLION)
TABLE 269 PHILIPPINES SMARTPHONE IN CONSTRUCTION MANAGEMENT SOFTWARE MARKET, BY TYPE, 2020-2029 (USD MILLION)
TABLE 270 PHILIPPINES CONSTRUCTION MANAGEMENT SOFTWARE MARKET, BY PRICING MODULE, 2020-2029 (USD MILLION)
TABLE 271 PHILIPPINES SUBSCRIPTION BASED IN CONSTRUCTION MANAGEMENT SOFTWARE MARKET, BY PRICING MODULE, 2020-2029 (USD MILLION)
TABLE 272 PHILIPPINES CONSTRUCTION MANAGEMENT SOFTWARE MARKET, BY APPLICATION, 2020-2029 (USD MILLION)
TABLE 273 PHILIPPINES FINANCIAL MANAGEMENT IN CONSTRUCTION MANAGEMENT SOFTWARE MARKET, BY TYPE, 2020-2029 (USD MILLION)
TABLE 274 PHILIPPINES PROJECT MANAGEMENT IN CONSTRUCTION MANAGEMENT SOFTWARE MARKET, BY TYPE, 2020-2029 (USD MILLION)
TABLE 275 PHILIPPINES PRECONSTRUCTION IN CONSTRUCTION MANAGEMENT SOFTWARE MARKET, BY TYPE, 2020-2029 (USD MILLION)
TABLE 276 PHILIPPINES CONSTRUCTION MANAGEMENT SOFTWARE MARKET, BY VERTICAL, 2020-2029 (USD MILLION)
TABLE 277 PHILIPPINES RESIDENTIAL CONSTRUCTION CONTRACTORS IN CONSTRUCTION MANAGEMENT SOFTWARE MARKET, BY TYPE, 2020-2029 (USD MILLION)
TABLE 278 PHILIPPINES RESIDENTIAL CONSTRUCTION CONTRACTORS IN CONSTRUCTION MANAGEMENT SOFTWARE MARKET, BY DEPLOYMENT, 2020-2029 (USD MILLION)
TABLE 279 PHILIPPINES COMMERCIAL CONSTRUCTION CONTRACTORS IN CONSTRUCTION MANAGEMENT SOFTWARE MARKET, BY DEPLOYMENT, 2020-2029 (USD MILLION)
TABLE 280 PHILIPPINES LANDSCAPING CONTRACTORS IN CONSTRUCTION MANAGEMENT SOFTWARE MARKET, BY DEPLOYMENT, 2020-2029 (USD MILLION)
TABLE 281 PHILIPPINES ARCHITECTS IN CONSTRUCTION MANAGEMENT SOFTWARE MARKET, BY DEPLOYMENT, 2020-2029 (USD MILLION)
TABLE 282 PHILIPPINES ENGINEERS IN CONSTRUCTION MANAGEMENT SOFTWARE MARKET, BY DEPLOYMENT, 2020-2029 (USD MILLION)
TABLE 283 PHILIPPINES CONSTRUCTION MANAGERS IN CONSTRUCTION MANAGEMENT SOFTWARE MARKET, BY DEPLOYMENT, 2020-2029 (USD MILLION)
TABLE 284 PHILIPPINES OTHERS IN CONSTRUCTION MANAGEMENT SOFTWARE MARKET, BY DEPLOYMENT, 2020-2029 (USD MILLION)
TABLE 285 REST OF ASIA-PACIFIC CONSTRUCTION MANAGEMENT SOFTWARE MARKET, BY OFFERING, 2020-2029 (USD MILLION)
Lista de figuras
FIGURE 1 ASIA PACIFIC CONSTRUCTION MANAGEMENT SOFTWARE MARKET: SEGMENTATION
FIGURE 2 ASIA PACIFIC CONSTRUCTION MANAGEMENT SOFTWARE MARKET: DATA TRIANGULATION
FIGURE 3 ASIA PACIFIC CONSTRUCTION MANAGEMENT SOFTWARE MARKET: DROC ANALYSIS
FIGURE 4 ASIA PACIFIC CONSTRUCTION MANAGEMENT SOFTWARE MARKET: ASIA PACIFIC VS REGIONAL MARKET ANALYSIS
FIGURE 5 ASIA PACIFIC CONSTRUCTION MANAGEMENT SOFTWARE MARKET: COMPANY RESEARCH ANALYSIS
FIGURE 6 ASIA PACIFIC CONSTRUCTION MANAGEMENT SOFTWARE MARKET: INTERVIEW DEMOGRAPHICS
FIGURE 7 ASIA PACIFIC CONSTRUCTION MANAGEMENT SOFTWARE MARKET: DBMR MARKET POSITION GRID
FIGURE 8 ASIA PACIFIC CONSTRUCTION MANAGEMENT SOFTWARE MARKET: VENDOR SHARE ANALYSIS
FIGURE 9 ASIA PACIFIC CONSTRUCTION MANAGEMENT SOFTWARE MARKET: MARKET APPLICATION COVERAGE GRID
FIGURE 10 ASIA PACIFIC CONSTRUCTION MANAGEMENT SOFTWARE MARKET: SEGMENTATION
FIGURE 11 RISING DEMAND FOR URBAN INFRASTRUCTURE IS EXPECTED TO DRIVE THE ASIA PACIFIC CONSTRUCTION MANAGEMENT SOFTWARE MARKET IN THE FORECAST PERIOD OF 2022 TO 2029
FIGURE 12 SOLUTION SEGMENT IS EXPECTED TO ACCOUNT FOR THE LARGEST SHARE OF THE ASIA PACIFIC CONSTRUCTION MANAGEMENT SOFTWARE MARKET IN 2022 & 2029
FIGURE 13 NORTH AMERICA IS EXPECTED TO DOMINATE AND ASIA-PACIFIC IS THE FASTEST-GROWING REGION IN THE ASIA PACIFIC CONSTRUCTION MANAGEMENT SOFTWARE MARKET IN THE FORECAST PERIOD OF 2022 TO 2029
FIGURE 14 DRIVERS, RESTRAINTS, OPPORTUNITIES, AND CHALLENGES OF THE ASIA PACIFIC CONSTRUCTION MANAGEMENT SOFTWARE MARKET
FIGURE 15 URBAN POPULATION (% OF THE TOTAL POPULATION) – U. S.
FIGURE 16 GROWING IMPORTANCE OF LEAN MANAGEMENT TO REDUCE OPERATING COSTS THROUGH THE ADOPTION OF SOFTWARE
FIGURE 17 MOST-USED MOBILE DEVICES ON CONSTRUCTION SITES
FIGURE 18 ASIA PACIFIC CONSTRUCTION MANAGEMENT SOFTWARE MARKET: BY OFFERING, 2021
FIGURE 19 ASIA PACIFIC CONSTRUCTION MANAGEMENT SOFTWARE MARKET: BY DEVICE TYPE, 2021
FIGURE 20 ASIA PACIFIC CONSTRUCTION MANAGEMENT SOFTWARE MARKET: BY PRICING MODULE, 2021
FIGURE 21 ASIA PACIFIC CONSTRUCTION MANAGEMENT SOFTWARE MARKET: BY APPLICATION, 2021
FIGURE 22 ASIA PACIFIC CONSTRUCTION MANAGEMENT SOFTWARE MARKET: BY VERTICAL, 2021
FIGURE 23 ASIA-PACIFIC CONSTRUCTION MANAGEMENT SOFTWARE MARKET: SNAPSHOT (2021)
FIGURE 24 ASIA-PACIFIC CONSTRUCTION MANAGEMENT SOFTWARE MARKET: BY COUNTRY (2021)
FIGURE 25 ASIA-PACIFIC CONSTRUCTION MANAGEMENT SOFTWARE MARKET: BY COUNTRY (2022 & 2029)
FIGURE 26 ASIA-PACIFIC CONSTRUCTION MANAGEMENT SOFTWARE MARKET: BY COUNTRY (2021 & 2029)
FIGURE 27 ASIA-PACIFIC CONSTRUCTION MANAGEMENT SOFTWARE MARKET: BY OFFERING (2022 - 2029)
FIGURE 28 ASIA PACIFIC CONSTRUCTION MANAGEMENT SOFTWARE MARKET: COMPANY SHARE 2021 (%)
Metodología de investigación
La recopilación de datos y el análisis del año base se realizan utilizando módulos de recopilación de datos con muestras de gran tamaño. La etapa incluye la obtención de información de mercado o datos relacionados a través de varias fuentes y estrategias. Incluye el examen y la planificación de todos los datos adquiridos del pasado con antelación. Asimismo, abarca el examen de las inconsistencias de información observadas en diferentes fuentes de información. Los datos de mercado se analizan y estiman utilizando modelos estadísticos y coherentes de mercado. Además, el análisis de la participación de mercado y el análisis de tendencias clave son los principales factores de éxito en el informe de mercado. Para obtener más información, solicite una llamada de un analista o envíe su consulta.
La metodología de investigación clave utilizada por el equipo de investigación de DBMR es la triangulación de datos, que implica la extracción de datos, el análisis del impacto de las variables de datos en el mercado y la validación primaria (experto en la industria). Los modelos de datos incluyen cuadrícula de posicionamiento de proveedores, análisis de línea de tiempo de mercado, descripción general y guía del mercado, cuadrícula de posicionamiento de la empresa, análisis de patentes, análisis de precios, análisis de participación de mercado de la empresa, estándares de medición, análisis global versus regional y de participación de proveedores. Para obtener más información sobre la metodología de investigación, envíe una consulta para hablar con nuestros expertos de la industria.
Personalización disponible
Data Bridge Market Research es líder en investigación formativa avanzada. Nos enorgullecemos de brindar servicios a nuestros clientes existentes y nuevos con datos y análisis que coinciden y se adaptan a sus objetivos. El informe se puede personalizar para incluir análisis de tendencias de precios de marcas objetivo, comprensión del mercado de países adicionales (solicite la lista de países), datos de resultados de ensayos clínicos, revisión de literatura, análisis de mercado renovado y base de productos. El análisis de mercado de competidores objetivo se puede analizar desde análisis basados en tecnología hasta estrategias de cartera de mercado. Podemos agregar tantos competidores sobre los que necesite datos en el formato y estilo de datos que esté buscando. Nuestro equipo de analistas también puede proporcionarle datos en archivos de Excel sin procesar, tablas dinámicas (libro de datos) o puede ayudarlo a crear presentaciones a partir de los conjuntos de datos disponibles en el informe.

