

Asia Pacific Composite Bearings Market
Tamaño del mercado en miles de millones de dólares
Tasa de crecimiento anual compuesta (CAGR) :
% 
 USD
2.18 Billion
USD
3.69 Billion
2025
2033
USD
2.18 Billion
USD
3.69 Billion
2025
2033
| 2026 –2033 | |
| USD 2.18 Billion | |
| USD 3.69 Billion | |
| % | |
|
Segmentación del mercado de cojinetes compuestos en Asia-Pacífico, por tipo de producto (matriz de fibra y matriz metálica), material (compuesto de politetrafluoroetileno [PTFE] y compuesto de polioximetileno [POM]), forma (casquillos cilíndricos, casquillos con brida, placas deslizantes, arandelas de empuje y arandelas con brida), canal de distribución (presencial y en línea), aplicación (construcción y minería, automoción, aeroespacial, agricultura, marina, energías renovables, alimentos y bebidas, equipos de gimnasio, petróleo y gas, industria hidráulica y otros): tendencias y pronóstico de la industria hasta 2033.
¿Cuál es el tamaño y la tasa de crecimiento del mercado de rodamientos compuestos de Asia-Pacífico?
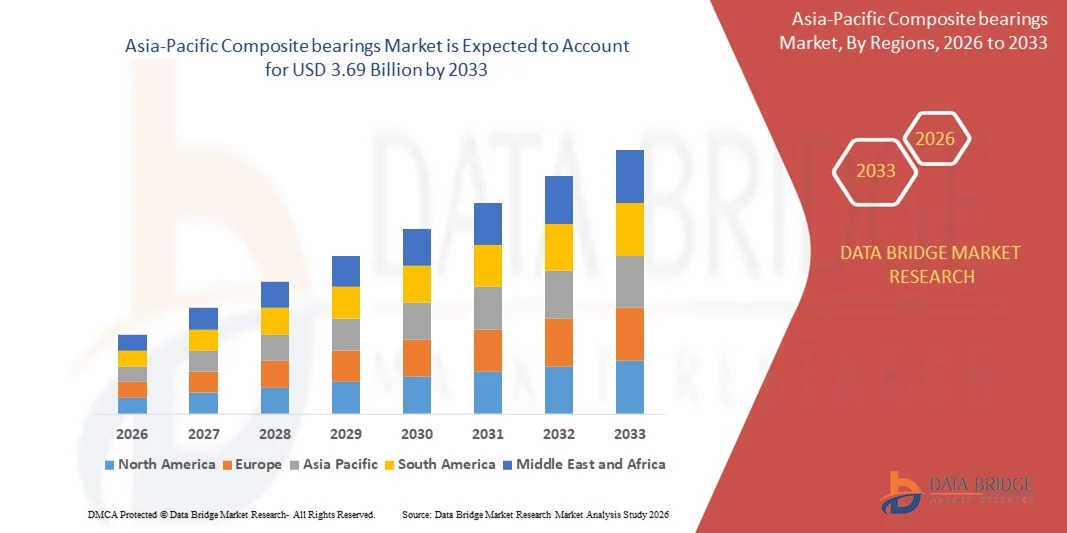
- El tamaño del mercado de rodamientos compuestos de Asia-Pacífico se valoró en USD 2.18 mil millones en 2025 y se espera que alcance los USD 3.69 mil millones para 2033 , con una CAGR del 6,8% durante el período de pronóstico.
- La creciente preferencia por componentes ligeros en diversos sectores industriales impulsa el mercado de rodamientos compuestos. Se prevé que los elevados costes de las materias primas y de producción limiten este mercado durante el período de pronóstico.
- La rápida industrialización en las economías emergentes genera nuevas oportunidades para el mercado de rodamientos compuestos. Alcanzar el nivel deseado de precisión en el diseño y la fabricación supone un reto para este mercado.
¿Cuáles son las principales conclusiones del mercado de rodamientos compuestos?
- La creciente adopción de soluciones de rodamientos livianos, resistentes a la corrosión y sin mantenimiento en aplicaciones automotrices, aeroespaciales, de maquinaria industrial y de energía renovable está creando importantes oportunidades de crecimiento para el mercado de rodamientos compuestos.
- Los fabricantes enfrentan desafíos relacionados con los altos costos de los materiales, los procesos de fabricación complejos y la validación del rendimiento en condiciones operativas extremas, lo que puede restringir el crecimiento del mercado a pesar de la creciente demanda.
- China dominó el mercado de rodamientos compuestos de Asia-Pacífico con una participación estimada en los ingresos del 38,7 % en 2025, impulsada por una rápida industrialización, una sólida fabricación de automóviles y maquinaria, y una alta adopción en los sectores de construcción, energía renovable y equipos pesados.
- Se proyecta que India registre la CAGR más rápida del 8,1 % entre 2026 y 2033, impulsada por el creciente uso de cojinetes compuestos en aplicaciones automotrices, de construcción, de energía renovable y de maquinaria industrial.
- El segmento de compuestos de matriz de fibra dominó el mercado con una participación estimada del 63,1 % en 2025, impulsado por su naturaleza liviana, excelente resistencia a la corrosión, propiedades autolubricantes y alta resistencia al desgaste.
Alcance del informe y segmentación del mercado de rodamientos compuestos
|
Atributos |
Cojinetes compuestos: Perspectivas clave del mercado |
|
Segmentos cubiertos |
|
|
Países cubiertos |
Asia-Pacífico
|
|
Actores clave del mercado |
|
|
Oportunidades de mercado |
|
|
Conjuntos de información de datos de valor añadido |
Además de los conocimientos sobre escenarios de mercado como valor de mercado, tasa de crecimiento, segmentación, cobertura geográfica y actores principales, los informes de mercado seleccionados por Data Bridge Market Research también incluyen análisis de expertos en profundidad, análisis de precios, análisis de participación de marca, encuesta de consumidores, análisis demográfico, análisis de la cadena de suministro, análisis de la cadena de valor, descripción general de materias primas/consumibles, criterios de selección de proveedores, análisis PESTLE, análisis de Porter y marco regulatorio. |
¿Cuál es la tendencia clave en el mercado de rodamientos compuestos?
Creciente tendencia hacia rodamientos compuestos ligeros, sin mantenimiento y de alto rendimiento
- El mercado de cojinetes compuestos está experimentando una creciente demanda de soluciones de cojinetes livianos, resistentes a la corrosión y autolubricantes en aplicaciones automotrices, aeroespaciales, de maquinaria industrial y de energía renovable.
- Los fabricantes están desarrollando cada vez más cojinetes compuestos de polímero reforzado con fibra , revestidos con PTFE y de metal-polímero para mejorar la resistencia al desgaste, la capacidad de carga y la vida útil operativa.
- El enfoque creciente en la reducción del mantenimiento, la eficiencia energética y la confiabilidad del equipo está acelerando la adopción de rodamientos compuestos en entornos operativos hostiles y de alta carga.
- Por ejemplo, empresas como SKF, Schaeffler, Trelleborg, GGB y RBC Bearings están ampliando sus carteras de rodamientos compuestos para vehículos eléctricos, turbinas eólicas, automatización industrial y equipos pesados.
- El creciente uso de cojinetes compuestos en vehículos eléctricos, robótica, sistemas aeroespaciales y equipos de manipulación de fluidos está impulsando una expansión sostenida del mercado.
- A medida que las industrias priorizan la durabilidad, la reducción de peso y la optimización de los costos del ciclo de vida, los rodamientos compuestos seguirán siendo componentes críticos en los sistemas mecánicos de próxima generación.
¿Cuáles son los impulsores clave del mercado de rodamientos compuestos?
- Creciente demanda de soluciones de rodamientos que no requieren mantenimiento ni lubricación para reducir el tiempo de inactividad y los costos operativos en los sectores industrial y automotriz.
- Por ejemplo, durante 2024-2025, fabricantes líderes como SKF, Schaeffler y Trelleborg introdujeron soluciones avanzadas de rodamientos compuestos diseñados para condiciones de alta carga y temperatura extrema.
- La creciente adopción de vehículos eléctricos , sistemas de energía eólica y equipos de fabricación automatizados está impulsando la demanda de rodamientos livianos y de alto rendimiento.
- Los avances en la ciencia de los materiales, la ingeniería de polímeros y las técnicas de fabricación están mejorando la resistencia de los rodamientos, la resistencia al desgaste y la vida útil.
- El creciente énfasis en la sostenibilidad y la eficiencia energética está fomentando la sustitución de los cojinetes metálicos tradicionales por alternativas compuestas.
- Con el respaldo del crecimiento de la automatización industrial y el desarrollo de la infraestructura, se espera que el mercado de rodamientos compuestos sea testigo de un crecimiento constante a largo plazo.
¿Qué factor está desafiando el crecimiento del mercado de rodamientos compuestos?
- Los mayores costos de materiales y fabricación asociados con polímeros avanzados, fibras y fabricación de precisión pueden limitar su adopción en aplicaciones sensibles a los costos.
- Durante 2024 y 2025, la volatilidad en los precios de las materias primas y las interrupciones en la cadena de suministro afectaron los costos de producción de los fabricantes de rodamientos compuestos.
- Las limitaciones de rendimiento bajo cargas de impacto extremas o condiciones de desalineación pueden restringir el uso en ciertas aplicaciones de servicio pesado.
- La limitada conciencia entre los fabricantes a pequeña escala sobre los beneficios a largo plazo y las ventajas en los costos del ciclo de vida ralentiza la penetración en el mercado.
- La competencia de los cojinetes metálicos tradicionales y las alternativas de bajo costo crea presión sobre los precios
- Para abordar estos desafíos, las empresas se están centrando en la optimización de costos, los diseños específicos de la aplicación y la educación del cliente para expandir la adopción de rodamientos compuestos.
¿Cómo está segmentado el mercado de rodamientos compuestos?
El mercado está segmentado según el tipo de producto, material, forma, canal de distribución y aplicación .
- Por tipo de producto
Según el tipo de producto, el mercado de rodamientos compuestos se segmenta en rodamientos compuestos de matriz de fibra y rodamientos compuestos de matriz metálica. El segmento de rodamientos compuestos de matriz de fibra dominó el mercado con una participación estimada del 63,1 % en 2025, gracias a su ligereza, excelente resistencia a la corrosión, propiedades autolubricantes y alta resistencia al desgaste. Estos rodamientos se utilizan ampliamente en aplicaciones de automoción, aeroespacial, energías renovables y automatización industrial, donde la reducción de peso y el funcionamiento sin mantenimiento son cruciales. Su excelente amortiguación de vibraciones y reducción de ruido impulsan aún más su adopción en maquinaria de precisión.
Se prevé que el segmento de compuestos de matriz metálica experimente su mayor crecimiento anual compuesto (TCAC) entre 2026 y 2033, impulsado por la creciente demanda de rodamientos capaces de soportar altas cargas, temperaturas elevadas y entornos operativos hostiles. El creciente uso en maquinaria pesada, equipos de construcción y aplicaciones de petróleo y gas está acelerando el crecimiento. A medida que las industrias exigen mayor durabilidad y resistencia estructural, los rodamientos de compuestos de matriz metálica están ganando terreno a nivel mundial.
- Por material
Según el material, el mercado se segmenta en cojinetes compuestos de politetrafluoroetileno (PTFE) y cojinetes compuestos de polioximetileno (POM). El segmento de cojinetes compuestos de PTFE representó la mayor participación, con aproximadamente el 58,7 % en 2025, gracias a sus excelentes propiedades autolubricantes, bajo coeficiente de fricción, resistencia química y rendimiento superior en condiciones de funcionamiento en seco. Los cojinetes compuestos de PTFE se utilizan ampliamente en la industria automotriz, aeroespacial, sistemas hidráulicos y maquinaria de procesamiento de alimentos, donde el funcionamiento sin lubricación y la limpieza son esenciales.
Se proyecta que el segmento de compuestos POM registre la tasa de crecimiento anual compuesta (TCAC) más rápida entre 2026 y 2033, gracias a su rentabilidad, alta resistencia mecánica, estabilidad dimensional y facilidad de mecanizado. Su creciente adopción en equipos de consumo, maquinaria agrícola y aplicaciones industriales en general está impulsando el crecimiento. A medida que los fabricantes buscan un rendimiento equilibrado a precios competitivos, se espera que la demanda de rodamientos de compuestos POM experimente una fuerte expansión.
- Por formulario
Según su forma, el mercado de rodamientos compuestos se segmenta en casquillos cilíndricos, casquillos con brida, placas deslizantes, arandelas de empuje y arandelas con brida. El segmento de casquillos cilíndricos dominó el mercado con una participación del 36,9 % en 2025, gracias a su amplio uso en sistemas de suspensión de automóviles, maquinaria de construcción, cilindros hidráulicos y equipos industriales. Su diseño simple, alta capacidad de carga y facilidad de instalación los convierten en la opción preferida en diversas industrias.
Se prevé que el segmento de placas deslizantes experimente su mayor crecimiento anual compuesto (TCAC) entre 2026 y 2033, impulsado por la creciente demanda en ingeniería estructural, puentes, instalaciones de energía renovable y aplicaciones industriales de alta resistencia. Las placas deslizantes ofrecen una excelente distribución de la carga, baja fricción y una larga vida útil en movimientos oscilantes. Las arandelas de empuje y los casquillos con brida también experimentan un crecimiento constante debido a la creciente demanda de soluciones de rodamientos compactas y específicas para cada aplicación.
- Por canal de distribución
Según el canal de distribución, el mercado se segmenta en canales presenciales y en línea. El canal presencial dominó el mercado con una cuota estimada del 68,4 % en 2025, impulsado por una fuerte dependencia de las relaciones directas con proveedores, las colaboraciones con fabricantes de equipos originales (OEM), los distribuidores autorizados y las redes de compras industriales. Los usuarios finales prefieren los canales presenciales para consultas técnicas, soluciones personalizadas, compras al por mayor y garantía de calidad del producto, especialmente en aplicaciones industriales críticas.
Se prevé que el canal de distribución en línea crezca a su tasa de crecimiento anual compuesto (TCAC) más rápida entre 2026 y 2033, impulsado por la creciente digitalización de las compras industriales, la expansión de las plataformas de comercio electrónico B2B y un mejor acceso a productos estandarizados de rodamientos compuestos. Las pequeñas y medianas empresas están adoptando cada vez más las compras en línea gracias a precios competitivos, entregas más rápidas y una mayor disponibilidad de productos. A medida que las cadenas de suministro digitales se consolidan, los canales en línea desempeñarán un papel cada vez más importante en la expansión del mercado.
- Por aplicación
Según su aplicación, el mercado de rodamientos compuestos se segmenta en construcción y minería, automoción, aeroespacial, agricultura, náutica, energías renovables, alimentación y bebidas, equipos de gimnasia, petróleo y gas, industria hidráulica, entre otros. El segmento automovilístico dominó el mercado con una participación del 31,5 % en 2025, impulsado por la creciente adopción en sistemas de suspensión, componentes de dirección, sistemas de frenos y vehículos eléctricos. Su diseño ligero, el menor mantenimiento y la mejora de la eficiencia del combustible impulsan significativamente la demanda en este sector.
Se proyecta que el segmento de energías renovables crecerá a su tasa de crecimiento anual compuesta (TCAC) más alta entre 2026 y 2033, impulsado por la expansión de las instalaciones de energía eólica y solar a nivel mundial. Los rodamientos compuestos se utilizan cada vez más en sistemas de paso de turbinas eólicas, mecanismos de orientación y sistemas de seguimiento solar debido a su durabilidad y resistencia a entornos hostiles. Las crecientes inversiones en infraestructura de energía limpia continúan acelerando la adopción de las aplicaciones renovables.
¿Qué región posee la mayor participación en el mercado de rodamientos compuestos?
- China dominó el mercado de rodamientos compuestos en Asia-Pacífico, con una cuota de mercado estimada del 38,7 % en 2025, impulsada por la rápida industrialización, la sólida fabricación de automóviles y maquinaria, y la alta adopción en los sectores de la construcción, las energías renovables y la maquinaria pesada. La creciente demanda de rodamientos compuestos ligeros, duraderos y de bajo mantenimiento en las principales industrias continúa consolidando el liderazgo de China en el mercado.
- El creciente enfoque en soluciones de alta eficiencia, bajo nivel de ruido y resistentes a la corrosión en aplicaciones automotrices, de energías renovables e industriales está impulsando significativamente la adopción de rodamientos compuestos. La sólida capacidad de fabricación, las inversiones en I+D y las colaboraciones con fabricantes de equipos originales (OEM) fortalecen aún más el mercado regional.
Análisis del mercado de rodamientos compuestos en Japón
En Japón, el crecimiento del mercado se ve impulsado por los avanzados sectores de la automoción, la aeroespacial y la maquinaria industrial. Los rodamientos compuestos se utilizan ampliamente en turbinas eólicas, robótica y equipos de precisión gracias a su alta resistencia al desgaste, baja fricción y bajo mantenimiento. La sólida fabricación nacional, el enfoque en soluciones ligeras y la inversión en tecnologías de eficiencia energética fomentan su adopción constante. La colaboración entre fabricantes de equipos originales (OEM) y proveedores impulsa aún más la expansión del mercado.
Análisis del mercado de rodamientos compuestos en India
Se proyecta que India registrará la tasa de crecimiento anual compuesta (TCAC) más rápida, del 8,1 %, entre 2026 y 2033, impulsada por el creciente uso de rodamientos compuestos en aplicaciones de automoción, construcción, energías renovables y maquinaria industrial. La expansión de los centros de fabricación, la adopción de vehículos eléctricos y los proyectos de energías renovables impulsan la demanda de soluciones de compuestos de matriz metálica y fibra. Las iniciativas gubernamentales que promueven la modernización industrial y la maquinaria energéticamente eficiente impulsan el crecimiento a largo plazo.
Análisis del mercado de rodamientos compuestos de Corea del Sur
El crecimiento de Corea del Sur se sustenta en los sectores de automoción, electrónica y equipos industriales, donde los rodamientos compuestos son los preferidos para aplicaciones de alta carga, bajo mantenimiento y resistencia al desgaste. El creciente despliegue en vehículos eléctricos, robótica e instalaciones de energías renovables está acelerando su adopción. Los sólidos ecosistemas de innovación, las colaboraciones con fabricantes de equipos originales (OEM) y las inversiones en I+D refuerzan la posición del país en el mercado.
Análisis del mercado australiano de rodamientos compuestos
Australia muestra un crecimiento constante impulsado por las industrias de la construcción, la minería y las energías renovables. Los rodamientos compuestos se utilizan cada vez más en maquinaria pesada, turbinas eólicas y equipos industriales para mejorar la capacidad de carga, la durabilidad y la vida útil. Las mejoras industriales, el desarrollo de infraestructura y las iniciativas de energías renovables, respaldadas por el gobierno, fomentan aún más su adopción. El crecimiento de la manufactura local y las exportaciones industriales impulsan la expansión del mercado a largo plazo.
¿Cuáles son las principales empresas en el mercado de rodamientos compuestos?
La industria de los rodamientos compuestos está liderada principalmente por empresas bien establecidas, entre las que se incluyen:
- SKF (Suecia)
- Schaeffler AG (Alemania)
- Trelleborg AB (Suecia)
- RBC Bearings Incorporated (EE. UU.)
- SGL Carbon (Alemania)
- Compañía Polygon (EE. UU.)
- Huntsman International LLC (EE. UU.)
- HyComp LLC (EE. UU.)
- GGB (EE. UU.)
- Rexnord Corporation (EE. UU.)
- Tenneco Inc. (EE. UU.)
- Quality Pacific Manufacturing, Inc. (EE. UU.)
- Tecnología FTL (EE. UU.)
- Rheinmetall Automotive AG (Alemania)
SKU-
Obtenga acceso en línea al informe sobre la primera nube de inteligencia de mercado del mundo

- Panel de análisis de datos interactivo
- Panel de análisis de empresas para oportunidades con alto potencial de crecimiento
- Acceso de analista de investigación para personalización y consultas
- Análisis de la competencia con panel interactivo
- Últimas noticias, actualizaciones y análisis de tendencias
- Aproveche el poder del análisis de referencia para un seguimiento integral de la competencia
Metodología de investigación
La recopilación de datos y el análisis del año base se realizan utilizando módulos de recopilación de datos con muestras de gran tamaño. La etapa incluye la obtención de información de mercado o datos relacionados a través de varias fuentes y estrategias. Incluye el examen y la planificación de todos los datos adquiridos del pasado con antelación. Asimismo, abarca el examen de las inconsistencias de información observadas en diferentes fuentes de información. Los datos de mercado se analizan y estiman utilizando modelos estadísticos y coherentes de mercado. Además, el análisis de la participación de mercado y el análisis de tendencias clave son los principales factores de éxito en el informe de mercado. Para obtener más información, solicite una llamada de un analista o envíe su consulta.
La metodología de investigación clave utilizada por el equipo de investigación de DBMR es la triangulación de datos, que implica la extracción de datos, el análisis del impacto de las variables de datos en el mercado y la validación primaria (experto en la industria). Los modelos de datos incluyen cuadrícula de posicionamiento de proveedores, análisis de línea de tiempo de mercado, descripción general y guía del mercado, cuadrícula de posicionamiento de la empresa, análisis de patentes, análisis de precios, análisis de participación de mercado de la empresa, estándares de medición, análisis global versus regional y de participación de proveedores. Para obtener más información sobre la metodología de investigación, envíe una consulta para hablar con nuestros expertos de la industria.
Personalización disponible
Data Bridge Market Research es líder en investigación formativa avanzada. Nos enorgullecemos de brindar servicios a nuestros clientes existentes y nuevos con datos y análisis que coinciden y se adaptan a sus objetivos. El informe se puede personalizar para incluir análisis de tendencias de precios de marcas objetivo, comprensión del mercado de países adicionales (solicite la lista de países), datos de resultados de ensayos clínicos, revisión de literatura, análisis de mercado renovado y base de productos. El análisis de mercado de competidores objetivo se puede analizar desde análisis basados en tecnología hasta estrategias de cartera de mercado. Podemos agregar tantos competidores sobre los que necesite datos en el formato y estilo de datos que esté buscando. Nuestro equipo de analistas también puede proporcionarle datos en archivos de Excel sin procesar, tablas dinámicas (libro de datos) o puede ayudarlo a crear presentaciones a partir de los conjuntos de datos disponibles en el informe.

