
Mercado de barras colectoras de Asia y el Pacífico, por conductor (cobre, aluminio), peso (menos de 1 kg, más de 1 kg), forma (chaflán, rectangular), aislamiento (recubrimiento de polvo epoxi, Mylar, Nomex, Kapton, Teonix, Tedler), longitud (menos de 1 m, 1 ma 2 m, 2 ma 3 m y más de 3 m), tipo de barra colectora (barra colectora de un solo conductor, barra colectora de varios conductores, barra colectora flexible, barra colectora laminada), potencia nominal (baja potencia, potencia media (125 A-800 A), alta potencia (más de 800 A)), usuario final (industrial, comercial y residencial), país (China, Japón, Corea del Sur, India, Australia, Singapur, Indonesia, Tailandia, Malasia, Filipinas y resto de Asia y el Pacífico), tendencias de la industria y pronóstico hasta 2028.
 Análisis y perspectivas del mercado: mercado de barras colectoras de Asia y el Pacífico
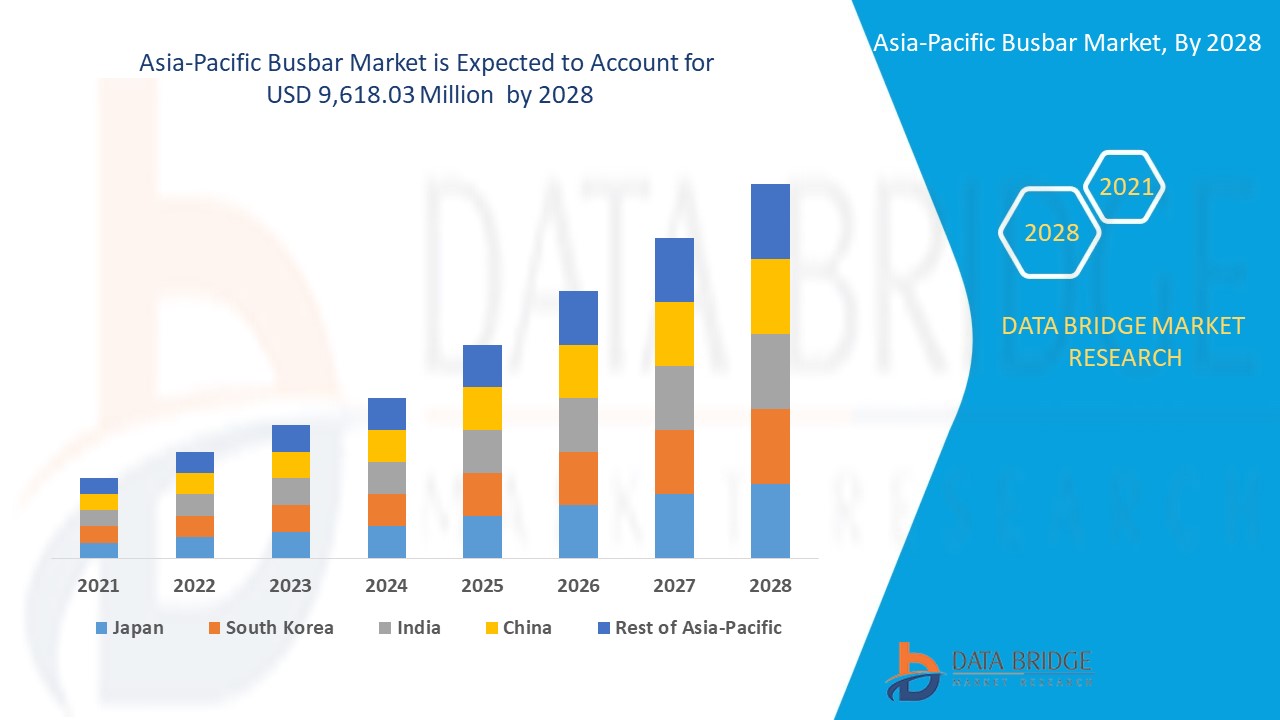
Se espera que el mercado de barras colectoras de Asia-Pacífico gane crecimiento de mercado en el período de pronóstico de 2021 a 2028. Data Bridge Market Research analiza que el mercado está creciendo con una CAGR del 6,2% en el período de pronóstico de 2021 a 2028 y se espera que alcance los USD 9.618,03 millones para 2028. El enfoque creciente en la eficiencia energética y los beneficios operativos y de costos de las barras colectoras sobre los cables actúa como un impulsor del crecimiento del mercado de barras colectoras.
Una barra colectora eléctrica se define como un conductor o un grupo de conductores que se utilizan para recoger energía eléctrica de los alimentadores entrantes y distribuirla a los alimentadores salientes. En otras palabras, es un tipo de unión eléctrica en la que se encuentran todas las corrientes eléctricas entrantes y salientes . Por lo tanto, la barra colectora eléctrica recoge la energía eléctrica en un lugar. El sistema de barras colectoras consta del seccionador y el disyuntor . En caso de producirse una falla, el disyuntor se dispara y la sección defectuosa de la barra colectora se desconecta fácilmente del circuito.
La barra colectora eléctrica está disponible en formas rectangulares, transversales, redondas y de muchas otras formas. La barra colectora rectangular se utiliza principalmente en el sistema de energía. El cobre y el aluminio se utilizan para la fabricación de la barra colectora eléctrica.
El mercado de barras colectoras de Asia-Pacífico se ha desarrollado como resultado de los avances tecnológicos. Además, el mercado de Asia-Pacífico está siendo impulsado por la creciente demanda de barras colectoras para una conductividad eficiente y pérdidas de energía durante la transmisión. Por otro lado, el aumento de productos duplicados y material barato del lado de la competencia ha obstaculizado la expansión del mercado. Se espera que el desarrollo de ciudades inteligentes cree varias oportunidades para el crecimiento del mercado de barras colectoras de Asia-Pacífico. Esto tendería a mantener el futuro del mercado fuerte y avanzado.
El informe de mercado de barras colectoras proporciona detalles de la participación de mercado, nuevos desarrollos y análisis de la cartera de productos, el impacto de los actores del mercado nacional y localizado, analiza las oportunidades en términos de bolsillos de ingresos emergentes, cambios en las regulaciones del mercado, aprobaciones de productos, decisiones estratégicas, lanzamientos de productos, expansiones geográficas e innovaciones tecnológicas en el mercado. Para comprender el análisis y el escenario del mercado de barras colectoras, comuníquese con Data Bridge Market Research para obtener un informe de analista; nuestro equipo lo ayudará a crear una solución de impacto en los ingresos para lograr su objetivo deseado.
 Alcance y tamaño del mercado de barras colectoras de Asia y el Pacífico
El mercado de barras colectoras de Asia-Pacífico está segmentado en función del conductor, el peso, la forma, el aislamiento, la longitud, el tipo de barra colectora, la potencia nominal y el usuario final. El crecimiento entre segmentos le ayuda a analizar nichos de crecimiento y estrategias para abordar el mercado y determinar sus áreas de aplicación principales y la diferencia en sus mercados objetivo.
- En función del conductor, el mercado de barras colectoras de Asia-Pacífico se segmenta en aluminio y cobre. El segmento de cobre se subdivide en transformadores, rectificadores, generadores y otros. En 2021, se espera que el segmento de cobre domine el mercado debido a su propiedad de conductividad térmica y expansión.
- En términos de peso, el mercado de barras colectoras de Asia-Pacífico se segmenta en menos de 1 kg y más de 1 kg. En 2021, se espera que el segmento de más de 1 kg domine el mercado debido a los amplios usos de más de 1 kg en el sector industrial automotriz.
- En cuanto a la forma, el mercado de barras colectoras de Asia-Pacífico se segmenta en rectángulo y chaflán. En 2021, se espera que el segmento rectangular domine el mercado, ya que se utiliza en la conexión del sistema eléctrico, lo que mejora la demanda general.
- En cuanto al aislamiento, el mercado de barras colectoras de Asia-Pacífico se segmenta en recubrimiento en polvo de epoxi, teonix, tedler, mylar, nomex, kapton y otros. En 2021, se espera que el segmento de recubrimiento en polvo de epoxi domine el mercado debido a su relación costo-beneficio.
- En función de la longitud, el mercado de barras colectoras de Asia-Pacífico se segmenta en menos de 1 m, de 1 m a 2 m, de 2 m a 3 m y más de 3 m. En 2021, se espera que el segmento de 1 m a 2 m domine el mercado, ya que proporciona un suministro de energía eficiente.
- Según el tipo de barra colectora, el mercado de barras colectoras de Asia-Pacífico se segmenta en barras colectoras de un solo conductor, barras colectoras de múltiples conductores, barras colectoras flexibles y barras colectoras laminadas. En 2021, se espera que el segmento laminado domine el mercado, ya que están diseñadas específicamente para aplicaciones de baja y alta potencia.
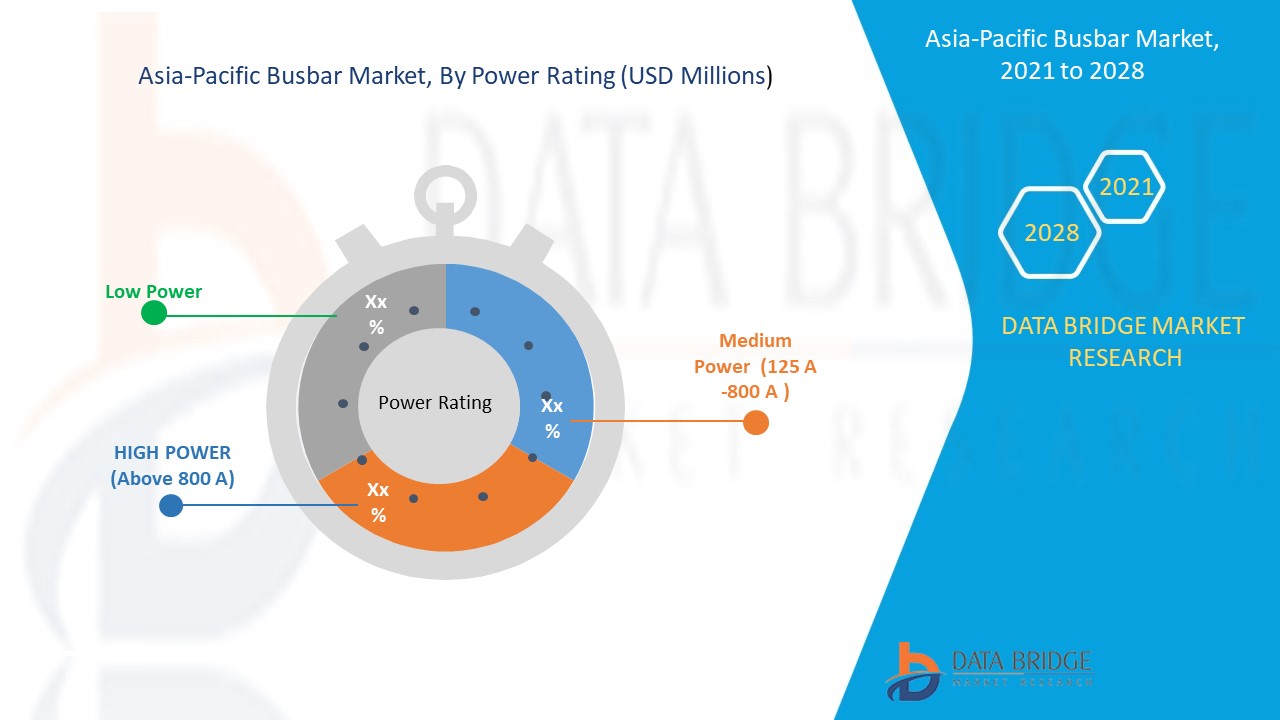
- En función de la potencia nominal, el mercado de barras colectoras de Asia-Pacífico se segmenta en baja potencia, potencia media (125 A-800 A) y alta potencia (más de 800 A). En 2021, se espera que el segmento de baja potencia domine el mercado, ya que se utiliza ampliamente en entornos de fabricación.
- En función del usuario final, el mercado de barras colectoras de Asia-Pacífico se segmenta en industrial, comercial y residencial. En 2021, se espera que el segmento industrial domine el mercado debido a su capacidad para generar productores de energía independientes (IPP) en todo el mundo que desarrollen plantas de energía para generar electricidad que satisfaga la demanda industrial.
Análisis a nivel de país del mercado de barras colectoras de Asia y el Pacífico
Se analiza el mercado de barras colectoras y se proporciona información sobre el tamaño del mercado según el conductor, el peso, la forma, el aislamiento, la longitud, el tipo de barra colectora, la potencia nominal y el usuario final como se menciona anteriormente.
Los países cubiertos en el informe del mercado de barras colectoras son China, Japón, Corea del Sur, India, Australia, Singapur, Indonesia, Tailandia, Malasia, Filipinas y el resto de Asia-Pacífico.
China domina el mercado debido a la creciente demanda de electricidad en los sectores residencial, comercial e industrial del país.
La sección de países del informe también proporciona factores de impacto individuales en el mercado y cambios en la regulación en el mercado a nivel nacional que afectan las tendencias actuales y futuras del mercado. Los puntos de datos como nuevas ventas, ventas de reemplazo, demografía del país, leyes regulatorias y aranceles de importación y exportación son algunos de los principales indicadores utilizados para pronosticar el escenario del mercado para países individuales. Además, la presencia y disponibilidad de marcas de Asia-Pacífico y sus desafíos enfrentados debido a la competencia grande o escasa de las marcas locales y nacionales, el impacto de los canales de venta se consideran al proporcionar un análisis de pronóstico de los datos del país.
La creciente demanda de barras colectoras para una conductividad eficiente y pérdidas de energía durante la transmisión está impulsando el crecimiento del mercado de barras colectoras en Asia-Pacífico.
El mercado de barras colectoras de Asia-Pacífico también le ofrece un análisis detallado del mercado para el crecimiento de cada país en el mercado en particular. Además, proporciona información detallada sobre la estrategia de los actores del mercado y su presencia geográfica. Los datos están disponibles para el período histórico de 2010 a 2019.
Análisis del panorama competitivo y de la cuota de mercado de barras colectoras en Asia-Pacífico
El panorama competitivo del mercado de barras colectoras proporciona detalles por competidor. Los detalles incluidos son una descripción general de la empresa, las finanzas de la empresa, los ingresos generados, el potencial de mercado, la inversión en investigación y desarrollo, las nuevas iniciativas de mercado, los sitios e instalaciones de producción, las fortalezas y debilidades de la empresa, el lanzamiento de productos, los procesos de prueba de productos, las aprobaciones de productos, las patentes, la amplitud y la extensión de los productos, el dominio de las aplicaciones y la curva de la línea de vida de la tecnología. Los puntos de datos anteriores proporcionados solo están relacionados con el enfoque de la empresa relacionado con el mercado de barras colectoras.
Las principales empresas que operan en el mercado de barras colectoras de Asia-Pacífico son ABB, General Electric, Schneider Electric, Legrand SA, Siemens AG, Eaton, Amphenol Corporation, Chint Group, Emerson Electric Co., Mersen Property, Methode Electronics, Oriental Copper Co., Ltd., Rittal Gmbh & Co. Kg, Rogers Corporation y Sun. King Technology Group Limited, entre otras. Los analistas de DBMR comprenden las fortalezas competitivas y brindan un análisis competitivo para cada competidor por separado.
Muchas empresas en todo el mundo también están iniciando expansiones comerciales y acuerdos que también están acelerando el mercado de barras colectoras.
Por ejemplo,
- En octubre de 2020, ABB amplió su gama de cuadros de distribución UniGear ZS2 a UniGear Digital con toda la gama de cuadros de distribución de media tensión (MT) UniGear con la versión digital. La empresa mejoró su amplia gama de negocios ofreciendo más cuadros de distribución con barras colectoras. La empresa mejoró su amplia gama de negocios generando más ingresos y beneficios.
- En agosto de 2020, Schneider Electric completó su transacción de baja tensión y automatización industrial en el negocio de Baja Tensión y Automatización Industrial con el negocio Eléctrico y de Automatización de Larsen & Toubro. La empresa ofreció una amplia cartera de negocios que genera más ingresos y ganancias.
La colaboración, los lanzamientos de productos, los premios y reconocimientos, las empresas conjuntas y otras estrategias de los actores del mercado están mejorando la presencia de la empresa en el mercado de barras colectoras, lo que también proporciona el beneficio para el crecimiento de las ganancias de la organización.
SKU-
Obtenga acceso en línea al informe sobre la primera nube de inteligencia de mercado del mundo

- Panel de análisis de datos interactivo
- Panel de análisis de empresas para oportunidades con alto potencial de crecimiento
- Acceso de analista de investigación para personalización y consultas
- Análisis de la competencia con panel interactivo
- Últimas noticias, actualizaciones y análisis de tendencias
- Aproveche el poder del análisis de referencia para un seguimiento integral de la competencia
Tabla de contenido
1 INTRODUCTION
1.1 OBJECTIVES OF THE STUDY
1.2 MARKET DEFINITION
1.3 OVERVIEW OF ASIA-PACIFIC BUSBAR MARKET
1.4 CURRENCY AND PRICING
1.5 LIMITATIONS
1.6 MARKETS COVERED
2 MARKET SEGMENTATION
2.1 MARKETS COVERED
2.2 GEOGRAPHICAL SCOPE
2.3 YEARS CONSIDERED FOR THE STUDY
2.4 DBMR TRIPOD DATA VALIDATION MODEL
2.5 PRIMARY INTERVIEWS WITH KEY OPINION LEADERS
2.6 DBMR MARKET POSITION GRID
2.7 VENDOR SHARE ANALYSIS
2.8 MARKET END USER COVERED GRID
2.9 MULTIVARIATE MODELING
2.1 CONDUCTOR TIMELINE CURVE
2.11 SECONDARY SOURCES
2.12 ASSUMPTIONS
3 EXECUTIVE SUMMARY
4 PREMIUM INSIGHTS
4.1 TREND
4.1.1 GROWING ENERGY CONSUMPTION DUE TO INDUSTRIALIZATION & URBANIZATION
4.1.2 INCREASING FOCUS ON ENERGY EFFICIENCY
4.1.3 COST & OPERATIONAL BENEFITS OF BUSBAR
4.2 STANDARD
4.2.1 IEC 60439-2
4.2.2 BSEN 60439-2 STANDARD
5 MARKET OVERVIEW
5.1 DRIVER
5.1.1 REQUIREMENT OF EFFICIENT CONDUCTIVITY AND ENERGY LOSSES DURING TRANSMISSION.
5.1.2 COST & OPERATIONAL ADVANTAGES OF BUSBARS
5.1.3 INCREASING FOCUS ON ENERGY EFFICIENCY WITH PREFERENCE FOR BUSBARS OVER CABLES
5.1.4 RISING ADOPTION OF SMART GRID TECHNOLOGY
5.1.5 RISING DEMAND FOR ELECTRICITY ACROSS RESIDENTIAL, COMMERCIAL, AND INDUSTRIAL SECTOR
5.2 RESTRAINTS
5.2.1 AVAILABILITY OF CHEAP AND LOW QUALITY PRODUCTS
5.2.2 FLUCTUATION IN RAW MATERIAL PRICES, ESPECIALLY COPPER
5.3 OPPORTUNITY
5.3.1 SMART CITIES DEVELOPMENT
5.3.2 GROWTH IN SWITCHGEAR AND ENERGY & POWER MARKET
5.3.3 GROWING ADOPTION OF BUSBARS IN ELECTRIC VEHICLES
5.4 CHALLENGES
5.4.1 HIGH COST INVOLVED IN THE SETUP
5.4.2 GEOPOLITICAL TRADE CONFLICT FROM CHINA DECLINING THE SALES
6 IMPACT OF COVID-19 ON THE ASIA-PACIFIC BUSBAR MARKET
6.1 ANALYSIS ON IMPACT OF COVID-19 ON THE ASIA-PACIFIC BUSBAR MARKET
6.2 IMPACT ON PRICE
6.3 IMPACT ON DEMAND AND SUPPLY CHAIN
6.4 AFTERMATH OF COVID-19 AND INITIATIVES BY MANUFACTURERS TO BOOST THE MARKET
6.5 CONCLUSION
7 ASIA-PACIFIC BUSBAR MARKET, BY CONDUCTOR
7.1 OVERVIEW
7.2 COPPER
7.2.1 TRANSFORMERS
7.2.2 RECTIFIERS
7.2.3 GENERATORS
7.2.4 OTHERS
7.3 ALUMINIUM
8 ASIA-PACIFIC BUSBAR MARKET, BY WEIGHT WISE
8.1 OVERVIEW
8.2 MORE THAN 1 KG
8.3 LESS THAN 1 KG
9 ASIA-PACIFIC BUSBAR MARKET, BY SHAPE WISE
9.1 OVERVIEW
9.2 RECTANGLE
9.3 CHAMFER
10 ASIA-PACIFIC BUSBAR MARKET, BY INSULATION
10.1 OVERVIEW
10.2 EPOXY POWER COATING
10.3 MYLAR
10.4 NOMEX
10.5 KAPTON
10.6 TEONIX
10.7 TEDLER
10.8 OTHERS
11 ASIA-PACIFIC BUSBAR MARKET, BY LENGTH
11.1 OVERVIEW
11.2 1M TO 2M
11.3 2MT TO 3MT
11.4 MORE THAN 3MT
11.5 LESS THAN 1M
12 ASIA-PACIFIC BUSBAR MARKET, BY BUSBAR TYPE
12.1 OVERVIEW
12.2 LAMINATE BUSBARS
12.3 MULTIPLE CONDUCTOR BUSBARS
12.4 FLEXIBLE BUSBARS
12.5 SINGLE CONDUCTOR BUSBARS
13 ASIA-PACIFIC BUSBAR MARKET, BY POWER RATING
13.1 OVERVIEW
13.2 LOW POWER
13.2.1 TO 60 AMP
13.2.2 AMP TO 100 AMP
13.2.3 AMP TO 125 AMP
13.2.4 LESS THAN 40 AMP
13.3 MEDIUM POWER (125 A-800 A)
13.3.1 AMP TO 200 AMP
13.3.2 AMP TO 400 AMP
13.3.3 AMP TO 800 AMP
13.4 HIGH POWER (ABOVE 800 A)
13.4.1 AMP TO 1,000 AMP
13.4.2 1,000 AMP TO 1200 AMP
14 ASIA-PACIFIC BUSBAR MARKET, BY END USER
14.1 OVERVIEW
14.2 INDUSTRIAL
14.2.1 UTILITIES
14.2.1.1 Copper
14.2.1.2 Aluminium
14.2.2 MANUFACTURING
14.2.2.1 Copper
14.2.2.2 Aluminium
14.2.3 TELECOM
14.2.3.1 Copper
14.2.3.2 Aluminium
14.2.4 AEROSPACE AND DEFENSE
14.2.4.1 Copper
14.2.4.2 Aluminium
14.2.5 CHEMICALS & PETROLEUM
14.2.5.1 Copper
14.2.5.2 Aluminium
14.2.6 METALS AND MINING
14.2.6.1 Copper
14.2.6.2 Aluminium
14.2.7 OTHERS
14.2.7.1 Copper
14.2.7.2 Aluminium
14.3 RESIDENTIAL
14.4 COMMERCIAL
14.4.1 OFFICES
14.4.1.1 Copper
14.4.1.2 Aluminium
14.4.2 HOSPITALS
14.4.2.1 Copper
14.4.2.2 Aluminium
14.4.3 MALLS AND SUPERMARKETS
14.4.3.1 Copper
14.4.3.2 Aluminium
14.4.4 DATA CENTRE
14.4.4.1 Copper
14.4.4.2 Aluminium
14.4.5 WAREHOUSES
14.4.5.1 Copper
14.4.5.2 Aluminium
14.4.6 OTHERS
14.4.6.1 Copper
14.4.6.2 Aluminium
15 ASIA-PACIFIC BUSBAR MARKET, BY REGION
15.1 ASIA-PACIFIC
15.1.1 CHINA
15.1.2 INDIAN
15.1.3 JAPAN
15.1.4 SOUTH KOREA
15.1.5 AUSTRALIA
15.1.6 INDONESIA
15.1.7 THAILAND
15.1.8 MALAYSIA
15.1.9 PHILIPPINES
15.1.10 SINGAPORE
15.1.11 REST OF ASIA-PACIFIC
16 ASIA-PACIFIC BUSBAR MARKET COMPANY LANDSCAPE
16.1 COMPANY SHARE ANALYSIS: ASIA-PACIFIC
17 SWOT ANALYSIS
18 COMPANY PROFILE
18.1 ABB
18.1.1 COMPANY SNAPSHOT
18.1.2 REVENUE ANALYSIS
18.1.3 COMPANY SHARE ANALYSIS
18.1.4 PRODUCT PORTFOLIO
18.1.5 RECENT DEVELOPMENTS
18.2 GENERAL ELECTRIC
18.2.1 COMPANY SNAPSHOT
18.2.2 REVENUE ANALYSIS
18.2.3 COMPANY SHARE ANALYSIS
18.2.4 PRODUCT PORTFOLIO
18.2.5 RECENT DEVELOPMENT
18.3 SCHNEIDER ELECTRIC
18.3.1 COMPANY SNAPSHOT
18.3.2 REVENUE ANALYSIS
18.3.3 COMPANY SHARE ANALYSIS
18.3.4 PRODUCT PORTFOLIO
18.3.5 RECENT DEVELOPMENTS
18.4 LEGRAND SA
18.4.1 COMPANY SNAPSHOT
18.4.2 REVENUE ANALYSIS
18.4.3 COMPANY SHARE ANALYSIS
18.4.4 PRODUCT PORTFOLIO
18.4.5 RECENT DEVELOPMENTS
18.5 SIEMENS
18.5.1 COMPANY SNAPSHOT
18.5.2 REVENUE ANALYSIS
18.5.3 COMPANY SHARE ANALYSIS
18.5.4 PRODUCT PORTFOLIO
18.5.5 RECENT DEVELOPMENTS
18.6 EATON
18.6.1 COMPANY SNAPSHOT
18.6.2 REVENUE ANALYSIS
18.6.3 PRODUCT PORTFOLIO
18.6.4 RECENT DEVELOPMENTS
18.7 AMPHENOL CORPORATION
18.7.1 COMPANY SNAPSHOT
18.7.2 REVENUE ANALYSIS
18.7.3 PRODUCT PORTFOLIO
18.7.4 RECENT DEVELOPMENT
18.8 BUSBAR SYSTEMS BELGIUM
18.8.1 COMPANY SNAPSHOT
18.8.2 PRODUCT PORTFOLIO
18.8.3 RECENT DEVELOPMENT
18.9 CHINT GROUP
18.9.1 COMPANY SNAPSHOT
18.9.2 PRODUCT PORTFOLIO
18.9.3 RECENT DEVELOPMENT
18.1 EMERSON ELECTRIC CO.
18.10.1 COMPANY SNAPSHOT
18.10.2 REVENUE ANALYSIS
18.10.3 PRODUCT PORTFOLIO
18.10.4 RECENT DEVELOPMENT
18.11 EMS INDUSTRIAL & SERVICE COMPANY
18.11.1 COMPANY SNAPSHOT
18.11.2 PRODUCT PORTFOLIO
18.11.3 RECENT DEVELOPMENT
18.12 MERSEN PROPERTY
18.12.1 COMPANY SNAPSHOT
18.12.2 REVENUE ANALYSIS
18.12.3 PRODUCT PORTFOLIO
18.12.4 RECENT DEVELOPMENTS
18.13 METHODE ELECTRONICS
18.13.1 COMPANY SNAPSHOT
18.13.2 REVENUE ANALYSIS
18.13.3 PRODUCT PORTFOLIO
18.13.4 RECENT DEVELOPMENT
18.14 ORIENTAL COPPER CO.,LTD.
18.14.1 COMPANY SNAPSHOT
18.14.2 PRODUCT PORTFOLIO
18.14.3 RECENT DEVELOPMENT
18.15 PROMET AG
18.15.1 COMPANY SNAPSHOT
18.15.2 PRODUCT PORTFOLIO
18.15.3 RECENT DEVELOPMENT
18.16 RITTAL GMBH & CO. KG
18.16.1 COMPANY SNAPSHOT
18.16.2 PRODUCT PORTFOLIO
18.16.3 RECENT DEVELOPMENT
18.17 ROGERS CORPORATION
18.17.1 COMPANY SNAPSHOT
18.17.2 REVENUE ANALYSIS
18.17.3 PRODUCT PORTFOLIO
18.17.4 RECENT DEVELOPMENT
18.18 SUN.KING TECHNOLOGY GROUP LIMITED
18.18.1 COMPANY SNAPSHOT
18.18.2 REVENUE ANALYSIS
18.18.3 PRODUCT PORTFOLIO
18.18.4 RECENT DEVELOPMENT
18.19 WATTEREDGE, LLC
18.19.1 COMPANY SNAPSHOT
18.19.2 PRODUCT PORTFOLIO
18.19.3 RECENT DEVELOPMENT
19 QUESTIONNAIRE
20 RELATED REPORTS
Lista de Tablas
TABLE 1 ASIA-PACIFIC BUSBAR MARKET, BY CONDUCTOR, 2019-2028 (USD MILLION)
TABLE 2 ASIA-PACIFIC COPPER IN BUSBAR MARKET, BY REGION, 2019-2028 (USD MILLION)
TABLE 3 ASIA-PACIFIC COPPER IN BUSBAR MARKET, BY APPLICATION, 2019-2028 (USD MILLION)
TABLE 4 ASIA-PACIFIC ALUMINIUM IN BUSBAR MARKET, BY REGION, 2019-2028 (USD MILLION)
TABLE 5 ASIA-PACIFIC BUSBAR MARKET, BY WEIGHT WISE, 2019-2028 (USD MILLION)
TABLE 6 ASIA-PACIFIC MORE THAN 1 KG IN BUSBAR MARKET, BY REGION, 2019-2028 (USD MILLION)
TABLE 7 ASIA-PACIFIC LESS THAN 1 KG IN BUSBAR MARKET, BY REGION, 2019-2028 (USD MILLION)
TABLE 8 ASIA-PACIFIC BUSBAR MARKET, BY SHAPE WISE, 2019-2028 (USD MILLION)
TABLE 9 ASIA-PACIFIC RECTANGLE IN BUSBAR MARKET, BY REGION, 2019-2028 (USD MILLION)
TABLE 10 ASIA-PACIFIC CHAMFER IN BUSBAR MARKET, BY REGION, 2019-2028 (USD MILLION)
TABLE 11 ASIA-PACIFIC BUSBAR MARKET, BY INSULATION, 2019-2028 (USD MILLION)
TABLE 12 ASIA-PACIFIC EPOXY POWER COATING IN BUSBAR MARKET, BY REGION, 2019-2028 (USD MILLION)
TABLE 13 ASIA-PACIFIC MYLAR IN BUSBAR MARKET, BY REGION, 2019-2028 (USD MILLION)
TABLE 14 ASIA-PACIFIC NOMEX IN BUSBAR MARKET, BY REGION, 2019-2028 (USD MILLION)
TABLE 15 ASIA-PACIFIC KAPTON IN BUSBAR MARKET, BY REGION, 2019-2028 (USD MILLION)
TABLE 16 ASIA-PACIFIC TEONIX IN BUSBAR MARKET, BY REGION, 2019-2028 (USD MILLION)
TABLE 17 ASIA-PACIFIC TEDLER IN BUSBAR MARKET, BY REGION, 2019-2028 (USD MILLION)
TABLE 18 ASIA-PACIFIC OTHERS IN BUSBAR MARKET, BY REGION, 2019-2028 (USD MILLION)
TABLE 19 ASIA-PACIFIC BUSBAR MARKET, BY LENGTH, 2019-2028 (USD MILLION)
TABLE 20 ASIA-PACIFIC 1M TO 2M IN BUSBAR MARKET, BY REGION, 2019-2028 (USD MILLION)
TABLE 21 ASIA-PACIFIC 2MT TO 3 MT IN BUSBAR MARKET, BY REGION, 2019-2028 (USD MILLION)
TABLE 22 ASIA-PACIFIC MORE THAN 3 MT IN BUSBAR MARKET, BY REGION, 2019-2028 (USD MILLION)
TABLE 23 ASIA-PACIFIC LESS THAN 1M IN BUSBAR MARKET, BY REGION, 2019-2028 (USD MILLION)
TABLE 24 ASIA-PACIFIC BUSBAR MARKET, BY BUSBAR TYPE, 2019-2028 (USD MILLION)
TABLE 25 ASIA-PACIFIC LAMINATED BUSBARS IN BUSBAR MARKET, BY REGION, 2019-2028 (USD MILLION)
TABLE 26 ASIA-PACIFIC MULTIPLE CONDUCTOR BUSBARS IN BUSBAR MARKET, BY REGION, 2019-2028 (USD MILLION)
TABLE 27 ASIA-PACIFIC FLEXIBLE BUSBARS IN BUSBAR MARKET, BY REGION, 2019-2028 (USD MILLION)
TABLE 28 ASIA-PACIFIC SINGLE CONDUCTOR BUSBARS IN BUSBAR MARKET, BY REGION, 2019-2028 (USD MILLION)
TABLE 29 ASIA-PACIFIC BUSBAR MARKET, BY POWER RATING, 2019-2028 (USD MILLION)
TABLE 30 ASIA-PACIFIC LOW POWER IN BUSBAR MARKET, BY REGION, 2019-2028 (USD MILLION)
TABLE 31 ASIA-PACIFIC LOW POWER IN BUSBAR MARKET, BY TYPE, 2019-2028 (USD MILLION)
TABLE 32 ASIA-PACIFIC MEDIUM POWER (125 A-800 A) IN BUSBAR MARKET, BY REGION, 2019-2028 (USD MILLION)
TABLE 33 ASIA-PACIFIC MEDIUM POWER (125 A-800 A) IN BUSBAR MARKET, BY TYPE, 2019-2028 (USD MILLION)
TABLE 34 ASIA-PACIFIC HIGH POWER (ABOVE 800 A) IN BUSBAR MARKET, BY REGION, 2019-2028 (USD MILLION)
TABLE 35 ASIA-PACIFIC HIGH POWER (ABOVE 800 A) IN BUSBAR MARKET, BY TYPE, 2019-2028 (USD MILLION)
TABLE 36 ASIA-PACIFIC BUSBAR MARKET, BY END USER, 2019-2028 (USD MILLION)
TABLE 37 ASIA-PACIFIC INDUSTRIAL IN BUSBAR MARKET, BY REGION, 2019-2028 (USD MILLION)
TABLE 38 ASIA-PACIFIC INDUSTRIAL IN BUSBAR MARKET, BY END USER, 2019-2028 (USD MILLION)
TABLE 39 ASIA-PACIFIC UTILITES IN BUSBAR MARKET, BY CONDUCTOR, 2019-2028 (USD MILLION)
TABLE 40 ASIA-PACIFIC MANUFACTURING IN BUSBAR MARKET, BY CONDUCTOR, 2019-2028 (USD MILLION)
TABLE 41 ASIA-PACIFIC TELECOM IN BUSBAR MARKET, BY CONDUCTOR, 2019-2028 (USD MILLION)
TABLE 42 ASIA-PACIFIC AEROSPACE AND DEFENSE IN BUSBAR MARKET, BY CONDUCTOR, 2019-2028 (USD MILLION)
TABLE 43 ASIA-PACIFIC CHEMICALS & PETROLEUM IN BUSBAR MARKET, BY CONDUCTOR, 2019-2028 (USD MILLION)
TABLE 44 ASIA-PACIFIC METAL AND MINING IN BUSBAR MARKET, BY CONDUCTOR, 2019-2028 (USD MILLION)
TABLE 45 ASIA-PACIFIC OTHERS IN BUSBAR MARKET, BY CONDUCTOR, 2019-2028 (USD MILLION)
TABLE 46 ASIA-PACIFIC RESIDENTIAL IN BUSBAR MARKET, BY REGION, 2019-2028 (USD MILLION)
TABLE 47 ASIA-PACIFIC COMMERCIAL IN BUSBAR MARKET, BY REGION, 2019-2028 (USD MILLION)
TABLE 48 ASIA-PACIFIC COMMERCIAL IN BUSBAR MARKET, BY END USER, 2019-2028 (USD MILLION)
TABLE 49 ASIA-PACIFIC OFFICES IN BUSBAR MARKET, BY CONDUCTOR, 2019-2028 (USD MILLION)
TABLE 50 ASIA-PACIFIC HOSPITALS IN BUSBAR MARKET, BY CONDUCTOR, 2019-2028 (USD MILLION)
TABLE 51 ASIA-PACIFIC MALLS AND SUPERMARKETS IN BUSBAR MARKET, BY CONDUCTOR, 2019-2028 (USD MILLION)
TABLE 52 ASIA-PACIFIC DATA CENTRE IN BUSBAR MARKET, BY CONDUCTOR, 2019-2028 (USD MILLION)
TABLE 53 ASIA-PACIFIC WAREHOUSES IN BUSBAR MARKET, BY CONDUCTOR, 2019-2028 (USD MILLION)
TABLE 54 ASIA-PACIFIC OTHERS IN BUSBAR MARKET, BY CONDUCTOR, 2019-2028 (USD MILLION)
TABLE 55 ASIA-PACIFIC BUSBAR MARKET, BY COUNTRY, 2019-2028 (USD MILLION)
TABLE 56 ASIA-PACIFIC BUSBAR MARKET, BY CONDUCTOR, 2019-2028 (USD MILLION)
TABLE 57 ASIA-PACIFIC COPPER IN BUSBAR MARKET, BY APPLICATION, 2019-2028 (USD MILLION)
TABLE 58 ASIA-PACIFIC BUSBAR MARKET, BY WEIGHT WISE, 2019-2028 (USD MILLION)
TABLE 59 ASIA-PACIFIC BUSBAR MARKET, BY SHAPE WISE, 2019-2028 (USD MILLION)
TABLE 60 ASIA-PACIFIC BUSBAR MARKET, BY INSULATION, 2019-2028 (USD MILLION)
TABLE 61 ASIA-PACIFIC BUSBAR MARKET, BY LENGTH, 2019-2028 (USD MILLION)
TABLE 62 ASIA-PACIFIC BUSBAR MARKET, BY BUSBAR TYPE, 2019-2028 (USD MILLION)
TABLE 63 ASIA-PACIFIC BUSBAR MARKET, BY POWER RATING, 2019-2028 (USD MILLION)
TABLE 64 ASIA-PACIFIC LOW POWER IN BUSBAR MARKET, BY TYPE, 2019-2028 (USD MILLION)
TABLE 65 ASIA-PACIFIC MEDIUM POWER (125A-800A) IN BUSBAR MARKET, BY TYPE, 2019-2028 (USD MILLION)
TABLE 66 ASIA-PACIFIC HIGH POWER (ABOVE 800A) IN BUSBAR MARKET, BY TYPE, 2019-2028 (USD MILLION)
TABLE 67 ASIA-PACIFIC BUSBAR MARKET, BY END USER, 2019-2028 (USD MILLION)
TABLE 68 ASIA-PACIFIC INDUSTRIAL IN BUSBAR MARKET, BY TYPE, 2019-2028 (USD MILLION)
TABLE 69 ASIA-PACIFIC UTILITIES IN BUSBAR MARKET, BY CONDUCTOR, 2019-2028 (USD MILLION)
TABLE 70 ASIA-PACIFIC MANUFACTURING IN BUSBAR MARKET, BY CONDUCTOR, 2019-2028 (USD MILLION)
TABLE 71 ASIA-PACIFIC TELECOM IN BUSBAR MARKET, BY CONDUCTOR, 2019-2028 (USD MILLION)
TABLE 72 ASIA-PACIFIC AEROSPACE AND DEFENSE IN BUSBAR MARKET, BY CONDUCTOR, 2019-2028 (USD MILLION)
TABLE 73 ASIA-PACIFIC CHEMICALS & PETROLEUM IN BUSBAR MARKET, BY CONDUCTOR, 2019-2028 (USD MILLION)
TABLE 74 ASIA-PACIFIC METAL AND MINING IN BUSBAR MARKET, BY CONDUCTOR, 2019-2028 (USD MILLION)
TABLE 75 ASIA-PACIFIC OTHERS IN BUSBAR MARKET, BY CONDUCTOR, 2019-2028 (USD MILLION)
TABLE 76 ASIA-PACIFIC COMMERCIAL IN BUSBAR MARKET, BY TYPE, 2019-2028 (USD MILLION)
TABLE 77 ASIA-PACIFIC OFFICES IN BUSBAR MARKET, BY CONDUCTOR, 2019-2028 (USD MILLION)
TABLE 78 ASIA-PACIFIC HOSPITAL IN BUSBAR MARKET, BY CONDUCTOR, 2019-2028 (USD MILLION)
TABLE 79 ASIA-PACIFIC MALLS AND SUPERMARKETS IN BUSBAR MARKET, BY CONDUCTOR, 2019-2028 (USD MILLION)
TABLE 80 ASIA-PACIFIC DATA CENTRE IN BUSBAR MARKET, BY CONDUCTOR, 2019-2028 (USD MILLION)
TABLE 81 ASIA-PACIFIC WAREHOUSE IN BUSBAR MARKET, BY CONDUCTOR, 2019-2028 (USD MILLION)
TABLE 82 ASIA-PACIFIC OTHERS IN BUSBAR MARKET, BY CONDUCTOR, 2019-2028 (USD MILLION)
TABLE 83 CHINA BUSBAR MARKET, BY CONDUCTOR, 2019-2028 (USD MILLION)
TABLE 84 CHINA COPPER IN BUSBAR MARKET, BY APPLICATION, 2019-2028 (USD MILLION)
TABLE 85 CHINA BUSBAR MARKET, BY WEIGHT WISE, 2019-2028 (USD MILLION)
TABLE 86 CHINA BUSBAR MARKET, BY SHAPE WISE, 2019-2028 (USD MILLION)
TABLE 87 CHINA BUSBAR MARKET, BY INSULATION, 2019-2028 (USD MILLION)
TABLE 88 CHINA BUSBAR MARKET, BY LENGTH, 2019-2028 (USD MILLION)
TABLE 89 CHINA BUSBAR MARKET, BY BUSBAR TYPE, 2019-2028 (USD MILLION)
TABLE 90 CHINA BUSBAR MARKET, BY POWER RATING, 2019-2028 (USD MILLION)
TABLE 91 CHINA LOW POWER IN BUSBAR MARKET, BY TYPE, 2019-2028 (USD MILLION)
TABLE 92 CHINA MEDIUM POWER (125A-800A) IN BUSBAR MARKET, BY TYPE, 2019-2028 (USD MILLION)
TABLE 93 CHINA HIGH POWER (ABOVE 800A) IN BUSBAR MARKET, BY TYPE, 2019-2028 (USD MILLION)
TABLE 94 CHINA BUSBAR MARKET, BY END USER, 2019-2028 (USD MILLION)
TABLE 95 CHINA INDUSTRIAL IN BUSBAR MARKET, BY TYPE, 2019-2028 (USD MILLION)
TABLE 96 CHINA UTILITIES IN BUSBAR MARKET, BY CONDUCTOR, 2019-2028 (USD MILLION)
TABLE 97 CHINA MANUFACTURING IN BUSBAR MARKET, BY CONDUCTOR, 2019-2028 (USD MILLION)
TABLE 98 CHINA TELECOM IN BUSBAR MARKET, BY CONDUCTOR, 2019-2028 (USD MILLION)
TABLE 99 CHINA AEROSPACE AND DEFENSE IN BUSBAR MARKET, BY CONDUCTOR, 2019-2028 (USD MILLION)
TABLE 100 CHINA CHEMICALS & PETROLEUM IN BUSBAR MARKET, BY CONDUCTOR, 2019-2028 (USD MILLION)
TABLE 101 CHINA METAL AND MINING IN BUSBAR MARKET, BY CONDUCTOR, 2019-2028 (USD MILLION)
TABLE 102 CHINA OTHERS IN BUSBAR MARKET, BY CONDUCTOR, 2019-2028 (USD MILLION)
TABLE 103 CHINA COMMERCIAL IN BUSBAR MARKET, BY TYPE, 2019-2028 (USD MILLION)
TABLE 104 CHINA OFFICES IN BUSBAR MARKET, BY CONDUCTOR, 2019-2028 (USD MILLION)
TABLE 105 CHINA HOSPITAL IN BUSBAR MARKET, BY CONDUCTOR, 2019-2028 (USD MILLION)
TABLE 106 CHINA MALLS AND SUPERMARKETS IN BUSBAR MARKET, BY CONDUCTOR, 2019-2028 (USD MILLION)
TABLE 107 CHINA DATA CENTRE IN BUSBAR MARKET, BY CONDUCTOR, 2019-2028 (USD MILLION)
TABLE 108 CHINA WAREHOUSE IN BUSBAR MARKET, BY CONDUCTOR, 2019-2028 (USD MILLION)
TABLE 109 CHINA OTHERS IN BUSBAR MARKET, BY APPLICATION, 2019-2028 (USD MILLION)
TABLE 110 INDIA BUSBAR MARKET, BY CONDUCTOR, 2019-2028 (USD MILLION)
TABLE 111 INDIA COPPER IN BUSBAR MARKET, BY APPLICATION, 2019-2028 (USD MILLION)
TABLE 112 INDIA BUSBAR MARKET, BY WEIGHT WISE, 2019-2028 (USD MILLION)
TABLE 113 INDIA BUSBAR MARKET, BY SHAPE WISE, 2019-2028 (USD MILLION)
TABLE 114 INDIA BUSBAR MARKET, BY INSULATION, 2019-2028 (USD MILLION)
TABLE 115 INDIA BUSBAR MARKET, BY LENGTH, 2019-2028 (USD MILLION)
TABLE 116 INDIA BUSBAR MARKET, BY BUSBAR TYPE, 2019-2028 (USD MILLION)
TABLE 117 INDIA BUSBAR MARKET, BY POWER RATING, 2019-2028 (USD MILLION)
TABLE 118 INDIA LOW POWER IN BUSBAR MARKET, BY TYPE, 2019-2028 (USD MILLION)
TABLE 119 INDIA MEDIUM POWER (125A-800A) IN BUSBAR MARKET, BY TYPE, 2019-2028 (USD MILLION)
TABLE 120 INDIA HIGH POWER (ABOVE 800A) IN BUSBAR MARKET, BY TYPE, 2019-2028 (USD MILLION)
TABLE 121 INDIA BUSBAR MARKET, BY END USER, 2019-2028 (USD MILLION)
TABLE 122 INDIA INDUSTRIAL IN BUSBAR MARKET, BY TYPE, 2019-2028 (USD MILLION)
TABLE 123 INDIA UTILITIES IN BUSBAR MARKET, BY CONDUCTOR, 2019-2028 (USD MILLION)
TABLE 124 INDIA MANUFACTURING IN BUSBAR MARKET, BY CONDUCTOR, 2019-2028 (USD MILLION)
TABLE 125 INDIA TELECOM IN BUSBAR MARKET, BY CONDUCTOR, 2019-2028 (USD MILLION)
TABLE 126 INDIA AEROSPACE AND DEFENSE IN BUSBAR MARKET, BY CONDUCTOR, 2019-2028 (USD MILLION)
TABLE 127 INDIA CHEMICALS & PETROLEUM IN BUSBAR MARKET, BY CONDUCTOR, 2019-2028 (USD MILLION)
TABLE 128 INDIA METAL AND MINING IN BUSBAR MARKET, BY CONDUCTOR, 2019-2028 (USD MILLION)
TABLE 129 INDIA OTHERS IN BUSBAR MARKET, BY CONDUCTOR, 2019-2028 (USD MILLION)
TABLE 130 INDIA COMMERCIAL IN BUSBAR MARKET, BY TYPE, 2019-2028 (USD MILLION)
TABLE 131 INDIA OFFICES IN BUSBAR MARKET, BY CONDUCTOR, 2019-2028 (USD MILLION)
TABLE 132 INDIA HOSPITAL IN BUSBAR MARKET, BY CONDUCTOR, 2019-2028 (USD MILLION)
TABLE 133 INDIA MALLS AND SUPERMARKETS IN BUSBAR MARKET, BY CONDUCTOR, 2019-2028 (USD MILLION)
TABLE 134 INDIA DATA CENTRE IN BUSBAR MARKET, BY CONDUCTOR, 2019-2028 (USD MILLION)
TABLE 135 INDIA WAREHOUSE IN BUSBAR MARKET, BY CONDUCTOR, 2019-2028 (USD MILLION)
TABLE 136 INDIA OTHERS IN BUSBAR MARKET, BY CONDUCTOR, 2019-2028 (USD MILLION)
TABLE 137 JAPAN BUSBAR MARKET, BY CONDUCTOR, 2019-2028 (USD MILLION)
TABLE 138 JAPAN COPPER IN BUSBAR MARKET, BY APPLICATION, 2019-2028 (USD MILLION)
TABLE 139 JAPAN BUSBAR MARKET, BY WEIGHT WISE, 2019-2028 (USD MILLION)
TABLE 140 JAPAN BUSBAR MARKET, BY SHAPE WISE, 2019-2028 (USD MILLION)
TABLE 141 JAPAN BUSBAR MARKET, BY INSULATION, 2019-2028 (USD MILLION)
TABLE 142 JAPAN BUSBAR MARKET, BY LENGTH, 2019-2028 (USD MILLION)
TABLE 143 JAPAN BUSBAR MARKET, BY BUSBAR TYPE, 2019-2028 (USD MILLION)
TABLE 144 JAPAN BUSBAR MARKET, BY POWER RATING, 2019-2028 (USD MILLION)
TABLE 145 JAPAN LOW POWER IN BUSBAR MARKET, BY TYPE, 2019-2028 (USD MILLION)
TABLE 146 JAPAN MEDIUM POWER (125A-800A) IN BUSBAR MARKET, BY TYPE, 2019-2028 (USD MILLION)
TABLE 147 JAPAN HIGH POWER (ABOVE 800A) IN BUSBAR MARKET, BY TYPE, 2019-2028 (USD MILLION)
TABLE 148 JAPAN BUSBAR MARKET, BY END USER, 2019-2028 (USD MILLION)
TABLE 149 JAPAN INDUSTRIAL IN BUSBAR MARKET, BY TYPE, 2019-2028 (USD MILLION)
TABLE 150 JAPAN UTILITIES IN BUSBAR MARKET, BY CONDUCTOR, 2019-2028 (USD MILLION)
TABLE 151 JAPAN MANUFACTURING IN BUSBAR MARKET, BY CONDUCTOR, 2019-2028 (USD MILLION)
TABLE 152 JAPAN TELECOM IN BUSBAR MARKET, BY CONDUCTOR, 2019-2028 (USD MILLION)
TABLE 153 JAPAN AEROSPACE AND DEFENSE IN BUSBAR MARKET, BY CONDUCTOR, 2019-2028 (USD MILLION)
TABLE 154 JAPAN CHEMICALS & PETROLEUM IN BUSBAR MARKET, BY CONDUCTOR, 2019-2028 (USD MILLION)
TABLE 155 JAPAN METAL AND MINING IN BUSBAR MARKET, BY CONDUCTOR, 2019-2028 (USD MILLION)
TABLE 156 JAPAN OTHERS IN BUSBAR MARKET, BY CONDUCTOR, 2019-2028 (USD MILLION)
TABLE 157 JAPAN COMMERCIAL IN BUSBAR MARKET, BY TYPE, 2019-2028 (USD MILLION)
TABLE 158 JAPAN OFFICES IN BUSBAR MARKET, BY CONDUCTOR, 2019-2028 (USD MILLION)
TABLE 159 JAPAN HOSPITAL IN BUSBAR MARKET, BY CONDUCTOR, 2019-2028 (USD MILLION)
TABLE 160 JAPAN MALLS AND SUPERMARKETS IN BUSBAR MARKET, BY CONDUCTOR, 2019-2028 (USD MILLION)
TABLE 161 JAPAN DATA CENTRE IN BUSBAR MARKET, BY CONDUCTOR, 2019-2028 (USD MILLION)
TABLE 162 JAPAN WAREHOUSE IN BUSBAR MARKET, BY CONDUCTOR, 2019-2028 (USD MILLION)
TABLE 163 JAPAN OTHERS IN BUSBAR MARKET, BY CONDUCTOR, 2019-2028 (USD MILLION)
TABLE 164 SOUTH KOREA BUSBAR MARKET, BY CONDUCTOR, 2019-2028 (USD MILLION)
TABLE 165 SOUTH KOREA COPPER IN BUSBAR MARKET, BY APPLICATION, 2019-2028 (USD MILLION)
TABLE 166 SOUTH KOREA BUSBAR MARKET, BY WEIGHT WISE, 2019-2028 (USD MILLION)
TABLE 167 SOUTH KOREA BUSBAR MARKET, BY SHAPE WISE, 2019-2028 (USD MILLION)
TABLE 168 SOUTH KOREA BUSBAR MARKET, BY INSULATION, 2019-2028 (USD MILLION)
TABLE 169 SOUTH KOREA BUSBAR MARKET, BY LENGTH, 2019-2028 (USD MILLION)
TABLE 170 SOUTH KOREA BUSBAR MARKET, BY BUSBAR TYPE, 2019-2028 (USD MILLION)
TABLE 171 SOUTH KOREA BUSBAR MARKET, BY POWER RATING, 2019-2028 (USD MILLION)
TABLE 172 SOUTH KOREA LOW POWER IN BUSBAR MARKET, BY TYPE, 2019-2028 (USD MILLION)
TABLE 173 SOUTH KOREA MEDIUM POWER (125A-800A) IN BUSBAR MARKET, BY TYPE, 2019-2028 (USD MILLION)
TABLE 174 SOUTH KOREA HIGH POWER (ABOVE 800A) IN BUSBAR MARKET, BY TYPE, 2019-2028 (USD MILLION)
TABLE 175 SOUTH KOREA BUSBAR MARKET, BY END USER, 2019-2028 (USD MILLION)
TABLE 176 SOUTH KOREA INDUSTRIAL IN BUSBAR MARKET, BY TYPE, 2019-2028 (USD MILLION)
TABLE 177 SOUTH KOREA UTILITIES IN BUSBAR MARKET, BY CONDUCTOR, 2019-2028 (USD MILLION)
TABLE 178 SOUTH KOREA MANUFACTURING IN BUSBAR MARKET, BY CONDUCTOR, 2019-2028 (USD MILLION)
TABLE 179 SOUTH KOREA TELECOM IN BUSBAR MARKET, BY CONDUCTOR, 2019-2028 (USD MILLION)
TABLE 180 SOUTH KOREA AEROSPACE AND DEFENSE IN BUSBAR MARKET, BY CONDUCTOR, 2019-2028 (USD MILLION)
TABLE 181 SOUTH KOREA CHEMICALS & PETROLEUM IN BUSBAR MARKET, BY CONDUCTOR, 2019-2028 (USD MILLION)
TABLE 182 SOUTH KOREA METAL AND MINING IN BUSBAR MARKET, BY CONDUCTOR, 2019-2028 (USD MILLION)
TABLE 183 SOUTH KOREA OTHERS IN BUSBAR MARKET, BY CONDUCTOR, 2019-2028 (USD MILLION)
TABLE 184 SOUTH KOREA COMMERCIAL IN BUSBAR MARKET, BY TYPE, 2019-2028 (USD MILLION)
TABLE 185 SOUTH KOREA OFFICES IN BUSBAR MARKET, BY CONDUCTOR, 2019-2028 (USD MILLION)
TABLE 186 SOUTH KOREA HOSPITAL IN BUSBAR MARKET, BY CONDUCTOR, 2019-2028 (USD MILLION)
TABLE 187 SOUTH KOREA MALLS AND SUPERMARKETS IN BUSBAR MARKET, BY CONDUCTOR, 2019-2028 (USD MILLION)
TABLE 188 SOUTH KOREA DATA CENTRE IN BUSBAR MARKET, BY CONDUCTOR, 2019-2028 (USD MILLION)
TABLE 189 SOUTH KOREA WAREHOUSE IN BUSBAR MARKET, BY CONDUCTOR, 2019-2028 (USD MILLION)
TABLE 190 SOUTH KOREA OTHERS IN BUSBAR MARKET, BY CONDUCTOR, 2019-2028 (USD MILLION)
TABLE 191 AUSTRALIA BUSBAR MARKET, BY CONDUCTOR, 2019-2028 (USD MILLION)
TABLE 192 AUSTRALIA COPPER IN BUSBAR MARKET, BY APPLICATION, 2019-2028 (USD MILLION)
TABLE 193 AUSTRALIA BUSBAR MARKET, BY WEIGHT WISE, 2019-2028 (USD MILLION)
TABLE 194 AUSTRALIA BUSBAR MARKET, BY SHAPE WISE, 2019-2028 (USD MILLION)
TABLE 195 AUSTRALIA BUSBAR MARKET, BY INSULATION, 2019-2028 (USD MILLION)
TABLE 196 AUSTRALIA BUSBAR MARKET, BY LENGTH, 2019-2028 (USD MILLION)
TABLE 197 AUSTRALIA BUSBAR MARKET, BY BUSBAR TYPE, 2019-2028 (USD MILLION)
TABLE 198 AUSTRALIA BUSBAR MARKET, BY POWER RATING, 2019-2028 (USD MILLION)
TABLE 199 AUSTRALIA LOW POWER IN BUSBAR MARKET, BY TYPE, 2019-2028 (USD MILLION)
TABLE 200 AUSTRALIA MEDIUM POWER (125A-800A) IN BUSBAR MARKET, BY TYPE, 2019-2028 (USD MILLION)
TABLE 201 AUSTRALIA HIGH POWER (ABOVE 800A) IN BUSBAR MARKET, BY TYPE, 2019-2028 (USD MILLION)
TABLE 202 AUSTRALIA BUSBAR MARKET, BY END USER, 2019-2028 (USD MILLION)
TABLE 203 AUSTRALIA INDUSTRIAL IN BUSBAR MARKET, BY TYPE, 2019-2028 (USD MILLION)
TABLE 204 AUSTRALIA UTILITIES IN BUSBAR MARKET, BY CONDUCTOR, 2019-2028 (USD MILLION)
TABLE 205 AUSTRALIA MANUFACTURING IN BUSBAR MARKET, BY CONDUCTOR, 2019-2028 (USD MILLION)
TABLE 206 AUSTRALIA TELECOM IN BUSBAR MARKET, BY CONDUCTOR, 2019-2028 (USD MILLION)
TABLE 207 AUSTRALIA AEROSPACE AND DEFENSE IN BUSBAR MARKET, BY CONDUCTOR, 2019-2028 (USD MILLION)
TABLE 208 AUSTRALIA CHEMICALS & PETROLEUM IN BUSBAR MARKET, BY CONDUCTOR, 2019-2028 (USD MILLION)
TABLE 209 AUSTRALIA METAL AND MINING IN BUSBAR MARKET, BY CONDUCTOR, 2019-2028 (USD MILLION)
TABLE 210 AUSTRALIA OTHERS IN BUSBAR MARKET, BY CONDUCTOR, 2019-2028 (USD MILLION)
TABLE 211 AUSTRALIA COMMERCIAL IN BUSBAR MARKET, BY TYPE, 2019-2028 (USD MILLION)
TABLE 212 AUSTRALIA OFFICES IN BUSBAR MARKET, BY CONDUCTOR, 2019-2028 (USD MILLION)
TABLE 213 AUSTRALIA HOSPITAL IN BUSBAR MARKET, BY CONDUCTOR, 2019-2028 (USD MILLION)
TABLE 214 AUSTRALIA MALLS AND SUPERMARKETS IN BUSBAR MARKET, BY CONDUCTOR, 2019-2028 (USD MILLION)
TABLE 215 AUSTRALIA DATA CENTRE IN BUSBAR MARKET, BY CONDUCTOR, 2019-2028 (USD MILLION)
TABLE 216 AUSTRALIA WAREHOUSE IN BUSBAR MARKET, BY CONDUCTOR, 2019-2028 (USD MILLION)
TABLE 217 AUSTRALIA OTHERS IN BUSBAR MARKET, BY CONDUCTOR, 2019-2028 (USD MILLION)
TABLE 218 INDONESIA BUSBAR MARKET, BY CONDUCTOR, 2019-2028 (USD MILLION)
TABLE 219 INDONESIA COPPER IN BUSBAR MARKET, BY APPLICATION, 2019-2028 (USD MILLION)
TABLE 220 INDONESIA BUSBAR MARKET, BY WEIGHT WISE, 2019-2028 (USD MILLION)
TABLE 221 INDONESIA BUSBAR MARKET, BY SHAPE WISE, 2019-2028 (USD MILLION)
TABLE 222 INDONESIA BUSBAR MARKET, BY INSULATION, 2019-2028 (USD MILLION)
TABLE 223 INDONESIA BUSBAR MARKET, BY LENGTH, 2019-2028 (USD MILLION)
TABLE 224 INDONESIA BUSBAR MARKET, BY BUSBAR TYPE, 2019-2028 (USD MILLION)
TABLE 225 INDONESIA BUSBAR MARKET, BY POWER RATING, 2019-2028 (USD MILLION)
TABLE 226 INDONESIA LOW POWER IN BUSBAR MARKET, BY TYPE, 2019-2028 (USD MILLION)
TABLE 227 INDONESIA MEDIUM POWER (125A-800A) IN BUSBAR MARKET, BY TYPE, 2019-2028 (USD MILLION)
TABLE 228 INDONESIA HIGH POWER (ABOVE 800A) IN BUSBAR MARKET, BY TYPE, 2019-2028 (USD MILLION)
TABLE 229 INDONESIA BUSBAR MARKET, BY END USER, 2019-2028 (USD MILLION)
TABLE 230 INDONESIA INDUSTRIAL IN BUSBAR MARKET, BY TYPE, 2019-2028 (USD MILLION)
TABLE 231 INDONESIA UTILITIES IN BUSBAR MARKET, BY CONDUCTOR, 2019-2028 (USD MILLION)
TABLE 232 INDONESIA MANUFACTURING IN BUSBAR MARKET, BY CONDUCTOR, 2019-2028 (USD MILLION)
TABLE 233 INDONESIA TELECOM IN BUSBAR MARKET, BY CONDUCTOR, 2019-2028 (USD MILLION)
TABLE 234 INDONESIA AEROSPACE AND DEFENSE IN BUSBAR MARKET, BY CONDUCTOR, 2019-2028 (USD MILLION)
TABLE 235 INDONESIA CHEMICALS & PETROLEUM IN BUSBAR MARKET, BY CONDUCTOR, 2019-2028 (USD MILLION)
TABLE 236 INDONESIA METAL AND MINING IN BUSBAR MARKET, BY CONDUCTOR, 2019-2028 (USD MILLION)
TABLE 237 INDONESIA OTHERS IN BUSBAR MARKET, BY CONDUCTOR, 2019-2028 (USD MILLION)
TABLE 238 INDONESIA COMMERCIAL IN BUSBAR MARKET, BY TYPE, 2019-2028 (USD MILLION)
TABLE 239 INDONESIA OFFICES IN BUSBAR MARKET, BY CONDUCTOR, 2019-2028 (USD MILLION)
TABLE 240 INDONESIA HOSPITAL IN BUSBAR MARKET, BY CONDUCTOR, 2019-2028 (USD MILLION)
TABLE 241 INDONESIA MALLS AND SUPERMARKETS IN BUSBAR MARKET, BY CONDUCTOR, 2019-2028 (USD MILLION)
TABLE 242 INDONESIA DATA CENTRE IN BUSBAR MARKET, BY CONDUCTOR, 2019-2028 (USD MILLION)
TABLE 243 INDONESIA WAREHOUSE IN BUSBAR MARKET, BY CONDUCTOR, 2019-2028 (USD MILLION)
TABLE 244 INDONESIA OTHERS IN BUSBAR MARKET, BY CONDUCTOR, 2019-2028 (USD MILLION)
TABLE 245 THAILAND BUSBAR MARKET, BY CONDUCTOR, 2019-2028 (USD MILLION)
TABLE 246 THAILAND COPPER IN BUSBAR MARKET, BY APPLICATION, 2019-2028 (USD MILLION)
TABLE 247 THAILAND BUSBAR MARKET, BY WEIGHT WISE, 2019-2028 (USD MILLION)
TABLE 248 THAILAND BUSBAR MARKET, BY SHAPE WISE, 2019-2028 (USD MILLION)
TABLE 249 THAILAND BUSBAR MARKET, BY INSULATION, 2019-2028 (USD MILLION)
TABLE 250 THAILAND BUSBAR MARKET, BY LENGTH, 2019-2028 (USD MILLION)
TABLE 251 THAILAND BUSBAR MARKET, BY BUSBAR TYPE, 2019-2028 (USD MILLION)
TABLE 252 THAILAND BUSBAR MARKET, BY POWER RATING, 2019-2028 (USD MILLION)
TABLE 253 THAILAND LOW POWER IN BUSBAR MARKET, BY TYPE, 2019-2028 (USD MILLION)
TABLE 254 THAILAND MEDIUM POWER (125A-800A) IN BUSBAR MARKET, BY TYPE, 2019-2028 (USD MILLION)
TABLE 255 THAILAND HIGH POWER (ABOVE 800A) IN BUSBAR MARKET, BY TYPE, 2019-2028 (USD MILLION)
TABLE 256 THAILAND BUSBAR MARKET, BY END USER, 2019-2028 (USD MILLION)
TABLE 257 THAILAND INDUSTRIAL IN BUSBAR MARKET, BY TYPE, 2019-2028 (USD MILLION)
TABLE 258 THAILAND UTILITIES IN BUSBAR MARKET, BY CONDUCTOR, 2019-2028 (USD MILLION)
TABLE 259 THAILAND MANUFACTURING IN BUSBAR MARKET, BY CONDUCTOR, 2019-2028 (USD MILLION)
TABLE 260 THAILAND TELECOM IN BUSBAR MARKET, BY CONDUCTOR, 2019-2028 (USD MILLION)
TABLE 261 THAILAND AEROSPACE AND DEFENSE IN BUSBAR MARKET, BY CONDUCTOR, 2019-2028 (USD MILLION)
TABLE 262 THAILAND CHEMICALS & PETROLEUM IN BUSBAR MARKET, BY CONDUCTOR, 2019-2028 (USD MILLION)
TABLE 263 THAILAND METAL AND MINING IN BUSBAR MARKET, BY CONDUCTOR, 2019-2028 (USD MILLION)
TABLE 264 THAILAND OTHERS IN BUSBAR MARKET, BY CONDUCTOR, 2019-2028 (USD MILLION)
TABLE 265 THAILAND COMMERCIAL IN BUSBAR MARKET, BY TYPE, 2019-2028 (USD MILLION)
TABLE 266 THAILAND OFFICES IN BUSBAR MARKET, BY CONDUCTOR, 2019-2028 (USD MILLION)
TABLE 267 THAILAND HOSPITAL IN BUSBAR MARKET, BY CONDUCTOR, 2019-2028 (USD MILLION)
TABLE 268 THAILAND MALLS AND SUPERMARKETS IN BUSBAR MARKET, BY CONDUCTOR, 2019-2028 (USD MILLION)
TABLE 269 THAILAND DATA CENTRE IN BUSBAR MARKET, BY CONDUCTOR, 2019-2028 (USD MILLION)
TABLE 270 THAILAND WAREHOUSE IN BUSBAR MARKET, BY CONDUCTOR, 2019-2028 (USD MILLION)
TABLE 271 THAILAND OTHERS IN BUSBAR MARKET, BY CONDUCTOR, 2019-2028 (USD MILLION)
TABLE 272 MALAYSIA BUSBAR MARKET, BY CONDUCTOR, 2019-2028 (USD MILLION)
TABLE 273 MALAYSIA COPPER IN BUSBAR MARKET, BY APPLICATION, 2019-2028 (USD MILLION)
TABLE 274 MALAYSIA BUSBAR MARKET, BY WEIGHT WISE, 2019-2028 (USD MILLION)
TABLE 275 MALAYSIA BUSBAR MARKET, BY SHAPE WISE, 2019-2028 (USD MILLION)
TABLE 276 MALAYSIA BUSBAR MARKET, BY INSULATION, 2019-2028 (USD MILLION)
TABLE 277 MALAYSIA BUSBAR MARKET, BY LENGTH, 2019-2028 (USD MILLION)
TABLE 278 MALAYSIA BUSBAR MARKET, BY BUSBAR TYPE, 2019-2028 (USD MILLION)
TABLE 279 MALAYSIA BUSBAR MARKET, BY POWER RATING, 2019-2028 (USD MILLION)
TABLE 280 MALAYSIA LOW POWER IN BUSBAR MARKET, BY TYPE, 2019-2028 (USD MILLION)
TABLE 281 MALAYSIA MEDIUM POWER (125A-800A) IN BUSBAR MARKET, BY TYPE, 2019-2028 (USD MILLION)
TABLE 282 MALAYSIA HIGH POWER (ABOVE 800A) IN BUSBAR MARKET, BY TYPE, 2019-2028 (USD MILLION)
TABLE 283 MALAYSIA BUSBAR MARKET, BY END USER, 2019-2028 (USD MILLION)
TABLE 284 MALAYSIA INDUSTRIAL IN BUSBAR MARKET, BY TYPE, 2019-2028 (USD MILLION)
TABLE 285 MALAYSIA UTILITIES IN BUSBAR MARKET, BY CONDUCTOR, 2019-2028 (USD MILLION)
TABLE 286 MALAYSIA MANUFACTURING IN BUSBAR MARKET, BY CONDUCTOR, 2019-2028 (USD MILLION)
TABLE 287 MALAYSIA TELECOM IN BUSBAR MARKET, BY CONDUCTOR, 2019-2028 (USD MILLION)
TABLE 288 MALAYSIA AEROSPACE AND DEFENSE IN BUSBAR MARKET, BY CONDUCTOR, 2019-2028 (USD MILLION)
TABLE 289 MALAYSIA CHEMICALS & PETROLEUM IN BUSBAR MARKET, BY CONDUCTOR, 2019-2028 (USD MILLION)
TABLE 290 MALAYSIA METAL AND MINING IN BUSBAR MARKET, BY CONDUCTOR, 2019-2028 (USD MILLION)
TABLE 291 MALAYSIA OTHERS IN BUSBAR MARKET, BY CONDUCTOR, 2019-2028 (USD MILLION)
TABLE 292 MALAYSIA COMMERCIAL IN BUSBAR MARKET, BY TYPE, 2019-2028 (USD MILLION)
TABLE 293 MALAYSIA OFFICES IN BUSBAR MARKET, BY CONDUCTOR, 2019-2028 (USD MILLION)
TABLE 294 MALAYSIA HOSPITAL IN BUSBAR MARKET, BY CONDUCTOR, 2019-2028 (USD MILLION)
TABLE 295 MALAYSIA MALLS AND SUPERMARKETS IN BUSBAR MARKET, BY CONDUCTOR, 2019-2028 (USD MILLION)
TABLE 296 MALAYSIA DATA CENTRE IN BUSBAR MARKET, BY CONDUCTOR, 2019-2028 (USD MILLION)
TABLE 297 MALAYSIA WAREHOUSE IN BUSBAR MARKET, BY CONDUCTOR, 2019-2028 (USD MILLION)
TABLE 298 MALAYSIA OTHERS IN BUSBAR MARKET, BY CONDUCTOR, 2019-2028 (USD MILLION)
TABLE 299 PHILIPPINES BUSBAR MARKET, BY CONDUCTOR, 2019-2028 (USD MILLION)
TABLE 300 PHILIPPINES COPPER IN BUSBAR MARKET, BY APPLICATION, 2019-2028 (USD MILLION)
TABLE 301 PHILIPPINES BUSBAR MARKET, BY WEIGHT WISE, 2019-2028 (USD MILLION)
TABLE 302 PHILIPPINES BUSBAR MARKET, BY SHAPE WISE, 2019-2028 (USD MILLION)
TABLE 303 PHILIPPINES BUSBAR MARKET, BY INSULATION, 2019-2028 (USD MILLION)
TABLE 304 PHILIPPINES BUSBAR MARKET, BY LENGTH, 2019-2028 (USD MILLION)
TABLE 305 PHILIPPINES BUSBAR MARKET, BY BUSBAR TYPE, 2019-2028 (USD MILLION)
TABLE 306 PHILIPPINES BUSBAR MARKET, BY POWER RATING, 2019-2028 (USD MILLION)
TABLE 307 PHILIPPINES LOW POWER IN BUSBAR MARKET, BY TYPE, 2019-2028 (USD MILLION)
TABLE 308 PHILIPPINES MEDIUM POWER (125A-800A) IN BUSBAR MARKET, BY TYPE, 2019-2028 (USD MILLION)
TABLE 309 PHILIPPINES HIGH POWER (ABOVE 800A) IN BUSBAR MARKET, BY TYPE, 2019-2028 (USD MILLION)
TABLE 310 PHILIPPINES BUSBAR MARKET, BY END USER, 2019-2028 (USD MILLION)
TABLE 311 PHILIPPINES INDUSTRIAL IN BUSBAR MARKET, BY TYPE, 2019-2028 (USD MILLION)
TABLE 312 PHILIPPINES THAILAND UTILITIES IN BUSBAR MARKET, BY CONDUCTOR, 2019-2028 (USD MILLION)
TABLE 313 PHILIPPINES MANUFACTURING IN BUSBAR MARKET, BY CONDUCTOR, 2019-2028 (USD MILLION)
TABLE 314 PHILIPPINES TELECOM IN BUSBAR MARKET, BY CONDUCTOR, 2019-2028 (USD MILLION)
TABLE 315 PHILIPPINES AEROSPACE AND DEFENSE IN BUSBAR MARKET, BY CONDUCTOR, 2019-2028 (USD MILLION)
TABLE 316 PHILIPPINES CHEMICALS & PETROLEUM IN BUSBAR MARKET, BY CONDUCTOR, 2019-2028 (USD MILLION)
TABLE 317 PHILIPPINES METAL AND MINING IN BUSBAR MARKET, BY CONDUCTOR, 2019-2028 (USD MILLION)
TABLE 318 PHILIPPINES OTHERS IN BUSBAR MARKET, BY CONDUCTOR, 2019-2028 (USD MILLION)
TABLE 319 PHILIPPINES COMMERCIAL IN BUSBAR MARKET, BY TYPE, 2019-2028 (USD MILLION)
TABLE 320 PHILIPPINES OFFICES IN BUSBAR MARKET, BY CONDUCTOR, 2019-2028 (USD MILLION)
TABLE 321 PHILIPPINES HOSPITAL IN BUSBAR MARKET, BY CONDUCTOR, 2019-2028 (USD MILLION)
TABLE 322 PHILIPPINES MALLS AND SUPERMARKETS IN BUSBAR MARKET, BY CONDUCTOR, 2019-2028 (USD MILLION)
TABLE 323 PHILIPPINES DATA CENTRE IN BUSBAR MARKET, BY CONDUCTOR, 2019-2028 (USD MILLION)
TABLE 324 PHILIPPINES WAREHOUSE IN BUSBAR MARKET, BY CONDUCTOR, 2019-2028 (USD MILLION)
TABLE 325 PHILIPPINES OTHERS IN BUSBAR MARKET, BY CONDUCTOR, 2019-2028 (USD MILLION)
TABLE 326 SINGAPORE BUSBAR MARKET, BY CONDUCTOR, 2019-2028 (USD MILLION)
TABLE 327 SINGAPORE COPPER IN BUSBAR MARKET, BY APPLICATION, 2019-2028 (USD MILLION)
TABLE 328 SINGAPORE BUSBAR MARKET, BY WEIGHT WISE, 2019-2028 (USD MILLION)
TABLE 329 SINGAPORE BUSBAR MARKET, BY SHAPE WISE, 2019-2028 (USD MILLION)
TABLE 330 SINGAPORE BUSBAR MARKET, BY INSULATION, 2019-2028 (USD MILLION)
TABLE 331 SINGAPORE BUSBAR MARKET, BY LENGTH, 2019-2028 (USD MILLION)
TABLE 332 SINGAPORE BUSBAR MARKET, BY BUSBAR TYPE, 2019-2028 (USD MILLION)
TABLE 333 SINGAPORE BUSBAR MARKET, BY POWER RATING, 2019-2028 (USD MILLION)
TABLE 334 SINGAPORE LOW POWER IN BUSBAR MARKET, BY TYPE, 2019-2028 (USD MILLION)
TABLE 335 SINGAPORE MEDIUM POWER (125A-800A) IN BUSBAR MARKET, BY TYPE, 2019-2028 (USD MILLION)
TABLE 336 SINGAPORE HIGH POWER (ABOVE 800A) IN BUSBAR MARKET, BY TYPE, 2019-2028 (USD MILLION)
TABLE 337 SINGAPORE BUSBAR MARKET, BY END USER, 2019-2028 (USD MILLION)
TABLE 338 SINGAPORE INDUSTRIAL IN BUSBAR MARKET, BY TYPE, 2019-2028 (USD MILLION)
TABLE 339 SINGAPORE THAILAND UTILITIES IN BUSBAR MARKET, BY CONDUCTOR, 2019-2028 (USD MILLION)
TABLE 340 SINGAPORE MANUFACTURING IN BUSBAR MARKET, BY CONDUCTOR, 2019-2028 (USD MILLION)
TABLE 341 SINGAPORE TELECOM IN BUSBAR MARKET, BY CONDUCTOR, 2019-2028 (USD MILLION)
TABLE 342 SINGAPORE AEROSPACE AND DEFENSE IN BUSBAR MARKET, BY CONDUCTOR, 2019-2028 (USD MILLION)
TABLE 343 SINGAPORE CHEMICALS & PETROLEUM IN BUSBAR MARKET, BY CONDUCTOR, 2019-2028 (USD MILLION)
TABLE 344 SINGAPORE METAL AND MINING IN BUSBAR MARKET, BY CONDUCTOR, 2019-2028 (USD MILLION)
TABLE 345 SINGAPORE OTHERS IN BUSBAR MARKET, BY CONDUCTOR, 2019-2028 (USD MILLION)
TABLE 346 SINGAPORE COMMERCIAL IN BUSBAR MARKET, BY TYPE, 2019-2028 (USD MILLION)
TABLE 347 SINGAPORE OFFICES IN BUSBAR MARKET, BY CONDUCTOR, 2019-2028 (USD MILLION)
TABLE 348 SINGAPORE HOSPITAL IN BUSBAR MARKET, BY CONDUCTOR, 2019-2028 (USD MILLION)
TABLE 349 SINGAPORE MALLS AND SUPERMARKETS IN BUSBAR MARKET, BY CONDUCTOR, 2019-2028 (USD MILLION)
TABLE 350 SINGAPORE DATA CENTRE IN BUSBAR MARKET, BY CONDUCTOR, 2019-2028 (USD MILLION)
TABLE 351 SINGAPORE WAREHOUSE IN BUSBAR MARKET, BY CONDUCTOR, 2019-2028 (USD MILLION)
TABLE 352 SINGAPORE OTHERS IN BUSBAR MARKET, BY CONDUCTOR, 2019-2028 (USD MILLION)
TABLE 353 REST OF ASIA-PACIFIC BUSBAR MARKET, BY CONDUCTOR, 2019-2028 (USD MILLION)
Lista de figuras
FIGURE 1 ASIA-PACIFIC BUSBAR MARKET: SEGMENTATION
FIGURE 2 ASIA-PACIFIC BUSBAR MARKET: DATA TRIANGULATION
FIGURE 3 ASIA-PACIFIC BUSBAR MARKET: DROC ANALYSIS
FIGURE 4 ASIA-PACIFIC BUSBAR MARKET: ASIA-PACIFIC VS REGIONAL MARKET ANALYSIS
FIGURE 5 ASIA-PACIFIC BUSBAR MARKET: COMPANY RESEARCH ANALYSIS
FIGURE 6 ASIA-PACIFIC BUSBAR MARKET: INTERVIEW DEMOGRAPHICS
FIGURE 7 ASIA-PACIFIC BUSBAR MARKET: DBMR MARKET POSITION GRID
FIGURE 8 ASIA-PACIFIC BUSBAR MARKET: VENDOR SHARE ANALYSIS
FIGURE 9 ASIA-PACIFIC BUSBAR MARKET: MARKET END USER COVERED GRID
FIGURE 10 ASIA-PACIFIC BUSBAR MARKET: SEGMENTATION
FIGURE 11 THE RISE IN DEMAND FOR ELECTRICITY ACROSS RESIDENTIAL, COMMERCIAL, AND INDUSTRIAL SECTOR IS EXPECTED TO DRIVE THE ASIA-PACIFIC BUSBAR MARKET IN THE FORECAST PERIOD OF 2021 TO 2028
FIGURE 12 COPPER WIRE SEGMENT IS EXPECTED TO ACCOUNT FOR THE LARGEST SHARE OF THE ASIA-PACIFIC BUSBAR MARKET IN 2021 & 2028
FIGURE 13 BREAKDOWN OF NUCLEAR POWER PLANT O&M COSTS
FIGURE 14 DRIVERS, RESTRAINTS, OPPORTUNITIES AND CHALLENGES OF ASIA-PACIFIC BUSBAR MARKET
FIGURE 15 ENERGY INTENSITY IN VARIOUS COUNTRIES
FIGURE 16 TOTAL ENERGY CAPACITY BY FUEL TYPE (MW), 2016
FIGURE 17 ANNUAL SMART GRID INVESTMENT
FIGURE 18 INVESTMENT IN SMART GRID TECHNOLOGY
FIGURE 19 INDUSTRIAL ENERGY CONSUMPTION
FIGURE 20 URBAN MANAGEMENT MODEL FOR DECENTERALIZATION OF POWER ELECTRIC SYSTEM IN SMART CITY
FIGURE 21 COMMODITY DEMAND CHANGE-100%EV
FIGURE 22 ASIA-PACIFIC BUSBAR MARKET: BY CONDUCTOR, 2020
FIGURE 23 ASIA-PACIFIC BUSBAR MARKET: BY WEIGHT WISE, 2020
FIGURE 24 ASIA-PACIFIC BUSBAR MARKET: BY SHAPE WISE, 2020
FIGURE 25 ASIA-PACIFIC BUSBAR MARKET: BY INSULATION, 2020
FIGURE 26 ASIA-PACIFIC BUSBAR MARKET: BY LENGTH, 2020
FIGURE 27 ASIA-PACIFIC BUSBAR MARKET: BY BUSBAR TYPE, 2020
FIGURE 28 ASIA-PACIFIC BUSBAR MARKET: BY POWER RATING, 2020
FIGURE 29 ASIA-PACIFIC BUSBAR MARKET: BY END USER, 2020
FIGURE 30 ASIA-PACIFIC BUSBAR MARKET: SNAPSHOT (2020)
FIGURE 31 ASIA-PACIFIC BUSBAR MARKET: BY COUNTRY (2020)
FIGURE 32 ASIA-PACIFIC BUSBAR MARKET: BY COUNTRY (2021 & 2028)
FIGURE 33 ASIA-PACIFIC BUSBAR MARKET: BY COUNTRY (2020 & 2028)
FIGURE 34 ASIA-PACIFIC BUSBAR MARKET: BY CONDUCTOR (2021-2028)
FIGURE 35 ASIA-PACIFIC BUSBAR MARKET: COMPANY SHARE 2020 (%)
Metodología de investigación
La recopilación de datos y el análisis del año base se realizan utilizando módulos de recopilación de datos con muestras de gran tamaño. La etapa incluye la obtención de información de mercado o datos relacionados a través de varias fuentes y estrategias. Incluye el examen y la planificación de todos los datos adquiridos del pasado con antelación. Asimismo, abarca el examen de las inconsistencias de información observadas en diferentes fuentes de información. Los datos de mercado se analizan y estiman utilizando modelos estadísticos y coherentes de mercado. Además, el análisis de la participación de mercado y el análisis de tendencias clave son los principales factores de éxito en el informe de mercado. Para obtener más información, solicite una llamada de un analista o envíe su consulta.
La metodología de investigación clave utilizada por el equipo de investigación de DBMR es la triangulación de datos, que implica la extracción de datos, el análisis del impacto de las variables de datos en el mercado y la validación primaria (experto en la industria). Los modelos de datos incluyen cuadrícula de posicionamiento de proveedores, análisis de línea de tiempo de mercado, descripción general y guía del mercado, cuadrícula de posicionamiento de la empresa, análisis de patentes, análisis de precios, análisis de participación de mercado de la empresa, estándares de medición, análisis global versus regional y de participación de proveedores. Para obtener más información sobre la metodología de investigación, envíe una consulta para hablar con nuestros expertos de la industria.
Personalización disponible
Data Bridge Market Research es líder en investigación formativa avanzada. Nos enorgullecemos de brindar servicios a nuestros clientes existentes y nuevos con datos y análisis que coinciden y se adaptan a sus objetivos. El informe se puede personalizar para incluir análisis de tendencias de precios de marcas objetivo, comprensión del mercado de países adicionales (solicite la lista de países), datos de resultados de ensayos clínicos, revisión de literatura, análisis de mercado renovado y base de productos. El análisis de mercado de competidores objetivo se puede analizar desde análisis basados en tecnología hasta estrategias de cartera de mercado. Podemos agregar tantos competidores sobre los que necesite datos en el formato y estilo de datos que esté buscando. Nuestro equipo de analistas también puede proporcionarle datos en archivos de Excel sin procesar, tablas dinámicas (libro de datos) o puede ayudarlo a crear presentaciones a partir de los conjuntos de datos disponibles en el informe.

