

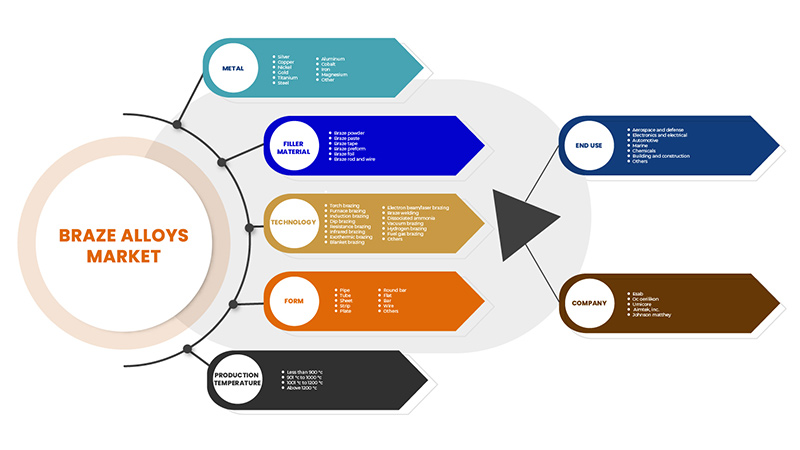
Asia-Pacific Braze Alloys Market, By Metal (Nickel, Cobalt, Silver, Gold, Aluminum, Copper, Steel, Iron, Magnesium, Titanium and Others), Filler Material (Braze Powder, Braze Paste, Braze Tape, Braze Preform, Braze Foil and Braze Rod and Wire), Technology (Torch Brazing, Furnace Brazing, Induction Brazing, Dip Brazing, Resistance Brazing, Infrared Brazing, Exothermic Brazing, Blanket Brazing, Electron Beam/Laser Brazing, Braze Welding, Dissociated Ammonia, Vacuum Brazing, Hydrogen Brazing, Fuel Gas Brazing and Others), Form (Pipe, Tube, Sheet, Strip, Plate, Round Bar, Flat, Bar, Wire and Others), Production Temperature (Less than 900 °C, 901 °C to 1000 °C, 1001 °C to 1200 °C and Above 1200 °C), End Use (Aerospace and Defense, Electronics and Electrical, Automotive, Marine, Chemicals, Building and Construction and Others), Industry Trends and Forecast to 2029.
Market Analysis and Insights
Brazing fillers for joining applications are essential for manufacturing and designing advanced materials. Several types of brazing fillers have been developed in recent decades to join similar or different engineering materials. Important parts of automotive and aircraft components, including steel, are often joined by brazing. In addition, ceramic components in microwave devices and circuits have been joined with a high level of integration in microelectronic devices.
Similarly, in the medical field, metallic implants have been brazed to ceramic dental crowns. These advances have made human life more convenient. However, in brazing, there are certain issues with intermetallic compound (IMC) formation and residual stresses in joints at high temperatures.
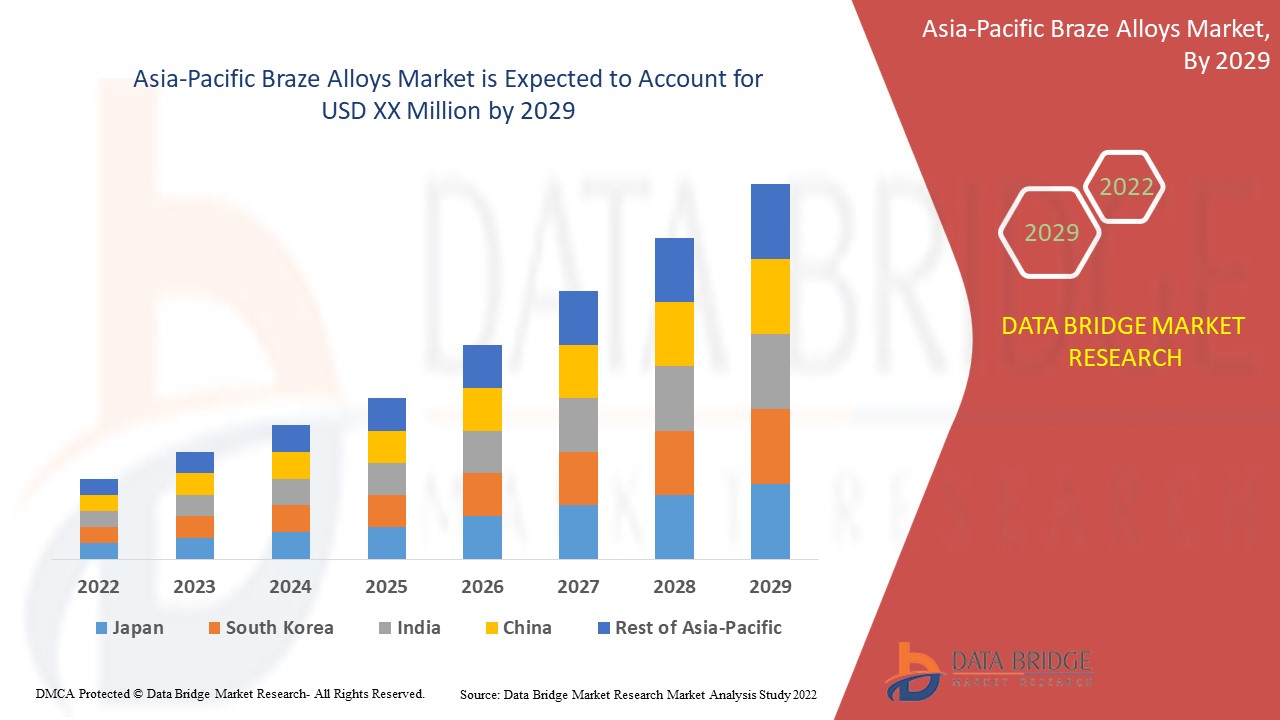
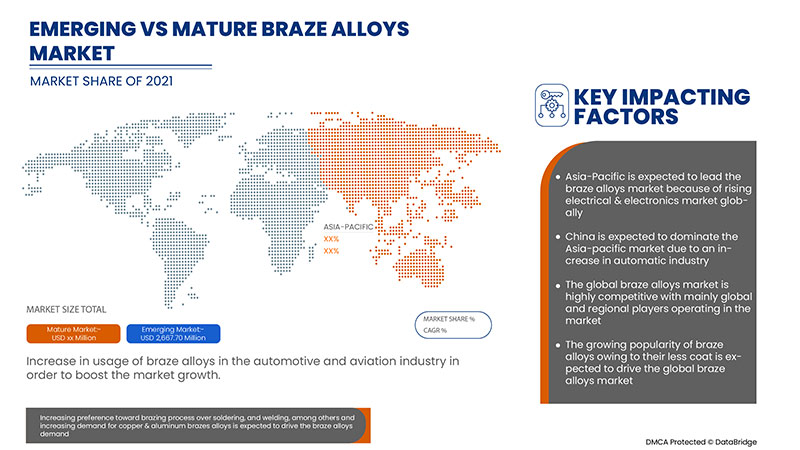
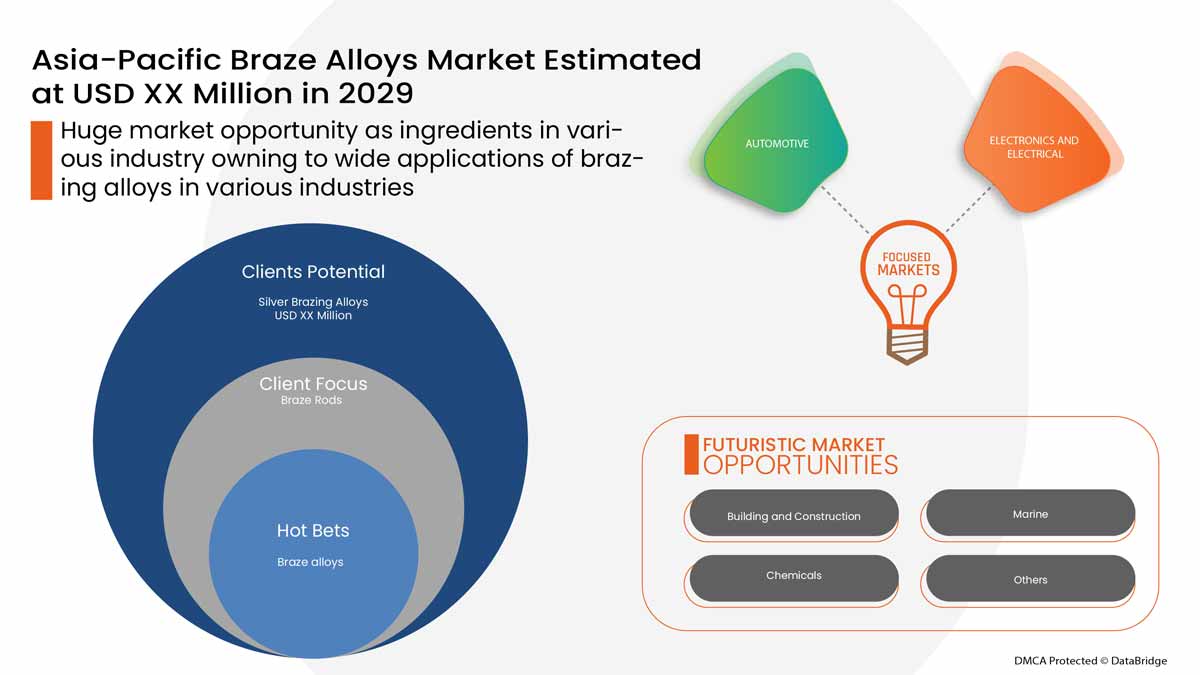
Increasing use of braze alloys coupled with growing application of braze alloys in different end industries including aerospace, buildings, and electronics has surged its demand. Data Bridge Market Research analyses that the Asia-Pacific braze alloys market will grow at a CAGR of 5.2% during the forecast period of 2022 to 2029.
|
Report Metric |
Details |
|
Forecast Period |
2022 to 2029 |
|
Base Year |
2021 |
|
Historic Years |
2020 (Customizable to 2020 - 2014) |
|
Quantitative Units |
Revenue in USD Million, Tons, Pricing in USD |
|
Segments Covered |
Por metal (níquel, cobalto, plata, oro, aluminio, cobre, acero, hierro, magnesio, titanio y otros), material de relleno (polvo de soldadura fuerte, pasta de soldadura fuerte, cinta de soldadura fuerte, preforma de soldadura fuerte, lámina de soldadura fuerte y varilla y alambre de soldadura fuerte), tecnología (soldadura fuerte con soplete, soldadura fuerte en horno, soldadura fuerte por inducción, soldadura fuerte por inmersión, soldadura fuerte por resistencia, soldadura fuerte por infrarrojos, soldadura fuerte exotérmica, soldadura fuerte por manta, soldadura fuerte por haz de electrones/láser, soldadura fuerte, amoníaco disociado, soldadura fuerte al vacío, soldadura fuerte con hidrógeno, soldadura fuerte con gas combustible y otros), forma (tubería, tubo, lámina, tira, placa, barra redonda, plana, barra, alambre y otros), temperatura de producción (menos de 900 °C, de 901 °C a 1000 °C, de 1001 °C a 1200 °C y más de 1200 °C), uso final (aeroespacial y defensa, electrónica y electricidad, automoción, marina, productos químicos, construcción y Construcción y Otros) |
|
Países cubiertos |
China, Japón, Corea del Sur, India, Australia, Singapur, Tailandia, Malasia, Indonesia, Filipinas, Resto de Asia-Pacífico |
|
Actores del mercado cubiertos |
Johnson Matthey, OC Oerlikon Management AG, Morgan Advanced Materials y sus filiales, Aimtek, Inc., AMETEK. Inc., TSI Technologies, ESAB (subsidiaria de Colfax Corporation), Umicore |
Dinámica del mercado de aleaciones para soldadura fuerte en Asia y el Pacífico
Conductores
- Aumento del uso de aleaciones de soldadura fuerte en la industria automotriz y aeronáutica
Las aleaciones para soldadura fuerte están experimentando una demanda significativa en la industria automotriz, donde se utilizan como conexiones de condensadores y evaporadores para sistemas de aire acondicionado, tuberías de inyección de combustible y pastillas de freno. La industria automotriz y de la aviación se ha esforzado por desarrollar componentes automotrices livianos.
- Creciente preferencia por el proceso de soldadura fuerte frente a la soldadura blanda y la soldadura autógena, entre otros.
La soldadura fuerte es un proceso de unión de metales en el que se unen dos o más elementos metálicos fundiendo y haciendo fluir un metal de relleno en la unión. Se utiliza ampliamente para unir conductores metálicos en sistemas de puesta a tierra eléctricos de alta y baja tensión. Este proceso se utiliza actualmente en el Reino Unido, Irlanda y otros países del mundo para crear una unión permanente de dos metales conductores, normalmente cobre o acero.
Oportunidades
- Amplias aplicaciones de aleaciones de soldadura fuerte en diversas industrias.
La soldadura fuerte es un proceso de unión muy utilizado porque permite unir casi todos los metales, excepto el aluminio y el magnesio. Se utiliza para componentes eléctricos, accesorios de tuberías, entre otros. Los metales que tienen un espesor desigual se pueden unir mediante soldadura fuerte. La soldadura fuerte se utiliza para unir una variedad de metales, metales diferentes e incluso no metales.
Restricciones/Desafíos
- Precios fluctuantes de los metales para soldadura fuerte
Los precios de las materias primas están fluctuando actualmente a niveles sin precedentes, tanto en Estados Unidos como en el resto del mundo, ya que los precios se ven afectados por el ajuste de los mercados de oferta. Además de la oferta y la demanda, el otro factor que ha influido en las fluctuaciones a corto plazo de los precios de las materias primas es que los inversores pueden alejarse repentinamente de lo que perciben como apuestas más arriesgadas, incluidas las acciones y las materias primas.
- Efectos adversos de la soldadura fuerte sobre el medio ambiente
La soldadura fuerte es una de las tecnologías fundamentales en la fabricación y se utiliza ampliamente en la industria aeroespacial, el transporte ferroviario, los semiconductores, los aparatos de refrigeración y otros campos.
El proceso tradicional de soldadura fuerte implica efectos ambientales nocivos. La principal causa de la contaminación es el exceso de fundente residual. El proceso de soldadura fuerte incluye la incapacidad de controlar con precisión el fundente. El exceso de fundente residual y la limpieza después de la soldadura fuerte conducen a un grave desperdicio de fundente y contaminación ambiental. Además, afecta la vida útil de la soldadura.
Este informe de mercado de aleaciones de soldadura fuerte proporciona detalles de nuevos desarrollos recientes, regulaciones comerciales, análisis de importación y exportación, análisis de producción, optimización de la cadena de valor, participación de mercado, impacto de los actores del mercado nacional y localizado, analiza oportunidades en términos de bolsillos de ingresos emergentes, cambios en las regulaciones del mercado, análisis estratégico del crecimiento del mercado, tamaño del mercado, crecimientos del mercado de categorías, nichos de aplicación y dominio, aprobaciones de productos, lanzamientos de productos, expansiones geográficas, innovaciones tecnológicas en el mercado. Para obtener más información sobre el mercado de aleaciones de soldadura fuerte, comuníquese con Data Bridge Market Research para obtener un informe de analista, nuestro equipo lo ayudará a tomar una decisión de mercado informada para lograr el crecimiento del mercado.
Impacto posterior al COVID-19 en el mercado de aleaciones para soldadura fuerte
La pandemia de COVID-19 ha alterado en gran medida la cadena de suministro de materias primas utilizadas para fabricar aleaciones de soldadura fuerte y la cadena de suministro de las industrias de los usuarios finales. Se atribuye a la falta de recursos y transporte, lo que provocó un menor acceso, retrasos en el stock y suministros de productos de materias primas. Además, muchos gobiernos restringieron el movimiento de mercancías entre los países y se distorsionó toda la cadena de suministro. Debido a la interrupción de la cadena de suministro, se ha interrumpido el transporte de materias primas, lo que ha paralizado la producción. Del mismo modo, los precios inflados y la interrupción de la producción de aleaciones de soldadura fuerte han dado lugar a una demanda insatisfecha de aleaciones de soldadura fuerte en varios usuarios finales, como la construcción, la electrónica, la industria aeroespacial y la defensa.
La pandemia de COVID-19 también ha tenido efectos adversos en las industrias de usuarios finales de aleaciones para soldadura fuerte. Ha impactado negativamente en la industria de la construcción.
Por ejemplo,
Según datos globales, la producción de la construcción en América del Norte podría disminuir hasta en 122 mil millones de dólares en 2020 como resultado del shock económico de la COVID-19. Antes de la pandemia se preveía un aumento del 0,6% en la producción de la construcción en América del Norte, pero ahora se espera que caiga alrededor del 6,5% en los EE. UU. y el 7% en Canadá.
Como resultado, el mercado de aleaciones de soldadura fuerte también se verá afectado, ya que las técnicas de soldadura fuerte se utilizan en edificios y construcción.
Por lo tanto, se espera que las perturbaciones en la cadena de suministro debido a la pandemia de COVID-19 actúen como un desafío para el mercado de aleaciones de soldadura fuerte de Asia y el Pacífico.
Desarrollo reciente
- En febrero de 2022, OC Oerlikon Management AG amplió su plataforma de pedidos en línea a sus clientes de Asia-Pacífico. Esta expansión ha ayudado a la empresa a atraer a una mayor base de clientes.
Alcance del mercado de aleaciones para soldadura fuerte en Asia y el Pacífico
El mercado de aleaciones para soldadura fuerte de Asia-Pacífico está segmentado en metal, material de relleno, tecnología, forma, temperatura de producción y uso final. El crecimiento entre estos segmentos le ayudará a analizar los segmentos de crecimiento en las industrias y brindará a los usuarios una valiosa descripción general del mercado y conocimientos del mercado para tomar decisiones estratégicas para identificar las principales aplicaciones del mercado.
Rieles
- Plata
- Cobre
- Níquel
- Oro
- Titanio
- Acero
- Aluminio
- Cobalto
- Hierro
- Magnesio
- Otro
Según los metales, el mercado está segmentado en plata, cobre, níquel, oro, titanio, acero, aluminio, cobalto, hierro, magnesio y otros.
Material de relleno
- Pasta para soldar
- Varilla y alambre para soldadura fuerte
- Polvo para soldar
- Preforma de soldadura fuerte
- Lámina de soldadura fuerte
- Cinta de soldadura fuerte
Según el material de relleno, el mercado está segmentado en pasta de soldadura fuerte, varilla y alambre de soldadura fuerte, polvo de soldadura fuerte, preformas de soldadura fuerte, láminas de soldadura fuerte y cinta de soldadura fuerte.
Tecnología
- Soldadura fuerte con soplete
- Soldadura fuerte en horno
- Soldadura fuerte por resistencia
- Soldadura fuerte por inducción
- Soldadura por inmersión
- Soldadura por infrarrojos
- Soldadura fuerte al vacío
- Soldadura fuerte por haz de electrones/láser
- Soldadura fuerte exotérmica
- Soldadura fuerte
- Soldadura fuerte con hidrógeno
- Soldadura fuerte con manta
- Amoniaco disociado
- Soldadura fuerte con gas combustible
- Otros
Según la tecnología, el mercado está segmentado en soldadura fuerte con soplete, soldadura fuerte en horno, soldadura fuerte por resistencia, soldadura fuerte por inducción, soldadura fuerte por inmersión, soldadura fuerte por infrarrojos, soldadura fuerte al vacío, soldadura fuerte por haz de electrones/láser, soldadura fuerte exotérmica, soldadura fuerte, soldadura fuerte con hidrógeno, soldadura fuerte con manta, amoníaco disociado, soldadura fuerte con gas combustible y otros.
Forma
- Cable
- Banda
- Bar
- Tubo
- Tubo
- Departamento
- Hoja
- Lámina
- Barra redonda
- Otros
Según la forma, el mercado se segmenta en alambres, tiras, barras, caños, tubos, planos, láminas, placas, barras redondas y otros.
Temperatura de producción
- 1001 °C a 1200 °C
- Menos de 900 °C
- 901 °C a 1000 °C
- Por encima de 1200 °C
Según la temperatura de producción, el mercado está segmentado en 1001 °C a 1200 °C, menos de 900 °C, 901 °C a 1000 °C y más de 1200 °C.
Uso final
- Automotor
- Aeroespacial y Defensa
- Electrónica y electricidad
- Construcción y edificación
- Productos químicos
- Marina
- Otros
Según el uso final, el mercado está segmentado en automotriz, aeroespacial y defensa, electrónica y eléctrica, construcción y edificación, productos químicos, marino y otros.
Análisis y perspectivas regionales del mercado de aleaciones para soldadura fuerte en Asia y el Pacífico
Se analiza el mercado de aleaciones de soldadura fuerte y se proporcionan información y tendencias del tamaño del mercado por país, metal, material de relleno, tecnología, forma, temperatura de producción y uso final.
Las regiones cubiertas en el informe del mercado de aleaciones de soldadura fuerte son China, Japón, Corea del Sur, India, Australia, Singapur, Tailandia, Malasia, Indonesia, Filipinas y el resto de Asia-Pacífico.
Japón domina la región de Asia y el Pacífico debido a la creciente demanda de metales y aleaciones para soldadura fuerte de diversas industrias finales en la región.
The country section of the report also provides individual market impacting factors and changes in regulations in the market that impact the current and future trends of the market. Data points, such as new and replacement sales, country demographics, disease epidemiology, and import-export tariffs, are some of the major pointers used to forecast the market scenario for individual countries. In addition, the presence and availability of Asia-Pacific brands and their challenges faced due to high competition from local and domestic brands, and impact of sales channels are considered while providing forecast analysis of the country data.
Competitive Landscape and Braze Alloys Market Share Analysis
The Asia-Pacific braze alloys market competitive landscape provides details competitors. Details included are company overview, company financials, revenue generated, market potential, investment in research and development, new market initiatives, GCC presence, production sites and facilities, production capacities, company strengths and weaknesses, product launch, product width and breadth, and application dominance. The above data points provided are only related to the companies' focus on Asia-Pacific braze alloys market.
Some of the major players operating in the Asia-Pacific braze alloys market are Johnson Matthey, OC Oerlikon Management AG, Morgan Advanced Materials and its affiliates, Aimtek, Inc., AMETEK. Inc., TSI Technologies, ESAB (Subsidiary of Colfax Corporation), Umicore among others
Research Methodology
Data collection and base year analysis are done using data collection modules with large sample sizes. The market data is analyzed and estimated using market statistical and coherent models. In addition, market share analysis and key trend analysis are the major success factors in the market report. The key research methodology used by DBMR research team is data triangulation which involves data mining, analysis of the impact of data variables on the market, and primary (industry expert) validation. Apart from this, data models include Vendor Positioning Grid, Market Time Line Analysis, Market Overview and Guide, Company Positioning Grid, Company Market Share Analysis, Standards of Measurement, Asia-Pacific Vs Regional and Vendor Share Analysis. Please request analyst call in case of further inquiry.
SKU-
Obtenga acceso en línea al informe sobre la primera nube de inteligencia de mercado del mundo

- Panel de análisis de datos interactivo
- Panel de análisis de empresas para oportunidades con alto potencial de crecimiento
- Acceso de analista de investigación para personalización y consultas
- Análisis de la competencia con panel interactivo
- Últimas noticias, actualizaciones y análisis de tendencias
- Aproveche el poder del análisis de referencia para un seguimiento integral de la competencia
Tabla de contenido
1 INTRODUCTION
1.1 OBJECTIVES OF THE STUDY
1.2 MARKET DEFINITION
1.3 OVERVIEW OF THE ASIA PACIFIC BRAZE ALLOYS MARKET
1.4 LIMITATIONS
1.5 MARKETS COVERED
2 MARKET SEGMENTATION
2.1 MARKETS COVERED
2.2 GEOGRAPHICAL SCOPE
2.3 YEARS CONSIDERED FOR THE STUDY
2.4 CURRENCY AND PRICING
2.5 DBMR TRIPOD DATA VALIDATION MODEL
2.6 MULTIVARIATE MODELLING
2.7 METAL LIFELINE CURVE
2.8 PRIMARY INTERVIEWS WITH KEY OPINION LEADERS
2.9 DBMR MARKET POSITION GRID
2.1 VENDOR SHARE ANALYSIS
2.11 SECONDARY SOURCES
2.12 ASSUMPTIONS
3 EXECUTIVE SUMMARY
4 PREMIUM INSIGHTS
4.1 ASIA PACIFIC BRAZE ALLOYS MARKET- VENDOR SELECTION CRITERIA
4.2 TECHNOLOGICAL ADVANCEMENT IN BRAZE ALLOYS MARKET
4.3 ASIA PACIFIC BRAZE ALLOYS MARKET: SUPPLY CHAIN ANALYSIS
4.3.1 RAW MATERIAL PROCUREMENT
4.3.2 MANUFACTURING
4.3.3 MARKETING AND DISTRIBUTION
4.3.4 END USERS
4.4 ASIA PACIFIC BRAZE ALLOYS MARKET: REGULATIONS
4.4.1 REGULATIONS BY U.K. GOVERNMENT
4.4.2 FDA REGULATIONS
4.4.3 OSHA (OCCUPATIONAL SAFETY AND HEALTH ADMINISTRATION) STANDARDS
4.4.4 ISO STANDARDS
4.5 ASIA PACIFIC BRAZE ALLOYS MARKET-RAW MATERIAL PRODUCTION COVERAGE
4.6 ASIA PACIFIC BRAZE ALLOYS MARKET, PORTER’S FIVE FORCES ANALYSIS
4.6.1 BUYER POWER
4.6.2 SUPPLIER POWER
4.6.3 THE THREAT OF NEW ENTRANTS
4.6.4 THREAT OF SUBSTITUTES
4.6.5 RIVALRY AMONG EXISTING COMPETITORS
4.7 PESTEL ANALYSIS: ASIA PACIFIC BRAZE ALLOYS MARKET
4.7.1 POLITICS:
4.7.2 ECONOMY:
4.7.3 SOCIAL:
4.7.4 TECHNOLOGY:
4.7.5 ENVIRONMENTAL:
4.7.6 LEGAL:
4.8 CLIMATE CHANGE-
4.9 ALLOY PRICES AFFECT MARKET GROWTH BY REGIONS
5 MARKET OVERVIEW
5.1 DRIVERS
5.1.1 INCREASE IN USAGE OF BRAZE ALLOYS IN THE AUTOMOTIVE AND AVIATION INDUSTRY
5.1.2 INCREASING PREFERENCE TOWARD BRAZING PROCESS OVER SOLDERING, AND WELDING, AMONG OTHERS
5.1.3 INCREASING DEMAND FOR COPPER & ALUMINUM BRAZES ALLOYS
5.1.4 RISING ELECTRICAL & ELECTRONICS MARKET ASIA PACIFICLY
5.2 RESTRAINTS
5.2.1 FLUCTUATING PRICES OF BRAZE METALS
5.2.2 COMPLEXITIES IN THE MANUFACTURING PROCESS OF BRAZE ALLOYS
5.2.3 AVAILABILITY OF SUBSTITUTES FOR BRAZE ALLOYS
5.3 OPPORTUNITIES
5.3.1 WIDE APPLICATIONS OF BRAZING ALLOYS IN VARIOUS INDUSTRIES
5.3.2 COST-EFFECTIVENESS OF BRAZE ALLOYS
5.3.3 RISING NUMBER OF INNOVATIONS IN THE BRAZING INDUSTRY
5.3.4 STRATEGIC DECISIONS BY KEY PLAYERS
5.4 CHALLENGES
5.4.1 SUPPLY CHAIN DISRUPTION DUE TO COVID -19
5.4.2 ADVERSE EFFECT OF BRAZING ON THE ENVIRONMENT
6 ASIA PACIFIC BRAZE ALLOYS MARKET, BY METAL
6.1 OVERVIEW
6.2 SILVER
6.3 COPPER
6.4 NICKEL
6.5 GOLD
6.6 TITANIUM
6.7 STEEL
6.7.1 STAINLESS STEEL
6.7.2 CARBON STEEL
6.7.3 LOW ALLOY STEEL
6.7.4 OTHERS
6.8 ALUMINUM
6.9 COBALT
6.1 IRON
6.11 MAGNESIUM
6.12 OTHERS
7 ASIA PACIFIC BRAZE ALLOYS MARKET, BY FILLER MATERIAL
7.1 OVERVIEW
7.2 BRAZE PASTE
7.3 BRAZE ROD AND WIRE
7.4 BRAZE POWDER
7.5 BRAZE PREFORM
7.6 BRAZE FOIL
7.7 BRAZE TAPE
8 ASIA PACIFIC BRAZE ALLOYS MARKET, BY TECHNOLOGY
8.1 OVERVIEW
8.2 TORCH BRAZING
8.3 FURNACE BRAZING
8.4 RESISTANCE BRAZING
8.5 INDUCTION BRAZING
8.6 DIP BRAZING
8.7 INFRARED BRAZING
8.8 VACUUM BRAZING
8.9 ELECTRON BEAM/LASER BRAZING
8.1 EXOTHERMIC BRAZING
8.11 BRAZE WELDING
8.12 HYDROGEN BRAZING
8.13 BLANKET BRAZING
8.14 DISSOCIATED AMMONIA
8.15 FUEL GAS BRAZING
8.16 OTHERS
9 ASIA PACIFIC BRAZE ALLOYS MARKET, BY FORM
9.1 OVERVIEW
9.2 WIRE
9.3 STRIP
9.4 BAR
9.5 PIPE
9.6 TUBE
9.7 FLAT
9.8 SHEET
9.9 PLATE
9.1 ROUND BAR
9.11 OTHERS
10 ASIA PACIFIC BRAZE ALLOYS MARKET, BY PRODUCTION TEMPERATURE
10.1 OVERVIEW
10.2 1001 °C TO 1200 °C
10.3 LESS THAN 900 °C
10.4 901 °C TO 1000 °C
10.5 ABOVE 1200 °C
11 ASIA PACIFIC BRAZE ALLOYS MARKET, BY END USER
11.1 OVERVIEW
11.2 AUTOMOTIVE
11.2.1 SILVER
11.2.2 COPPER
11.2.3 NICKEL
11.2.4 GOLD
11.2.5 TITANIUM
11.2.6 STEEL
11.2.7 ALUMINUM
11.2.8 COBALT
11.2.9 IRON
11.2.10 MAGNESIUM
11.2.11 OTHERS
11.3 AEROSPACE AND DEFENSE
11.3.1 SILVER
11.3.2 COPPER
11.3.3 NICKEL
11.3.4 GOLD
11.3.5 TITANIUM
11.3.6 STEEL
11.3.7 ALUMINUM
11.3.8 COBALT
11.3.9 IRON
11.3.10 MAGNESIUM
11.3.11 OTHERS
11.4 ELECTRONICS AND ELECTRICAL
11.4.1 SILVER
11.4.2 COPPER
11.4.3 NICKEL
11.4.4 GOLD
11.4.5 TITANIUM
11.4.6 STEEL
11.4.7 ALUMINUM
11.4.8 COBALT
11.4.9 IRON
11.4.10 MAGNESIUM
11.4.11 OTHERS
11.5 BUILDING AND CONSTRUCTION
11.5.1 SILVER
11.5.2 COPPER
11.5.3 NICKEL
11.5.4 GOLD
11.5.5 TITANIUM
11.5.6 STEEL
11.5.7 ALUMINUM
11.5.8 COBALT
11.5.9 IRON
11.5.10 MAGNESIUM
11.5.11 OTHERS
11.6 CHEMICALS
11.6.1 SILVER
11.6.2 COPPER
11.6.3 NICKEL
11.6.4 GOLD
11.6.5 TITANIUM
11.6.6 STEEL
11.6.7 ALUMINUM
11.6.8 COBALT
11.6.9 IRON
11.6.10 MAGNESIUM
11.6.11 OTHERS
11.7 MARINE
11.7.1 SILVER
11.7.2 COPPER
11.7.3 NICKEL
11.7.4 GOLD
11.7.5 TITANIUM
11.7.6 STEEL
11.7.7 ALUMINUM
11.7.8 COBALT
11.7.9 IRON
11.7.10 MAGNESIUM
11.7.11 OTHERS
11.8 OTHERS
11.8.1 SILVER
11.8.2 COPPER
11.8.3 NICKEL
11.8.4 GOLD
11.8.5 TITANIUM
11.8.6 STEEL
11.8.7 ALUMINUM
11.8.8 COBALT
11.8.9 IRON
11.8.10 MAGNESIUM
11.8.11 OTHERS
12 ASIA PACIFIC BRAZE ALLOYS MARKET, BY REGION
12.1 ASIA-PACIFIC
12.1.1 CHINA
12.1.2 JAPAN
12.1.3 SOUTH KOREA
12.1.4 INDIA
12.1.5 AUSTRALIA
12.1.6 SINGAPORE
12.1.7 THAILAND
12.1.8 MALAYSIA
12.1.9 INDONESIA
12.1.10 PHILIPPINES
12.1.11 REST OF ASIA-PACIFIC
13 COMPANY LANDSCAPE
13.1 COMPANY SHARE ANALYSIS: ASIA PACIFIC
14 SWOT ANALYSIS
15 COMPANY PROFILE
15.1 ESAB
15.1.1 COMPANY SANPSHOT
15.1.2 REVENUE ANALYSIS
15.1.3 COMPANY SHARE ANALYSYS
15.1.4 PRODUCT PORTFOLIO
15.1.5 RECENT DEVELOPMENTS
15.2 OC OERLIKON MANAGEMENT AG
15.2.1 COMPANY SNAPSHOT
15.2.2 REVENUE ANALYSIS
15.2.3 COMPANY SHARE ANALYSIS
15.2.4 PRODUCT PORTFOLIO
15.2.5 RECENT DEVELOPMENTS
15.3 UMICORE
15.3.1 COMPANY SNAPSHOT
15.3.2 REVENUE ANALYSIS
15.3.3 COMPANY SHARE ANALYSIS
15.3.4 PRODUCT PORTFOLIO
15.3.5 RECENT DEVELOPMENT
15.4 AMETEK.INC.
15.4.1 COMPANY SNAPSHOT
15.4.2 REVENUE ANALYSIS
15.4.3 PRODUCT PORTFOLIO
15.4.4 RECENT DEVELOPMENT
15.5 JOHNSON MATTHEY
15.5.1 COMPANY SNAPSHOT
15.5.2 REVENUE ANALYSIS
15.5.3 COMPANY SHARE ANALYSI
15.5.4 PRODUCT PORTFOLIO
15.5.5 RECENT DEVELOPMENTS
15.6 AIMTEK
15.6.1 COMPANY SANPSHOT
15.6.2 COMPANY SHARE ANALYSIS
15.6.3 PRODUCT PORTFOLIO
15.6.4 RECENT DEVELOPMENT
15.7 BELMONT METALS
15.7.1 COMPANY SNAPSHOT
15.7.2 PRODUCT PORTFOLIO
15.7.3 RECENT DEVELOPMENT
15.8 CUPRO ALLOYS CORPORATION.
15.8.1 COMPANY SNAPSHOT
15.8.2 PRODUCT PORTFOLIO
15.8.3 RECENT DEVELOPMENTS
15.9 ESPRIX TECHNOLOGIES
15.9.1 COMPANY SNAPSHOT
15.9.2 PRODUCT PORTFOLIO
15.9.3 RECENT DEVELOPMENT
15.1 HARRIS PRODUCTS GROUP.
15.10.1 COMPANY SNAPSHOT
15.10.2 PRODUCT PORTFOLIO
15.10.3 RECENT DEVELOPMENT
15.11 INDIAN SOLDER AND BRAZING ALLOYS
15.11.1 COMPANY SNAPSHOT
15.11.2 PRODUCT PORTFOLIO
15.11.3 RECENT DEVELOPMENTS
15.12 INDIUM CORPORATION
15.12.1 COMPANY SNAPSHOT
15.12.2 PRODUCT PORTFOLIO
15.12.3 RECENT DEVELOPMENT
15.13 KRANTI METALLURGY PVT LTD.
15.13.1 COMPANY SNAPSHOT
15.13.2 PRODUCT PORTFOLIO
15.13.3 RECENT DEVELOPMENTS
15.14 LUCAS-MILHAUPT, INC.
15.14.1 COMPANY SNAPSHOT
15.14.2 PRODUCT PORTFOLIO
15.14.3 RECENT DEVELOPMENTS
15.15 MORGAN ADVANCED MATERIALS
15.15.1 COMPANY SNAPSHOT
15.15.2 PRODUCT PORTFOLIO
15.15.3 RECENT DEVELOPMENT
15.16 PRINCE IZANT COMPANY.
15.16.1 COMPANY SANPSHOT
15.16.2 PRODUCT PORTFOLIO
15.16.3 RECENT DEVELOPMENT
15.17 SARU SILVER ALLOY PRIV ATE LIMITED.
15.17.1 COMPANY SNAPSHOT
15.17.2 PRODUCT PORTFOLIO
15.17.3 RECENT DEVELOPMENTS
15.18 SAXONIA EDELMETALLE GMBH
15.18.1 COMPANY SNAPSHOT
15.18.2 PRODUCT PORTFOLIO
15.18.3 RECENT DEVELOPMENTS
15.19 S. K. METAL
15.19.1 COMPANY SNAPSHOT
15.19.2 PRODUCT PORTFOLIO
15.19.3 RECENT DEVELOPMENTS
15.2 SULZER LTD
15.20.1 COMPANY SNAPSHOT
15.20.2 REVENUE ANALYSIS
15.20.3 PRODUCT PORTFOLIO
15.20.4 RECENT DEVELOPMENTS
15.21 TSI TECHNOLOGIES
15.21.1 COMPANY SANPSHOT
15.21.2 PRODUCT PORTFOLIO
15.21.3 RECENT DEVELOPMENT
16 QUESTIONNAIRE
17 RELATED REPORTS
Lista de Tablas
TABLE 1 CHINA'S AVERAGE PRICE FOR BRAZING ALLOYS TYPES
TABLE 2 INDIA'S AVERAGE PRICE FOR BRAZING ALLOYS TYPES
TABLE 3 U.S. AVERAGE PRICE FOR BRAZING ALLOYS TYPES
TABLE 4 ASIA PACIFIC BRAZE ALLOYS MARKET, BY METAL, 2014-2029 (USD MILLION)
TABLE 5 ASIA PACIFIC BRAZE ALLOYS MARKET, BY METAL, 2014-2029 (TONS)
TABLE 6 ASIA PACIFIC SILVER IN BRAZE ALLOYS MARKET, BY REGION, 2014-2029 (USD MILLION)
TABLE 7 ASIA PACIFIC COPPER IN BRAZE ALLOYS MARKET, BY REGION, 2014-2029 (USD MILLION)
TABLE 8 ASIA PACIFIC NICKEL IN BRAZE ALLOYS MARKET, BY REGION, 2014-2029 (USD MILLION)
TABLE 9 ASIA PACIFIC GOLD IN BRAZE ALLOYS MARKET, BY REGION, 2014-2029 (USD MILLION)
TABLE 10 ASIA PACIFIC TITANIUM IN BRAZE ALLOYS MARKET, BY REGION, 2014-2029 (USD MILLION)
TABLE 11 ASIA PACIFIC STEEL IN BRAZE ALLOYS MARKET, BY REGION, 2014-2029 (USD MILLION)
TABLE 12 ASIA PACIFIC STEEL IN BRAZE ALLOYS MARKET, BY METAL, 2014-2029 (USD MILLION)
TABLE 13 ASIA PACIFIC ALUMINUM IN BRAZE ALLOYS MARKET, BY REGION, 2014-2029 (USD MILLION)
TABLE 14 ASIA PACIFIC COBALT IN BRAZE ALLOYS MARKET, BY REGION, 2014-2029 (USD MILLION)
TABLE 15 ASIA PACIFIC IRON IN BRAZE ALLOYS MARKET, BY REGION, 2014-2029 (USD MILLION)
TABLE 16 ASIA PACIFIC MAGNESIUM IN BRAZE ALLOYS MARKET, BY REGION, 2014-2029 (USD MILLION)
TABLE 17 ASIA PACIFIC OTHERS IN BRAZE ALLOYS MARKET, BY REGION, 2014-2029 (USD MILLION)
TABLE 18 ASIA PACIFIC BRAZE ALLOYS MARKET, BY FILLER MATERIAL, 2014-2029 (USD MILLION)
TABLE 19 ASIA PACIFIC BRAZE PASTE IN BRAZE ALLOYS MARKET, BY REGION, 2014-2029 (USD MILLION)
TABLE 20 ASIA PACIFIC BRAZE ROD AND WIRE IN BRAZE ALLOYS MARKET, BY REGION, 2014-2029 (USD MILLION)
TABLE 21 ASIA PACIFIC BRAZE POWDER IN BRAZE ALLOYS MARKET, BY REGION, 2014-2029 (USD MILLION)
TABLE 22 ASIA PACIFIC BRAZE PREFORM IN BRAZE ALLOYS MARKET, BY REGION, 2014-2029 (USD MILLION)
TABLE 23 ASIA PACIFIC BRAZE FOIL IN BRAZE ALLOYS MARKET, BY REGION, 2014-2029 (USD MILLION)
TABLE 24 ASIA PACIFIC BRAZE TAPE IN BRAZE ALLOYS MARKET, BY REGION, 2014-2029 (USD MILLION)
TABLE 25 ASIA PACIFIC BRAZE ALLOYS MARKET, BY TECHNOLOGY, 2014-2029 (USD MILLION)
TABLE 26 ASIA PACIFIC TORCH BRAZING IN BRAZE ALLOYS MARKET, BY REGION, 2014-2029 (USD MILLION)
TABLE 27 ASIA PACIFIC FURNACE BRAZING IN BRAZE ALLOYS MARKET, BY REGION, 2014-2029 (USD MILLION)
TABLE 28 ASIA PACIFIC RESISTANCE BRAZING IN BRAZE ALLOYS MARKET, BY REGION, 2014-2029 (USD MILLION)
TABLE 29 ASIA PACIFIC INDUCTION BRAZING IN BRAZE ALLOYS MARKET, BY REGION, 2014-2029 (USD MILLION)
TABLE 30 ASIA PACIFIC DIP BRAZING IN BRAZE ALLOYS MARKET, BY REGION, 2014-2029 (USD MILLION)
TABLE 31 ASIA PACIFIC INFRARED BRAZING IN BRAZE ALLOYS MARKET, BY REGION, 2014-2029 (USD MILLION)
TABLE 32 ASIA PACIFIC VACUUM BRAZING IN BRAZE ALLOYS MARKET, BY REGION, 2014-2029 (USD MILLION)
TABLE 33 ASIA PACIFIC ELECTRON BEAM/LASER BRAZING IN BRAZE ALLOYS MARKET, BY REGION, 2014-2029 (USD MILLION)
TABLE 34 ASIA PACIFIC EXOTHERMIC BRAZING IN BRAZE ALLOYS MARKET, BY REGION, 2014-2029 (USD MILLION)
TABLE 35 ASIA PACIFIC BRAZE WELDING IN BRAZE ALLOYS MARKET, BY REGION, 2014-2029 (USD MILLION)
TABLE 36 ASIA PACIFIC HYDROGEN BRAZING IN BRAZE ALLOYS MARKET, BY REGION, 2014-2029 (USD MILLION)
TABLE 37 ASIA PACIFIC BLANKET BRAZING IN BRAZE ALLOYS MARKET, BY REGION, 2014-2029 (USD MILLION)
TABLE 38 ASIA PACIFIC DISSOCIATED AMMONIA IN BRAZE ALLOYS MARKET, BY REGION, 2014-2029 (USD MILLION)
TABLE 39 ASIA PACIFIC FUEL GAS BRAZING IN BRAZE ALLOYS MARKET, BY REGION, 2014-2029 (USD MILLION)
TABLE 40 ASIA PACIFIC OTHERS IN BRAZE ALLOYS MARKET, BY REGION, 2014-2029 (USD MILLION)
TABLE 41 ASIA PACIFIC BRAZE ALLOYS MARKET, BY FORM, 2014-2029 (USD MILLION)
TABLE 42 ASIA PACIFIC WIRE IN BRAZE ALLOYS MARKET, BY REGION, 2014-2029 (USD MILLION)
TABLE 43 ASIA PACIFIC STRIP IN BRAZE ALLOYS MARKET, BY REGION, 2014-2029 (USD MILLION)
TABLE 44 ASIA PACIFIC BAR IN BRAZE ALLOYS MARKET, BY REGION, 2014-2029 (USD MILLION)
TABLE 45 ASIA PACIFIC PIPE IN BRAZE ALLOYS MARKET, BY REGION, 2014-2029 (USD MILLION)
TABLE 46 ASIA PACIFIC TUBE IN BRAZE ALLOYS MARKET, BY REGION, 2014-2029 (USD MILLION)
TABLE 47 ASIA PACIFIC FLAT IN BRAZE ALLOYS MARKET, BY REGION, 2014-2029 (USD MILLION)
TABLE 48 ASIA PACIFIC SHEET IN BRAZE ALLOYS MARKET, BY REGION, 2014-2029 (USD MILLION)
TABLE 49 ASIA PACIFIC PLATE IN BRAZE ALLOYS MARKET, BY REGION, 2014-2029 (USD MILLION)
TABLE 50 ASIA PACIFIC ROUND BAR IN BRAZE ALLOYS MARKET, BY REGION, 2014-2029 (USD MILLION)
TABLE 51 ASIA PACIFIC OTHERS IN BRAZE ALLOYS MARKET, BY REGION, 2014-2029 (USD MILLION)
TABLE 52 ASIA PACIFIC BRAZE ALLOYS MARKET, BY PRODUCTION TEMPERATURE, 2014-2029 (USD MILLION)
TABLE 53 ASIA PACIFIC 1001 °C TO 1200 °C IN BRAZE ALLOYS MARKET, BY REGION, 2014-2029 (USD MILLION)
TABLE 54 ASIA PACIFIC LESS THAN 900 °C IN BRAZE ALLOYS MARKET, BY REGION, 2014-2029 (USD MILLION)
TABLE 55 ASIA PACIFIC 901 °C TO 1000 °C IN BRAZE ALLOYS MARKET, BY REGION, 2014-2029 (USD MILLION)
TABLE 56 ASIA PACIFIC ABOVE 1200 °C IN BRAZE ALLOYS MARKET, BY REGION, 2014-2029 (USD MILLION)
TABLE 57 ASIA PACIFIC BRAZE ALLOYS MARKET, BY END-USER, 2014-2029 (USD MILLION)
TABLE 58 ASIA PACIFIC AUTOMOTIVE IN BRAZE ALLOYS MARKET, BY REGION, 2014-2029 (USD MILLION)
TABLE 59 ASIA PACIFIC AUTOMOTIVE IN BRAZE ALLOYS MARKET, BY METAL, 2014-2029 (USD MILLION)
TABLE 60 ASIA PACIFIC AEROSPACE AND DEFENSE IN BRAZE ALLOYS MARKET, BY REGION, 2014-2029 (USD MILLION)
TABLE 61 ASIA PACIFIC AEROSPACE AND DEFENSE IN BRAZE ALLOYS MARKET, BY METAL, 2014-2029 (USD MILLION)
TABLE 62 ASIA PACIFIC ELECTRONICS AND ELECTRICAL IN BRAZE ALLOYS MARKET, BY REGION, 2014-2029 (USD MILLION)
TABLE 63 ASIA PACIFIC ELECTRONICS AND ELECTRICAL IN BRAZE ALLOYS MARKET, BY METAL, 2014-2029 (USD MILLION)
TABLE 64 ASIA PACIFIC BUILDING AND CONSTRUCTION IN BRAZE ALLOYS MARKET, BY REGION, 2014-2029 (USD MILLION)
TABLE 65 ASIA PACIFIC BUILDING AND CONSTRUCTION IN BRAZE ALLOYS MARKET, BY METAL, 2014-2029 (USD MILLION)
TABLE 66 ASIA PACIFIC CHEMICALS IN BRAZE ALLOYS MARKET, BY REGION, 2014-2029 (USD MILLION)
TABLE 67 ASIA PACIFIC CHEMICALS IN BRAZE ALLOYS MARKET, BY METAL, 2014-2029 (USD MILLION)
TABLE 68 ASIA PACIFIC MARINE IN BRAZE ALLOYS MARKET, BY REGION, 2014-2029 (USD MILLION)
TABLE 69 ASIA PACIFIC MARINE IN BRAZE ALLOYS MARKET, BY METAL, 2014-2029 (USD MILLION)
TABLE 70 ASIA PACIFIC OTHERS IN BRAZE ALLOYS MARKET, BY REGION, 2014-2029 (USD MILLION)
TABLE 71 ASIA PACIFIC OTHERS IN BRAZE ALLOYS MARKET, BY METAL, 2014-2029 (USD MILLION)
TABLE 72 ASIA-PACIFIC BRAZE ALLOYS MARKET, BY COUNTRY, 2014-2029 (USD MILLION)
TABLE 73 ASIA-PACIFIC BRAZE ALLOYS MARKET, BY COUNTRY, 2014-2029 (TONS)
TABLE 74 ASIA-PACIFIC BRAZE ALLOYS MARKET, BY METAL, 2014-2029 (USD MILLION)
TABLE 75 ASIA-PACIFIC BRAZE ALLOYS MARKET, BY METAL, 2014-2029 (TONS)
TABLE 76 ASIA-PACIFIC STEEL IN BRAZE ALLOYS MARKET, BY METAL, 2014-2029 (USD MILLION)
TABLE 77 ASIA-PACIFIC BRAZE ALLOYS MARKET, BY FILLER MATERIAL, 2014-2029 (USD MILLION)
TABLE 78 ASIA-PACIFIC BRAZE ALLOYS MARKET, BY TECHNOLOGY, 2014-2029 (USD MILLION)
TABLE 79 ASIA-PACIFIC BRAZE ALLOYS MARKET, BY FORM, 2014-2029 (USD MILLION)
TABLE 80 ASIA-PACIFIC BRAZE ALLOYS MARKET, BY PRODUCTION TEMPERATURE, 2014-2029 (USD MILLION)
TABLE 81 ASIA-PACIFIC BRAZE ALLOYS MARKET, BY END USE, 2014-2029 (USD MILLION)
TABLE 82 ASIA-PACIFIC AUTOMOTIVE IN BRAZE ALLOYS MARKET, BY METAL, 2014-2029 (USD MILLION)
TABLE 83 ASIA-PACIFIC AEROSPACE AND DEFENCE IN BRAZE ALLOYS MARKET, BY METAL, 2014-2029 (USD MILLION)
TABLE 84 ASIA-PACIFIC ELECTRONICS AND ELECTRICAL BRAZE ALLOYS MARKET, BY METAL, 2014-2029 (USD MILLION)
TABLE 85 ASIA-PACIFIC BUILDING AND CONSTRUCTION IN BRAZE ALLOYS MARKET, BY METAL, 2014-2029 (USD MILLION)
TABLE 86 ASIA-PACIFIC CHEMICALS IN BRAZE ALLOYS MARKET, BY METAL, 2014-2029 (USD MILLION)
TABLE 87 ASIA-PACIFIC MARINE IN BRAZE ALLOYS MARKET, BY METAL, 2014-2029 (USD MILLION)
TABLE 88 ASIA-PACIFIC OTHERS IN BRAZE ALLOYS MARKET, BY METAL, 2014-2029 (USD MILLION)
TABLE 89 CHINA BRAZE ALLOYS MARKET, BY METAL, 2014-2029 (USD MILLION)
TABLE 90 CHINA BRAZE ALLOYS MARKET, BY METAL, 2014-2029 (TONS)
TABLE 91 CHINA STEEL IN BRAZE ALLOYS MARKET, BY METAL, 2014-2029 (USD MILLION)
TABLE 92 CHINA BRAZE ALLOYS MARKET, BY FILLER MATERIAL, 2014-2029 (USD MILLION)
TABLE 93 CHINA BRAZE ALLOYS MARKET, BY TECHNOLOGY, 2014-2029 (USD MILLION)
TABLE 94 CHINA BRAZE ALLOYS MARKET, BY FORM, 2014-2029 (USD MILLION)
TABLE 95 CHINA BRAZE ALLOYS MARKET, BY PRODUCTION TEMPERATURE, 2014-2029 (USD MILLION)
TABLE 96 CHINA BRAZE ALLOYS MARKET, BY END USE, 2014-2029 (USD MILLION)
TABLE 97 CHINA AUTOMOTIVE IN BRAZE ALLOYS MARKET, BY METAL, 2014-2029 (USD MILLION)
TABLE 98 CHINA AEROSPACE AND DEFENCE IN BRAZE ALLOYS MARKET, BY METAL, 2014-2029 (USD MILLION)
TABLE 99 CHINA ELECTRONICS AND ELECTRICAL BRAZE ALLOYS MARKET, BY METAL, 2014-2029 (USD MILLION)
TABLE 100 CHINA BUILDING AND CONSTRUCTION IN BRAZE ALLOYS MARKET, BY METAL, 2014-2029 (USD MILLION)
TABLE 101 CHINA CHEMICALS IN BRAZE ALLOYS MARKET, BY METAL, 2014-2029 (USD MILLION)
TABLE 102 CHINA MARINE IN BRAZE ALLOYS MARKET, BY METAL, 2014-2029 (USD MILLION)
TABLE 103 CHINA OTHERS IN BRAZE ALLOYS MARKET, BY METAL, 2014-2029 (USD MILLION)
TABLE 104 JAPAN BRAZE ALLOYS MARKET, BY METAL, 2014-2029 (USD MILLION)
TABLE 105 JAPAN BRAZE ALLOYS MARKET, BY METAL, 2014-2029 (TONS)
TABLE 106 JAPAN STEEL IN BRAZE ALLOYS MARKET, BY METAL, 2014-2029 (USD MILLION)
TABLE 107 JAPAN BRAZE ALLOYS MARKET, BY FILLER MATERIAL, 2014-2029 (USD MILLION)
TABLE 108 JAPAN BRAZE ALLOYS MARKET, BY TECHNOLOGY, 2014-2029 (USD MILLION)
TABLE 109 JAPAN BRAZE ALLOYS MARKET, BY FORM, 2014-2029 (USD MILLION)
TABLE 110 JAPAN BRAZE ALLOYS MARKET, BY PRODUCTION TEMPERATURE, 2014-2029 (USD MILLION)
TABLE 111 JAPAN BRAZE ALLOYS MARKET, BY END USE, 2014-2029 (USD MILLION)
TABLE 112 JAPAN AUTOMOTIVE IN BRAZE ALLOYS MARKET, BY METAL, 2014-2029 (USD MILLION)
TABLE 113 JAPAN AEROSPACE AND DEFENCE IN BRAZE ALLOYS MARKET, BY METAL, 2014-2029 (USD MILLION)
TABLE 114 JAPAN ELECTRONICS AND ELECTRICAL BRAZE ALLOYS MARKET, BY METAL, 2014-2029 (USD MILLION)
TABLE 115 JAPAN BUILDING AND CONSTRUCTION IN BRAZE ALLOYS MARKET, BY METAL, 2014-2029 (USD MILLION)
TABLE 116 JAPAN CHEMICALS IN BRAZE ALLOYS MARKET, BY METAL, 2014-2029 (USD MILLION)
TABLE 117 JAPAN MARINE IN BRAZE ALLOYS MARKET, BY METAL, 2014-2029 (USD MILLION)
TABLE 118 JAPAN OTHERS IN BRAZE ALLOYS MARKET, BY METAL, 2014-2029 (USD MILLION)
TABLE 119 SOUTH KOREA BRAZE ALLOYS MARKET, BY METAL, 2014-2029 (USD MILLION)
TABLE 120 SOUTH KOREA BRAZE ALLOYS MARKET, BY METAL, 2014-2029 (TONS)
TABLE 121 SOUTH KOREA STEEL IN BRAZE ALLOYS MARKET, BY METAL, 2014-2029 (USD MILLION)
TABLE 122 SOUTH KOREA BRAZE ALLOYS MARKET, BY FILLER MATERIAL, 2014-2029 (USD MILLION)
TABLE 123 SOUTH KOREA BRAZE ALLOYS MARKET, BY TECHNOLOGY, 2014-2029 (USD MILLION)
TABLE 124 SOUTH KOREA BRAZE ALLOYS MARKET, BY FORM, 2014-2029 (USD MILLION)
TABLE 125 SOUTH KOREA BRAZE ALLOYS MARKET, BY PRODUCTION TEMPERATURE, 2014-2029 (USD MILLION)
TABLE 126 SOUTH KOREA BRAZE ALLOYS MARKET, BY END USE, 2014-2029 (USD MILLION)
TABLE 127 SOUTH KOREA AUTOMOTIVE IN BRAZE ALLOYS MARKET, BY METAL, 2014-2029 (USD MILLION)
TABLE 128 SOUTH KOREA AEROSPACE AND DEFENCE IN BRAZE ALLOYS MARKET, BY METAL, 2014-2029 (USD MILLION)
TABLE 129 SOUTH KOREA ELECTRONICS AND ELECTRICAL BRAZE ALLOYS MARKET, BY METAL, 2014-2029 (USD MILLION)
TABLE 130 SOUTH KOREA BUILDING AND CONSTRUCTION IN BRAZE ALLOYS MARKET, BY METAL, 2014-2029 (USD MILLION)
TABLE 131 SOUTH KOREA CHEMICALS IN BRAZE ALLOYS MARKET, BY METAL, 2014-2029 (USD MILLION)
TABLE 132 SOUTH KOREA MARINE IN BRAZE ALLOYS MARKET, BY METAL, 2014-2029 (USD MILLION)
TABLE 133 SOUTH KOREA OTHERS IN BRAZE ALLOYS MARKET, BY METAL, 2014-2029 (USD MILLION)
TABLE 134 INDIA BRAZE ALLOYS MARKET, BY METAL, 2014-2029 (USD MILLION)
TABLE 135 INDIA BRAZE ALLOYS MARKET, BY METAL, 2014-2029 (TONS)
TABLE 136 INDIA STEEL IN BRAZE ALLOYS MARKET, BY METAL, 2014-2029 (USD MILLION)
TABLE 137 INDIA BRAZE ALLOYS MARKET, BY FILLER MATERIAL, 2014-2029 (USD MILLION)
TABLE 138 INDIA BRAZE ALLOYS MARKET, BY TECHNOLOGY, 2014-2029 (USD MILLION)
TABLE 139 INDIA BRAZE ALLOYS MARKET, BY FORM, 2014-2029 (USD MILLION)
TABLE 140 INDIA BRAZE ALLOYS MARKET, BY PRODUCTION TEMPERATURE, 2014-2029 (USD MILLION)
TABLE 141 INDIA BRAZE ALLOYS MARKET, BY END USE, 2014-2029 (USD MILLION)
TABLE 142 INDIA AUTOMOTIVE IN BRAZE ALLOYS MARKET, BY METAL, 2014-2029 (USD MILLION)
TABLE 143 INDIA AEROSPACE AND DEFENCE IN BRAZE ALLOYS MARKET, BY METAL, 2014-2029 (USD MILLION)
TABLE 144 INDIA ELECTRONICS AND ELECTRICAL BRAZE ALLOYS MARKET, BY METAL, 2014-2029 (USD MILLION)
TABLE 145 INDIA BUILDING AND CONSTRUCTION IN BRAZE ALLOYS MARKET, BY METAL, 2014-2029 (USD MILLION)
TABLE 146 INDIA CHEMICALS IN BRAZE ALLOYS MARKET, BY METAL, 2014-2029 (USD MILLION)
TABLE 147 INDIA MARINE IN BRAZE ALLOYS MARKET, BY METAL, 2014-2029 (USD MILLION)
TABLE 148 INDIA OTHERS IN BRAZE ALLOYS MARKET, BY METAL, 2014-2029 (USD MILLION)
TABLE 149 AUSTRALIA BRAZE ALLOYS MARKET, BY METAL, 2014-2029 (USD MILLION)
TABLE 150 AUSTRALIA BRAZE ALLOYS MARKET, BY METAL, 2014-2029 (TONS)
TABLE 151 AUSTRALIA STEEL IN BRAZE ALLOYS MARKET, BY METAL, 2014-2029 (USD MILLION)
TABLE 152 AUSTRALIA BRAZE ALLOYS MARKET, BY FILLER MATERIAL, 2014-2029 (USD MILLION)
TABLE 153 AUSTRALIA BRAZE ALLOYS MARKET, BY TECHNOLOGY, 2014-2029 (USD MILLION)
TABLE 154 AUSTRALIA BRAZE ALLOYS MARKET, BY FORM, 2014-2029 (USD MILLION)
TABLE 155 AUSTRALIA BRAZE ALLOYS MARKET, BY PRODUCTION TEMPERATURE, 2014-2029 (USD MILLION)
TABLE 156 AUSTRALIA BRAZE ALLOYS MARKET, BY END USE, 2014-2029 (USD MILLION)
TABLE 157 AUSTRALIA AUTOMOTIVE IN BRAZE ALLOYS MARKET, BY METAL, 2014-2029 (USD MILLION)
TABLE 158 AUSTRALIA AEROSPACE AND DEFENCE IN BRAZE ALLOYS MARKET, BY METAL, 2014-2029 (USD MILLION)
TABLE 159 AUSTRALIA ELECTRONICS AND ELECTRICAL BRAZE ALLOYS MARKET, BY METAL, 2014-2029 (USD MILLION)
TABLE 160 AUSTRALIA BUILDING AND CONSTRUCTION IN BRAZE ALLOYS MARKET, BY METAL, 2014-2029 (USD MILLION)
TABLE 161 AUSTRALIA CHEMICALS IN BRAZE ALLOYS MARKET, BY METAL, 2014-2029 (USD MILLION)
TABLE 162 AUSTRALIA MARINE IN BRAZE ALLOYS MARKET, BY METAL, 2014-2029 (USD MILLION)
TABLE 163 AUSTRALIA OTHERS IN BRAZE ALLOYS MARKET, BY METAL, 2014-2029 (USD MILLION)
TABLE 164 SINGAPORE BRAZE ALLOYS MARKET, BY METAL, 2014-2029 (USD MILLION)
TABLE 165 SINGAPORE BRAZE ALLOYS MARKET, BY METAL, 2014-2029 (TONS)
TABLE 166 SINGAPORE STEEL IN BRAZE ALLOYS MARKET, BY METAL, 2014-2029 (USD MILLION)
TABLE 167 SINGAPORE BRAZE ALLOYS MARKET, BY FILLER MATERIAL, 2014-2029 (USD MILLION)
TABLE 168 SINGAPORE BRAZE ALLOYS MARKET, BY TECHNOLOGY, 2014-2029 (USD MILLION)
TABLE 169 SINGAPORE BRAZE ALLOYS MARKET, BY FORM, 2014-2029 (USD MILLION)
TABLE 170 SINGAPORE BRAZE ALLOYS MARKET, BY PRODUCTION TEMPERATURE, 2014-2029 (USD MILLION)
TABLE 171 SINGAPORE BRAZE ALLOYS MARKET, BY END USE, 2014-2029 (USD MILLION)
TABLE 172 SINGAPORE AUTOMOTIVE IN BRAZE ALLOYS MARKET, BY METAL, 2014-2029 (USD MILLION)
TABLE 173 SINGAPORE AEROSPACE AND DEFENCE IN BRAZE ALLOYS MARKET, BY METAL, 2014-2029 (USD MILLION)
TABLE 174 SINGAPORE ELECTRONICS AND ELECTRICAL BRAZE ALLOYS MARKET, BY METAL, 2014-2029 (USD MILLION)
TABLE 175 SINGAPORE BUILDING AND CONSTRUCTION IN BRAZE ALLOYS MARKET, BY METAL, 2014-2029 (USD MILLION)
TABLE 176 SINGAPORE CHEMICALS IN BRAZE ALLOYS MARKET, BY METAL, 2014-2029 (USD MILLION)
TABLE 177 SINGAPORE MARINE IN BRAZE ALLOYS MARKET, BY METAL, 2014-2029 (USD MILLION)
TABLE 178 SINGAPORE OTHERS IN BRAZE ALLOYS MARKET, BY METAL, 2014-2029 (USD MILLION)
TABLE 179 THAILAND BRAZE ALLOYS MARKET, BY METAL, 2014-2029 (USD MILLION)
TABLE 180 THAILAND BRAZE ALLOYS MARKET, BY METAL, 2014-2029 (TONS)
TABLE 181 THAILAND STEEL IN BRAZE ALLOYS MARKET, BY METAL, 2014-2029 (USD MILLION)
TABLE 182 THAILAND BRAZE ALLOYS MARKET, BY FILLER MATERIAL, 2014-2029 (USD MILLION)
TABLE 183 THAILAND BRAZE ALLOYS MARKET, BY TECHNOLOGY, 2014-2029 (USD MILLION)
TABLE 184 THAILAND BRAZE ALLOYS MARKET, BY FORM, 2014-2029 (USD MILLION)
TABLE 185 THAILAND BRAZE ALLOYS MARKET, BY PRODUCTION TEMPERATURE, 2014-2029 (USD MILLION)
TABLE 186 THAILAND BRAZE ALLOYS MARKET, BY END USE, 2014-2029 (USD MILLION)
TABLE 187 THAILAND AUTOMOTIVE IN BRAZE ALLOYS MARKET, BY METAL, 2014-2029 (USD MILLION)
TABLE 188 THAILAND AEROSPACE AND DEFENCE IN BRAZE ALLOYS MARKET, BY METAL, 2014-2029 (USD MILLION)
TABLE 189 THAILAND ELECTRONICS AND ELECTRICAL BRAZE ALLOYS MARKET, BY METAL, 2014-2029 (USD MILLION)
TABLE 190 THAILAND BUILDING AND CONSTRUCTION IN BRAZE ALLOYS MARKET, BY METAL, 2014-2029 (USD MILLION)
TABLE 191 THAILAND CHEMICALS IN BRAZE ALLOYS MARKET, BY METAL, 2014-2029 (USD MILLION)
TABLE 192 THAILAND MARINE IN BRAZE ALLOYS MARKET, BY METAL, 2014-2029 (USD MILLION)
TABLE 193 THAILAND OTHERS IN BRAZE ALLOYS MARKET, BY METAL, 2014-2029 (USD MILLION)
TABLE 194 MALAYSIA BRAZE ALLOYS MARKET, BY METAL, 2014-2029 (USD MILLION)
TABLE 195 MALAYSIA BRAZE ALLOYS MARKET, BY METAL, 2014-2029 (TONS)
TABLE 196 MALAYSIA STEEL IN BRAZE ALLOYS MARKET, BY METAL, 2014-2029 (USD MILLION)
TABLE 197 MALAYSIA BRAZE ALLOYS MARKET, BY FILLER MATERIAL, 2014-2029 (USD MILLION)
TABLE 198 MALAYSIA BRAZE ALLOYS MARKET, BY TECHNOLOGY, 2014-2029 (USD MILLION)
TABLE 199 MALAYSIA BRAZE ALLOYS MARKET, BY FORM, 2014-2029 (USD MILLION)
TABLE 200 MALAYSIA BRAZE ALLOYS MARKET, BY PRODUCTION TEMPERATURE, 2014-2029 (USD MILLION)
TABLE 201 MALAYSIA BRAZE ALLOYS MARKET, BY END USE, 2014-2029 (USD MILLION)
TABLE 202 MALAYSIA AUTOMOTIVE IN BRAZE ALLOYS MARKET, BY METAL, 2014-2029 (USD MILLION)
TABLE 203 MALAYSIA AEROSPACE AND DEFENCE IN BRAZE ALLOYS MARKET, BY METAL, 2014-2029 (USD MILLION)
TABLE 204 MALAYSIA ELECTRONICS AND ELECTRICAL BRAZE ALLOYS MARKET, BY METAL, 2014-2029 (USD MILLION)
TABLE 205 MALAYSIA BUILDING AND CONSTRUCTION IN BRAZE ALLOYS MARKET, BY METAL, 2014-2029 (USD MILLION)
TABLE 206 MALAYSIA CHEMICALS IN BRAZE ALLOYS MARKET, BY METAL, 2014-2029 (USD MILLION)
TABLE 207 MALAYSIA MARINE IN BRAZE ALLOYS MARKET, BY METAL, 2014-2029 (USD MILLION)
TABLE 208 MALAYSIA OTHERS IN BRAZE ALLOYS MARKET, BY METAL, 2014-2029 (USD MILLION)
TABLE 209 INDONESIA BRAZE ALLOYS MARKET, BY METAL, 2014-2029 (USD MILLION)
TABLE 210 INDONESIA BRAZE ALLOYS MARKET, BY METAL, 2014-2029 (TONS)
TABLE 211 INDONESIA STEEL IN BRAZE ALLOYS MARKET, BY METAL, 2014-2029 (USD MILLION)
TABLE 212 INDONESIA BRAZE ALLOYS MARKET, BY FILLER MATERIAL, 2014-2029 (USD MILLION)
TABLE 213 INDONESIA BRAZE ALLOYS MARKET, BY TECHNOLOGY, 2014-2029 (USD MILLION)
TABLE 214 INDONESIA BRAZE ALLOYS MARKET, BY FORM, 2014-2029 (USD MILLION)
TABLE 215 INDONESIA BRAZE ALLOYS MARKET, BY PRODUCTION TEMPERATURE, 2014-2029 (USD MILLION)
TABLE 216 INDONESIA BRAZE ALLOYS MARKET, BY END USE, 2014-2029 (USD MILLION)
TABLE 217 INDONESIA AUTOMOTIVE IN BRAZE ALLOYS MARKET, BY METAL, 2014-2029 (USD MILLION)
TABLE 218 INDONESIA AEROSPACE AND DEFENCE IN BRAZE ALLOYS MARKET, BY METAL, 2014-2029 (USD MILLION)
TABLE 219 INDONESIA ELECTRONICS AND ELECTRICAL BRAZE ALLOYS MARKET, BY METAL, 2014-2029 (USD MILLION)
TABLE 220 INDONESIA BUILDING AND CONSTRUCTION IN BRAZE ALLOYS MARKET, BY METAL, 2014-2029 (USD MILLION)
TABLE 221 INDONESIA CHEMICALS IN BRAZE ALLOYS MARKET, BY METAL, 2014-2029 (USD MILLION)
TABLE 222 INDONESIA MARINE IN BRAZE ALLOYS MARKET, BY METAL, 2014-2029 (USD MILLION)
TABLE 223 INDONESIA OTHERS IN BRAZE ALLOYS MARKET, BY METAL, 2014-2029 (USD MILLION)
TABLE 224 PHILIPPINES BRAZE ALLOYS MARKET, BY METAL, 2014-2029 (USD MILLION)
TABLE 225 PHILIPPINES BRAZE ALLOYS MARKET, BY METAL, 2014-2029 (TONS)
TABLE 226 PHILIPPINES STEEL IN BRAZE ALLOYS MARKET, BY METAL, 2014-2029 (USD MILLION)
TABLE 227 PHILIPPINES BRAZE ALLOYS MARKET, BY FILLER MATERIAL, 2014-2029 (USD MILLION)
TABLE 228 PHILIPPINES BRAZE ALLOYS MARKET, BY TECHNOLOGY, 2014-2029 (USD MILLION)
TABLE 229 PHILIPPINES BRAZE ALLOYS MARKET, BY FORM, 2014-2029 (USD MILLION)
TABLE 230 PHILIPPINES BRAZE ALLOYS MARKET, BY PRODUCTION TEMPERATURE, 2014-2029 (USD MILLION)
TABLE 231 PHILIPPINES BRAZE ALLOYS MARKET, BY END USE, 2014-2029 (USD MILLION)
TABLE 232 PHILIPPINES AUTOMOTIVE IN BRAZE ALLOYS MARKET, BY METAL, 2014-2029 (USD MILLION)
TABLE 233 PHILIPPINES AEROSPACE AND DEFENCE IN BRAZE ALLOYS MARKET, BY METAL, 2014-2029 (USD MILLION)
TABLE 234 PHILIPPINES ELECTRONICS AND ELECTRICAL BRAZE ALLOYS MARKET, BY METAL, 2014-2029 (USD MILLION)
TABLE 235 PHILIPPINES BUILDING AND CONSTRUCTION IN BRAZE ALLOYS MARKET, BY METAL, 2014-2029 (USD MILLION)
TABLE 236 PHILIPPINES CHEMICALS IN BRAZE ALLOYS MARKET, BY METAL, 2014-2029 (USD MILLION)
TABLE 237 PHILIPPINES MARINE IN BRAZE ALLOYS MARKET, BY METAL, 2014-2029 (USD MILLION)
TABLE 238 PHILIPPINES OTHERS IN BRAZE ALLOYS MARKET, BY METAL, 2014-2029 (USD MILLION)
TABLE 239 REST OF ASIA-PACIFIC BRAZE ALLOYS MARKET, BY METAL, 2014-2029 (USD MILLION)
TABLE 240 REST OF ASIA-PACIFIC BRAZE ALLOYS MARKET, BY METAL, 2014-2029 (TONS)
Lista de figuras
FIGURE 1 ASIA PACIFIC BRAZE ALLOYS MARKET: SEGMENTATION
FIGURE 2 ASIA PACIFIC BRAZE ALLOYS MARKET: DATA TRIANGULATION
FIGURE 3 ASIA PACIFIC BRAZE ALLOYS MARKET: DROC ANALYSIS
FIGURE 4 ASIA PACIFIC BRAZE ALLOYS MARKET: ASIA PACIFIC VS REGIONAL MARKET ANALYSIS
FIGURE 5 ASIA PACIFIC BRAZE ALLOYS MARKET: COMPANY RESEARCH ANALYSIS
FIGURE 6 ASIA PACIFIC BRAZE ALLOYS MARKET: INTERVIEW DEMOGRAPHICS
FIGURE 7 ASIA PACIFIC BRAZE ALLOYS MARKET: DBMR MARKET POSITION GRID
FIGURE 8 ASIA PACIFIC BRAZE ALLOYS MARKET: VENDOR SHARE ANALYSIS
FIGURE 9 ASIA PACIFIC BRAZE ALLOY MARKET: SEGMENTATION
FIGURE 10 ASIA-PACIFIC IS EXPECTED TO DOMINATE THE ASIA PACIFIC CONDENSING UNIT MARKET AND GROWING WITH THE HIGHEST CAGR IN THE FORECAST PERIOD OF 2022 TO 2029
FIGURE 11 INCREASE IN USAGE OF BRAZE ALLOYS IN THE AUTOMOTIVE AND AVIATION IS A MAJOR DRIVER FOR THE GROWTH OF ASIA PACIFIC BRAZE ALLOYS MARKET IN THE FORECAST PERIOD OF 2022-2029
FIGURE 12 METAL IS EXPECTED TO ACCOUNT FOR THE LARGEST SHARE OF THE ASIA PACIFIC BRAZE ALLOYS MARKET IN 2021 AND 2029
FIGURE 13 VENDOR SELECTION CRITERIA:
FIGURE 14 SUPPLY CHAIN OF ASIA PACIFIC BRAZE ALLOYS MARKET
FIGURE 15 VARIOUS CLASSES OF BRAZING FILLERS ACCORDING TO ISO 17672:2016
FIGURE 16 THE FOLLOWING GRAPH SHOWCASES THE DIFFERENT PRICES RANGE IN DIFFERENT REGIONS IN USD MILLION PER TON.
FIGURE 17 DRIVERS, RESTRAINTS, OPPORTUNITIES, AND CHALLENGES OF THE ASIA PACIFIC BRAZE ALLOYS MARKET
FIGURE 18 PRICE GRAPH OF SOME OF THE METALS USED IN BRAZE ALLOYS
FIGURE 19 ASIA PACIFIC BRAZE ALLOYS MARKET: BY METAL, 2021
FIGURE 20 ASIA PACIFIC BRAZE ALLOYS MARKET: BY FILLER MATERIAL, 2021
FIGURE 21 ASIA PACIFIC BRAZE ALLOYS MARKET: BY TECHNOLOGY, 2021
FIGURE 22 ASIA PACIFIC BRAZE ALLOYS MARKET: BY FORM, 2021
FIGURE 23 ASIA PACIFIC BRAZE ALLOYS MARKET: BY PRODUCTION TEMPERATURE, 2021
FIGURE 24 ASIA PACIFIC BRAZE ALLOYS MARKET: BY END USER, 2021
FIGURE 25 ASIA-PACIFIC BRAZE ALLOYS MARKET: SNAPSHOT (2021)
FIGURE 26 ASIA-PACIFIC BRAZE ALLOYS MARKET: BY COUNTRY (2021)
FIGURE 27 ASIA-PACIFIC BRAZE ALLOYS MARKET: BY COUNTRY (2022 & 2029)
FIGURE 28 ASIA-PACIFIC BRAZE ALLOYS MARKET: BY COUNTRY (2021 & 2029)
FIGURE 29 ASIA-PACIFIC BRAZE ALLOYS MARKET: BY METAL (2022 & 2029)
FIGURE 30 ASIA PACIFIC BRAZE ALLOY MARKET: COMPANY SHARE 2021 (%)
Metodología de investigación
La recopilación de datos y el análisis del año base se realizan utilizando módulos de recopilación de datos con muestras de gran tamaño. La etapa incluye la obtención de información de mercado o datos relacionados a través de varias fuentes y estrategias. Incluye el examen y la planificación de todos los datos adquiridos del pasado con antelación. Asimismo, abarca el examen de las inconsistencias de información observadas en diferentes fuentes de información. Los datos de mercado se analizan y estiman utilizando modelos estadísticos y coherentes de mercado. Además, el análisis de la participación de mercado y el análisis de tendencias clave son los principales factores de éxito en el informe de mercado. Para obtener más información, solicite una llamada de un analista o envíe su consulta.
La metodología de investigación clave utilizada por el equipo de investigación de DBMR es la triangulación de datos, que implica la extracción de datos, el análisis del impacto de las variables de datos en el mercado y la validación primaria (experto en la industria). Los modelos de datos incluyen cuadrícula de posicionamiento de proveedores, análisis de línea de tiempo de mercado, descripción general y guía del mercado, cuadrícula de posicionamiento de la empresa, análisis de patentes, análisis de precios, análisis de participación de mercado de la empresa, estándares de medición, análisis global versus regional y de participación de proveedores. Para obtener más información sobre la metodología de investigación, envíe una consulta para hablar con nuestros expertos de la industria.
Personalización disponible
Data Bridge Market Research es líder en investigación formativa avanzada. Nos enorgullecemos de brindar servicios a nuestros clientes existentes y nuevos con datos y análisis que coinciden y se adaptan a sus objetivos. El informe se puede personalizar para incluir análisis de tendencias de precios de marcas objetivo, comprensión del mercado de países adicionales (solicite la lista de países), datos de resultados de ensayos clínicos, revisión de literatura, análisis de mercado renovado y base de productos. El análisis de mercado de competidores objetivo se puede analizar desde análisis basados en tecnología hasta estrategias de cartera de mercado. Podemos agregar tantos competidores sobre los que necesite datos en el formato y estilo de datos que esté buscando. Nuestro equipo de analistas también puede proporcionarle datos en archivos de Excel sin procesar, tablas dinámicas (libro de datos) o puede ayudarlo a crear presentaciones a partir de los conjuntos de datos disponibles en el informe.

