
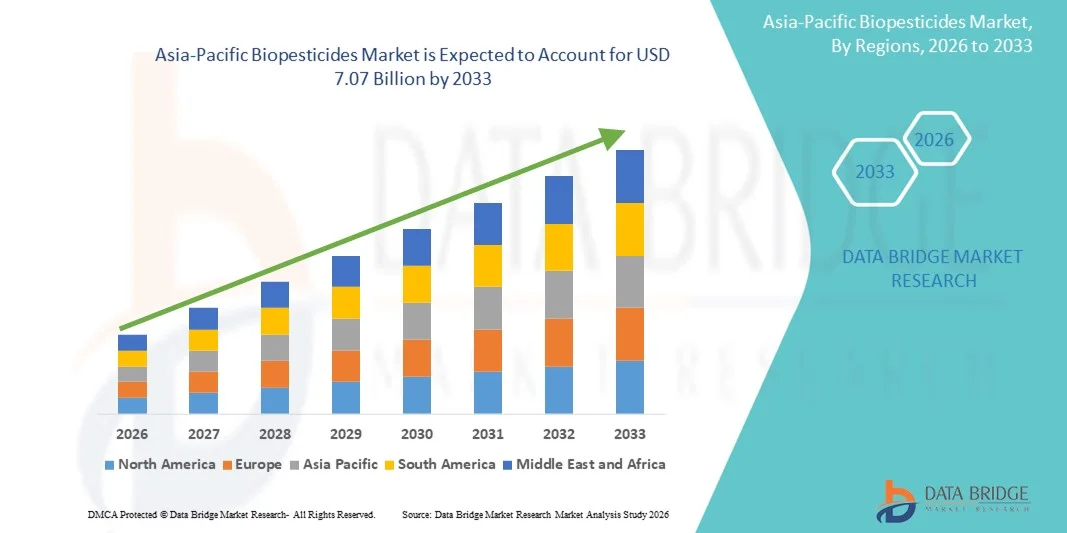
Asia Pacific Biopesticides Market
Tamaño del mercado en miles de millones de dólares
Tasa de crecimiento anual compuesta (CAGR) :
% 
 USD
2.11 Billion
USD
7.07 Billion
2025
2033
USD
2.11 Billion
USD
7.07 Billion
2025
2033
| 2026 –2033 | |
| USD 2.11 Billion | |
| USD 7.07 Billion | |
| % | |
|
Segmentación del mercado de biopesticidas en Asia-Pacífico: tipo (bioinsecticidas, biofungicidas, bionematicidas, bioherbicidas y otros), origen (microbianos, bioquímicos e insectos), presentación (seca y líquida), aplicación (foliar, fertirrigación, tratamiento del suelo, tratamiento de semillas y otros), categoría (agricultura y horticultura), cultivos (frutas y hortalizas, cereales y granos, oleaginosas y legumbres, césped y ornamentales, y otros cultivos): tendencias y pronóstico del sector hasta 2033.
¿Cuál es el tamaño y la tasa de crecimiento del mercado de biopesticidas de Asia-Pacífico?
- El tamaño del mercado de biopesticidas de Asia-Pacífico se valoró en USD 2.110 millones en 2025 y se espera que alcance los USD 7.070 millones en 2033 , con una CAGR del 5,1 % durante el período de pronóstico.
- La demanda de biopesticidas está aumentando debido a sus potenciales aplicaciones. Ofrecen diversas ventajas, como la reducción de la contaminación ambiental y del suelo, y la reducción de trazas tóxicas en la cadena alimentaria.
- Los biopesticidas se descomponen fácilmente en comparación con los pesticidas químicos y, además, contribuyen a aumentar el rendimiento del cultivo. Se utilizan a menudo como componente de los programas de manejo integrado de plagas (MIP) para obtener los resultados más eficientes.
¿Cuáles son las principales conclusiones del mercado de biopesticidas?
- Se espera que el aumento de la financiación de biopesticidas para apoyar la agricultura sostenible impulse el mercado de biopesticidas. Se prevé que las estrictas regulaciones sobre biopesticidas limiten su crecimiento.
- Se prevé que el aumento de la contaminación ambiental causada por pesticidas químicos genere oportunidades de crecimiento para el mercado de biopesticidas. Se prevé que los altos precios de los biopesticidas dificulten su crecimiento.
- En China, el mercado de biopesticidas dominó la región Asia-Pacífico con una participación estimada en los ingresos del 38,7 % en 2025, impulsado por la rápida industrialización, la fabricación de automóviles y maquinaria a gran escala y la creciente adopción en los sectores de construcción, energía renovable y equipo pesado.
- En India, se proyecta que el mercado registre la CAGR más rápida del 8,1 % entre 2026 y 2033, respaldada por la creciente adopción en aplicaciones de automoción, construcción, energía renovable y maquinaria industrial.
- El segmento de Biofungicidas dominó el mercado con una participación del 38,7% en 2025, impulsado por su amplio uso en el control de enfermedades fúngicas en frutas, verduras, cereales y cultivos de alto valor.
Alcance del informe y segmentación del mercado de biopesticidas
|
Atributos |
Perspectivas clave del mercado de biopesticidas |
|
Segmentos cubiertos |
|
|
Países cubiertos |
Asia-Pacífico
|
|
Actores clave del mercado |
|
|
Oportunidades de mercado |
|
|
Conjuntos de información de datos de valor añadido |
Además de los conocimientos sobre escenarios de mercado como valor de mercado, tasa de crecimiento, segmentación, cobertura geográfica y actores principales, los informes de mercado seleccionados por Data Bridge Market Research también incluyen análisis de expertos en profundidad, análisis de precios, análisis de participación de marca, encuesta de consumidores, análisis demográfico, análisis de la cadena de suministro, análisis de la cadena de valor, descripción general de materias primas/consumibles, criterios de selección de proveedores, análisis PESTLE, análisis de Porter y marco regulatorio. |
¿Cuál es la tendencia clave en el mercado de biopesticidas?
Creciente adopción de biopesticidas sostenibles, ecológicos y específicos
- El mercado de biopesticidas está experimentando una creciente demanda de soluciones de control de plagas seguras para el medio ambiente, biodegradables y específicas para los cultivos en los sectores de la agricultura, la horticultura y los invernaderos.
- Los fabricantes están desarrollando formulaciones basadas en microbios, botánicos y bioquímicos para mejorar la eficacia, reducir los residuos químicos y mejorar la salud del suelo y las plantas.
- El énfasis en el cumplimiento normativo, la reducción del impacto ambiental y las certificaciones de agricultura orgánica están impulsando la adopción entre los agricultores a gran escala y en pequeña escala.
- Por ejemplo, empresas como Syngenta, Koppert, Andermatt Biocontrol, Bayer y Marrone Bio Innovations están ampliando sus carteras con biofungicidas microbianos, bioinsecticidas y productos de control de plagas basados en ARNi.
- El creciente uso de biopesticidas en frutas, verduras, cereales y cultivos especiales está sustentando la expansión del mercado.
- A medida que la agricultura se centra cada vez más en la sostenibilidad, la reducción de la dependencia química y la protección precisa de los cultivos, se espera que los biopesticidas sigan siendo vitales para las soluciones agrícolas de próxima generación.
¿Cuáles son los impulsores clave del mercado de biopesticidas?
- La creciente demanda de soluciones de control de plagas eficaces, respetuosas con el medio ambiente y sin residuos está impulsando significativamente la adopción de biopesticidas en la agricultura mundial.
- Por ejemplo, durante 2024-2025, Bayer, Syngenta, Koppert, Andermatt Biocontrol y Marrone Bio Innovations lanzaron productos microbianos, botánicos y basados en ARNi diseñados para una alta eficacia, especificidad de cultivo y un menor impacto ambiental.
- La creciente adopción de agricultura orgánica, iniciativas de agricultura sostenible y estrategias de manejo integrado de plagas (MIP) está impulsando la demanda
- Los avances en el desarrollo de cepas microbianas, la tecnología de formulación y los mecanismos de administración están mejorando la eficacia, la vida útil y la facilidad de aplicación.
- Los incentivos gubernamentales, los subsidios y las regulaciones favorables para las soluciones ecológicas de protección de cultivos están promoviendo el uso de biopesticidas en lugar de pesticidas químicos.
- Con el respaldo de la creciente conciencia mundial sobre la agricultura sostenible y las preocupaciones por la seguridad alimentaria, se espera que el mercado de biopesticidas experimente un crecimiento constante a largo plazo.
¿Qué factor está obstaculizando el crecimiento del mercado de biopesticidas?
- Los costos más elevados de las formulaciones microbianas o botánicas en comparación con los pesticidas sintéticos limitan su adopción en mercados sensibles a los precios.
- La limitada conciencia, experiencia técnica y disponibilidad de biopesticidas en las regiones en desarrollo ralentiza la penetración en el mercado
- La variabilidad del rendimiento en condiciones climáticas extremas, presión de plagas o condiciones específicas del cultivo puede restringir la aplicación en ciertas instalaciones agrícolas.
- Los obstáculos regulatorios, los procesos de registro complejos y los requisitos de cumplimiento pueden retrasar el lanzamiento y la adopción de productos.
- La competencia de los pesticidas químicos de bajo costo y los métodos convencionales de protección de cultivos ejerce presión sobre los precios y reduce la participación en el mercado.
- Para superar estos desafíos, las empresas se están centrando en formulaciones rentables, educación de los agricultores, ensayos de demostración y productos específicos para cada región para impulsar una adopción más amplia de biopesticidas.
¿Cómo está segmentado el mercado de biopesticidas?
El mercado está segmentado según tipo, fuente, forma, aplicación, categoría y cultivos.
- Por tipo
El mercado está segmentado en bioinsecticidas, biofungicidas, bionematicidas, bioherbicidas y otros. El segmento de biofungicidas dominó el mercado con una participación del 38,7 % en 2025, impulsado por su amplio uso en el control de enfermedades fúngicas en frutas, hortalizas, cereales y cultivos de alto valor. Los biofungicidas mejoran el rendimiento de los cultivos, reducen los residuos químicos y mejoran la salud del suelo, lo que los convierte en una opción preferida para las prácticas agrícolas sostenibles y orgánicas.
Se espera que el segmento de Bioinsecticidas crezca a la CAGR más rápida entre 2026 y 2033, respaldado por la creciente demanda de soluciones efectivas de manejo de plagas en frutas, verduras y cultivos comerciales, junto con la creciente adopción de estrategias de manejo integrado de plagas (MIP) en todo el mundo.
- Por fuente
El mercado está segmentado en microbios, bioquímicos e insectos. El segmento de microbios dominó con una participación del 42,1 % en 2025 debido a su alta eficacia contra patógenos y plagas, su versatilidad en diferentes cultivos y su compatibilidad con la agricultura orgánica.
Se proyecta que el segmento bioquímico crecerá a la CAGR más rápida entre 2026 y 2033, impulsado por los avances en feromonas, extractos de plantas y bioestimulantes que ofrecen un control de plagas específico con un impacto ambiental mínimo.
- Por formulario
Según la forma, el mercado se segmenta en seco y líquido. El segmento líquido dominó con una participación del 55,4 % en 2025, gracias a su facilidad de aplicación, cobertura uniforme y compatibilidad con sistemas modernos de pulverización y fertirrigación.
Se espera que el segmento seco crezca a la CAGR más rápida entre 2026 y 2033, impulsado por la creciente adopción de gránulos y polvos para el tratamiento del suelo, el recubrimiento de semillas y la estabilidad a largo plazo en diversas condiciones climáticas.
- Por aplicación
El mercado está segmentado en aplicación foliar, fertirrigación, tratamiento de suelos, tratamiento de semillas y otros. La aplicación foliar dominó el mercado con una participación del 37,6 % en 2025 debido a su eficacia en el control rápido de enfermedades y plagas en cultivos de alto valor, hortalizas y frutas.
Se proyecta que el tratamiento de semillas crecerá a la CAGR más rápida entre 2026 y 2033, respaldado por un enfoque creciente en la protección preventiva de cultivos, el control temprano de plagas y patógenos y las tasas de germinación mejoradas.
- Por categoría
Según la categoría, el mercado se segmenta en Agricultura y Horticultura. El segmento de Agricultura dominó con una participación del 63,2% en 2025, impulsado por el uso extensivo de cereales, granos, oleaginosas y cultivos a gran escala.
Se espera que el segmento de horticultura crezca a la CAGR más rápida entre 2026 y 2033, impulsado por la creciente adopción de biopesticidas en frutas, verduras, plantas ornamentales y operaciones de invernadero que buscan una producción sostenible y de alta calidad.
- Por cultivos
El mercado está segmentado en frutas y verduras, cereales y granos, oleaginosas y legumbres, césped y plantas ornamentales, y otros cultivos. Las frutas y verduras dominaron con una participación del 40,8 % en 2025 debido a la alta presión de plagas, las restricciones regulatorias sobre pesticidas químicos y la necesidad de productos sin residuos.
Se proyecta que las semillas oleaginosas y las legumbres crecerán a la CAGR más rápida entre 2026 y 2033, impulsadas por la creciente demanda mundial, la adopción de prácticas agrícolas sostenibles y la creciente conciencia sobre el papel de los biopesticidas en la mejora del rendimiento de los cultivos y la salud del suelo.
¿Qué región posee la mayor participación en el mercado de biopesticidas?
- En China, el mercado de biopesticidas dominó la región Asia-Pacífico con una participación estimada en los ingresos del 38,7 % en 2025, impulsado por la rápida industrialización, la fabricación de automóviles y maquinaria a gran escala y la creciente adopción en los sectores de construcción, energía renovable y equipo pesado.
- La creciente demanda de biopesticidas ligeros, duraderos y que no requieren mantenimiento para aplicaciones de alta carga refuerza el liderazgo del mercado del país.
- Las sólidas colaboraciones con los fabricantes de equipos originales (OEM), las capacidades de fabricación avanzadas y las continuas inversiones en I+D fortalecen aún más el crecimiento del mercado a largo plazo, convirtiendo a China en un centro central para la adopción de biopesticidas en Asia-Pacífico.
Perspectiva del mercado de biopesticidas en Japón
En Japón, el crecimiento se ve impulsado por los avanzados sectores de la automoción, la aeroespacial y la maquinaria industrial. Los biopesticidas se aplican ampliamente en robótica, turbinas eólicas y equipos de precisión gracias a su baja fricción, alta resistencia al desgaste y bajo mantenimiento. El enfoque en soluciones ligeras y energéticamente eficientes, así como las sólidas alianzas con fabricantes nacionales y fabricantes de equipos originales (OEM), garantiza una adopción constante y una expansión a largo plazo del mercado en aplicaciones industriales de alta precisión.
Perspectivas del mercado de biopesticidas en India
En India, se proyecta que el mercado registre la tasa de crecimiento anual compuesta (TCAC) más rápida, del 8,1 %, entre 2026 y 2033, impulsada por la creciente adopción en aplicaciones de automoción, construcción, energías renovables y maquinaria industrial. La expansión de los centros de fabricación, la creciente adopción de vehículos eléctricos y los programas de modernización industrial respaldados por el gobierno impulsan la demanda de biopesticidas compuestos de fibra y matriz metálica. El enfoque en la eficiencia energética, la fundición de precisión y la producción sostenible acelera la penetración en el mercado regional.
Perspectiva del mercado de biopesticidas de Corea del Sur
En Corea del Sur, el crecimiento se sustenta en los sectores de automoción, electrónica y equipos industriales, donde los biopesticidas son la opción preferida para operaciones de alta carga, bajo mantenimiento y resistencia al desgaste. El creciente despliegue en componentes de vehículos eléctricos, robótica e instalaciones de energía renovable acelera su adopción. Las sólidas alianzas con fabricantes de equipos originales (OEM), la innovación tecnológica y las inversiones en I+D refuerzan la posición competitiva del país en el mercado de Asia-Pacífico.
Perspectivas del mercado australiano de biopesticidas
En Australia, el crecimiento sostenido se ve impulsado por los sectores de la construcción, la minería y las energías renovables. Los biopesticidas se utilizan cada vez más en maquinaria pesada, equipos industriales y turbinas eólicas para mejorar la durabilidad, el rendimiento de carga y la vida útil. Las mejoras industriales, el desarrollo de infraestructura y las iniciativas de energías renovables, respaldadas por el gobierno, fomentan su adopción, mientras que la expansión de la manufactura local y las exportaciones industriales impulsan la expansión del mercado a largo plazo en la región.
¿Cuáles son las principales empresas del mercado de biopesticidas?
La industria de los biopesticidas está liderada principalmente por empresas bien establecidas, entre las que se incluyen:
- Syngenta Crop Protection AG (Suiza)
- Bionema (Reino Unido)
- Vegalab SA (Suiza)
- Tecnologías bioagrícolas STK (India)
- Andermatt Biocontrol AG (Suiza)
- Sistemas biológicos Koppert (Países Bajos)
- Corteva (EE. UU.)
- Bayer AG (Alemania)
- Biobest Group NV (Bélgica)
- Certis USA LLC (EE. UU.)
- Valent BioSciences LLC (EE. UU.)
- Novozymes (Dinamarca)
- BASF SE (Alemania)
- IPL Biologicals Limited (India)
- Terramera Inc. (Canadá)
- Fertilizante biológico Khandelwal (India)
- Isagro (Italia)
- Compañía Gowan (EE. UU.)
- Parry America, Inc. (EE. UU.)
- Barrix Agro Sciences Pvt Ltd (India)
- BioWorks Inc. (EE. UU.)
- Marrone Bio Innovations (EE. UU.)
- Corporación FMC (EE. UU.)
- UPL (India)
- Nufarm (Australia)
- Bioline AgriSciences Ltd (Canadá)
- Biofa GmbH (Alemania)
- BioConsortia, Inc. (EE. UU.)
- Compañía McLaughlin Gormley King (EE. UU.)
- W. Neudorff GmbH KG (Alemania)
¿Cuáles son los desarrollos recientes en el mercado mundial de biopesticidas?
- En mayo de 2024, Bioceres Crop Solutions Corp anunció que el Ministerio de Agricultura y Ganadería de Brasil (MAPA - Ministério da Agricultura e Pecuária) aprobó tres nuevas soluciones bioinsecticidas y bionematocidas derivadas de células inactivadas de la plataforma patentada Burkholderia de la empresa, fortaleciendo las ofertas de protección de cultivos sostenibles de la empresa y expandiendo la adopción en todo Brasil.
- En mayo de 2024, FMC Corporation firmó un acuerdo con Optibrium para acelerar el descubrimiento de nuevas tecnologías de protección de cultivos, incluidos biopesticidas que aprovechan el aprendizaje automático y la inteligencia artificial, con el objetivo de mejorar la eficiencia de la investigación y la innovación en la agricultura sostenible.
- En abril de 2024, Bayer firmó un acuerdo con AlphaBio Control, con sede en el Reino Unido, sobre un nuevo insecticida biológico, el primero de su tipo para cultivos herbáceos como semillas oleaginosas, colza y cereales, que fortalece la cartera de productos de Bayer y promueve soluciones sostenibles de protección de cultivos.
- En marzo de 2024, BASF invirtió en una nueva planta de fermentación en su planta de Ludwigshafen para producir productos fitosanitarios basados en biotecnología y biología, incluidos fungicidas y tratamientos de semillas, que está previsto que comiencen a operar en la segunda mitad de 2025, apoyando a los agricultores con soluciones biopesticidas avanzadas.
- En diciembre de 2023, Syngenta presentó CERTANO, su primer producto biológico para la producción de caña de azúcar, que actúa como bionematicida y biofungicida microbiológico con acción inmediata y duradera, mejorando el crecimiento de las plantas y ofreciendo protección sostenible para los cultivos de caña de azúcar.
SKU-
Obtenga acceso en línea al informe sobre la primera nube de inteligencia de mercado del mundo

- Panel de análisis de datos interactivo
- Panel de análisis de empresas para oportunidades con alto potencial de crecimiento
- Acceso de analista de investigación para personalización y consultas
- Análisis de la competencia con panel interactivo
- Últimas noticias, actualizaciones y análisis de tendencias
- Aproveche el poder del análisis de referencia para un seguimiento integral de la competencia
Metodología de investigación
La recopilación de datos y el análisis del año base se realizan utilizando módulos de recopilación de datos con muestras de gran tamaño. La etapa incluye la obtención de información de mercado o datos relacionados a través de varias fuentes y estrategias. Incluye el examen y la planificación de todos los datos adquiridos del pasado con antelación. Asimismo, abarca el examen de las inconsistencias de información observadas en diferentes fuentes de información. Los datos de mercado se analizan y estiman utilizando modelos estadísticos y coherentes de mercado. Además, el análisis de la participación de mercado y el análisis de tendencias clave son los principales factores de éxito en el informe de mercado. Para obtener más información, solicite una llamada de un analista o envíe su consulta.
La metodología de investigación clave utilizada por el equipo de investigación de DBMR es la triangulación de datos, que implica la extracción de datos, el análisis del impacto de las variables de datos en el mercado y la validación primaria (experto en la industria). Los modelos de datos incluyen cuadrícula de posicionamiento de proveedores, análisis de línea de tiempo de mercado, descripción general y guía del mercado, cuadrícula de posicionamiento de la empresa, análisis de patentes, análisis de precios, análisis de participación de mercado de la empresa, estándares de medición, análisis global versus regional y de participación de proveedores. Para obtener más información sobre la metodología de investigación, envíe una consulta para hablar con nuestros expertos de la industria.
Personalización disponible
Data Bridge Market Research es líder en investigación formativa avanzada. Nos enorgullecemos de brindar servicios a nuestros clientes existentes y nuevos con datos y análisis que coinciden y se adaptan a sus objetivos. El informe se puede personalizar para incluir análisis de tendencias de precios de marcas objetivo, comprensión del mercado de países adicionales (solicite la lista de países), datos de resultados de ensayos clínicos, revisión de literatura, análisis de mercado renovado y base de productos. El análisis de mercado de competidores objetivo se puede analizar desde análisis basados en tecnología hasta estrategias de cartera de mercado. Podemos agregar tantos competidores sobre los que necesite datos en el formato y estilo de datos que esté buscando. Nuestro equipo de analistas también puede proporcionarle datos en archivos de Excel sin procesar, tablas dinámicas (libro de datos) o puede ayudarlo a crear presentaciones a partir de los conjuntos de datos disponibles en el informe.

