

Asia Pacific Bee Products Market
Tamaño del mercado en miles de millones de dólares
Tasa de crecimiento anual compuesta (CAGR) :
% 
 USD
4.88 Billion
USD
8.89 Billion
2024
2032
USD
4.88 Billion
USD
8.89 Billion
2024
2032
| 2025 –2032 | |
| USD 4.88 Billion | |
| USD 8.89 Billion | |
| % | |
|
Segmentación del mercado de productos apícolas en Asia-Pacífico, por tipo (miel, cera de abejas, propóleo, jalea real, veneno de abeja y otros), naturaleza (orgánica y convencional), canal de distribución (indirecto y directo): tendencias de la industria y pronóstico hasta 2032.
Tamaño del mercado de productos apícolas de Asia-Pacífico
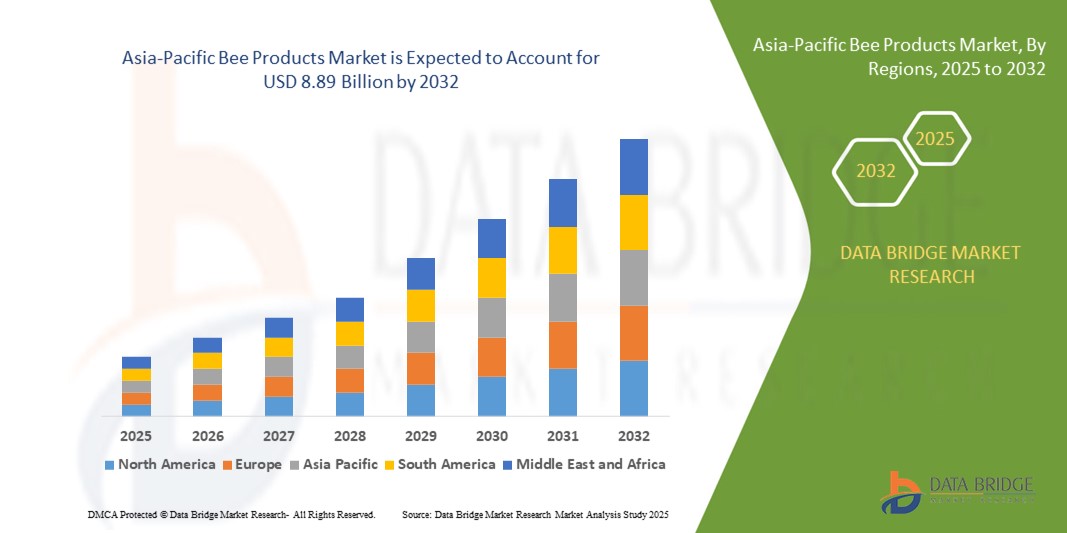
- El tamaño del mercado de productos apícolas de Asia-Pacífico se valoró en USD 4.880 millones en 2024 y se espera que alcance los USD 8.890 millones para 2032 , con una CAGR del 7,79 % durante el período de pronóstico.
- El crecimiento del mercado se debe en gran medida a la creciente demanda de suplementos naturales para la salud, una mayor conciencia de los beneficios medicinales de los productos derivados de las abejas y el uso cada vez mayor de miel, propóleo y jalea real en alimentos funcionales, cosméticos y productos farmacéuticos.
- El crecimiento también está respaldado por la creciente popularidad de la apiterapia y el creciente interés de los consumidores en productos antienvejecimiento y que refuerzan el sistema inmunológico derivados de fuentes naturales.
Análisis del mercado de productos apícolas de Asia-Pacífico
- El mercado de productos apícolas de Asia-Pacífico está experimentando un crecimiento constante debido a la creciente preferencia de los consumidores por ingredientes naturales y de etiqueta limpia. Productos como la miel, el polen de abeja, la jalea real y la cera de abeja están ganando terreno por sus propiedades antioxidantes, antibacterianas y antiinflamatorias.
- El auge de la agricultura ecológica, el crecimiento de la industria del bienestar y la incorporación de productos apícolas en fórmulas de nutrición deportiva y cuidado de la piel impulsan aún más la expansión del mercado. A medida que aumenta la sostenibilidad y la conciencia ambiental, se prevé un aumento de la demanda de productos apícolas de origen ético y trazabilidad.
- El mercado de productos apícolas de China tuvo la mayor participación en los ingresos en la región de Asia y el Pacífico en 2024, impulsado por la vasta industria apícola del país, el uso generalizado de productos apícolas en la medicina tradicional china y la expansión de las actividades de exportación.
- Se espera que Japón registre la mayor tasa de crecimiento anual compuesta (TCAC) en el mercado de productos apícolas de Asia-Pacífico debido al rápido crecimiento de su población preocupada por la salud y al creciente interés de los consumidores por los alimentos orgánicos y funcionales. La demanda del país de remedios y suplementos naturales de alta calidad está impulsando el consumo de productos apícolas como la jalea real, el propóleo y la miel en la dieta diaria.
- El segmento de la miel registró la mayor cuota de mercado en 2024, impulsado por su amplio uso en alimentos y bebidas, medicina natural y cuidado de la piel. Su posicionamiento como edulcorante natural y potenciador del sistema inmunitario ha contribuido significativamente a su creciente consumo tanto en países desarrollados como en desarrollo. Las propiedades multifuncionales de la miel la convierten en un producto básico en cocinas domésticas, productos de bienestar y aplicaciones terapéuticas, lo que mantiene su dominio del mercado.
Alcance del informe y segmentación del mercado de productos apícolas de Asia-Pacífico
|
Atributos |
Perspectivas clave del mercado de productos apícolas de Asia-Pacífico |
|
Segmentos cubiertos |
|
|
Países cubiertos |
Asia-Pacífico
|
|
Actores clave del mercado |
• Apis India Ltd. (India) |
|
Oportunidades de mercado |
• Expansión de los productos apícolas en la nutrición deportiva y las bebidas funcionales |
|
Conjuntos de información de datos de valor añadido |
Además de los conocimientos sobre escenarios de mercado, como valor de mercado, tasa de crecimiento, segmentación, cobertura geográfica y actores principales, los informes de mercado seleccionados por Data Bridge Market Research también incluyen análisis en profundidad de expertos, análisis de precios, análisis de participación de marca, encuesta de consumidores, análisis demográfico, análisis de la cadena de suministro, análisis de la cadena de valor, descripción general de materias primas/consumibles, criterios de selección de proveedores, análisis PESTLE, análisis de Porter y marco regulatorio. |
Tendencias del mercado de productos apícolas en Asia-Pacífico
Aumento de la demanda de productos apícolas funcionales y medicinales
- La creciente preferencia de los consumidores por soluciones naturales y funcionales para la salud está transformando el mercado de productos apícolas, con un mayor interés en la miel, la jalea real, el propóleo y el polen de abeja debido a sus propiedades antioxidantes, antibacterianas y estimulantes del sistema inmunitario. Estos productos se utilizan cada vez más en suplementos dietéticos y remedios naturales para la salud preventiva.
- Tanto en los mercados desarrollados como en los emergentes, los ingredientes derivados de las abejas se están incorporando a nutracéuticos, productos de cuidado personal y formulaciones terapéuticas. Esta demanda se ve impulsada por el movimiento del bienestar y la creciente concienciación sobre los productos de etiqueta limpia y sin químicos que ofrecen beneficios holísticos.
- El auge de la apiterapia, que utiliza productos apícolas con fines curativos, también impulsa la innovación en los sectores farmacéutico y de la medicina alternativa. Los consumidores recurren a formulaciones a base de abejas para afecciones como la inflamación, las infecciones y la salud cutánea, lo que contribuye a la diversificación de las aplicaciones de los productos.
- Por ejemplo, en 2023, varias marcas de bienestar en Asia-Pacífico, especialmente en Japón, Corea del Sur y Australia, lanzaron aerosoles para la garganta y tónicos inmunoestimulantes a base de propóleo, diseñados para prevenir enfermedades estacionales. Estos productos ganaron gran popularidad entre los consumidores preocupados por su salud que buscan soluciones naturales y preventivas. La fuerte demanda se vio impulsada por el creciente conocimiento de los ingredientes funcionales y la creciente preferencia por remedios tradicionales combinados con fórmulas modernas en la región.
- Mientras el mercado se expande, el éxito depende de la estandarización sostenida de los productos, la trazabilidad y el control de calidad. Las empresas deben centrarse en el abastecimiento ético y el etiquetado transparente para mantener la confianza del consumidor y satisfacer la creciente demanda de productos apícolas funcionales y de primera calidad.
Dinámica del mercado de productos apícolas en Asia-Pacífico
Conductor
Creciente preferencia por productos naturales para la salud y el cuidado personal
La transición hacia soluciones naturales y sin químicos está impulsando significativamente la adopción de productos apícolas en los sectores alimentario, cosmético y farmacéutico. Los consumidores buscan cada vez más productos percibidos como seguros, eficaces y sostenibles, que respeten el origen natural y el valor terapéutico de ingredientes apícolas como la miel, la cera de abejas y la jalea real.
En la industria de la belleza y el cuidado personal, la cera de abeja y la miel se utilizan ampliamente en productos orgánicos para el cuidado de la piel, los labios y el cabello debido a sus beneficios hidratantes, antiinflamatorios y antimicrobianos. Esta tendencia también se evidencia en los suplementos alimenticios que incorporan propóleo y polen para mejorar la inmunidad y la vitalidad.
El apoyo regulatorio a los sistemas de medicina tradicional y natural está ampliando aún más su alcance en el mercado. La creciente inclusión de ingredientes apícolas en las listas de productos aprobados y las categorías de alimentos funcionales está permitiendo una mayor aceptación y distribución.
• Por ejemplo, en 2022, el Ministerio de Seguridad Alimentaria y Farmacéutica de Corea del Sur autorizó el extracto de propóleo como ingrediente funcional en suplementos para la salud, lo que fomentó el lanzamiento de nuevos productos e impulsó la demanda tanto en los mercados nacionales como en los de exportación.
• Si bien las preferencias naturales están impulsando el mercado hacia adelante, garantizar la autenticidad y gestionar los riesgos de adulteración serán esenciales para la confianza a largo plazo y el crecimiento sostenible.
Restricción/Desafío
Amenazas del colapso de las colonias y la inestabilidad ambiental
Una de las principales limitaciones en el mercado de productos apícolas es la creciente amenaza del síndrome de colapso de colonias (SCC) y la degradación ambiental. La disminución de las poblaciones de abejas debido al uso de pesticidas, la pérdida de hábitat y el cambio climático impacta significativamente la disponibilidad de materias primas y la sostenibilidad de las cadenas de suministro apícolas.
Las fluctuaciones en las condiciones climáticas afectan los ciclos de floración y la disponibilidad de néctar, lo que a su vez reduce la producción de miel y perturba las operaciones del apiario. Esta imprevisibilidad limita la consistencia en la calidad y el volumen del producto, lo que plantea desafíos para los fabricantes que dependen de un suministro estable para la producción a gran escala.
Los apicultores, especialmente en las regiones en desarrollo, también enfrentan desafíos relacionados con el manejo de enfermedades, la exposición a pesticidas y el acceso limitado a prácticas apícolas modernas. Estos problemas afectan la capacidad de producción y limitan la capacidad de satisfacer la creciente demanda industrial y de consumo.
• Por ejemplo, en 2023, las asociaciones de apicultura de Asia y el Pacífico informaron pérdidas significativas en el rendimiento de la miel debido a patrones climáticos inusualmente húmedos, lo que afectó los contratos de suministro de productos de miel orgánica y de primera calidad.
• Para mitigar estos riesgos, las partes interesadas deben invertir en prácticas apícolas sostenibles, en la investigación de cepas de abejas resistentes a las enfermedades y en una mejor conservación de los ecosistemas para salvaguardar el suministro a largo plazo y la estabilidad del mercado.
Alcance del mercado de productos apícolas de Asia-Pacífico
El mercado está segmentado según tipo, naturaleza y canal de distribución.
- Por tipo
Según el tipo, el mercado de productos apícolas de Asia-Pacífico se segmenta en miel, cera de abejas, propóleo, jalea real, veneno de abeja, entre otros. El segmento de la miel registró la mayor cuota de mercado en 2024, impulsado por su amplio uso en alimentos y bebidas, medicina natural y cuidado de la piel. Su posicionamiento como edulcorante natural y potenciador del sistema inmunitario ha contribuido significativamente a su creciente consumo tanto en países desarrollados como en desarrollo. Las propiedades multifuncionales de la miel la convierten en un producto básico en la cocina, productos de bienestar y aplicaciones terapéuticas, lo que mantiene su dominio del mercado.
Se prevé que el segmento del propóleo experimente su mayor crecimiento entre 2025 y 2032, impulsado por su creciente inclusión en nutracéuticos y productos de cuidado personal. Sus beneficios antiinflamatorios, antivirales y antimicrobianos impulsan una fuerte demanda entre los consumidores preocupados por la salud y las marcas de bienestar. Se espera que el auge en el desarrollo de productos funcionales, en particular fórmulas que refuerzan el sistema inmunitario y productos para el cuidado de la piel, acelere la adopción del propóleo en los mercados globales.
- Por naturaleza
En función de su naturaleza, el mercado de productos apícolas de Asia-Pacífico se segmenta en orgánico y convencional. El segmento convencional representó la mayor cuota de mercado en 2024, gracias a su amplia disponibilidad y precio más bajo en comparación con sus homólogos orgánicos certificados. Los productos apícolas convencionales son adquiridos principalmente por fabricantes de alimentos, productos farmacéuticos y cosméticos para el mercado de consumo masivo gracias a la estabilidad de las cadenas de suministro y su rentabilidad.
Se prevé que el segmento orgánico experimente el mayor crecimiento entre 2025 y 2032, impulsado por la creciente concienciación de los consumidores sobre los productos sin químicos y el abastecimiento sostenible. La demanda de miel, cera de abeja y jalea real con certificación orgánica está en aumento en los mercados con conciencia ecológica y de salud. Los productos apícolas orgánicos están ganando terreno en los canales premium de venta directa al consumidor, ya que los compradores buscan cada vez más ingredientes trazables y de origen ético.
- Por canal de distribución
Según el canal de distribución, el mercado de productos apícolas de Asia-Pacífico se segmenta en canales directos e indirectos. El segmento indirecto dominó el mercado en 2024 gracias a la amplia presencia de supermercados, farmacias, tiendas de alimentos saludables y plataformas de comercio electrónico. Estos puntos de venta garantizan un amplio acceso al consumidor y contribuyen a un alto volumen de ventas, especialmente de miel envasada, aerosoles de propóleo y suplementos apícolas.
Se prevé que el segmento directo experimente el mayor crecimiento entre 2025 y 2032, impulsado por la creciente popularidad de los modelos de venta directa del campo al consumidor y las marcas de productos apícolas artesanales. Los apicultores y productores especializados están aprovechando cada vez más la venta directa a través de plataformas en línea, mercados de agricultores y modelos de suscripción. Esto permite una mayor transparencia de los productos, precios premium y una mayor interacción con el cliente, impulsando el crecimiento de este segmento.
Análisis regional del mercado de productos apícolas de Asia-Pacífico
- El mercado de productos apícolas de China tuvo la mayor participación en los ingresos en la región de Asia y el Pacífico en 2024, impulsado por la vasta industria apícola del país, el uso generalizado de productos apícolas en la medicina tradicional china y la expansión de las actividades de exportación.
- La miel, la jalea real y el propóleo siguen siendo productos básicos en aplicaciones alimentarias, farmacéuticas y cosméticas. El apoyo gubernamental a las prácticas apícolas modernas y los avances tecnológicos en el refinamiento de productos están fortaleciendo la capacidad de producción nacional.
- Además, la creciente clase media de China y la creciente demanda de suplementos naturales para la salud siguen impulsando un sólido crecimiento del mercado en los segmentos minoristas e institucionales.
Perspectiva del mercado de productos apícolas en Japón
Se prevé que el mercado japonés de productos apícolas experimente su mayor crecimiento entre 2025 y 2032, debido a la creciente preferencia por productos alimenticios funcionales de etiqueta limpia y soluciones tradicionales para el bienestar. Los consumidores japoneses se sienten especialmente atraídos por la miel premium, la jalea real y el propóleo por sus reconocidos beneficios para la salud, especialmente en las poblaciones de edad avanzada. La integración de productos apícolas en nutracéuticos, cosméticos y bebidas fortificadas es cada vez más frecuente. Los canales de distribución consolidados del país y la innovación en formulaciones de productos para la salud contribuyen a una expansión constante del mercado. Además, el sólido marco regulatorio de Japón y la confianza de los consumidores en las normas de seguridad refuerzan la demanda de productos apícolas de alta calidad y trazabilidad.
Cuota de mercado de productos apícolas en Asia-Pacífico
La industria de productos apícolas de Asia y el Pacífico está liderada principalmente por empresas bien establecidas, entre las que se incluyen:
• Apis India Ltd. (India)
• Dabur India Ltd. (India)
• Patanjali Ayurved Ltd. (India)
• Hitkari Pharmacy (India)
• YS Organic Bee Farms (Corea del Sur)
• Manuka Health (Nueva Zelanda)
• Honey Australia Pty Ltd. (Australia)
• Taiwan Bee Products Co., Ltd. (Taiwán)
• Comvita China Ltd. (China)
• Nature Nate's Honey Co. Asia (Singapur)
Últimos avances en el mercado de productos apícolas de Asia-Pacífico
- En agosto de 2024, Badshah Masala, en colaboración con la Fundación Ennoble para la Innovación Social, emprendió una iniciativa de desarrollo comunitario con la inauguración de la renovada Escuela Primaria GPS Nargol Mukhya y Bhata Fadiyu Aanganwadi en Umbergaon, Gujarat. Esta iniciativa se centró en mejorar la infraestructura, el saneamiento y los entornos de aprendizaje para más de 250 estudiantes. El desarrollo busca mejorar el acceso a la educación y los estándares de higiene, creando un ambiente de aprendizaje más propicio. Esta iniciativa refleja el compromiso de la empresa con la responsabilidad social corporativa y contribuye al bienestar comunitario a largo plazo y al empoderamiento de los jóvenes.
- En diciembre de 2024, Dabur India Limited lanzó su campaña "Ciencia en Acción" como parte de una iniciativa de educación y concientización de marca. La campaña se centró en promover el Ayurveda mediante información basada en la evidencia, con contenido digital, medios impresos y seminarios educativos. Al combinar el conocimiento tradicional con la validación científica moderna, Dabur busca fortalecer la confianza del consumidor y ampliar el atractivo del Ayurveda entre el público preocupado por la salud. Se espera que esta iniciativa fortalezca la posición de Dabur en el mercado e impulse la interacción con consumidores informados y preocupados por la salud.
SKU-
Obtenga acceso en línea al informe sobre la primera nube de inteligencia de mercado del mundo

- Panel de análisis de datos interactivo
- Panel de análisis de empresas para oportunidades con alto potencial de crecimiento
- Acceso de analista de investigación para personalización y consultas
- Análisis de la competencia con panel interactivo
- Últimas noticias, actualizaciones y análisis de tendencias
- Aproveche el poder del análisis de referencia para un seguimiento integral de la competencia
Metodología de investigación
La recopilación de datos y el análisis del año base se realizan utilizando módulos de recopilación de datos con muestras de gran tamaño. La etapa incluye la obtención de información de mercado o datos relacionados a través de varias fuentes y estrategias. Incluye el examen y la planificación de todos los datos adquiridos del pasado con antelación. Asimismo, abarca el examen de las inconsistencias de información observadas en diferentes fuentes de información. Los datos de mercado se analizan y estiman utilizando modelos estadísticos y coherentes de mercado. Además, el análisis de la participación de mercado y el análisis de tendencias clave son los principales factores de éxito en el informe de mercado. Para obtener más información, solicite una llamada de un analista o envíe su consulta.
La metodología de investigación clave utilizada por el equipo de investigación de DBMR es la triangulación de datos, que implica la extracción de datos, el análisis del impacto de las variables de datos en el mercado y la validación primaria (experto en la industria). Los modelos de datos incluyen cuadrícula de posicionamiento de proveedores, análisis de línea de tiempo de mercado, descripción general y guía del mercado, cuadrícula de posicionamiento de la empresa, análisis de patentes, análisis de precios, análisis de participación de mercado de la empresa, estándares de medición, análisis global versus regional y de participación de proveedores. Para obtener más información sobre la metodología de investigación, envíe una consulta para hablar con nuestros expertos de la industria.
Personalización disponible
Data Bridge Market Research es líder en investigación formativa avanzada. Nos enorgullecemos de brindar servicios a nuestros clientes existentes y nuevos con datos y análisis que coinciden y se adaptan a sus objetivos. El informe se puede personalizar para incluir análisis de tendencias de precios de marcas objetivo, comprensión del mercado de países adicionales (solicite la lista de países), datos de resultados de ensayos clínicos, revisión de literatura, análisis de mercado renovado y base de productos. El análisis de mercado de competidores objetivo se puede analizar desde análisis basados en tecnología hasta estrategias de cartera de mercado. Podemos agregar tantos competidores sobre los que necesite datos en el formato y estilo de datos que esté buscando. Nuestro equipo de analistas también puede proporcionarle datos en archivos de Excel sin procesar, tablas dinámicas (libro de datos) o puede ayudarlo a crear presentaciones a partir de los conjuntos de datos disponibles en el informe.

