Mercado de ataxia de Asia y el Pacífico, por tipo (ataxias espinocerebelosas, ataxia-telangiectasia, ataxia episódica y otras [atrofia multisistémica (MSA)]), producto ( tratamiento y diagnóstico), forma farmacéutica (sólida, líquida y otras), vía de administración (oral, parenteral y otras), tipo de paciente (adulto, niño y geriátrico), usuario final (hospital, clínicas, atención médica domiciliaria y otros), canal de distribución (licitación directa, ventas minoristas y otros) - Tendencias de la industria y pronóstico hasta 2029.
Análisis y perspectivas del mercado de Asia y el Pacífico
La creciente prevalencia de la enfermedad de ataxia ha aumentado la demanda del mercado. El aumento del gasto sanitario para mejorar los servicios sanitarios también contribuye al crecimiento del mercado. Durante este período crucial, los principales actores del mercado están muy centrados en el lanzamiento y la aprobación de productos. Además, el gobierno y los organismos reguladores están apoyando a los actores del mercado mediante la aprobación de productos debido al aumento de la aparición de nuevos productos.
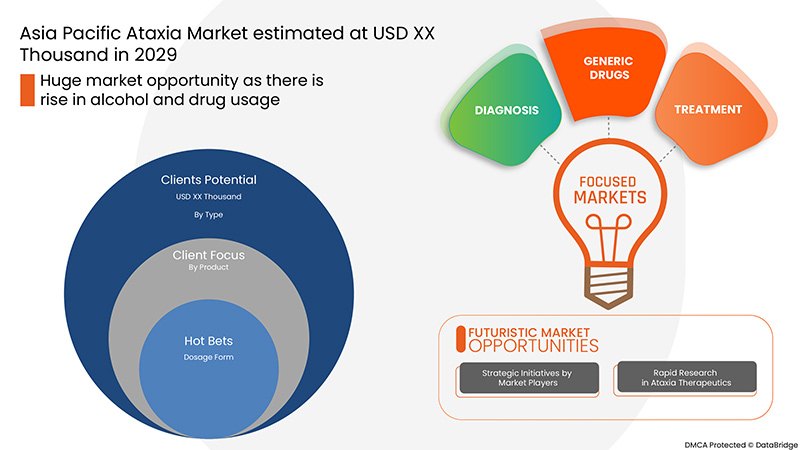
El mercado de la ataxia en Asia y el Pacífico está creciendo en el año de pronóstico debido al aumento de los actores del mercado y la disponibilidad de productos avanzados. Junto con esto, los fabricantes están involucrados en actividades de I+D para lanzar productos novedosos al mercado. Se espera que la creciente investigación en el campo de la terapéutica de la ataxia y el aumento en el consumo de alcohol y drogas impulsen aún más el crecimiento del mercado. Sin embargo, la dificultad para diagnosticar la enfermedad y la falta de instalaciones de pruebas genéticas en algunos países en desarrollo podrían obstaculizar el crecimiento del mercado de la ataxia en Asia y el Pacífico en el período de pronóstico.
El aumento del gasto sanitario y las iniciativas estratégicas de los agentes del mercado pueden ofrecer oportunidades para mejorar el tratamiento. Sin embargo, se espera que algunas normas y reglamentaciones estrictas asociadas con la aprobación de medicamentos y productos y el retiro de productos de varias empresas supongan un reto para el crecimiento del mercado.
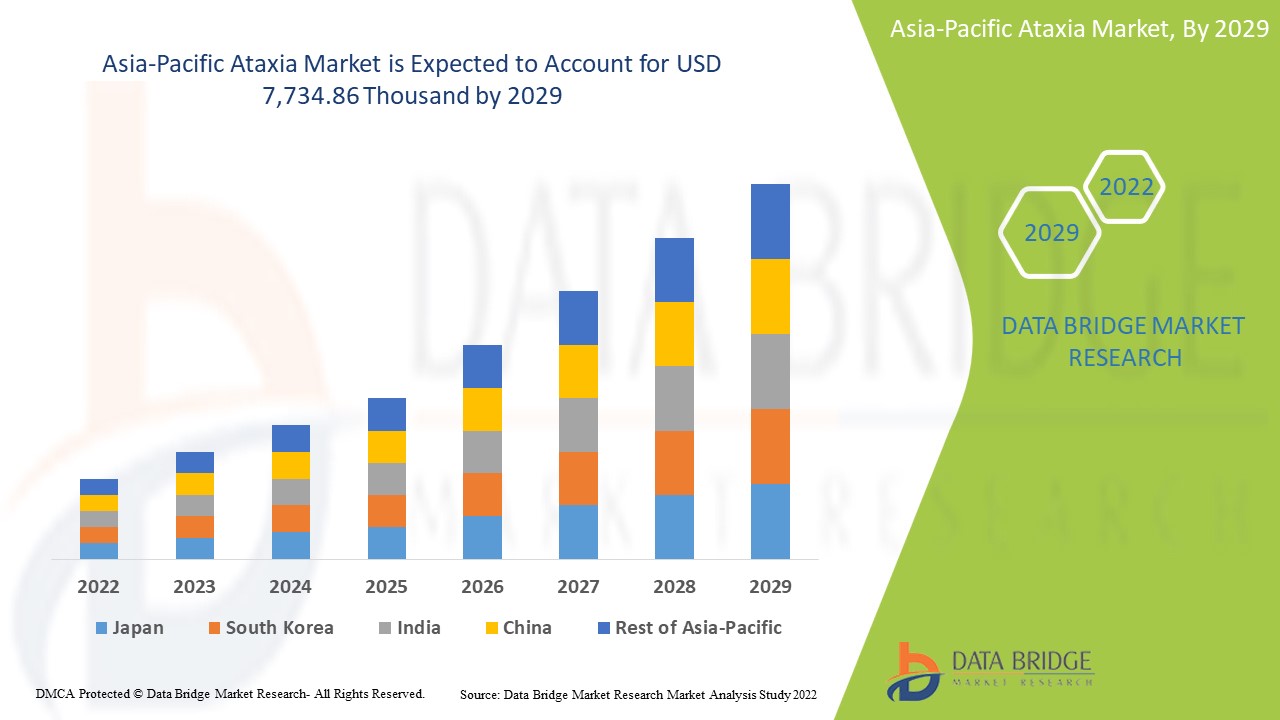
Se espera que el mercado de ataxia de Asia-Pacífico gane crecimiento de mercado en el período de pronóstico de 2022 a 2029. Data Bridge Market Research analiza que el mercado está creciendo con una CAGR del 7,8% en el período de pronóstico de 2022 a 2029 y se espera que alcance los USD 7.734,86 mil para 2029 desde USD 4.443,95 mil en 2021.
|
Métrica del informe |
Detalles |
|
Período de pronóstico |
2022 a 2029 |
|
Año base |
2021 |
|
Años históricos |
2020 |
|
Unidades cuantitativas |
Ingresos en miles de USD, precios en USD |
|
Segmentos cubiertos |
Por tipo ( ataxias espinocerebelosas , ataxia-telangiectasia, ataxia episódica y otras [atrofia multisistémica (MSA)]), producto ( tratamiento y diagnóstico), forma farmacéutica (sólida, líquida y otras), vía de administración (oral, parenteral y otras), tipo de paciente (adulto, niño y geriátrico), usuario final (hospital, clínicas, atención médica domiciliaria y otros), canal de distribución (licitación directa, ventas minoristas y otros) |
|
Países cubiertos |
China, Japón, India, Corea del Sur, Australia, Singapur, Tailandia, Malasia, Indonesia, Filipinas, Vietnam, Resto de Asia-Pacífico |
|
Actores del mercado cubiertos |
Novartis AG, Merck KGaA, Aurobindo Pharma., Pfizer Inc., Sanofi, Teva Pharmaceutical Industries Ltd., Viatris Inc., Sun Pharmaceutical Industries Ltd., Lupin., Amneal Pharmaceuticals LLC., Apotex Inc., Cipla Inc., Reata Pharmaceuticals, Inc., Biohaven Pharmaceuticals, entre otros. |
Definición de mercado
El término ataxia se refiere a un grupo de trastornos que afectan la coordinación, el equilibrio y el habla. Cualquier parte del cuerpo puede verse afectada, pero las personas con ataxia suelen tener dificultades con el equilibrio, al caminar, al hablar, a tragar y con las tareas que requieren un alto grado de control, como escribir, comer y ver. Los síntomas exactos y su gravedad varían según el tipo de ataxia que tenga la persona.
La ataxia suele ser consecuencia de un daño en una parte del cerebro llamada cerebelo, pero también puede ser causada por daños en otras partes del sistema nervioso. Este daño puede ser parte de una enfermedad subyacente, como la esclerosis múltiple (EM), o puede ser causado por una lesión en la cabeza, la falta de oxígeno en el cerebro o el consumo excesivo de alcohol a largo plazo. La ataxia hereditaria es causada por un gen defectuoso transmitido por miembros de la familia que pueden o no estar afectados.
Dinámica del mercado de la ataxia en Asia y el Pacífico
Conductores
- Aumento de la prevalencia e incidencia de la ataxia
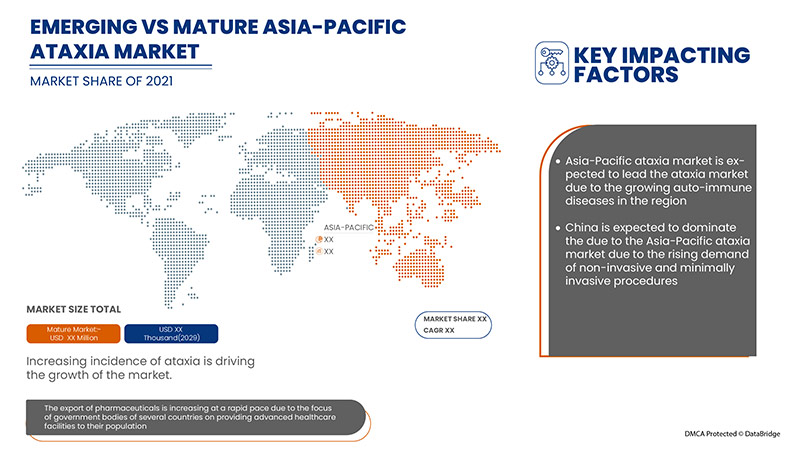
Ataxia es el término que se utiliza para referirse a las enfermedades neurológicas relacionadas con el sistema nervioso que afectan el movimiento y la coordinación. Las personas con ataxia suelen tener problemas de equilibrio, coordinación, deglución y habla. La ataxia suele desarrollarse debido a un daño en una parte del cerebro, que es el cerebelo, que coordina el movimiento. Es una enfermedad poco común y su incidencia es muy prevalente a nivel mundial. La enfermedad ha sido ampliamente reconocida como un problema clínico importante en todo el mundo, con una alta carga de morbilidad y mortalidad. Por lo tanto, el aumento de la prevalencia y las tasas de incidencia de la ataxia que afecta a diferentes grupos de edad impulsan el mercado de la ataxia en Asia y el Pacífico.
- Investigación rápida en el campo de la terapéutica de la ataxia
Se ha informado de una enorme variedad de factores de riesgo para la ataxia. Por lo tanto, para reducir los factores de riesgo y los síntomas asociados a ella, se están llevando a cabo diversas investigaciones en el campo de los tratamientos de la ataxia. También se han iniciado algunas financiaciones gubernamentales para tratar varios tipos de ataxia en el mercado. Diversas investigaciones rápidas en el campo de la terapéutica de la ataxia pueden ayudar a impulsar el mercado durante el período previsto y anticipar el importante crecimiento en la investigación y el desarrollo de la misma.
Oportunidades
- Aumento del gasto sanitario
El gasto sanitario ha aumentado en todo el mundo a medida que aumenta el ingreso disponible de las personas en varios países. Además, para satisfacer las necesidades de la población, los organismos gubernamentales y las organizaciones sanitarias están tomando la iniciativa acelerando el gasto sanitario. El aumento del gasto sanitario ayuda simultáneamente a los centros sanitarios a mejorar sus instalaciones de tratamiento para la ataxia, ya que el trastorno ha sido muy frecuente en los últimos años.
Además, las iniciativas estratégicas adoptadas por los actores clave del mercado proporcionarán integridad estructural y oportunidades futuras para el mercado de la ataxia en el período de pronóstico de 2022 a 2029.
Restricciones/Desafíos
Sin embargo, la dificultad para diagnosticar la enfermedad y la falta de instalaciones para realizar pruebas genéticas en algunos de los países en desarrollo impedirán el crecimiento del mercado de la ataxia. Además, las normas y regulaciones estrictas supondrán un reto adicional para el mercado del período de pronóstico.
Este informe sobre el mercado de la ataxia en Asia y el Pacífico proporciona detalles de los nuevos desarrollos recientes, las regulaciones comerciales, el análisis de las importaciones y exportaciones, el análisis de la producción, la optimización de la cadena de valor, la participación de mercado, el impacto de los actores del mercado nacional y localizado, analiza las oportunidades en términos de los bolsillos de ingresos emergentes, los cambios en las regulaciones del mercado, el análisis estratégico del crecimiento del mercado, el tamaño del mercado, los crecimientos del mercado por categorías, los nichos de aplicación y el dominio, las aprobaciones de productos, los lanzamientos de productos, las expansiones geográficas y las innovaciones tecnológicas en el mercado. Para obtener más información sobre el mercado de la ataxia en Asia y el Pacífico, comuníquese con Data Bridge Market Research para obtener un informe de analista; nuestro equipo lo ayudará a tomar una decisión de mercado informada para lograr el crecimiento del mercado.
Impacto posterior a la COVID-19 en el mercado de ataxia en Asia y el Pacífico
La COVID-19 ha afectado positivamente al mercado. Los confinamientos y el aislamiento durante las pandemias complican el manejo de las enfermedades y la adherencia a la medicación. Por ello, el uso de diversos medicamentos para el tratamiento ha aumentado considerablemente entre la población mundial. Por tanto, la pandemia ha afectado positivamente a este mercado.
Desarrollo reciente
- En noviembre de 2022, Pfizer Inc. anunció que la empresa había completado la adquisición de Arena Pharmaceuticals. Se trata de una empresa en fase clínica que desarrolla terapias potenciales innovadoras para tratar varias enfermedades inmunoinflamatorias. Esto ha ayudado a la empresa a aumentar su cartera de productos con esta adquisición.
Alcance del mercado de la ataxia en Asia y el Pacífico
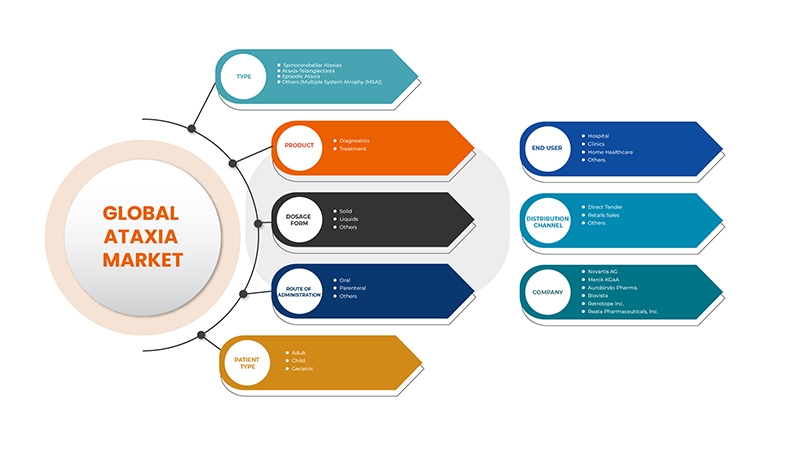
El mercado de ataxia en Asia-Pacífico está segmentado por tipo, producto, forma de dosificación, vía de administración, tipo de paciente, usuario final y canal de distribución. El crecimiento entre estos segmentos le ayudará a analizar los escasos segmentos de crecimiento en las industrias y brindará a los usuarios una valiosa descripción general del mercado y conocimientos del mercado para tomar decisiones estratégicas para identificar las principales aplicaciones del mercado.
Tipo
- Ataxias espinocerebelosas
- Ataxia-Telangiectasia
- Ataxia episódica
- Otros (Atrofia multisistémica (MSA))
Según el tipo, el mercado de ataxia de Asia y el Pacífico está segmentado en ataxias espinocerebelosas, ataxia-telangiectasia, ataxia episódica y otras (atrofia multisistémica (MSA)).
Producto
- Diagnóstico
- Tratamiento
Sobre la base del producto, el mercado de ataxia de Asia-Pacífico está segmentado en tratamiento y diagnóstico.
Forma de dosificación
- Sólido
- Líquidos
- Otros
Sobre la base de la forma de dosificación, el mercado de ataxia de Asia y el Pacífico está segmentado en sólidos, líquidos y otros.
Vía de administración
- Oral
- Parenteral
- Otros
Según la vía de administración, el mercado de ataxia de Asia y el Pacífico está segmentado en oral, parenteral y otros.
Tipo de paciente
- Adulto
- Niño
- Geriátrico
Según el tipo de paciente, el mercado de ataxia de Asia y el Pacífico se segmenta en adultos, niños y geriátricos.
Usuario final
- Hospital
- Clínicas
- Atención médica domiciliaria
- Otros
Sobre la base de los usuarios finales, el mercado de ataxia de Asia y el Pacífico está segmentado en hospitales, clínicas, atención médica domiciliaria y otros.
Canal de distribución
- Licitación directa
- Ventas al por menor
- Otros
Sobre la base del canal de distribución, el mercado de ataxia de Asia-Pacífico se segmenta en licitación directa, ventas minoristas y otros.
Análisis y perspectivas regionales del mercado de ataxia en Asia y el Pacífico
Se analiza el mercado de ataxia de Asia y el Pacífico y se proporcionan información y tendencias sobre el tamaño del mercado por país, tipo, producto, forma de dosificación, vía de administración, tipo de paciente, usuario final y canal de distribución.
Algunos de los países incluidos en esta región son China, Japón, India, Corea del Sur, Australia, Singapur, Tailandia, Malasia, Indonesia, Filipinas, Vietnam y el resto de Asia-Pacífico. Se espera que China domine el mercado de ataxia de Asia-Pacífico en términos de participación de mercado e ingresos de mercado y seguirá desarrollando su dominio durante el período de pronóstico. Esto se debe a la alta prevalencia de ataxia en la región y al rápido desarrollo de la investigación que está impulsando el mercado.
La sección de países del informe también proporciona factores de impacto individuales en el mercado y cambios en las regulaciones del mercado que afectan las tendencias actuales y futuras del mercado. Los puntos de datos, como las ventas de productos nuevos y de reemplazo, la demografía del país, la epidemiología de las enfermedades y los aranceles de importación y exportación, son algunos de los principales indicadores utilizados para pronosticar el escenario del mercado para cada país. Además, se consideran la presencia y disponibilidad de marcas de Asia-Pacífico y los desafíos que enfrentan debido a la alta competencia de las marcas locales y nacionales y el impacto de los canales de venta al proporcionar un análisis de pronóstico de los datos del país.
Análisis del panorama competitivo y de la cuota de mercado de la ataxia en Asia y el Pacífico
El panorama competitivo del mercado de ataxia en Asia-Pacífico proporciona detalles de los competidores. Los detalles incluidos son una descripción general de la empresa, las finanzas de la empresa, los ingresos generados, el potencial de mercado, la inversión en investigación y desarrollo, las nuevas iniciativas de mercado, la presencia global, los sitios e instalaciones de producción, las capacidades de producción, las fortalezas y debilidades de la empresa, el lanzamiento de productos, la amplitud y variedad de productos y el dominio de las aplicaciones. Los puntos de datos anteriores proporcionados solo están relacionados con el enfoque de las empresas en el mercado de ataxia en Asia-Pacífico.
Algunos de los principales actores que operan en el mercado de ataxia en Asia-Pacífico son Novartis AG, Merck KGaA, Aurobindo Pharma., Pfizer Inc., Sanofi, Teva Pharmaceutical Industries Ltd., Viatris Inc., Sun Pharmaceutical Industries Ltd., Lupin., Amneal Pharmaceuticals LLC., Apotex Inc., Cipla Inc., Reata Pharmaceuticals, Inc., Biohaven Pharmaceuticals, entre otros.
Metodología de la investigación
La recopilación de datos y el análisis del año base se realizan utilizando módulos de recopilación de datos con muestras de gran tamaño. Los datos del mercado se analizan y estiman utilizando modelos estadísticos y coherentes de mercado. Además, el análisis de la participación de mercado y el análisis de tendencias clave son los principales factores de éxito en el informe de mercado. La metodología de investigación clave utilizada por el equipo de investigación de DBMR es la triangulación de datos, que implica la extracción de datos, el análisis del impacto de las variables de datos en el mercado y la validación primaria (experto en la industria). Aparte de esto, los modelos de datos incluyen la cuadrícula de posicionamiento de proveedores, el análisis de la línea de tiempo del mercado, la descripción general y la guía del mercado, la cuadrícula de posicionamiento de la empresa, el análisis de la participación de mercado de la empresa, los estándares de medición, Asia-Pacífico frente a la región y el análisis de la participación de los proveedores. Solicite una llamada de un analista en caso de tener más consultas.
SKU-
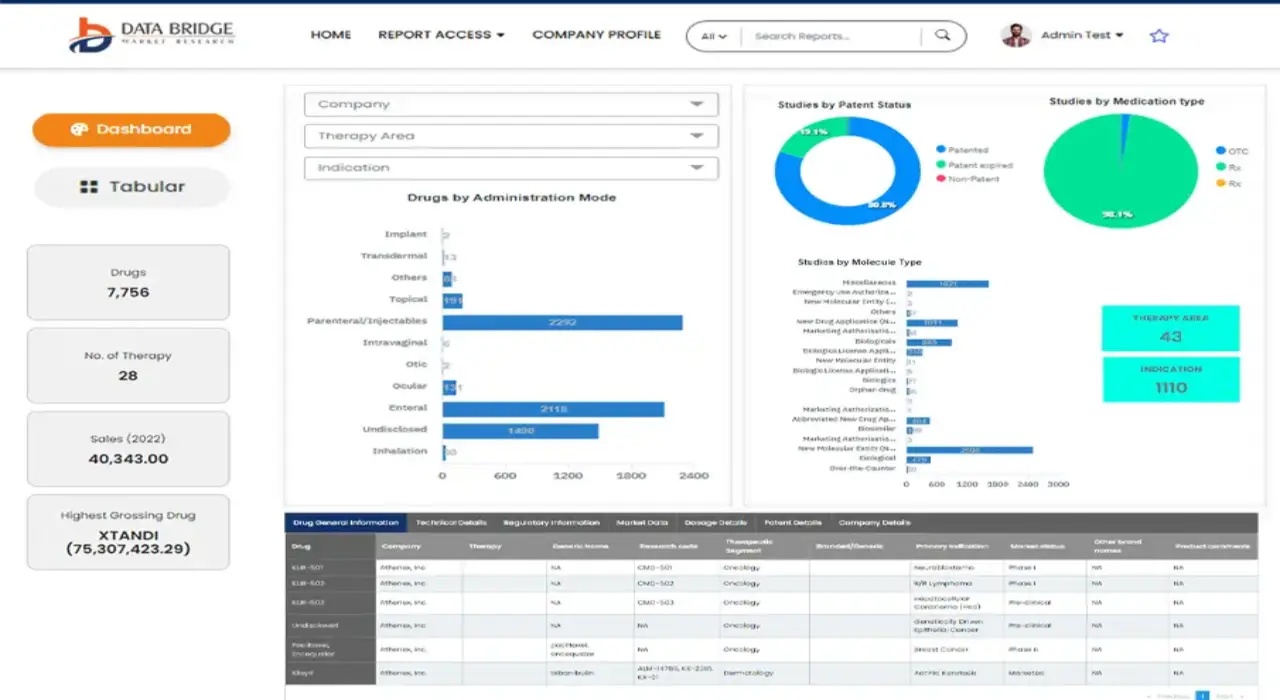
Obtenga acceso en línea al informe sobre la primera nube de inteligencia de mercado del mundo
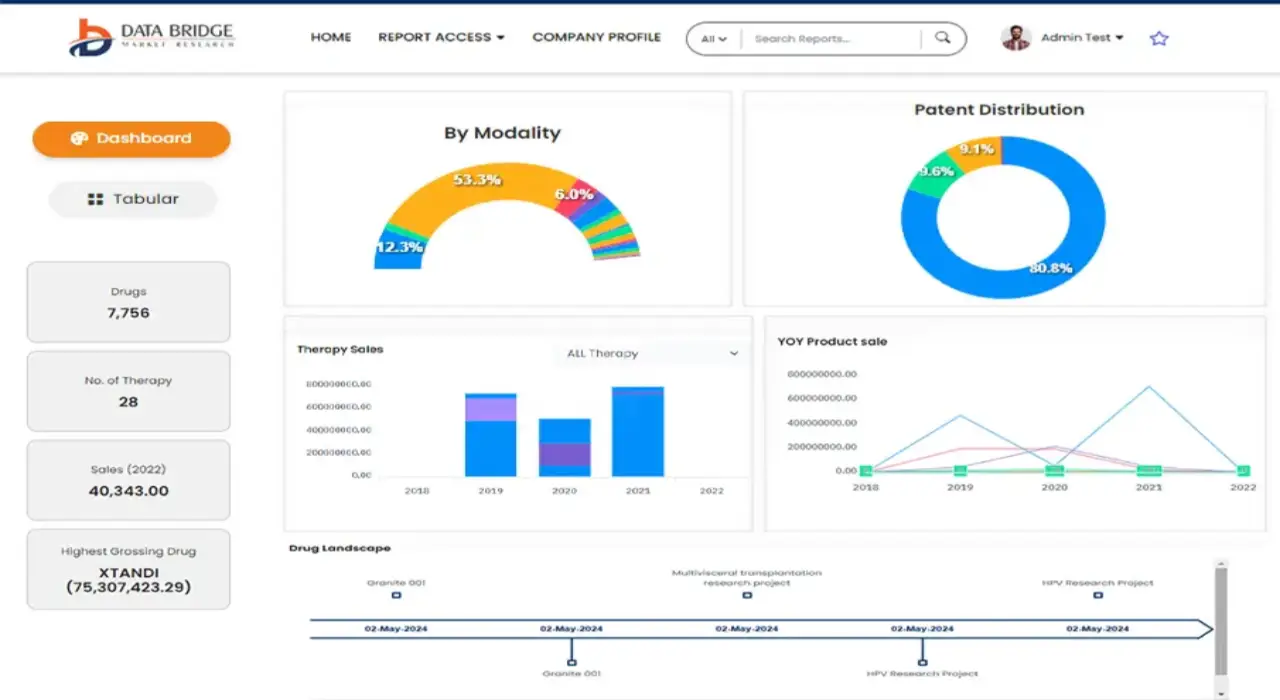
- Panel de análisis de datos interactivo
- Panel de análisis de empresas para oportunidades con alto potencial de crecimiento
- Acceso de analista de investigación para personalización y consultas
- Análisis de la competencia con panel interactivo
- Últimas noticias, actualizaciones y análisis de tendencias
- Aproveche el poder del análisis de referencia para un seguimiento integral de la competencia
Tabla de contenido
1 INTRODUCTION
1.1 OBJECTIVES OF THE STUDY
1.2 MARKET DEFINITION
1.3 OVERVIEW OF ASIA PACIFIC ATAXIA MARKET
1.4 LIMITATIONS
1.5 MARKETS COVERED
2 MARKET SEGMENTATION
2.1 MARKETS COVERED
2.2 GEOGRAPHICAL SCOPE
2.3 YEARS CONSIDERED FOR THE STUDY
2.4 CURRENCY AND PRICING
2.5 DBMR TRIPOD DATA VALIDATION MODEL
2.6 MULTIVARIATE MODELLING
2.7 TYPE LIFELINE CURVE
2.8 PRIMARY INTERVIEWS WITH KEY OPINION LEADERS
2.9 DBMR MARKET POSITION GRID
2.1 MARKET END USER COVERAGE GRID
2.11 VENDOR SHARE ANALYSIS
2.12 SECONDARY SOURCES
2.13 ASSUMPTIONS
3 EXECUTIVE SUMMARY
4 PREMIUM INSIGHTS
4.1 PESTEL
4.2 PORTER'S FIVE FORCES MODEL
4.3 EPIDEMIOLOGY
5 PIPELINE ANALYSIS
6 ASIA PACIFIC ATAXIA MARKET: REGULATORY SCENARIO
7 MARKET OVERVIEW
7.1 DRIVERS
7.1.1 INCREASING PREVALENCE AND INCIDENCES OF ATAXIA
7.1.2 RAPID RESEARCH IN FIELD OF ATAXIA THERAPEUTICS
7.1.3 RISE IN ALCOHOL AND DRUG USAGE
7.1.4 GROWING NUMBER OF INCIDENCES OF AUTO-IMMUNE DISEASE
7.2 RESTRAINTS
7.2.1 DIFFICULTY IN DIAGNOSIS OF DISEASE
7.2.2 LACK OF GENETIC TESTING IN DEVELOPING COUNTRIES
7.3 OPPORTUNITIES
7.3.1 RISING HEALTHCARE EXPENDITURE
7.3.2 STRATEGIC INITIATIVES BY MARKET PLAYERS
7.4 CHALLENGES
7.4.1 STRINGENT RULES AND REGULATIONS
7.4.2 PRODUCT RECALL
8 ASIA PACIFIC ATAXIA MARKET, BY TYPE
8.1 OVERVIEW
8.2 SPINOCEREBELLAR ATAXIAS
8.2.1 TYPE 3
8.2.2 TYPE 2
8.2.3 TYPE 1
8.2.4 OTHERS
8.3 ATAXIA-TELANGIECTASIA
8.4 EPISODIC ATAXIA
8.5 OTHERS (MULTIPLE SYSTEM ATROPHY (MSA))
9 ASIA PACIFIC ATAXIA MARKET, BY PRODUCT
9.1 OVERVIEW
9.2 TREATMENT
9.2.1 PHARMACOTHERAPY
9.2.1.1 STIFFNESS/SPASTICITY
9.2.1.1.1 GABAPENTIN
9.2.1.1.2 LEVODOPA
9.2.1.1.3 OTHERS
9.2.1.2 GAIT AND TREMORS
9.2.1.2.1 VARENICLINE
9.2.1.2.2 RILUZOLE
9.2.1.2.3 AMANTADINE
9.2.1.2.4 OTHERS
9.2.1.3 ANTI-OXIDANTS
9.2.1.3.1 N‐ACETYLCYSTEINE
9.2.1.3.2 SELEGILINE
9.2.1.3.3 DEHYDROEPIANDROSTERONE
9.2.1.3.4 VITAMIN E
9.2.1.4 NON ANTI-OXIDANTS
9.2.1.4.1 ERYTHROPOIETIN
9.2.1.4.2 DEFERIPRONE
9.2.1.4.3 RESVERATROL
9.2.1.4.4 HISTONE DEACETYLASE INHIBITORS
9.2.1.5 ANTI-ARRHYTHMIC AGENTS
9.2.1.5.1 AMIODARONE
9.2.1.5.2 PROPAFENONE
9.2.1.5.3 FLECAINIDE
9.2.1.5.4 IBUTILIDE
9.2.1.6 ANTI-CARDIAC FAILURE
9.2.1.6.1 BENAZEPRIL
9.2.1.6.2 LISINOPRIL
9.2.1.6.3 CAPTOPRIL
9.2.1.6.4 ENALAPRIL
9.2.1.6.5 FOSINOPRIL
9.2.1.6.6 MOEXIPRIL
9.2.1.6.7 OTHERS
9.2.1.7 ORAL HYPOGLYCEMIC THERAPEUTICS
9.2.1.7.1 BIGUANIDES (METFORMIN)
9.2.1.7.2 SULFONYLUREAS
9.2.1.7.2.1 GLIPIZIDE
9.2.1.7.2.2 GLIMEPIRIDE
9.2.1.7.2.3 GLYBURIDE
9.2.1.7.2.4 OTHERS
9.2.1.7.3 THIAZOLIDINEDIONES
9.2.1.7.4 MEGLITINIDES
9.2.2 LIFESTYLE THERAPY
9.2.2.1 PHYSICAL THERAPY
9.2.2.2 SPEECH THERAPY
9.2.2.3 PALLIATIVE CARE
9.2.2.4 OTHERS
9.2.3 SUPPORTIVE DEVICES
9.2.3.1 WALKING AIDS
9.2.3.2 WHEELCHAIRS
9.2.3.3 OTHERS
9.3 DIAGNOSTICS
9.3.1 IMAGING TEST
9.3.1.1 MRI SCAN
9.3.1.2 OTHERS
9.3.2 BLOOD TEST
9.3.3 GENETIC TESTING
10 ASIA PACIFIC ATAXIA MARKET, BY DOSAGE FORM
10.1 OVERVIEW
10.2 SOLID
10.2.1 TABLETS
10.2.2 CAPSULES
10.2.3 OTHERS
10.3 LIQUIDS
10.3.1 INJECTION
10.3.2 SOLUTIONS
10.3.3 OTHERS
10.4 OTHERS
11 ASIA PACIFIC ATAXIA MARKET, BY ROUTE OF ADMINISTRATION
11.1 OVERVIEW
11.2 ORAL
11.3 PARENTERAL
11.4 OTHERS
12 ASIA PACIFIC ATAXIA MARKET, BY PATIENT TYPE
12.1 OVERVIEW
12.2 ADULT
12.2.1 MALE
12.2.2 FEMALE
12.3 CHILD
12.4 GERIATRIC
13 ASIA PACIFIC ATAXIA MARKET, BY END USER
13.1 OVERVIEW
13.2 HOSPITAL
13.3 CLINICS
13.4 HOME HEALTHCARE
13.5 OTHERS
14 ASIA PACIFIC ATAXIA MARKET, BY DISTRIBUTION CHANNEL
14.1 OVERVIEW
14.2 DIRECT TENDER
14.3 RETAIL SALES
14.3.1 HOSPITAL PHARMACY
14.3.2 RETAIL SHOP
14.3.3 ONLINE PHARMACY
14.4 OTHERS
15 ASIA PACIFIC ATAXIA MARKET, BY GEOGRAPHY
15.1 ASIA-PACIFIC
15.1.1 CHINA
15.1.2 JAPAN
15.1.3 INDIA
15.1.4 SOUTH KOREA
15.1.5 AUSTRALIA
15.1.6 SINGAPORE
15.1.7 THAILAND
15.1.8 MALAYSIA
15.1.9 INDONESIA
15.1.10 PHILIPPINES
15.1.11 VIETNAM
15.1.12 RESTF OF ASIA-PACIFIC
16 ASIA PACIFIC ATAXIA MARKET: COMPANY LANDSCAPE
16.1 COMPANY SHARE ANALYSIS: ASIA PACIFIC
17 SWOT ANALYSIS
18 COMPANY PROFILE
18.1 SELECT MEDICAL CORPORATION
18.1.1 COMPANY SNAPSHOT
18.1.2 REVENUE ANALYSIS
18.1.3 COMPANY SHARE ANALYSIS
18.1.4 PRODUCT PORTFOLIO
18.1.5 RECENT DEVELOPMENTS
18.2 PFIZER INC.
18.2.1 COMPANY SNAPSHOT
18.2.2 REVENUE ANALYSIS
18.2.3 COMPANY SHARE ANALYSIS
18.2.4 PRODUCT PORTFOLIO
18.2.5 RECENT DEVELOPMENTS
18.3 NOVARTIS AG
18.3.1 COMPANY SNAPSHOT
18.3.2 REVENUE ANALYSIS
18.3.3 COMPANY SHARE ANALYSIS
18.3.4 PRODUCT PORTFOLIO
18.3.5 RECENT DEVELOPMENT
18.4 AMNEAL PHARMACEUTICALS LLC.
18.4.1 COMPANY SNAPSHOT
18.4.2 REVENUE ANALYSIS
18.4.3 COMPANY SHARE ANALYSIS
18.4.4 PRODUCT PORTFOLI
18.4.5 RECENT DEVELOPMENT
18.5 UPSTREAM REHABILITATION INC.
18.5.1 COMPANY SNAPSHOT
18.5.2 COMPANY SHARE ANALYSIS
18.5.3 PRODUCT PORTFOLIO
18.5.4 RECENT DEVELOPMENT
18.6 PRIORY
18.6.1 COMPANY SNAPSHOT
18.6.2 COMPANY SHARE ANALYSIS
18.6.3 PRODUCT PORTFOLIO
18.6.4 RECENT DEVELOPMENT
18.7 ACORDA THERAPEUTICS, INC.
18.7.1 COMPANY SNAPSHOT
18.7.2 REVENUE ANALYSIS
18.7.3 PRODUCT PORTFOLIO
18.7.4 RECENT DEVELOPMENTS
18.8 ADVERUM BIOTECHNOLOGIES, INC.
18.8.1 COMPANY SNAPSHOT
18.8.2 PRODUCT PORTFOLIO
18.8.3 RECENT DEVELOPMENT
18.9 APOTEX INC.
18.9.1 COMPANY SNAPSHOT
18.9.2 PRODUCT PORTFOLIO
18.9.3 RECENT DEVELOPMENT
18.1 ATI PHYSICAL THERAPY
18.10.1 COMPANY SNAPSHOT
18.10.2 PRODUCT PORTFOLIO
18.10.3 RECENT DEVELOPMENT
18.11 AUROBINDO PHARMA
18.11.1 COMPANY SNAPSHOT
18.11.2 REVENUE ANALYSIS
18.11.3 PRODUCT PORTFOLIO
18.11.4 RECENT DEVELOPMENT
18.12 BANNER HEALTH
18.12.1 COMPANY SNAPSHOT
18.12.2 PRODUCT PORTFOLIO
18.12.3 RECENT DEVELOPMENT
18.13 BIOHAVEN PHARMACEUTICALS
18.13.1 COMPANY SNAPSHOT
18.13.2 REVENUE ANALYSIS
18.13.3 PRODUCT PORTFOLIO
18.13.4 RECENT DEVELOPMENTS
18.14 BIOVISTA
18.14.1 COMPANY SNAPSHOT
18.14.2 PRODUCT PORTFOLIO
18.14.3 RECENT DEVELOPMENT
18.15 CIPLA INC.
18.15.1 COMPANY SNAPSHOT
18.15.2 REVENUE ANALYSIS
18.15.3 PRODUCT PORTFOLIO
18.15.4 RECENT DEVELOPMENT
18.16 DESIGN THERAPEUTICS, INC.
18.16.1 COMPANY SNAPSHOT
18.16.2 PRODUCT PORTFOLIO
18.16.3 RECENT DEVELOPMENT
18.17 INTRABIO
18.17.1 COMPANY SNAPSHOT
18.17.2 PRODUCT PORTFOLIO
18.17.3 RECENT DEVELOPMENT
18.18 LUPIN.
18.18.1 COMPANY SNAPSHOT
18.18.2 REVENUE ANALYSIS
18.18.3 PRODUCT PORTFOLIO
18.18.4 RECENT DEVELOPMENTS
18.19 MATRIX BIOMED
18.19.1 COMPANY SNAPSHOT
18.19.2 PRODUCT PORTFOLIO
18.19.3 RECENT DEVELOPMENT
18.2 MERCK KGAA
18.20.1 COMPANY SNAPSHOT
18.20.2 REVENUE ANALYSIS
18.20.3 PRODUCT PORTFOLIO
18.20.4 RECENT DEVELOPMENTS
18.21 REATA PHARMACEUTICALS, INC.
18.21.1 COMPANY SNAPSHOT
18.21.2 PRODUCT PORTFOLIO
18.21.3 RECENT DEVELOPMENT
18.22 RETROTOPE INC.
18.22.1 COMPANY SNAPSHOT
18.22.2 PRODUCT PORTFOLIO
18.22.3 RECENT DEVELOPMENT
18.23 SANOFI
18.23.1 COMPANY SNAPSHOT
18.23.2 REVENUE ANALYSIS
18.23.3 PRODUCT PORTFOLIO
18.23.4 RECENT DEVELOPMENT
18.24 SUN PHARMACEUTICAL INDUSTRIES LTD.
18.24.1 COMPANY SNAPSHOT
18.24.2 REVENUE ANALYSIS
18.24.3 PRODUCT PORTFOLIO
18.24.4 RECENT DEVELOPMENT
18.25 SUTTER HEALTH
18.25.1 COMPANY SNAPSHOT
18.25.2 PRODUCT PORTFOLIO
18.25.3 RECENT DEVELOPMENTS
18.26 TEVA PHARMACEUTICAL INDUSTRIES LTD.
18.26.1 COMPANY SNAPSHOT
18.26.2 REVENUE ANALYSIS
18.26.3 PRODUCT PORTFOLIO
18.26.4 RECENT DEVELOPMENT
18.27 VIATRIS INC.
18.27.1 COMPANY SNAPSHOT
18.27.2 REVENUE ANALYSIS
18.27.3 PRODUCT PORTFOLIO
18.27.4 RECENT DEVELOPMENT
19 QUESTIONNAIRE
20 RELATED REPORTS
Lista de Tablas
TABLE 1 ASIA PACIFIC ATAXIA MARKET: PIPELINE ANALYSIS
TABLE 2 ASIA PACIFIC ATAXIA MARKET, BY TYPE, 2020-2029 (USD THOUSAND)
TABLE 3 ASIA PACIFIC SPINOCEREBELLAR ATAXIAS IN ATAXIA MARKET, BY REGION, 2020-2029 (USD THOUSAND)
TABLE 4 ASIA PACIFIC SPINOCEREBELLAR ATAXIAS IN ATAXIA MARKET, BY TYPE, 2020-2029 (USD THOUSAND)
TABLE 5 ASIA PACIFIC ATAXIA-TELANGIECTASIA IN ATAXIA MARKET, BY REGION, 2020-2029 (USD THOUSAND)
TABLE 6 ASIA PACIFIC EPISODIC ATAXIA IN ATAXIA MARKET, BY REGION, 2020-2029 (USD THOUSAND)
TABLE 7 ASIA PACIFIC OTHERS (MULTIPLE SYSTEM ATROPHY (MSA)) IN ATAXIA MARKET, BY REGION, 2020-2029 (USD THOUSAND)
TABLE 8 ASIA PACIFIC ATAXIA MARKET, BY PRODUCT, 2020-2029 (USD THOUSAND)
TABLE 9 ASIA PACIFIC TREATMENT IN ATAXIA MARKET, BY REGION, 2020-2029 (USD THOUSAND)
TABLE 10 ASIA PACIFIC TREATMENT IN ATAXIA MARKET, BY PRODUCT, 2020-2029 (USD THOUSAND)
TABLE 11 ASIA PACIFIC PHARMACOTHERAPY IN ATAXIA MARKET, BY PRODUCT, 2020-2029 (USD THOUSAND)
TABLE 12 ASIA PACIFIC STIFNESS/SPASTICITY IN ATAXIA MARKET, BY PRODUCT, 2020-2029 (USD THOUSAND)
TABLE 13 ASIA PACIFIC GAIT AND TREMORS IN ATAXIA MARKET, BY PRODUCT, 2020-2029 (USD THOUSAND)
TABLE 14 ASIA PACIFIC ANTI- OXIDANTS IN ATAXIA MARKET, BY PRODUCT, 2020-2029 (USD THOUSAND)
TABLE 15 ASIA PACIFIC NON ANTI- OXIDANTS IN ATAXIA MARKET, BY PRODUCT, 2020-2029 (USD THOUSAND)
TABLE 16 ASIA PACIFIC ANTI- ARRHYTHMIC AGENTS IN ATAXIA MARKET, BY PRODUCT, 2020-2029 (USD THOUSAND)
TABLE 17 ASIA PACIFIC ANTI- CARDIAC FAILURE IN ATAXIA MARKET, BY PRODUCT, 2020-2029 (USD THOUSAND)
TABLE 18 ASIA PACIFIC ORAL HYPOGLYCEMIC THERAPEUTICS IN ATAXIA MARKET, BY PRODUCT, 2020-2029 (USD THOUSAND)
TABLE 19 ASIA PACIFIC SULFONYLUREAS IN ATAXIA MARKET, BY PRODUCT, 2020-2029 (USD THOUSAND)
TABLE 20 ASIA PACIFIC LIFESTYLE THERAPY IN ATAXIA MARKET, BY PRODUCT, 2020-2029 (USD THOUSAND)
TABLE 21 ASIA PACIFIC SUPPORTIVE DEVICES IN ATAXIA MARKET, BY PRODUCT, 2020-2029 (USD THOUSAND)
TABLE 22 ASIA PACIFIC DIAGNOSTICS IN ATAXIA MARKET, BY REGION, 2020-2029 (USD THOUSAND)
TABLE 23 ASIA PACIFIC DIAGNOSTICS IN ATAXIA MARKET, BY PRODUCT, 2020-2029 (USD THOUSAND)
TABLE 24 ASIA PACIFIC IMAGING TEST IN ATAXIA MARKET, BY PRODUCT, 2020-2029 (USD THOUSAND)
TABLE 25 ASIA PACIFIC ATAXIA MARKET, BY DOSAGE FORM, 2020-2029 (USD THOUSAND)
TABLE 26 ASIA PACIFIC SOLID IN ATAXIA MARKET, BY REGION, 2020-2029 (USD THOUSAND)
TABLE 27 ASIA PACIFIC SOLID IN ATAXIA MARKET, BY DOSAGE FORM, 2020-2029 (USD THOUSAND)
TABLE 28 ASIA PACIFIC LIQUIDS IN ATAXIA MARKET, BY REGION, 2020-2029 (USD THOUSAND)
TABLE 29 ASIA PACIFIC LIQUIDS IN ATAXIA MARKET, BY DOSAGE FORM, 2020-2029 (USD THOUSAND)
TABLE 30 ASIA PACIFIC OTHERS IN ATAXIA MARKET, BY REGION, 2020-2029 (USD THOUSAND)
TABLE 31 ASIA PACIFIC ATAXIA MARKET, BY ROUTE OF ADMINISTRATION, 2020-2029 (USD THOUSAND)
TABLE 32 ASIA PACIFIC ORAL IN ATAXIA MARKET, BY REGION, 2020-2029 (USD THOUSAND)
TABLE 33 ASIA PACIFIC PARENTERAL IN ATAXIA MARKET, BY REGION, 2020-2029 (USD THOUSAND)
TABLE 34 ASIA PACIFIC OTHERS IN ATAXIA MARKET, BY REGION, 2020-2029 (USD THOUSAND)
TABLE 35 ASIA PACIFIC ATAXIA MARKET, BY PATIENT TYPE, 2020-2029 (USD THOUSAND)
TABLE 36 ASIA PACIFIC ADULT IN ATAXIA MARKET, BY REGION, 2020-2029 (USD THOUSAND)
TABLE 37 ASIA PACIFIC ADULT IN ATAXIA MARKET, BY PATIENT TYPE, 2020-2029 (USD THOUSAND)
TABLE 38 ASIA PACIFIC CHILD IN ATAXIA MARKET, BY REGION, 2020-2029 (USD THOUSAND)
TABLE 39 ASIA PACIFIC GERIATRIC IN ATAXIA MARKET, BY REGION, 2020-2029 (USD THOUSAND)
TABLE 40 ASIA PACIFIC ATAXIA MARKET, BY END USER, 2020-2029 (USD THOUSAND)
TABLE 41 ASIA PACIFIC HOSPITAL IN ATAXIA MARKET, BY REGION, 2020-2029 (USD THOUSAND)
TABLE 42 ASIA PACIFIC CLINICS IN ATAXIA MARKET, BY REGION, 2020-2029 (USD THOUSAND)
TABLE 43 ASIA PACIFIC HOME HEALTHCARE IN ATAXIA MARKET, BY REGION, 2020-2029 (USD THOUSAND)
TABLE 44 ASIA PACIFIC OTHERS IN ATAXIA MARKET, BY REGION, 2020-2029 (USD THOUSAND)
TABLE 45 ASIA PACIFIC ATAXIA MARKET, BY DISTRIBUTION CHANNEL, 2020-2029 (USD THOUSAND)
TABLE 46 ASIA PACIFIC DIRECT TENDER IN ATAXIA MARKET, BY REGION, 2020-2029 (USD THOUSAND)
TABLE 47 ASIA PACIFIC RETAIL SALES IN ATAXIA MARKET, BY REGION, 2020-2029 (USD THOUSAND)
TABLE 48 ASIA PACIFIC RETAILS SALES IN ATAXIA MARKET, BY DISTRIBUTION CHANNEL, 2020-2029 (USD THOUSAND)
TABLE 49 ASIA PACIFIC OTHERS IN ATAXIA MARKET, BY REGION, 2020-2029 (USD THOUSAND)
TABLE 50 ASIA-PACIFIC ATAXIA MARKET, BY COUNTRY, 2020-2029 (USD THOUSAND)
TABLE 51 ASIA-PACIFIC ATAXIA MARKET, BY TYPE, 2020-2029 (USD THOUSAND)
TABLE 52 ASIA-PACIFIC SPINOCEREBELLAR ATAXIAS IN ATAXIA MARKET, BY TYPE, 2020-2029 (USD THOUSAND)
TABLE 53 ASIA-PACIFIC ATAXIA MARKET, BY PRODUCT, 2020-2029 (USD THOUSAND)
TABLE 54 ASIA-PACIFIC TREATMENT IN ATAXIA MARKET, BY PRODUCT, 2020-2029 (USD THOUSAND)
TABLE 55 ASIA-PACIFIC PHARMACOTHERAPY IN ATAXIA MARKET, BY PRODUCT, 2020-2029 (USD THOUSAND)
TABLE 56 ASIA-PACIFIC STIFFNESS/SPASTICITY IN ATAXIA MARKET, BY PRODUCT, 2020-2029 (USD THOUSAND)
TABLE 57 ASIA-PACIFIC GAIT AND TREMORS IN ATAXIA MARKET, BY PRODUCT, 2020-2029 (USD THOUSAND)
TABLE 58 ASIA-PACIFIC ANTI-OXIDANTS IN ATAXIA MARKET, BY PRODUCT, 2020-2029 (USD THOUSAND)
TABLE 59 ASIA-PACIFIC NON ANTI-OXIDANTS TREATMENT IN ATAXIA MARKET, BY PRODUCT, 2020-2029 (USD THOUSAND)
TABLE 60 ASIA-PACIFIC ANTI-ARRHYTHMIC AGENTS IN ATAXIA MARKET, BY PRODUCT, 2020-2029 (USD THOUSAND)
TABLE 61 ASIA-PACIFIC ANTI-CARDIAC FAILURE IN ATAXIA MARKET, BY PRODUCT, 2020-2029 (USD THOUSAND)
TABLE 62 ASIA-PACIFIC ORAL HYPOGLYCEMIC THERAPEUTICS IN ATAXIA MARKET, BY PRODUCT, 2020-2029 (USD THOUSAND)
TABLE 63 ASIA-PACIFIC SULFONYLUREAS IN ATAXIA MARKET, BY PRODUCT, 2020-2029 (USD THOUSAND)
TABLE 64 ASIA-PACIFIC LIFESTYLE THERAPY IN ATAXIA MARKET, BY PRODUCT, 2020-2029 (USD THOUSAND)
TABLE 65 ASIA-PACIFIC SUPPORTIVE DEVICES IN ATAXIA MARKET, BY PRODUCT, 2020-2029 (USD THOUSAND)
TABLE 66 ASIA-PACIFIC DIAGNOSTICS IN ATAXIA MARKET, BY PRODUCT, 2020-2029 (USD THOUSAND)
TABLE 67 ASIA-PACIFIC IMAGING TEST IN ATAXIA MARKET, BY PRODUCT, 2020-2029 (USD THOUSAND)
TABLE 68 ASIA-PACIFIC IMAGING TEST IN ATAXIA MARKET, BY DOSAGE FORM, 2020-2029 (USD THOUSAND)
TABLE 69 ASIA-PACIFIC SOLID IN ATAXIA MARKET, BY DOSAGE FORM, 2020-2029 (USD THOUSAND)
TABLE 70 ASIA-PACIFIC LIQUIDS IN ATAXIA MARKET, BY DOSAGE FORM, 2020-2029 (USD THOUSAND)
TABLE 71 ASIA-PACIFIC ATAXIA MARKET, BY ROUTE OF ADMINISTRATION, 2020-2029 (USD THOUSAND)
TABLE 72 ASIA-PACIFIC ATAXIA MARKET, BY PATIENT TYPE, 2020-2029 (USD THOUSAND)
TABLE 73 ASIA-PACIFIC ADULT IN ATAXIA MARKET, BY PATIENT TYPE, 2020-2029 (USD THOUSAND)
TABLE 74 ASIA-PACIFIC ATAXIA MARKET, BY END USER, 2020-2029 (USD THOUSAND)
TABLE 75 ASIA-PACIFIC ATAXIA MARKET, BY DISTRIBUTION CHANNEL, 2020-2029 (USD THOUSAND)
TABLE 76 ASIA-PACIFIC RETAILS SALES IN ATAXIA MARKET, BY DISTRIBUTION CHANNEL, 2020-2029 (USD THOUSAND)
TABLE 77 CHINA ATAXIA MARKET, BY TYPE, 2020-2029 (USD THOUSAND)
TABLE 78 CHINA SPINOCEREBELLAR ATAXIAS IN ATAXIA MARKET, BY TYPE, 2020-2029 (USD THOUSAND)
TABLE 79 CHINA ATAXIA MARKET, BY PRODUCT, 2020-2029 (USD THOUSAND)
TABLE 80 CHINA TREATMENT IN ATAXIA MARKET, BY PRODUCT, 2020-2029 (USD THOUSAND)
TABLE 81 CHINA PHARMACOTHERAPY IN ATAXIA MARKET, BY PRODUCT, 2020-2029 (USD THOUSAND)
TABLE 82 CHINA STIFFNESS/SPASTICITY IN ATAXIA MARKET, BY PRODUCT, 2020-2029 (USD THOUSAND)
TABLE 83 CHINA GAIT AND TREMORS IN ATAXIA MARKET, BY PRODUCT, 2020-2029 (USD THOUSAND)
TABLE 84 CHINA ANTI-OXIDANTS IN ATAXIA MARKET, BY PRODUCT, 2020-2029 (USD THOUSAND)
TABLE 85 CHINA NON ANTI-OXIDANTS TREATMENT IN ATAXIA MARKET, BY PRODUCT, 2020-2029 (USD THOUSAND)
TABLE 86 CHINA ARRHYTHMIC AGENTS IN ATAXIA MARKET, BY PRODUCT, 2020-2029 (USD THOUSAND)
TABLE 87 CHINA ANTI-CARDIAC FAILURE IN ATAXIA MARKET, BY PRODUCT, 2020-2029 (USD THOUSAND)
TABLE 88 CHINA ORAL HYPOGLYCEMIC THERAPEUTICS IN ATAXIA MARKET, BY PRODUCT, 2020-2029 (USD THOUSAND)
TABLE 89 CHINA SULFONYLUREAS IN ATAXIA MARKET, BY PRODUCT, 2020-2029 (USD THOUSAND)
TABLE 90 CHINA LIFESTYLE THERAPY IN ATAXIA MARKET, BY PRODUCT, 2020-2029 (USD THOUSAND)
TABLE 91 CHINA SUPPORTIVE DEVICES IN ATAXIA MARKET, BY PRODUCT, 2020-2029 (USD THOUSAND)
TABLE 92 CHINA DIAGNOSTICS IN ATAXIA MARKET, BY PRODUCT, 2020-2029 (USD THOUSAND)
TABLE 93 CHINA IMAGING TEST IN ATAXIA MARKET, BY PRODUCT, 2020-2029 (USD THOUSAND)
TABLE 94 CHINA IMAGING TEST IN ATAXIA MARKET, BY DOSAGE FORM, 2020-2029 (USD THOUSAND)
TABLE 95 CHINA SOLID IN ATAXIA MARKET, BY DOSAGE FORM, 2020-2029 (USD THOUSAND)
TABLE 96 CHINA LIQUIDS IN ATAXIA MARKET, BY DOSAGE FORM, 2020-2029 (USD THOUSAND)
TABLE 97 CHINA ATAXIA MARKET, BY ROUTE OF ADMINISTRATION, 2020-2029 (USD THOUSAND)
TABLE 98 CHINA ATAXIA MARKET, BY PATIENT TYPE, 2020-2029 (USD THOUSAND)
TABLE 99 CHINA ADULT IN ATAXIA MARKET, BY PATIENT TYPE, 2020-2029 (USD THOUSAND)
TABLE 100 CHINA ATAXIA MARKET, BY END USER, 2020-2029 (USD THOUSAND)
TABLE 101 CHINA ATAXIA MARKET, BY DISTRIBUTION CHANNEL, 2020-2029 (USD THOUSAND)
TABLE 102 CHINA RETAILS SALES IN ATAXIA MARKET, BY DISTRIBUTION CHANNEL, 2020-2029 (USD THOUSAND)
TABLE 103 JAPAN ATAXIA MARKET, BY TYPE, 2020-2029 (USD THOUSAND)
TABLE 104 JAPAN SPINOCEREBELLAR ATAXIAS IN ATAXIA MARKET, BY TYPE, 2020-2029 (USD THOUSAND)
TABLE 105 JAPAN ATAXIA MARKET, BY PRODUCT, 2020-2029 (USD THOUSAND)
TABLE 106 JAPAN TREATMENT IN ATAXIA MARKET, BY PRODUCT, 2020-2029 (USD THOUSAND)
TABLE 107 JAPAN PHARMACOTHERAPY IN ATAXIA MARKET, BY PRODUCT, 2020-2029 (USD THOUSAND)
TABLE 108 JAPAN STIFFNESS/SPASTICITY IN ATAXIA MARKET, BY PRODUCT, 2020-2029 (USD THOUSAND)
TABLE 109 JAPAN GAIT AND TREMORS IN ATAXIA MARKET, BY PRODUCT, 2020-2029 (USD THOUSAND)
TABLE 110 JAPAN ANTI-OXIDANTS IN ATAXIA MARKET, BY PRODUCT, 2020-2029 (USD THOUSAND)
TABLE 111 JAPAN NON ANTI-OXIDANTS TREATMENT IN ATAXIA MARKET, BY PRODUCT, 2020-2029 (USD THOUSAND)
TABLE 112 JAPAN ANTI-ARRHYTHMIC AGENTS IN ATAXIA MARKET, BY PRODUCT, 2020-2029 (USD THOUSAND)
TABLE 113 JAPAN ANTI-CARDIAC FAILURE IN ATAXIA MARKET, BY PRODUCT, 2020-2029 (USD THOUSAND)
TABLE 114 JAPAN ORAL HYPOGLYCEMIC THERAPEUTICS IN ATAXIA MARKET, BY PRODUCT, 2020-2029 (USD THOUSAND)
TABLE 115 JAPAN SULFONYLUREAS IN ATAXIA MARKET, BY PRODUCT, 2020-2029 (USD THOUSAND)
TABLE 116 JAPAN LIFESTYLE THERAPY IN ATAXIA MARKET, BY PRODUCT, 2020-2029 (USD THOUSAND)
TABLE 117 JAPAN SUPPORTIVE DEVICES IN ATAXIA MARKET, BY PRODUCT, 2020-2029 (USD THOUSAND)
TABLE 118 JAPAN DIAGNOSTICS IN ATAXIA MARKET, BY PRODUCT, 2020-2029 (USD THOUSAND)
TABLE 119 JAPAN IMAGING TEST IN ATAXIA MARKET, BY PRODUCT, 2020-2029 (USD THOUSAND)
TABLE 120 JAPAN IMAGING TEST IN ATAXIA MARKET, BY DOSAGE FORM, 2020-2029 (USD THOUSAND)
TABLE 121 JAPAN SOLID IN ATAXIA MARKET, BY DOSAGE FORM, 2020-2029 (USD THOUSAND)
TABLE 122 JAPAN LIQUIDS IN ATAXIA MARKET, BY DOSAGE FORM, 2020-2029 (USD THOUSAND)
TABLE 123 JAPAN ATAXIA MARKET, BY ROUTE OF ADMINISTRATION, 2020-2029 (USD THOUSAND)
TABLE 124 JAPAN ATAXIA MARKET, BY PATIENT TYPE, 2020-2029 (USD THOUSAND)
TABLE 125 JAPAN ADULT IN ATAXIA MARKET, BY PATIENT TYPE, 2020-2029 (USD THOUSAND)
TABLE 126 JAPAN ATAXIA MARKET, BY END USER, 2020-2029 (USD THOUSAND)
TABLE 127 JAPAN ATAXIA MARKET, BY DISTRIBUTION CHANNEL, 2020-2029 (USD THOUSAND)
TABLE 128 JAPAN RETAILS SALES IN ATAXIA MARKET, BY DISTRIBUTION CHANNEL, 2020-2029 (USD THOUSAND)
TABLE 129 INDIA ATAXIA MARKET, BY TYPE, 2020-2029 (USD THOUSAND)
TABLE 130 INDIA SPINOCEREBELLAR ATAXIAS IN ATAXIA MARKET, BY TYPE, 2020-2029 (USD THOUSAND)
TABLE 131 INDIA ATAXIA MARKET, BY PRODUCT, 2020-2029 (USD THOUSAND)
TABLE 132 INDIA TREATMENT IN ATAXIA MARKET, BY PRODUCT, 2020-2029 (USD THOUSAND)
TABLE 133 INDIA PHARMACOTHERAPY IN ATAXIA MARKET, BY PRODUCT, 2020-2029 (USD THOUSAND)
TABLE 134 INDIA STIFFNESS/SPASTICITY IN ATAXIA MARKET, BY PRODUCT, 2020-2029 (USD THOUSAND)
TABLE 135 INDIA GAIT AND TREMORS IN ATAXIA MARKET, BY PRODUCT, 2020-2029 (USD THOUSAND)
TABLE 136 INDIA ANTI-OXIDANTS IN ATAXIA MARKET, BY PRODUCT, 2020-2029 (USD THOUSAND)
TABLE 137 INDIA NON ANTI-OXIDANTS TREATMENT IN ATAXIA MARKET, BY PRODUCT, 2020-2029 (USD THOUSAND)
TABLE 138 INDIA ANTI-ARRHYTHMIC AGENTS IN ATAXIA MARKET, BY PRODUCT, 2020-2029 (USD THOUSAND)
TABLE 139 INDIA ANTI-CARDIAC FAILURE IN ATAXIA MARKET, BY PRODUCT, 2020-2029 (USD THOUSAND)
TABLE 140 INDIA ORAL HYPOGLYCEMIC THERAPEUTICS IN ATAXIA MARKET, BY PRODUCT, 2020-2029 (USD THOUSAND)
TABLE 141 INDIA SULFONYLUREAS IN ATAXIA MARKET, BY PRODUCT, 2020-2029 (USD THOUSAND)
TABLE 142 INDIA LIFESTYLE THERAPY IN ATAXIA MARKET, BY PRODUCT, 2020-2029 (USD THOUSAND)
TABLE 143 INDIA SUPPORTIVE DEVICES IN ATAXIA MARKET, BY PRODUCT, 2020-2029 (USD THOUSAND)
TABLE 144 INDIA DIAGNOSTICS IN ATAXIA MARKET, BY PRODUCT, 2020-2029 (USD THOUSAND)
TABLE 145 INDIA IMAGING TEST IN ATAXIA MARKET, BY PRODUCT, 2020-2029 (USD THOUSAND)
TABLE 146 INDIA IMAGING TEST IN ATAXIA MARKET, BY DOSAGE FORM, 2020-2029 (USD THOUSAND)
TABLE 147 INDIA SOLID IN ATAXIA MARKET, BY DOSAGE FORM, 2020-2029 (USD THOUSAND)
TABLE 148 INDIA LIQUIDS IN ATAXIA MARKET, BY DOSAGE FORM, 2020-2029 (USD THOUSAND)
TABLE 149 INDIA ATAXIA MARKET, BY ROUTE OF ADMINISTRATION, 2020-2029 (USD THOUSAND)
TABLE 150 INDIA ATAXIA MARKET, BY PATIENT TYPE, 2020-2029 (USD THOUSAND)
TABLE 151 INDIA ADULT IN ATAXIA MARKET, BY PATIENT TYPE, 2020-2029 (USD THOUSAND)
TABLE 152 INDIA ATAXIA MARKET, BY END USER, 2020-2029 (USD THOUSAND)
TABLE 153 INDIA ATAXIA MARKET, BY DISTRIBUTION CHANNEL, 2020-2029 (USD THOUSAND)
TABLE 154 INDIA RETAILS SALES IN ATAXIA MARKET, BY DISTRIBUTION CHANNEL, 2020-2029 (USD THOUSAND)
TABLE 155 SOUTH KOREA ATAXIA MARKET, BY TYPE, 2020-2029 (USD THOUSAND)
TABLE 156 SOUTH KOREA SPINOCEREBELLAR ATAXIAS IN ATAXIA MARKET, BY TYPE, 2020-2029 (USD THOUSAND)
TABLE 157 SOUTH KOREA ATAXIA MARKET, BY PRODUCT, 2020-2029 (USD THOUSAND)
TABLE 158 SOUTH KOREA TREATMENT IN ATAXIA MARKET, BY PRODUCT, 2020-2029 (USD THOUSAND)
TABLE 159 SOUTH KOREA PHARMACOTHERAPY IN ATAXIA MARKET, BY PRODUCT, 2020-2029 (USD THOUSAND)
TABLE 160 SOUTH KOREA STIFFNESS/SPASTICITY IN ATAXIA MARKET, BY PRODUCT, 2020-2029 (USD THOUSAND)
TABLE 161 SOUTH KOREA GAIT AND TREMORS IN ATAXIA MARKET, BY PRODUCT, 2020-2029 (USD THOUSAND)
TABLE 162 SOUTH KOREA ANTI-OXIDANTS IN ATAXIA MARKET, BY PRODUCT, 2020-2029 (USD THOUSAND)
TABLE 163 SOUTH KOREA NON ANTI-OXIDANTS TREATMENT IN ATAXIA MARKET, BY PRODUCT, 2020-2029 (USD THOUSAND)
TABLE 164 SOUTH KOREA ANTI-ARRHYTHMIC AGENTS IN ATAXIA MARKET, BY PRODUCT, 2020-2029 (USD THOUSAND)
TABLE 165 SOUTH KOREA ANTI-CARDIAC FAILURE IN ATAXIA MARKET, BY PRODUCT, 2020-2029 (USD THOUSAND)
TABLE 166 SOUTH KOREA ORAL HYPOGLYCEMIC THERAPEUTICS IN ATAXIA MARKET, BY PRODUCT, 2020-2029 (USD THOUSAND)
TABLE 167 SOUTH KOREA SULFONYLUREAS IN ATAXIA MARKET, BY PRODUCT, 2020-2029 (USD THOUSAND)
TABLE 168 SOUTH KOREA LIFESTYLE THERAPY IN ATAXIA MARKET, BY PRODUCT, 2020-2029 (USD THOUSAND)
TABLE 169 SOUTH KOREA SUPPORTIVE DEVICES IN ATAXIA MARKET, BY PRODUCT, 2020-2029 (USD THOUSAND)
TABLE 170 SOUTH KOREA DIAGNOSTICS IN ATAXIA MARKET, BY PRODUCT, 2020-2029 (USD THOUSAND)
TABLE 171 SOUTH KOREA IMAGING TEST IN ATAXIA MARKET, BY PRODUCT, 2020-2029 (USD THOUSAND)
TABLE 172 SOUTH KOREA IMAGING TEST IN ATAXIA MARKET, BY DOSAGE FORM, 2020-2029 (USD THOUSAND)
TABLE 173 SOUTH KOREA SOLID IN ATAXIA MARKET, BY DOSAGE FORM, 2020-2029 (USD THOUSAND)
TABLE 174 SOUTH KOREA LIQUIDS IN ATAXIA MARKET, BY DOSAGE FORM, 2020-2029 (USD THOUSAND)
TABLE 175 SOUTH KOREA ATAXIA MARKET, BY ROUTE OF ADMINISTRATION, 2020-2029 (USD THOUSAND)
TABLE 176 SOUTH KOREA ATAXIA MARKET, BY PATIENT TYPE, 2020-2029 (USD THOUSAND)
TABLE 177 SOUTH KOREA ADULT IN ATAXIA MARKET, BY PATIENT TYPE, 2020-2029 (USD THOUSAND)
TABLE 178 SOUTH KOREA ATAXIA MARKET, BY END USER, 2020-2029 (USD THOUSAND)
TABLE 179 SOUTH KOREA ATAXIA MARKET, BY DISTRIBUTION CHANNEL, 2020-2029 (USD THOUSAND)
TABLE 180 SOUTH KOREA RETAILS SALES IN ATAXIA MARKET, BY DISTRIBUTION CHANNEL, 2020-2029 (USD THOUSAND)
TABLE 181 AUSTRALIA ATAXIA MARKET, BY TYPE, 2020-2029 (USD THOUSAND)
TABLE 182 AUSTRALIA SPINOCEREBELLAR ATAXIAS IN ATAXIA MARKET, BY TYPE, 2020-2029 (USD THOUSAND)
TABLE 183 AUSTRALIA ATAXIA MARKET, BY PRODUCT, 2020-2029 (USD THOUSAND)
TABLE 184 AUSTRALIA TREATMENT IN ATAXIA MARKET, BY PRODUCT, 2020-2029 (USD THOUSAND)
TABLE 185 AUSTRALIA PHARMACOTHERAPY IN ATAXIA MARKET, BY PRODUCT, 2020-2029 (USD THOUSAND)
TABLE 186 AUSTRALIA STIFFNESS/SPASTICITY IN ATAXIA MARKET, BY PRODUCT, 2020-2029 (USD THOUSAND)
TABLE 187 AUSTRALIA GAIT AND TREMORS IN ATAXIA MARKET, BY PRODUCT, 2020-2029 (USD THOUSAND)
TABLE 188 AUSTRALIA ANTI-OXIDANTS IN ATAXIA MARKET, BY PRODUCT, 2020-2029 (USD THOUSAND)
TABLE 189 AUSTRALIA NON ANTI-OXIDANTS TREATMENT IN ATAXIA MARKET, BY PRODUCT, 2020-2029 (USD THOUSAND)
TABLE 190 AUSTRALIA ANTI-ARRHYTHMIC AGENTS IN ATAXIA MARKET, BY PRODUCT, 2020-2029 (USD THOUSAND)
TABLE 191 AUSTRALIA ANTI-CARDIAC FAILURE IN ATAXIA MARKET, BY PRODUCT, 2020-2029 (USD THOUSAND)
TABLE 192 AUSTRALIA ORAL HYPOGLYCEMIC THERAPEUTICS IN ATAXIA MARKET, BY PRODUCT, 2020-2029 (USD THOUSAND)
TABLE 193 AUSTRALIA SULFONYLUREAS IN ATAXIA MARKET, BY PRODUCT, 2020-2029 (USD THOUSAND)
TABLE 194 AUSTRALIA LIFESTYLE THERAPY IN ATAXIA MARKET, BY PRODUCT, 2020-2029 (USD THOUSAND)
TABLE 195 AUSTRALIA SUPPORTIVE DEVICES IN ATAXIA MARKET, BY PRODUCT, 2020-2029 (USD THOUSAND)
TABLE 196 AUSTRALIA DIAGNOSTICS IN ATAXIA MARKET, BY PRODUCT, 2020-2029 (USD THOUSAND)
TABLE 197 AUSTRALIA IMAGING TEST IN ATAXIA MARKET, BY PRODUCT, 2020-2029 (USD THOUSAND)
TABLE 198 AUSTRALIA IMAGING TEST IN ATAXIA MARKET, BY DOSAGE FORM, 2020-2029 (USD THOUSAND)
TABLE 199 AUSTRALIA SOLID IN ATAXIA MARKET, BY DOSAGE FORM, 2020-2029 (USD THOUSAND)
TABLE 200 AUSTRALIA LIQUIDS IN ATAXIA MARKET, BY DOSAGE FORM, 2020-2029 (USD THOUSAND)
TABLE 201 AUSTRALIA ATAXIA MARKET, BY ROUTE OF ADMINISTRATION, 2020-2029 (USD THOUSAND)
TABLE 202 AUSTRALIA ATAXIA MARKET, BY PATIENT TYPE, 2020-2029 (USD THOUSAND)
TABLE 203 AUSTRALIA ADULT IN ATAXIA MARKET, BY PATIENT TYPE, 2020-2029 (USD THOUSAND)
TABLE 204 AUSTRALIA ATAXIA MARKET, BY END USER, 2020-2029 (USD THOUSAND)
TABLE 205 AUSTRALIA ATAXIA MARKET, BY DISTRIBUTION CHANNEL, 2020-2029 (USD THOUSAND)
TABLE 206 AUSTRALIA RETAILS SALES IN ATAXIA MARKET, BY DISTRIBUTION CHANNEL, 2020-2029 (USD THOUSAND)
TABLE 207 SINGAPORE ATAXIA MARKET, BY TYPE, 2020-2029 (USD THOUSAND)
TABLE 208 SINGAPORE SPINOCEREBELLAR ATAXIAS IN ATAXIA MARKET, BY TYPE, 2020-2029 (USD THOUSAND)
TABLE 209 SINGAPORE ATAXIA MARKET, BY PRODUCT, 2020-2029 (USD THOUSAND)
TABLE 210 SINGAPORE TREATMENT IN ATAXIA MARKET, BY PRODUCT, 2020-2029 (USD THOUSAND)
TABLE 211 SINGAPORE PHARMACOTHERAPY IN ATAXIA MARKET, BY PRODUCT, 2020-2029 (USD THOUSAND)
TABLE 212 SINGAPORE STIFFNESS/SPASTICITY IN ATAXIA MARKET, BY PRODUCT, 2020-2029 (USD THOUSAND)
TABLE 213 SINGAPORE GAIT AND TREMORS IN ATAXIA MARKET, BY PRODUCT, 2020-2029 (USD THOUSAND)
TABLE 214 SINGAPORE ANTI-OXIDANTS IN ATAXIA MARKET, BY PRODUCT, 2020-2029 (USD THOUSAND)
TABLE 215 SINGAPORE NON ANTI-OXIDANTS TREATMENT IN ATAXIA MARKET, BY PRODUCT, 2020-2029 (USD THOUSAND)
TABLE 216 SINGAPORE ANTI-ARRHYTHMIC AGENTS IN ATAXIA MARKET, BY PRODUCT, 2020-2029 (USD THOUSAND)
TABLE 217 SINGAPORE ANTI-CARDIAC FAILURE IN ATAXIA MARKET, BY PRODUCT, 2020-2029 (USD THOUSAND)
TABLE 218 SINGAPORE ORAL HYPOGLYCEMIC THERAPEUTICS IN ATAXIA MARKET, BY PRODUCT, 2020-2029 (USD THOUSAND)
TABLE 219 SINGAPORE SULFONYLUREAS IN ATAXIA MARKET, BY PRODUCT, 2020-2029 (USD THOUSAND)
TABLE 220 SINGAPORE LIFESTYLE THERAPY IN ATAXIA MARKET, BY PRODUCT, 2020-2029 (USD THOUSAND)
TABLE 221 SINGAPORE SUPPORTIVE DEVICES IN ATAXIA MARKET, BY PRODUCT, 2020-2029 (USD THOUSAND)
TABLE 222 SINGAPORE DIAGNOSTICS IN ATAXIA MARKET, BY PRODUCT, 2020-2029 (USD THOUSAND)
TABLE 223 SINGAPORE IMAGING TEST IN ATAXIA MARKET, BY PRODUCT, 2020-2029 (USD THOUSAND)
TABLE 224 SINGAPORE IMAGING TEST IN ATAXIA MARKET, BY DOSAGE FORM, 2020-2029 (USD THOUSAND)
TABLE 225 SINGAPORE SOLID IN ATAXIA MARKET, BY DOSAGE FORM, 2020-2029 (USD THOUSAND)
TABLE 226 SINGAPORE LIQUIDS IN ATAXIA MARKET, BY DOSAGE FORM, 2020-2029 (USD THOUSAND)
TABLE 227 SINGAPORE ATAXIA MARKET, BY ROUTE OF ADMINISTRATION, 2020-2029 (USD THOUSAND)
TABLE 228 SINGAPORE ATAXIA MARKET, BY PATIENT TYPE, 2020-2029 (USD THOUSAND)
TABLE 229 SINGAPORE ADULT IN ATAXIA MARKET, BY PATIENT TYPE, 2020-2029 (USD THOUSAND)
TABLE 230 SINGAPORE ATAXIA MARKET, BY END USER, 2020-2029 (USD THOUSAND)
TABLE 231 SINGAPORE ATAXIA MARKET, BY DISTRIBUTION CHANNEL, 2020-2029 (USD THOUSAND)
TABLE 232 SINGAPORE RETAILS SALES IN ATAXIA MARKET, BY DISTRIBUTION CHANNEL, 2020-2029 (USD THOUSAND)
TABLE 233 THAILAND ATAXIA MARKET, BY TYPE, 2020-2029 (USD THOUSAND)
TABLE 234 THAILAND SPINOCEREBELLAR ATAXIAS IN ATAXIA MARKET, BY TYPE, 2020-2029 (USD THOUSAND)
TABLE 235 THAILAND ATAXIA MARKET, BY PRODUCT, 2020-2029 (USD THOUSAND)
TABLE 236 THAILAND TREATMENT IN ATAXIA MARKET, BY PRODUCT, 2020-2029 (USD THOUSAND)
TABLE 237 THAILAND PHARMACOTHERAPY IN ATAXIA MARKET, BY PRODUCT, 2020-2029 (USD THOUSAND)
TABLE 238 THAILAND STIFFNESS/SPASTICITY IN ATAXIA MARKET, BY PRODUCT, 2020-2029 (USD THOUSAND)
TABLE 239 THAILAND GAIT AND TREMORS IN ATAXIA MARKET, BY PRODUCT, 2020-2029 (USD THOUSAND)
TABLE 240 THAILAND ANTI-OXIDANTS IN ATAXIA MARKET, BY PRODUCT, 2020-2029 (USD THOUSAND)
TABLE 241 THAILAND NON ANTI-OXIDANTS TREATMENT IN ATAXIA MARKET, BY PRODUCT, 2020-2029 (USD THOUSAND)
TABLE 242 THAILAND ANTI-ARRHYTHMIC AGENTS IN ATAXIA MARKET, BY PRODUCT, 2020-2029 (USD THOUSAND)
TABLE 243 THAILAND ANTI-CARDIAC FAILURE IN ATAXIA MARKET, BY PRODUCT, 2020-2029 (USD THOUSAND)
TABLE 244 THAILAND ORAL HYPOGLYCEMIC THERAPEUTICS IN ATAXIA MARKET, BY PRODUCT, 2020-2029 (USD THOUSAND)
TABLE 245 THAILAND SULFONYLUREAS IN ATAXIA MARKET, BY PRODUCT, 2020-2029 (USD THOUSAND)
TABLE 246 THAILAND LIFESTYLE THERAPY IN ATAXIA MARKET, BY PRODUCT, 2020-2029 (USD THOUSAND)
TABLE 247 THAILAND SUPPORTIVE DEVICES IN ATAXIA MARKET, BY PRODUCT, 2020-2029 (USD THOUSAND)
TABLE 248 THAILAND DIAGNOSTICS IN ATAXIA MARKET, BY PRODUCT, 2020-2029 (USD THOUSAND)
TABLE 249 THAILAND IMAGING TEST IN ATAXIA MARKET, BY PRODUCT, 2020-2029 (USD THOUSAND)
TABLE 250 THAILAND IMAGING TEST IN ATAXIA MARKET, BY DOSAGE FORM, 2020-2029 (USD THOUSAND)
TABLE 251 THAILAND SOLID IN ATAXIA MARKET, BY DOSAGE FORM, 2020-2029 (USD THOUSAND)
TABLE 252 THAILAND LIQUIDS IN ATAXIA MARKET, BY DOSAGE FORM, 2020-2029 (USD THOUSAND)
TABLE 253 THAILAND ATAXIA MARKET, BY ROUTE OF ADMINISTRATION, 2020-2029 (USD THOUSAND)
TABLE 254 THAILAND ATAXIA MARKET, BY PATIENT TYPE, 2020-2029 (USD THOUSAND)
TABLE 255 THAILAND ADULT IN ATAXIA MARKET, BY PATIENT TYPE, 2020-2029 (USD THOUSAND)
TABLE 256 THAILAND ATAXIA MARKET, BY END USER, 2020-2029 (USD THOUSAND)
TABLE 257 THAILAND ATAXIA MARKET, BY DISTRIBUTION CHANNEL, 2020-2029 (USD THOUSAND)
TABLE 258 THAILAND RETAILS SALES IN ATAXIA MARKET, BY DISTRIBUTION CHANNEL, 2020-2029 (USD THOUSAND)
TABLE 259 MALAYSIA ATAXIA MARKET, BY TYPE, 2020-2029 (USD THOUSAND)
TABLE 260 MALAYSIA SPINOCEREBELLAR ATAXIAS IN ATAXIA MARKET, BY TYPE, 2020-2029 (USD THOUSAND)
TABLE 261 MALAYSIA ATAXIA MARKET, BY PRODUCT, 2020-2029 (USD THOUSAND)
TABLE 262 MALAYSIA TREATMENT IN ATAXIA MARKET, BY PRODUCT, 2020-2029 (USD THOUSAND)
TABLE 263 MALAYSIA PHARMACOTHERAPY IN ATAXIA MARKET, BY PRODUCT, 2020-2029 (USD THOUSAND)
TABLE 264 MALAYSIA STIFFNESS/SPASTICITY IN ATAXIA MARKET, BY PRODUCT, 2020-2029 (USD THOUSAND)
TABLE 265 MALAYSIA GAIT AND TREMORS IN ATAXIA MARKET, BY PRODUCT, 2020-2029 (USD THOUSAND)
TABLE 266 MALAYSIA ANTI-OXIDANTS IN ATAXIA MARKET, BY PRODUCT, 2020-2029 (USD THOUSAND)
TABLE 267 MALAYSIA NON ANTI-OXIDANTS TREATMENT IN ATAXIA MARKET, BY PRODUCT, 2020-2029 (USD THOUSAND)
TABLE 268 MALAYSIA ANTI-ARRHYTHMIC AGENTS IN ATAXIA MARKET, BY PRODUCT, 2020-2029 (USD THOUSAND)
TABLE 269 MALAYSIA ANTI-CARDIAC FAILURE IN ATAXIA MARKET, BY PRODUCT, 2020-2029 (USD THOUSAND)
TABLE 270 MALAYSIA ORAL HYPOGLYCEMIC THERAPEUTICS IN ATAXIA MARKET, BY PRODUCT, 2020-2029 (USD THOUSAND)
TABLE 271 MALAYSIA SULFONYLUREAS IN ATAXIA MARKET, BY PRODUCT, 2020-2029 (USD THOUSAND)
TABLE 272 MALAYSIA LIFESTYLE THERAPY IN ATAXIA MARKET, BY PRODUCT, 2020-2029 (USD THOUSAND)
TABLE 273 MALAYSIA SUPPORTIVE DEVICES IN ATAXIA MARKET, BY PRODUCT, 2020-2029 (USD THOUSAND)
TABLE 274 MALAYSIA DIAGNOSTICS IN ATAXIA MARKET, BY PRODUCT, 2020-2029 (USD THOUSAND)
TABLE 275 MALAYSIA IMAGING TEST IN ATAXIA MARKET, BY PRODUCT, 2020-2029 (USD THOUSAND)
TABLE 276 MALAYSIA IMAGING TEST IN ATAXIA MARKET, BY DOSAGE FORM, 2020-2029 (USD THOUSAND)
TABLE 277 MALAYSIA SOLID IN ATAXIA MARKET, BY DOSAGE FORM, 2020-2029 (USD THOUSAND)
TABLE 278 MALAYSIA LIQUIDS IN ATAXIA MARKET, BY DOSAGE FORM, 2020-2029 (USD THOUSAND)
TABLE 279 MALAYSIA ATAXIA MARKET, BY ROUTE OF ADMINISTRATION, 2020-2029 (USD THOUSAND)
TABLE 280 MALAYSIA ATAXIA MARKET, BY PATIENT TYPE, 2020-2029 (USD THOUSAND)
TABLE 281 MALAYSIA ADULT IN ATAXIA MARKET, BY PATIENT TYPE, 2020-2029 (USD THOUSAND)
TABLE 282 MALAYSIA ATAXIA MARKET, BY END USER, 2020-2029 (USD THOUSAND)
TABLE 283 MALAYSIA ATAXIA MARKET, BY DISTRIBUTION CHANNEL, 2020-2029 (USD THOUSAND)
TABLE 284 MALAYSIA RETAILS SALES IN ATAXIA MARKET, BY DISTRIBUTION CHANNEL, 2020-2029 (USD THOUSAND)
TABLE 285 INDONESIA ATAXIA MARKET, BY TYPE, 2020-2029 (USD THOUSAND)
TABLE 286 INDONESIA SPINOCEREBELLAR ATAXIAS IN ATAXIA MARKET, BY TYPE, 2020-2029 (USD THOUSAND)
TABLE 287 INDONESIA ATAXIA MARKET, BY PRODUCT, 2020-2029 (USD THOUSAND)
TABLE 288 INDONESIA TREATMENT IN ATAXIA MARKET, BY PRODUCT, 2020-2029 (USD THOUSAND)
TABLE 289 INDONESIA PHARMACOTHERAPY IN ATAXIA MARKET, BY PRODUCT, 2020-2029 (USD THOUSAND)
TABLE 290 INDONESIA STIFFNESS/SPASTICITY IN ATAXIA MARKET, BY PRODUCT, 2020-2029 (USD THOUSAND)
TABLE 291 INDONESIA GAIT AND TREMORS IN ATAXIA MARKET, BY PRODUCT, 2020-2029 (USD THOUSAND)
TABLE 292 INDONESIA ANTI-OXIDANTS IN ATAXIA MARKET, BY PRODUCT, 2020-2029 (USD THOUSAND)
TABLE 293 INDONESIA NON ANTI-OXIDANTS TREATMENT IN ATAXIA MARKET, BY PRODUCT, 2020-2029 (USD THOUSAND)
TABLE 294 INDONESIA ANTI-ARRHYTHMIC AGENTS IN ATAXIA MARKET, BY PRODUCT, 2020-2029 (USD THOUSAND)
TABLE 295 INDONESIA ANTI-CARDIAC FAILURE IN ATAXIA MARKET, BY PRODUCT, 2020-2029 (USD THOUSAND)
TABLE 296 INDONESIA ORAL HYPOGLYCEMIC THERAPEUTICS IN ATAXIA MARKET, BY PRODUCT, 2020-2029 (USD THOUSAND)
TABLE 297 INDONESIA SULFONYLUREAS IN ATAXIA MARKET, BY PRODUCT, 2020-2029 (USD THOUSAND)
TABLE 298 INDONESIA LIFESTYLE THERAPY IN ATAXIA MARKET, BY PRODUCT, 2020-2029 (USD THOUSAND)
TABLE 299 INDONESIA SUPPORTIVE DEVICES IN ATAXIA MARKET, BY PRODUCT, 2020-2029 (USD THOUSAND)
TABLE 300 INDONESIA DIAGNOSTICS IN ATAXIA MARKET, BY PRODUCT, 2020-2029 (USD THOUSAND)
TABLE 301 INDONESIA IMAGING TEST IN ATAXIA MARKET, BY PRODUCT, 2020-2029 (USD THOUSAND)
TABLE 302 INDONESIA IMAGING TEST IN ATAXIA MARKET, BY DOSAGE FORM, 2020-2029 (USD THOUSAND)
TABLE 303 INDONESIA SOLID IN ATAXIA MARKET, BY DOSAGE FORM, 2020-2029 (USD THOUSAND)
TABLE 304 INDONESIA LIQUIDS IN ATAXIA MARKET, BY DOSAGE FORM, 2020-2029 (USD THOUSAND)
TABLE 305 INDONESIA ATAXIA MARKET, BY ROUTE OF ADMINISTRATION, 2020-2029 (USD THOUSAND)
TABLE 306 INDONESIA ATAXIA MARKET, BY PATIENT TYPE, 2020-2029 (USD THOUSAND)
TABLE 307 INDONESIA ADULT IN ATAXIA MARKET, BY PATIENT TYPE, 2020-2029 (USD THOUSAND)
TABLE 308 INDONESIA ATAXIA MARKET, BY END USER, 2020-2029 (USD THOUSAND)
TABLE 309 INDONESIA ATAXIA MARKET, BY DISTRIBUTION CHANNEL, 2020-2029 (USD THOUSAND)
TABLE 310 INDONESIA RETAILS SALES IN ATAXIA MARKET, BY DISTRIBUTION CHANNEL, 2020-2029 (USD THOUSAND)
TABLE 311 PHILIPPINES ATAXIA MARKET, BY TYPE, 2020-2029 (USD THOUSAND)
TABLE 312 PHILIPPINES SPINOCEREBELLAR ATAXIAS IN ATAXIA MARKET, BY TYPE, 2020-2029 (USD THOUSAND)
TABLE 313 PHILIPPINES ATAXIA MARKET, BY PRODUCT, 2020-2029 (USD THOUSAND)
TABLE 314 PHILIPPINES TREATMENT IN ATAXIA MARKET, BY PRODUCT, 2020-2029 (USD THOUSAND)
TABLE 315 PHILIPPINES PHARMACOTHERAPY IN ATAXIA MARKET, BY PRODUCT, 2020-2029 (USD THOUSAND)
TABLE 316 PHILIPPINES STIFFNESS/SPASTICITY IN ATAXIA MARKET, BY PRODUCT, 2020-2029 (USD THOUSAND)
TABLE 317 PHILIPPINES GAIT AND TREMORS IN ATAXIA MARKET, BY PRODUCT, 2020-2029 (USD THOUSAND)
TABLE 318 PHILIPPINES ANTI-OXIDANTS IN ATAXIA MARKET, BY PRODUCT, 2020-2029 (USD THOUSAND)
TABLE 319 PHILIPPINES NON ANTI-OXIDANTS TREATMENT IN ATAXIA MARKET, BY PRODUCT, 2020-2029 (USD THOUSAND)
TABLE 320 PHILIPPINES ANTI-ARRHYTHMIC AGENTS IN ATAXIA MARKET, BY PRODUCT, 2020-2029 (USD THOUSAND)
TABLE 321 PHILIPPINES ANTI-CARDIAC FAILURE IN ATAXIA MARKET, BY PRODUCT, 2020-2029 (USD THOUSAND)
TABLE 322 PHILIPPINES ORAL HYPOGLYCEMIC THERAPEUTICS IN ATAXIA MARKET, BY PRODUCT, 2020-2029 (USD THOUSAND)
TABLE 323 PHILIPPINES SULFONYLUREAS IN ATAXIA MARKET, BY PRODUCT, 2020-2029 (USD THOUSAND)
TABLE 324 PHILIPPINES LIFESTYLE THERAPY IN ATAXIA MARKET, BY PRODUCT, 2020-2029 (USD THOUSAND)
TABLE 325 PHILIPPINES SUPPORTIVE DEVICES IN ATAXIA MARKET, BY PRODUCT, 2020-2029 (USD THOUSAND)
TABLE 326 PHILIPPINES DIAGNOSTICS IN ATAXIA MARKET, BY PRODUCT, 2020-2029 (USD THOUSAND)
TABLE 327 PHILIPPINES IMAGING TEST IN ATAXIA MARKET, BY PRODUCT, 2020-2029 (USD THOUSAND)
TABLE 328 PHILIPPINES IMAGING TEST IN ATAXIA MARKET, BY DOSAGE FORM, 2020-2029 (USD THOUSAND)
TABLE 329 PHILIPPINES SOLID IN ATAXIA MARKET, BY DOSAGE FORM, 2020-2029 (USD THOUSAND)
TABLE 330 PHILIPPINES LIQUIDS IN ATAXIA MARKET, BY DOSAGE FORM, 2020-2029 (USD THOUSAND)
TABLE 331 PHILIPPINES ATAXIA MARKET, BY ROUTE OF ADMINISTRATION, 2020-2029 (USD THOUSAND)
TABLE 332 PHILIPPINES ATAXIA MARKET, BY PATIENT TYPE, 2020-2029 (USD THOUSAND)
TABLE 333 PHILIPPINES ADULT IN ATAXIA MARKET, BY PATIENT TYPE, 2020-2029 (USD THOUSAND)
TABLE 334 PHILIPPINES ATAXIA MARKET, BY END USER, 2020-2029 (USD THOUSAND)
TABLE 335 PHILIPPINES ATAXIA MARKET, BY DISTRIBUTION CHANNEL, 2020-2029 (USD THOUSAND)
TABLE 336 PHILIPPINES RETAILS SALES IN ATAXIA MARKET, BY DISTRIBUTION CHANNEL, 2020-2029 (USD THOUSAND)
TABLE 337 VIETNAM ATAXIA MARKET, BY TYPE, 2020-2029 (USD THOUSAND)
TABLE 338 VIETNAM SPINOCEREBELLAR ATAXIAS IN ATAXIA MARKET, BY TYPE, 2020-2029 (USD THOUSAND)
TABLE 339 VIETNAM ATAXIA MARKET, BY PRODUCT, 2020-2029 (USD THOUSAND)
TABLE 340 VIETNAM TREATMENT IN ATAXIA MARKET, BY PRODUCT, 2020-2029 (USD THOUSAND)
TABLE 341 VIETNAM PHARMACOTHERAPY IN ATAXIA MARKET, BY PRODUCT, 2020-2029 (USD THOUSAND)
TABLE 342 VIETNAM STIFFNESS/SPASTICITY IN ATAXIA MARKET, BY PRODUCT, 2020-2029 (USD THOUSAND)
TABLE 343 VIETNAM GAIT AND TREMORS IN ATAXIA MARKET, BY PRODUCT, 2020-2029 (USD THOUSAND)
TABLE 344 VIETNAM ANTI-OXIDANTS IN ATAXIA MARKET, BY PRODUCT, 2020-2029 (USD THOUSAND)
TABLE 345 VIETNAM NON ANTI-OXIDANTS TREATMENT IN ATAXIA MARKET, BY PRODUCT, 2020-2029 (USD THOUSAND)
TABLE 346 VIETNAM ANTI-ARRHYTHMIC AGENTS IN ATAXIA MARKET, BY PRODUCT, 2020-2029 (USD THOUSAND)
TABLE 347 VIETNAM ANTI-CARDIAC FAILURE IN ATAXIA MARKET, BY PRODUCT, 2020-2029 (USD THOUSAND)
TABLE 348 VIETNAM ORAL HYPOGLYCEMIC THERAPEUTICS IN ATAXIA MARKET, BY PRODUCT, 2020-2029 (USD THOUSAND)
TABLE 349 VIETNAM SULFONYLUREAS IN ATAXIA MARKET, BY PRODUCT, 2020-2029 (USD THOUSAND)
TABLE 350 VIETNAM LIFESTYLE THERAPY IN ATAXIA MARKET, BY PRODUCT, 2020-2029 (USD THOUSAND)
TABLE 351 VIETNAM SUPPORTIVE DEVICES IN ATAXIA MARKET, BY PRODUCT, 2020-2029 (USD THOUSAND)
TABLE 352 VIETNAM DIAGNOSTICS IN ATAXIA MARKET, BY PRODUCT, 2020-2029 (USD THOUSAND)
TABLE 353 VIETNAM IMAGING TEST IN ATAXIA MARKET, BY PRODUCT, 2020-2029 (USD THOUSAND)
TABLE 354 VIETNAM IMAGING TEST IN ATAXIA MARKET, BY DOSAGE FORM, 2020-2029 (USD THOUSAND)
TABLE 355 VIETNAM SOLID IN ATAXIA MARKET, BY DOSAGE FORM, 2020-2029 (USD THOUSAND)
TABLE 356 VIETNAM LIQUIDS IN ATAXIA MARKET, BY DOSAGE FORM, 2020-2029 (USD THOUSAND)
TABLE 357 VIETNAM ATAXIA MARKET, BY ROUTE OF ADMINISTRATION, 2020-2029 (USD THOUSAND)
TABLE 358 VIETNAM ATAXIA MARKET, BY PATIENT TYPE, 2020-2029 (USD THOUSAND)
TABLE 359 VIETNAM ADULT IN ATAXIA MARKET, BY PATIENT TYPE, 2020-2029 (USD THOUSAND)
TABLE 360 VIETNAM ATAXIA MARKET, BY END USER, 2020-2029 (USD THOUSAND)
TABLE 361 VIETNAM ATAXIA MARKET, BY DISTRIBUTION CHANNEL, 2020-2029 (USD THOUSAND)
TABLE 362 VIETNAM RETAILS SALES IN ATAXIA MARKET, BY DISTRIBUTION CHANNEL, 2020-2029 (USD THOUSAND)
TABLE 363 RESTF OF ASIA-PACIFIC ATAXIA MARKET, BY TYPE, 2020-2029 (USD THOUSAND)
Lista de figuras
FIGURE 1 ASIA PACIFIC ATAXIA MARKET: SEGMENTATION
FIGURE 2 ASIA PACIFIC ATAXIA MARKET: DATA TRIANGULATION
FIGURE 3 ASIA PACIFIC ATAXIA MARKET: DROC ANALYSIS
FIGURE 4 ASIA PACIFIC ATAXIA MARKET: ASIA PACIFIC VS REGIONAL MARKET ANALYSIS
FIGURE 5 ASIA PACIFIC ATAXIA MARKET: COMPANY RESEARCH ANALYSIS
FIGURE 6 ASIA PACIFIC ATAXIA MARKET: INTERVIEW DEMOGRAPHICS
FIGURE 7 ASIA PACIFIC ATAXIA MARKET: DBMR MARKET POSITION GRID
FIGURE 8 ASIA PACIFIC ATAXIA MARKET: END USER COVERAGE GRID
FIGURE 9 ASIA PACIFIC ATAXIA MARKET: VENDOR SHARE ANALYSIS
FIGURE 10 ASIA PACIFIC ATAXIA MARKET: SEGMENTATION
FIGURE 11 RAPID RESEARCH IN FIELD OF ATAXIA THEREPEUTICS IS EXPECTED TO DRIVE THE ASIA PACIFIC ATAXIA MARKET IN THE FORECAST PERIOD
FIGURE 12 SPINOCEREBELLAR ATAXIAS SEGMENT IS EXPECTED TO ACCOUNT FOR THE LARGEST SHARE OF THE ASIA PACIFIC ATAXIA MARKET IN 2022 & 2029
FIGURE 13 NORTH AMERICA IS EXPECTED TO DOMINATE THE ASIA PACIFIC ATAXIA MARKET, AND ASIA-PACIFIC IS EXPECTED TO GROW WITH THE HIGHEST CAGR IN THE FORECAST PERIOD
FIGURE 14 DRIVERS, RESTRAINTS, OPPORTUNITIES, AND CHALLENGES OF THE ASIA PACIFIC ATAXIA MARKET
FIGURE 15 ASIA PACIFIC ATAXIA MARKET: BY TYPE, 2021
FIGURE 16 ASIA PACIFIC ATAXIA MARKET: BY TYPE, 2022-2029 (USD THOUSAND)
FIGURE 17 ASIA PACIFIC ATAXIA MARKET: BY TYPE, CAGR (2022-2029)
FIGURE 18 ASIA PACIFIC ATAXIA MARKET: BY TYPE, LIFELINE CURVE
FIGURE 19 ASIA PACIFIC ATAXIA MARKET: BY PRODUCT, 2021
FIGURE 20 ASIA PACIFIC ATAXIA MARKET: BY PRODUCT, 2022-2029 (USD THOUSAND)
FIGURE 21 ASIA PACIFIC ATAXIA MARKET: BY PRODUCT, CAGR (2022-2029)
FIGURE 22 ASIA PACIFIC ATAXIA MARKET: BY PRODUCT, LIFELINE CURVE
FIGURE 23 ASIA PACIFIC ATAXIA MARKET: BY DOSAGE FORM, 2021
FIGURE 24 ASIA PACIFIC ATAXIA MARKET: BY DOSAGE FORM, 2022-2029 (USD THOUSAND)
FIGURE 25 ASIA PACIFIC ATAXIA MARKET: BY DOSAGE FORM, CAGR (2022-2029)
FIGURE 26 ASIA PACIFIC ATAXIA MARKET: BY DOSAGE FORM, LIFELINE CURVE
FIGURE 27 ASIA PACIFIC ATAXIA MARKET: BY ROUTE OF ADMINISTRATION, 2021
FIGURE 28 ASIA PACIFIC ATAXIA MARKET: BY ROUTE OF ADMINISTRATION, 2022-2029 (USD THOUSAND)
FIGURE 29 ASIA PACIFIC ATAXIA MARKET: BY ROUTE OF ADMINISTRATION, CAGR (2022-2029)
FIGURE 30 ASIA PACIFIC ATAXIA MARKET: BY ROUTE OF ADMINISTRATION, LIFELINE CURVE
FIGURE 31 ASIA PACIFIC ATAXIA MARKET: BY PATIENT TYPE, 2021
FIGURE 32 ASIA PACIFIC ATAXIA MARKET: BY PATIENT TYPE, 2022-2029 (USD THOUSAND)
FIGURE 33 ASIA PACIFIC ATAXIA MARKET: BY PATIENT TYPE, CAGR (2022-2029)
FIGURE 34 ASIA PACIFIC ATAXIA MARKET: BY PATIENT TYPE, LIFELINE CURVE
FIGURE 35 ASIA PACIFIC ATAXIA MARKET: BY END USER, 2021
FIGURE 36 ASIA PACIFIC ATAXIA MARKET: BY END USER, 2022-2029 (USD THOUSAND)
FIGURE 37 ASIA PACIFIC ATAXIA MARKET: BY END USER, CAGR (2022-2029)
FIGURE 38 ASIA PACIFIC ATAXIA MARKET: BY END USER, LIFELINE CURVE
FIGURE 39 ASIA PACIFIC ATAXIA MARKET: BY DISTRIBUTION CHANNEL, 2021
FIGURE 40 ASIA PACIFIC ATAXIA MARKET: BY DISTRIBUTION CHANNEL, 2022-2029 (USD THOUSAND)
FIGURE 41 ASIA PACIFIC ATAXIA MARKET: BY DISTRIBUTION CHANNEL, CAGR (2022-2029)
FIGURE 42 ASIA PACIFIC ATAXIA MARKET: BY DISTRIBUTION CHANNEL, LIFELINE CURVE
FIGURE 43 ASIA-PACIFIC ATAXIA MARKET: SNAPSHOT (2021)
FIGURE 44 ASIA-PACIFIC ATAXIA MARKET: BY COUNTRY (2021)
FIGURE 45 ASIA-PACIFIC ATAXIA MARKET: BY COUNTRY (2022 & 2029)
FIGURE 46 ASIA-PACIFIC ATAXIA MARKET: BY COUNTRY (2021 & 2029)
FIGURE 47 ASIA-PACIFIC ATAXIA MARKET: BY TYPE (2022-2029)
FIGURE 48 ASIA PACIFIC ATAXIA MARKET: COMPANY SHARE 2021 (%)
Metodología de investigación
La recopilación de datos y el análisis del año base se realizan utilizando módulos de recopilación de datos con muestras de gran tamaño. La etapa incluye la obtención de información de mercado o datos relacionados a través de varias fuentes y estrategias. Incluye el examen y la planificación de todos los datos adquiridos del pasado con antelación. Asimismo, abarca el examen de las inconsistencias de información observadas en diferentes fuentes de información. Los datos de mercado se analizan y estiman utilizando modelos estadísticos y coherentes de mercado. Además, el análisis de la participación de mercado y el análisis de tendencias clave son los principales factores de éxito en el informe de mercado. Para obtener más información, solicite una llamada de un analista o envíe su consulta.
La metodología de investigación clave utilizada por el equipo de investigación de DBMR es la triangulación de datos, que implica la extracción de datos, el análisis del impacto de las variables de datos en el mercado y la validación primaria (experto en la industria). Los modelos de datos incluyen cuadrícula de posicionamiento de proveedores, análisis de línea de tiempo de mercado, descripción general y guía del mercado, cuadrícula de posicionamiento de la empresa, análisis de patentes, análisis de precios, análisis de participación de mercado de la empresa, estándares de medición, análisis global versus regional y de participación de proveedores. Para obtener más información sobre la metodología de investigación, envíe una consulta para hablar con nuestros expertos de la industria.
Personalización disponible
Data Bridge Market Research es líder en investigación formativa avanzada. Nos enorgullecemos de brindar servicios a nuestros clientes existentes y nuevos con datos y análisis que coinciden y se adaptan a sus objetivos. El informe se puede personalizar para incluir análisis de tendencias de precios de marcas objetivo, comprensión del mercado de países adicionales (solicite la lista de países), datos de resultados de ensayos clínicos, revisión de literatura, análisis de mercado renovado y base de productos. El análisis de mercado de competidores objetivo se puede analizar desde análisis basados en tecnología hasta estrategias de cartera de mercado. Podemos agregar tantos competidores sobre los que necesite datos en el formato y estilo de datos que esté buscando. Nuestro equipo de analistas también puede proporcionarle datos en archivos de Excel sin procesar, tablas dinámicas (libro de datos) o puede ayudarlo a crear presentaciones a partir de los conjuntos de datos disponibles en el informe.