Asia Pacific Apac Radiotherapy Market
Tamaño del mercado en miles de millones de dólares
Tasa de crecimiento anual compuesta (CAGR) :
% 
 USD
1.06 Billion
USD
2.40 Billion
2024
2032
USD
1.06 Billion
USD
2.40 Billion
2024
2032
| 2025 –2032 | |
| USD 1.06 Billion | |
| USD 2.40 Billion | |
| % | |
|
Segmentación del mercado de radioterapia en Asia-Pacífico por producto y servicios (servicios, producto y software), tipo (radioterapia externa, radioterapia interna, radioterapia sistémica/radiofármacos, entre otros), aplicación (cáncer de mama, cáncer de pulmón, cáncer de próstata, cáncer colorrectal, linfoma, cáncer de hígado, cáncer de tiroides, cáncer cerebral, cáncer de cuello uterino, cáncer de columna vertebral, entre otros), usuario final (hospitales, centros de radioterapia, clínicas especializadas, entre otros), canal de distribución (licitaciones directas, distribuidores externos, entre otros): tendencias del sector y pronóstico hasta 2032
Tamaño del mercado de radioterapia en Asia-Pacífico
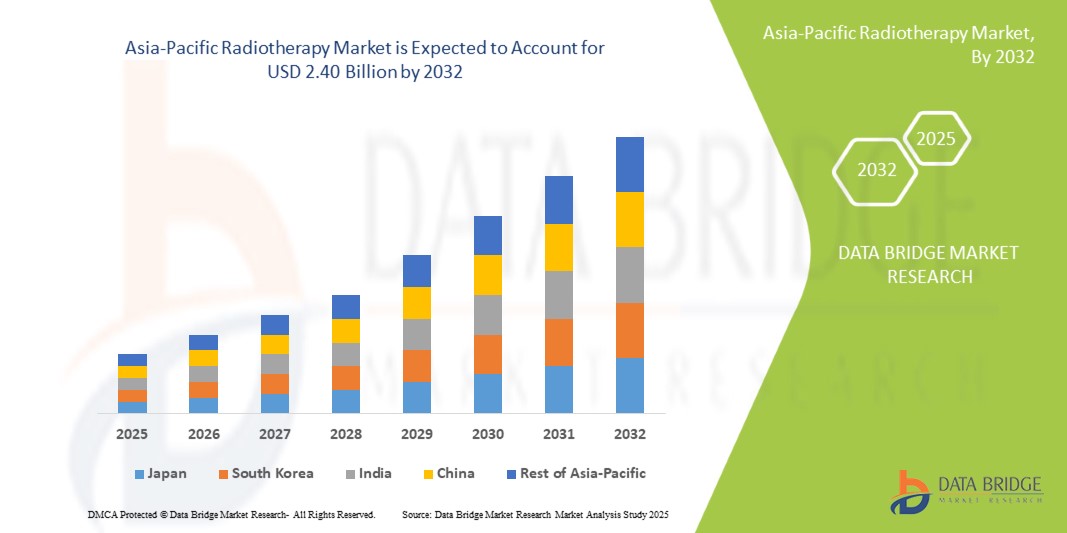
- El tamaño del mercado de radioterapia de Asia-Pacífico se valoró en USD 1.060 millones en 2024 y se espera que alcance los USD 2.400 millones para 2032 , con una CAGR del 11,2 % durante el período de pronóstico.
- El crecimiento del mercado se debe a la creciente prevalencia de la enfermedad del cáncer, a la nueva tecnología en radioterapia para el tratamiento del cáncer y a la creciente adopción de dispositivos y procedimientos de radioterapia.
- Además, se espera que el mercado aumente el gasto sanitario para el tratamiento del cáncer, aumenten las iniciativas gubernamentales hacia el tratamiento del cáncer y aumente la conciencia de los pacientes hacia el tratamiento del cáncer.
Análisis del mercado de radioterapia en Asia-Pacífico
- El aumento de la prevalencia del cáncer en Asia-Pacífico, la creciente adopción de técnicas avanzadas de radioterapia como la radioterapia de intensidad modulada (IMRT), la radioterapia corporal estereotáctica (SBRT) y la terapia de protones, junto con los avances tecnológicos en los sistemas de imágenes y planificación del tratamiento, son factores impulsores clave que se espera que impulsen el crecimiento del mercado de radioterapia en Asia-Pacífico.
- Factores clave como la creciente demanda de soluciones de tratamiento del cáncer no invasivas y dirigidas, las crecientes inversiones en I+D centradas en la oncología, la innovación continua en equipos de radioterapia y las políticas gubernamentales de apoyo y financiación para la infraestructura de atención del cáncer están impulsando el crecimiento del mercado de radioterapia de Asia y el Pacífico.
- Japón dominó el mercado de radioterapia de Asia-Pacífico en 2024 con una participación de mercado del 29,71% y se espera que crezca con una CAGR del 11,8% en el período de pronóstico de 2025 a 2032 debido a la creciente prevalencia de la enfermedad del cáncer, la nueva tecnología en radioterapia para el tratamiento del cáncer y la creciente adopción de dispositivos y procedimientos de radioterapia.
- Se espera que India sea la región de más rápido crecimiento para el mercado de radioterapia de Asia-Pacífico con una participación de mercado del 12,2% impulsada por aplicaciones emergentes en el mercado, la creciente demanda de soluciones de tratamiento del cáncer no invasivas y dirigidas, las crecientes inversiones en I+D centradas en la oncología, la innovación continua en equipos de radioterapia y las políticas gubernamentales de apoyo y la financiación de la infraestructura de atención del cáncer están impulsando el crecimiento del mercado mundial de radioterapia.
- El segmento de radioterapia de haz externo dominó el mercado de radioterapia de Asia-Pacífico con una participación de mercado del 63,34 % en 2024, creciendo con una CAGR del 11,5 % en el período de pronóstico de 2025 a 2032. Impulsado por la creciente prevalencia de la enfermedad del cáncer, la nueva tecnología en radioterapia para el tratamiento del cáncer y la creciente adopción de dispositivos y procedimientos de radioterapia.
Alcance del informe y segmentación del mercado de radioterapia en Asia-Pacífico
|
Atributos |
Perspectivas clave del mercado de radioterapia en Asia-Pacífico |
|
Segmentos cubiertos |
|
|
Países cubiertos |
Asia-Pacífico
|
|
Actores clave del mercado |
|
|
Oportunidades de mercado |
|
|
Conjuntos de información de datos de valor añadido |
Además de los conocimientos sobre escenarios de mercado, como el valor de mercado, la tasa de crecimiento, la segmentación, la cobertura geográfica y los principales actores, los informes de mercado seleccionados por Data Bridge Market Research también incluyen un análisis profundo de expertos, epidemiología de pacientes, análisis de la cartera de productos, análisis de precios y marco regulatorio. |
Tendencias del mercado de radioterapia en Asia-Pacífico
Creciente demanda de soluciones de tratamiento del cáncer avanzadas, no invasivas y precisas en todos los sistemas de salud .
- La demanda de soluciones avanzadas, no invasivas y de precisión para el tratamiento del cáncer está creciendo rápidamente, impulsada por la creciente prevalencia del cáncer, la mayor concienciación de los pacientes y la transición hacia la medicina personalizada en los sistemas de salud. Las tecnologías de radioterapia abordan estas demandas ofreciendo opciones de tratamiento específicas y eficaces que minimizan los efectos secundarios y mejoran los resultados de los pacientes.
- A medida que los profesionales sanitarios buscan reducir las complicaciones relacionadas con el tratamiento y mejorar la calidad de la atención, se observa una creciente tendencia hacia la integración de técnicas avanzadas de radioterapia, como la radioterapia guiada por imagen (IGRT), la radioterapia de intensidad modulada (IMRT) y la terapia de protones. Esta transición es crucial para cumplir con los estrictos estándares regulatorios, mejorar la eficacia del tratamiento y apoyar la transición de Asia-Pacífico hacia una atención basada en el valor.
- Los principales actores de la industria, como Siemens Healthineers, Elekta, Varian (una empresa de Siemens) y Accuray, están aumentando significativamente sus esfuerzos de I+D para desarrollar equipos y software de radioterapia de vanguardia que ofrecen mayor precisión, automatización e integración con inteligencia artificial, impulsando aún más la innovación y el crecimiento del mercado.
- Los avances en imágenes, planificación del tratamiento y tecnologías de administración, como la radioterapia adaptativa, la radiocirugía estereotáctica (SRS) y la terapia con haz de protones, están mejorando la precisión del tratamiento, la seguridad del paciente y la eficiencia operativa. Estas innovaciones están permitiendo una adopción más amplia en hospitales y centros especializados, e impulsando la expansión del mercado de radioterapia en Asia-Pacífico.
Dinámica del mercado de radioterapia en Asia-Pacífico
“Creciente prevalencia del cáncer”
- La creciente demanda en Asia-Pacífico de soluciones de tratamiento oncológico avanzadas, precisas y adaptadas al paciente, impulsada por la creciente prevalencia del cáncer, la mayor concienciación de los pacientes y la transición hacia terapias personalizadas y menos invasivas, presiona a los proveedores de atención médica y fabricantes para que innoven y mejoren las tecnologías de radioterapia en hospitales, clínicas especializadas y centros oncológicos. Para satisfacer esta demanda, las empresas están acelerando las inversiones en equipos, software y sistemas de planificación del tratamiento de radioterapia de última generación para ofrecer mayor precisión, mejores resultados para los pacientes y flujos de trabajo optimizados a gran escala. Estos avances están construyendo ecosistemas de atención oncológica más inteligentes y eficientes, de forma similar a cómo la medicina de precisión está transformando la atención médica.
- Por ejemplo, a principios de 2025, investigadores de importantes institutos oncológicos destacaron la creciente importancia de la terapia de protones y la radioterapia adaptativa como enfoques transformadores en el tratamiento del cáncer. Sus estudios destacan los beneficios de estas tecnologías de vanguardia para minimizar la exposición a la radiación de los tejidos sanos, a la vez que mejoran la focalización tumoral, mejorando significativamente la calidad de vida del paciente. El informe destaca la creciente importancia de integrar la imagenología avanzada y la planificación del tratamiento basada en IA como componentes vitales en el panorama cambiante de la atención oncológica, desempeñando un papel fundamental en la mejora de la eficacia de la radioterapia como un enfoque personalizado e integrador.
- Estas inversiones no solo están transformando las capacidades de radioterapia, sino que también permiten una adopción más amplia de modalidades de tratamiento sofisticadas en mercados emergentes y segmentos de alto crecimiento como la oncología pediátrica y los cánceres raros. Empresas líderes como Siemens, Elekta, Varian (Siemens) y Accuracy están invirtiendo fuertemente en sistemas de radioterapia innovadores, software basado en IA y soluciones centradas en el paciente para mantener una ventaja competitiva y mejorar el rendimiento del tratamiento en todas las aplicaciones.
- Además, el compromiso continuo de gobiernos, instituciones de investigación y la industria privada para mejorar la infraestructura de atención oncológica y promover la innovación en radioterapia está desempeñando un papel fundamental en la configuración de un mercado oncológico más eficaz en Asia-Pacífico. Estas iniciativas están consolidando la radioterapia avanzada como piedra angular del tratamiento moderno del cáncer y un importante motor de crecimiento en la transición hacia terapias más seguras, precisas y adaptadas al paciente.
Restricción/Desafío
“ Falta de profesionales cualificados y certificados ”
- La escasez de profesionales de radioterapia cualificados y certificados sigue siendo una de las principales limitaciones que limitan el crecimiento y la adopción generalizada de tecnologías de radioterapia avanzadas a nivel mundial. El tratamiento de radioterapia requiere oncólogos, físicos médicos, dosimetristas y radioterapeutas altamente capacitados para garantizar una planificación precisa del tratamiento, una administración segura y una gestión eficaz del paciente; habilidades que escasean, especialmente en las regiones en desarrollo.
- Además, la complejidad de las técnicas modernas de radioterapia, como la radioterapia de intensidad modulada (IMRT), la radiocirugía estereotáctica (SRS) y la terapia de protones, exige formación y certificación profesional continua para mantenerse al día con los avances tecnológicos. La falta de programas de formación estandarizados y marcos de acreditación en muchos países agrava el problema, lo que a menudo conduce a resultados terapéuticos deficientes y limita la capacidad de aprovechar al máximo los equipos de radioterapia sofisticados.
- Por ejemplo, en marzo de 2025, un estudio del Organismo Internacional de Energía Atómica (OIEA) destacó que muchos países de ingresos bajos y medianos enfrentan una grave escasez de personal capacitado en radioterapia, lo que retrasa significativamente la implementación de nuevas tecnologías de tratamiento y restringe el acceso de los pacientes a una atención de calidad. El informe enfatizó la urgente necesidad de colaboración internacional para desarrollar programas de capacitación escalables y vías de certificación adaptadas a entornos con recursos limitados.
- De manera similar, una encuesta de 2024 realizada por la Sociedad Estadounidense de Oncología Radioterapéutica (ASTRO) reveló que, a pesar de las crecientes inversiones en sistemas de radioterapia avanzados en los Estados Unidos, muchos centros tienen dificultades para reclutar y retener físicos médicos y dosimetristas calificados, lo que impacta directamente la eficiencia del tratamiento y el rendimiento de los pacientes.
- La escasez de profesionales cualificados, sumada a la creciente complejidad de las técnicas de radioterapia, sigue obstaculizando la adopción generalizada y el uso óptimo de los servicios de radioterapia. Si bien se están realizando esfuerzos continuos en materia de educación, certificación y formación a distancia, abordar estos desafíos laborales sigue siendo crucial para aprovechar al máximo el potencial del mercado de radioterapia de Asia-Pacífico.
Alcance del mercado de radioterapia en Asia-Pacífico
El mercado está segmentado en función del producto, tipo de aplicación, tipo de procedimiento, facilidad de uso, usuario final y canal de distribución.
• Por producto y servicios
En función de los productos y servicios, el mercado se segmenta en servicios, productos y software. En 2025, se prevé que el segmento de Servicios domine el mercado con una cuota de mercado del 56,96 %, con una tasa de crecimiento anual compuesta (TCAC) del 11,5 % para el período de pronóstico de 2025 a 2032, impulsada por la creciente prevalencia del cáncer, las nuevas tecnologías en radioterapia para su tratamiento y la creciente adopción de dispositivos y procedimientos de radioterapia.
- Por tipo
Según el tipo de mercado, el mercado se segmenta en radioterapia externa, radioterapia interna, radioterapia sistémica/radiofármacos, entre otros. En 2025, se prevé que el segmento de radioterapia externa domine el mercado con una cuota de mercado del 65,93 %, con una tasa de crecimiento anual compuesta (TCAC) del 11,4 % durante el período de pronóstico de 2025 a 2032, impulsada por el aumento previsto del gasto sanitario en el tratamiento del cáncer, las crecientes iniciativas gubernamentales en este ámbito y la mayor concienciación de los pacientes sobre el tratamiento oncológico.
- Por aplicación
Según la aplicación, el mercado se segmenta en cáncer de mama, cáncer de pulmón, cáncer de próstata, cáncer colorrectal, linfoma, cáncer de hígado, cáncer de tiroides, cáncer cerebral, cáncer de cuello uterino, cáncer de columna vertebral y otros. En 2025, se prevé que el segmento de cáncer de mama domine el mercado con una cuota de mercado del 23,68%, con una tasa de crecimiento anual compuesta (TCAC) del 12,4% durante el período de pronóstico de 2025 a 2032, impulsada por la creciente prevalencia del cáncer, las nuevas tecnologías en radioterapia para su tratamiento y la creciente adopción de dispositivos y procedimientos de radioterapia.
- Por el usuario final
En función del usuario final, el mercado se segmenta en hospitales, centros de radioterapia, clínicas especializadas, institutos académicos y de investigación, entre otros. En 2024, el segmento Hospitales dominó el mercado con una participación del 64,39% y una tasa de crecimiento anual compuesta (TCAC) del 11,6% durante el período de pronóstico de 2025 a 2032, impulsada por el aumento del gasto sanitario en el tratamiento del cáncer, las crecientes iniciativas gubernamentales en este ámbito y la mayor concienciación de los pacientes sobre el tratamiento oncológico.
- Por canal de distribución
Según el canal de distribución, el mercado se segmenta en licitaciones directas, distribuidores externos y otros. En 2024, el segmento de Licitaciones Directas dominó el mercado con una participación del 82,08% y una tasa de crecimiento anual compuesta (TCAC) del 11,4% durante el período de pronóstico de 2025 a 2032, impulsada por la creciente prevalencia del cáncer, las nuevas tecnologías en radioterapia para su tratamiento y la creciente adopción de dispositivos y procedimientos de radioterapia.
Análisis regional del mercado de radioterapia en Asia-Pacífico
- Se espera que el mercado de radioterapia de Japón en Asia-Pacífico alcance los USD 750,99 millones para 2032, desde USD 315,22 millones en 2024, creciendo a una CAGR del 10,5% en el período de pronóstico de 2025 a 2032.
- Japón destina una parte significativa de su PIB a la atención médica, lo que garantiza una financiación sustancial para tecnologías de vanguardia para el tratamiento del cáncer, incluyendo procedimientos avanzados de radioterapia. En cambio, los mercados emergentes están incrementando su gasto en atención médica debido a la creciente prevalencia del cáncer y al mayor conocimiento de las opciones de tratamiento modernas. La disponibilidad de financiación, tanto del sector público como del privado, desempeña un papel crucial en la ampliación del acceso a los servicios de radioterapia.
- En Asia-Pacífico, la radioterapia está ampliamente disponible y está integrada en la atención oncológica estándar. Por el contrario, los mercados emergentes con infraestructura sanitaria en desarrollo están experimentando un rápido crecimiento en el acceso a los servicios de radioterapia, impulsado por la expansión de las redes hospitalarias y el aumento de los presupuestos sanitarios. A medida que los sistemas sanitarios se centralizan o privatizan, el aumento de las inversiones en equipos y software de radioterapia avanzados promueve el crecimiento del mercado y mejora la accesibilidad al tratamiento.
Perspectivas del mercado de radioterapia en Australia
Se espera que el mercado de radioterapia de Australia registre una CAGR del 11,5 % entre 2025 y 2032, impulsado por el aumento previsto del gasto sanitario para el tratamiento del cáncer, las crecientes iniciativas gubernamentales hacia el tratamiento del cáncer y la creciente concienciación de los pacientes hacia el tratamiento del cáncer.
Perspectivas del mercado de radioterapia en India
Se espera que el mercado de radioterapia de la India registre una CAGR del 12,2 % entre 2025 y 2032, impulsado por el aumento previsto del gasto sanitario para el tratamiento del cáncer, las crecientes iniciativas gubernamentales hacia el tratamiento del cáncer y la creciente concienciación de los pacientes hacia el tratamiento del cáncer.
Cuota de mercado de radioterapia en Asia-Pacífico
El mercado de radioterapia de Asia-Pacífico está liderado principalmente por empresas bien establecidas, entre las que se incluyen:
- Siemens Healthcare GmbH (Alemania)
- Hitachi, Ltd. (Japón)
- General Electric Company (EE. UU.)
- Koninklijke Philips NV (Países Bajos)
- Elekta (Suecia)
- ZEISS International (Alemania)
- IBA Worldwide (Bélgica)
- Canon Medical Systems Corporation (Japón)
- Accuray Incorporated (EE. UU.)
- Mevion Medical Systems (EE. UU.)
- Brainlab (Alemania)
- BEBIG Medical (Alemania)
- LinaTech, Inc. (China)
- United Imaging Healthcare Co., Ltd. (China)
- Eckert & Ziegler BEBIG (Alemania)
- ViewRay Systems, Inc. (EE. UU.)
- Nordion (Canadá) Inc. (Canadá)
Últimos avances en el mercado de radioterapia de Asia-Pacífico
- En mayo de 2024, Siemens Healthineers y Varian presentaron nuevos avances en oncología radioterápica en ESTRO 2024, incluidas las imágenes HyperSight, la gestión oncológica ARIA CORE y una resonancia magnética más accesible para radioterapia.
- En septiembre de 2024, Ballad Health firmó un acuerdo de colaboración de 10 años y 260 millones de dólares con Varian, una empresa de Siemens Healthineers, para transformar la atención oncológica en las Tierras Altas de los Apalaches. Esta alianza incorporará tecnología oncológica avanzada, incluyendo aceleradores lineales y soluciones de gestión digital, a seis centros oncológicos, mejorando la precisión y la accesibilidad del tratamiento para las comunidades rurales.
- En 2023, Hitachi expandió su segmento de Sistemas y Servicios Digitales (DSS) mediante soluciones en la nube, IA e IoT. Esto incluyó un mayor desarrollo de su plataforma Lumada y la integración de Asia-PacificLogic, una empresa de servicios de TI.
- En mayo de 2025, GE HealthCare ampliará significativamente su cartera de oncología radioterápica en ESTRO 2025 con nuevas soluciones basadas en IA, como MR Contour DL para una segmentación eficiente de órganos. También mejorará su software de radioterapia inteligente (iRT) para integrar flujos de trabajo basados en RM e IA, con el objetivo de lograr un tratamiento oncológico más preciso y oportuno.
- En abril de 2024, GE HealthCare finalizó la adquisición de MIM Software, proveedor de análisis de imágenes médicas y soluciones de IA en Asia-Pacífico. Esta estrategia refuerza la cartera de GE HealthCare, especialmente en oncología radioterápica, al integrar las herramientas avanzadas de MIM Software para el análisis de imágenes, la automatización del flujo de trabajo y la segmentación y el perfilado basados en IA en su estrategia de atención de precisión.
SKU-
Obtenga acceso en línea al informe sobre la primera nube de inteligencia de mercado del mundo
- Panel de análisis de datos interactivo
- Panel de análisis de empresas para oportunidades con alto potencial de crecimiento
- Acceso de analista de investigación para personalización y consultas
- Análisis de la competencia con panel interactivo
- Últimas noticias, actualizaciones y análisis de tendencias
- Aproveche el poder del análisis de referencia para un seguimiento integral de la competencia
Tabla de contenido
1 INTRODUCTION
1.1 OBJECTIVES OF THE STUDY
1.2 MARKET DEFINITION
1.3 OVERVIEW OF THE ASIA-PACIFIC RADIOTHERAPY MARKET
1.4 CURRENCY AND PRICING
1.5 LIMITATIONS
1.6 MARKETS COVERED
2 MARKET SEGMENTATION
2.1 MARKETS COVERED
2.2 GEOGRAPHICAL SCOPE
2.3 YEARS CONSIDERED FOR THE STUDY
2.4 DBMR TRIPOD DATA VALIDATION MODEL
2.5 PRIMARY INTERVIEWS WITH KEY OPINION LEADERS
2.6 MULTIVARIATE MODELLING
2.7 PRODUCT & SERVICES SEGMENT LIFELINE CURVE
2.8 MARKET END USER COVERAGE GRID
2.9 DBMR MARKET POSITION GRID
2.1 VENDOR SHARE ANALYSIS
2.11 SECONDARY SOURCES
2.12 ASSUMPTIONS
3 EXECUTIVE SUMMARY
4 PREMIUM INSIGHTS
4.1 PESTLE ANALYSIS
4.2 PORTER'S FIVE FORCES MODEL
4.3 PRICING ANALYSIS
5 REGULATORY GUIDELINES FOR RADIOTHERAPY
5.1 U.S REGULATORY GUIDELINES FOR RADIOTHERAPY
5.2 EUROPE REGULATORY GUIDELINE FOR RADIOTHERAPY
5.3 INDIA REGULATORY GUIDELINE FOR RADIOTHERAPY
5.4 CLEARANCE OF THE UNIT BY AERB (TYPE APPROVED OR NOC-ISSUED EQUIPMENT)
5.5 CHINA REGULATORY GUIDELINE FOR RADIOTHERAPY
5.6 ELEMENTS OF RADIATION PROTECTION PROGRAM -
6 MARKET OVERVIEW
6.1 DRIVERS
6.1.1 GROWING PREVALENCE OF CANCER DISEASE
6.1.2 NOVEL TECHNOLOGY IN RADIOTHERAPY FOR CANCER TREATMENT
6.1.3 INCREASING ADOPTION OF RADIOTHERAPY DEVICES AND PROCEDURES
6.1.4 RISING PREFERENCE FOR NON-SURGICAL PROCEDURES
6.2 RESTRAINTS
6.2.1 LACK OF SKILLED AND CERTIFIED PROFESSIONALS
6.2.2 HIGH COST OF TREATMENT AND RADIOTHERAPY PROCEDURE
6.3 OPPORTUNITIES
6.3.1 INCREASING HEALTHCARE EXPENDITURE FOR CANCER TREATMENT
6.3.2 GROWING GOVERNMENT INITIATIVES TOWARD CANCER TREATMENT
6.3.3 RISING PATIENTS AWARENESS TOWARDS CANCER TREATMENT
6.4 CHALLENGES
6.4.1 STRICT REGULATIONS AND STANDARDS FOR APPROVAL AND COMMERCIALIZATION OF RADIOTHERAPY PRODUCTS
6.4.2 RISK OF RADIATION EXPOSURE
7 ASIA-PACIFIC RADIOTHERAPY MARKET, BY PRODUCT & SERVICES
7.1 OVERVIEW
7.2 SERVICES
7.3 PRODUCT
7.4 SOFTWARE
8 ASIA-PACIFIC RADIOTHERAPY MARKET, BY TYPE
8.1 OVERVIEW
8.2 EXTERNAL-BEAM RADIATION THERAPY
8.3 INTERNAL RADIATION THERAPY
8.4 SYSTEMIC RADIOTHERAPY/ RADIOPHARMACEUTICALS
8.5 OTHERS
9 ASIA-PACIFIC RADIOTHERAPY MARKET, BY APPLICATION
9.1 OVERVIEW
9.2 BREAST CANCER
9.3 LUNG CANCER
9.4 PROSTATE CANCER
9.5 COLORECTAL CANCER
9.6 LYMPHOMA
9.7 LIVER CANCER
9.8 THYROID CANCER
9.9 BRAIN CANCER
9.1 CERVICAL CANCER
9.11 SPINE CANCER
9.12 OTHERS
10 ASIA-PACIFIC RADIOTHERAPY MARKET, BY END USER
10.1 OVERVIEW
10.2 HOSPITALS
10.3 RADIATION THERAPY CENTERS
10.4 SPECIALTY CLINICS
10.5 OTHERS
11 ASIA-PACIFIC RADIOTHERAPY MARKET, BY DISTRIBUTION CHANNEL
11.1 OVERVIEW
11.2 DIRECT TENDERS
11.3 THIRD PARTY DISTRIBUTORS
11.4 OTHERS
12 ASIA-PACIFIC RADIOTHERAPY MARKET, BY REGION
12.1 ASIA-PACIFIC
12.1.1 JAPAN
12.1.2 AUSTRALIA
12.1.3 INDIA
12.1.4 SOUTH KOREA
12.1.5 NEW ZEALAND
12.1.6 SINGAPORE
12.1.7 THAILAND
12.1.8 MALAYSIA
12.1.9 VIETNAM
12.1.10 TAIWAN
12.1.11 INDONESIA
12.1.12 PHILIPPINES
12.1.13 REST OF ASIA-PACIFIC
13 ASIA-PACIFIC RADIOTHERAPY MARKET: COMPANY LANDSCAPE
13.1 COMPANY SHARE ANALYSIS: ASIA-PACIFIC
14 SWOT ANALYSIS
15 ASIA-PACIFIC RADIOTHERAPY MARKET, COMPANY PROFILE
15.1 SIEMENS HEALTHCARE GMBH
15.1.1 COMPANY SNAPSHOT
15.1.2 REVENUE ANALYSIS
15.1.3 COMPANY SHARE ANALYSIS
15.1.4 PRODUCT PORTFOLIO
15.1.5 RECENT DEVELOPMENTS
15.2 HITACHI, LTD.
15.2.1 COMPANY SNAPSHOT
15.2.2 REVENUE ANALYSIS
15.2.3 COMPANY SHARE ANALYSIS
15.2.4 PRODUCT PORTFOLIO
15.2.5 RECENT DEVELOPMENTS
15.3 GENERAL ELECTRIC COMPANY
15.3.1 COMPANY SNAPSHOT
15.3.2 REVENUE ANALYSIS
15.3.3 COMPANY SHARE ANALYSIS
15.3.4 PRODUCT PORTFOLIO
15.3.5 RECENT DEVELOPMENTS
15.4 KONINKLIJKE PHILIPS N.V.
15.4.1 COMPANY SNAPSHOT
15.4.2 REVENUE ANALYSIS
15.4.3 COMPANY SHARE ANALYSIS
15.4.4 PRODUCT PORTFOLIO
15.4.5 RECENT DEVELOPMENTS
15.5 ELEKTA
15.5.1 COMPANY SNAPSHOT
15.5.2 REVENUE ANALYSIS
15.5.3 COMPANY SHARE ANALYSIS
15.5.4 PRODUCT PORTFOLIO
15.5.5 RECENT DEVELOPMENTS
15.6 ACCURACY INCORPORATED
15.6.1 COMPANY SNAPSHOT
15.6.2 REVENUE ANALYSIS
15.6.3 PRODUCT PORTFOLIO
15.6.4 RECENT DEVELOPMENTS
15.7 BEBIG MEDICAL.
15.7.1 COMPANY SNAPSHOT
15.7.2 PRODUCT PORTFOLIO
15.7.3 RECENT DEVELOPMENTS
15.8 BRAINLAB
15.8.1 COMPANY SNAPSHOT
15.8.2 PRODUCT PORTFOLIO
15.8.3 RECENT DEVELOPMENTS
15.9 CANON MEDICAL SYSTEMS CORPORATION
15.9.1 COMPANY SNAPSHOT
15.9.2 REVENUE ANALYSIS
15.9.3 PRODUCT PORTFOLIO
15.9.4 RECENT DEVELOPMENTS
15.1 ECKERT & ZIEGLER BEBIG
15.10.1 COMPANY SNAPSHOT
15.10.2 REVENUE ANALYSIS
15.10.3 PRODUCT PORTFOLIO
15.10.4 RECENT DEVELOPMENTS
15.11 IBA WORLDWIDE
15.11.1 COMPANY SNAPSHOT
15.11.2 REVENUE ANALYSIS
15.11.3 PRODUCT PORTFOLIO
15.11.4 RECENT DEVELOPMENTS
15.12 LINATECH INC
15.12.1 COMPANY SNAPSHOT
15.12.2 PRODUCT PORTFOLIO
15.12.3 RECENT DEVELOPMENT
15.13 MEVION MEDICAL SYSTEMS
15.13.1 COMPANY SNAPSHOT
15.13.2 PRODUCT PORTFOLIO
15.13.3 RECENT DEVELOPMENTS
15.14 NORDION (CANADA) INC. (A SUBSIDIARY OF SOTERA HEALTH)
15.14.1 COMPANY SNAPSHOT
15.14.2 PRODUCT PORTFOLIO
15.14.3 RECENT DEVELOPMENTS
15.15 P-CURE
15.15.1 COMPANY SNAPSHOT
15.15.2 PRODUCT PORTFOLIO
15.15.3 RECENT DEVELOPMENT
15.16 UNITED IMAGING HEALTHCARE CO., LTD
15.16.1 COMPANY SNAPSHOT
15.16.2 PRODUCT PORTFOLIO
15.16.3 RECENT DEVELOPMENT
15.17 VIEWRAY SYSTEMS, INC.
15.17.1 COMPANY SNAPSHOT
15.17.2 PRODUCT PORTFOLIO
15.17.3 RECENT DEVELOPMENT
15.18 ZEISS INTERNATIONAL
15.18.1 COMPANY SNAPSHOT
15.18.2 REVENUE ANALYSIS
15.18.3 COMPANY SHARE ANALYSIS
15.18.4 PRODUCT PORTFOLIO
15.18.5 RECENT DEVELOPMENTS
16 QUESTIONNAIRE
17 RELATED REPORTS
Lista de Tablas
TABLE 1 ASIA-PACIFIC RADIOTHERAPY MARKET: AVERAGE SELLING PRICE OF EQUIPMENT, SOFTWARE AND SERVICES
TABLE 2 ASIA-PACIFIC RADIOTHERAPY MARKET, BY PRODUCT & SERVICES, 2018-2032 (USD THOUSAND)
TABLE 3 ASIA-PACIFIC SERVICES IN RADIOTHERAPY MARKET, BY REGION, 2018-2032 (USD THOUSAND)
TABLE 4 ASIA-PACIFIC PRODUCT IN RADIOTHERAPY MARKET, BY REGION, 2018-2032 (USD THOUSAND)
TABLE 5 ASIA-PACIFIC PRODUCT IN RADIOTHERAPY MARKET, BY PRODUCT & SERVICES, 2018-2032 (USD THOUSAND)
TABLE 6 ASIA-PACIFIC EXTERNAL BEAM RADIOTHERAPY IN RADIOTHERAPY MARKET, BY PRODUCT & SERVICES, 2018-2032 (USD THOUSAND)
TABLE 7 ASIA-PACIFIC PROTON THERAPY IN RADIOTHERAPY MARKET, BY PRODUCT & SERVICES, 2018-2032 (USD THOUSAND)
TABLE 8 ASIA-PACIFIC INTERNAL RADIATION THERAPY IN RADIOTHERAPY MARKET, BY PRODUCT & SERVICES, 2018-2032 (USD THOUSAND)
TABLE 9 ASIA-PACIFIC SYSTEMIC RADIOTHERAPY/RADIOPHARMACEUTICALS IN RADIOTHERAPY MARKET, BY PRODUCT & SERVICES, 2018-2032 (USD THOUSAND)
TABLE 10 ASIA-PACIFIC SOFTWARE IN RADIOTHERAPY MARKET, BY REGION, 2018-2032 (USD THOUSAND)
TABLE 11 ASIA-PACIFIC SOFTWARE IN RADIOTHERAPY MARKET, BY PRODUCT & SERVICES, 2018-2032 (USD THOUSAND)
TABLE 12 ASIA-PACIFIC RADIOTHERAPY MARKET, BY TYPE, 2018-2032 (USD THOUSAND)
TABLE 13 ASIA-PACIFIC EXTERNAL-BEAM RADIATION THERAPY IN RADIOTHERAPY MARKET, BY REGION, 2018-2032 (USD THOUSAND)
TABLE 14 ASIA-PACIFIC EXTERNAL-BEAM RADIATION THERAPY IN RADIOTHERAPY MARKET, BY TYPE, 2018-2032 (USD THOUSAND)
TABLE 15 ASIA-PACIFIC INTERNAL RADIATION THERAPY IN RADIOTHERAPY MARKET, BY REGION, 2018-2032 (USD THOUSAND)
TABLE 16 ASIA-PACIFIC INTERNAL RADIATION THERAPY IN RADIOTHERAPY MARKET, BY TYPE, 2018-2032 (USD THOUSAND)
TABLE 17 ASIA-PACIFIC SYSTEMIC RADIOTHERAPY/ RADIOPHARMACEUTICALS IN RADIOTHERAPY MARKET, BY REGION, 2018-2032 (USD THOUSAND)
TABLE 18 ASIA-PACIFIC OTHERS IN RADIOTHERAPY MARKET, BY REGION, 2018-2032 (USD THOUSAND)
TABLE 19 ASIA-PACIFIC RADIOTHERAPY MARKET, BY APPLICATION, 2018-2032 (USD THOUSAND)
TABLE 20 ASIA-PACIFIC BREAST CANCER IN RADIOTHERAPY MARKET, BY REGION, 2018-2032 (USD THOUSAND)
TABLE 21 ASIA-PACIFIC LUNG CANCER IN RADIOTHERAPY MARKET, BY REGION, 2018-2032 (USD THOUSAND)
TABLE 22 ASIA-PACIFIC PROSTATE CANCER IN RADIOTHERAPY MARKET, BY REGION, 2018-2032 (USD THOUSAND)
TABLE 23 ASIA-PACIFIC COLORECTAL CANCER IN RADIOTHERAPY MARKET, BY REGION, 2018-2032 (USD THOUSAND)
TABLE 24 ASIA-PACIFIC LYMPHOMA IN RADIOTHERAPY MARKET, BY REGION, 2018-2032 (USD THOUSAND)
TABLE 25 ASIA-PACIFIC LIVER CANCER IN RADIOTHERAPY MARKET, BY REGION, 2018-2032 (USD THOUSAND)
TABLE 26 ASIA-PACIFIC THYROID CANCER IN RADIOTHERAPY MARKET, BY REGION, 2018-2032 (USD THOUSAND)
TABLE 27 ASIA-PACIFIC BRAIN CANCER IN RADIOTHERAPY MARKET, BY REGION, 2018-2032 (USD THOUSAND)
TABLE 28 ASIA-PACIFIC CERVICAL CANCER IN RADIOTHERAPY MARKET, BY REGION, 2018-2032 (USD THOUSAND)
TABLE 29 ASIA-PACIFIC SPINE CANCER IN RADIOTHERAPY MARKET, BY REGION, 2018-2032 (USD THOUSAND)
TABLE 30 ASIA-PACIFIC OTHERS IN RADIOTHERAPY MARKET, BY REGION, 2018-2032 (USD THOUSAND)
TABLE 31 ASIA-PACIFIC RADIOTHERAPY MARKET, BY END USER, 2018-2032 (USD THOUSAND)
TABLE 32 ASIA-PACIFIC HOSPITALS IN RADIOTHERAPY MARKET, BY REGION, 2018-2032 (USD THOUSAND)
TABLE 33 ASIA-PACIFIC RADIATION THERAPY CENTERS IN RADIOTHERAPY MARKET, BY REGION, 2018-2032 (USD THOUSAND)
TABLE 34 ASIA-PACIFIC SPECIALTY CLINICS IN RADIOTHERAPY MARKET, BY REGION, 2018-2032 (USD THOUSAND)
TABLE 35 ASIA-PACIFIC OTHERS IN RADIOTHERAPY MARKET, BY REGION, 2018-2032 (USD THOUSAND)
TABLE 36 ASIA-PACIFIC RADIOTHERAPY MARKET, BY DISTRIBUTION CHANNEL, 2018-2032 (USD THOUSAND)
TABLE 37 ASIA-PACIFIC DIRECT TENDERS IN RADIOTHERAPY MARKET, BY REGION, 2018-2032 (USD THOUSAND)
TABLE 38 ASIA-PACIFIC THIRD PARTY DISTRIBUTORS IN RADIOTHERAPY MARKET, BY REGION, 2018-2032 (USD THOUSAND)
TABLE 39 ASIA-PACIFIC OTHERS IN RADIOTHERAPY MARKET, BY REGION, 2018-2032 (USD THOUSAND)
TABLE 40 ASIA-PACIFIC RADIOTHERAPY MARKET, BY COUNTRY, 2018-2032 (USD THOUSAND)
TABLE 41 ASIA-PACIFIC RADIOTHERAPY MARKET, BY PRODUCT & SERVICES, 2018-2032 (USD THOUSAND)
TABLE 42 ASIA-PACIFIC PRODUCT IN RADIOTHERAPY MARKET, BY PRODUCT & SERVICES, 2018-2032 (USD THOUSAND)
TABLE 43 ASIA-PACIFIC EXTERNAL BEAM RADIOTHERAPY IN RADIOTHERAPY MARKET, BY PRODUCT & SERVICES, 2018-2032 (USD THOUSAND)
TABLE 44 ASIA-PACIFIC PROTON THERAPY IN RADIOTHERAPY MARKET, BY PRODUCT & SERVICES, 2018-2032 (USD THOUSAND)
TABLE 45 ASIA-PACIFIC INTERNAL RADIATION THERAPY IN RADIOTHERAPY MARKET, BY PRODUCT & SERVICES, 2018-2032 (USD THOUSAND)
TABLE 46 ASIA-PACIFIC SYSTEMIC RADIOTHERAPY/RADIOPHARMACEUTICALS IN RADIOTHERAPY MARKET, BY PRODUCT & SERVICES, 2018-2032 (USD THOUSAND)
TABLE 47 ASIA-PACIFIC SOFTWARE IN RADIOTHERAPY MARKET, BY PRODUCT & SERVICES, 2018-2032 (USD THOUSAND)
TABLE 48 ASIA-PACIFIC RADIOTHERAPY MARKET, BY TYPE, 2018-2032 (USD THOUSAND)
TABLE 49 ASIA-PACIFIC EXTERNAL-BEAM RADIATION THERAPY IN RADIOTHERAPY MARKET, BY TYPE, 2018-2032 (USD THOUSAND)
TABLE 50 ASIA-PACIFIC INTERNAL RADIATION THERAPY IN RADIOTHERAPY MARKET, BY TYPE, 2018-2032 (USD THOUSAND)
TABLE 51 ASIA-PACIFIC RADIOTHERAPY MARKET, BY APPLICATION, 2018-2032 (USD THOUSAND)
TABLE 52 ASIA-PACIFIC RADIOTHERAPY MARKET, BY END USER, 2018-2032 (USD THOUSAND)
TABLE 53 ASIA-PACIFIC RADIOTHERAPY MARKET, BY DISTRIBUTION CHANNEL, 2018-2032 (USD THOUSAND)
TABLE 54 JAPAN RADIOTHERAPY MARKET, BY PRODUCT & SERVICES, 2018-2032 (USD THOUSAND)
TABLE 55 JAPAN PRODUCT IN RADIOTHERAPY MARKET, BY PRODUCT & SERVICES, 2018-2032 (USD THOUSAND)
TABLE 56 JAPAN EXTERNAL BEAM RADIOTHERAPY IN RADIOTHERAPY MARKET, BY PRODUCT & SERVICES, 2018-2032 (USD THOUSAND)
TABLE 57 JAPAN PROTON THERAPY IN RADIOTHERAPY MARKET, BY PRODUCT & SERVICES, 2018-2032 (USD THOUSAND)
TABLE 58 JAPAN INTERNAL RADIATION THERAPY IN RADIOTHERAPY MARKET, BY PRODUCT & SERVICES, 2018-2032 (USD THOUSAND)
TABLE 59 JAPAN SYSTEMIC RADIOTHERAPY/RADIOPHARMACEUTICALS IN RADIOTHERAPY MARKET, BY PRODUCT & SERVICES, 2018-2032 (USD THOUSAND)
TABLE 60 JAPAN SOFTWARE IN RADIOTHERAPY MARKET, BY PRODUCT & SERVICES, 2018-2032 (USD THOUSAND)
TABLE 61 JAPAN RADIOTHERAPY MARKET, BY TYPE, 2018-2032 (USD THOUSAND)
TABLE 62 JAPAN EXTERNAL-BEAM RADIATION THERAPY IN RADIOTHERAPY MARKET, BY TYPE, 2018-2032 (USD THOUSAND)
TABLE 63 JAPAN INTERNAL RADIATION THERAPY IN RADIOTHERAPY MARKET, BY TYPE, 2018-2032 (USD THOUSAND)
TABLE 64 JAPAN RADIOTHERAPY MARKET, BY APPLICATION, 2018-2032 (USD THOUSAND)
TABLE 65 JAPAN RADIOTHERAPY MARKET, BY END USER, 2018-2032 (USD THOUSAND)
TABLE 66 JAPAN RADIOTHERAPY MARKET, BY DISTRIBUTION CHANNEL, 2018-2032 (USD THOUSAND)
TABLE 67 AUSTRALIA RADIOTHERAPY MARKET, BY PRODUCT & SERVICES, 2018-2032 (USD THOUSAND)
TABLE 68 AUSTRALIA PRODUCT IN RADIOTHERAPY MARKET, BY PRODUCT & SERVICES, 2018-2032 (USD THOUSAND)
TABLE 69 AUSTRALIA EXTERNAL BEAM RADIOTHERAPY IN RADIOTHERAPY MARKET, BY PRODUCT & SERVICES, 2018-2032 (USD THOUSAND)
TABLE 70 AUSTRALIA PROTON THERAPY IN RADIOTHERAPY MARKET, BY PRODUCT & SERVICES, 2018-2032 (USD THOUSAND)
TABLE 71 AUSTRALIA INTERNAL RADIATION THERAPY IN RADIOTHERAPY MARKET, BY PRODUCT & SERVICES, 2018-2032 (USD THOUSAND)
TABLE 72 AUSTRALIA SYSTEMIC RADIOTHERAPY/RADIOPHARMACEUTICALS IN RADIOTHERAPY MARKET, BY PRODUCT & SERVICES, 2018-2032 (USD THOUSAND)
TABLE 73 AUSTRALIA SOFTWARE IN RADIOTHERAPY MARKET, BY PRODUCT & SERVICES, 2018-2032 (USD THOUSAND)
TABLE 74 AUSTRALIA RADIOTHERAPY MARKET, BY TYPE, 2018-2032 (USD THOUSAND)
TABLE 75 AUSTRALIA EXTERNAL-BEAM RADIATION THERAPY IN RADIOTHERAPY MARKET, BY TYPE, 2018-2032 (USD THOUSAND)
TABLE 76 AUSTRALIA INTERNAL RADIATION THERAPY IN RADIOTHERAPY MARKET, BY TYPE, 2018-2032 (USD THOUSAND)
TABLE 77 AUSTRALIA RADIOTHERAPY MARKET, BY APPLICATION, 2018-2032 (USD THOUSAND)
TABLE 78 AUSTRALIA RADIOTHERAPY MARKET, BY END USER, 2018-2032 (USD THOUSAND)
TABLE 79 AUSTRALIA RADIOTHERAPY MARKET, BY DISTRIBUTION CHANNEL, 2018-2032 (USD THOUSAND)
TABLE 80 INDIA RADIOTHERAPY MARKET, BY PRODUCT & SERVICES, 2018-2032 (USD THOUSAND)
TABLE 81 INDIA PRODUCT IN RADIOTHERAPY MARKET, BY PRODUCT & SERVICES, 2018-2032 (USD THOUSAND)
TABLE 82 INDIA EXTERNAL BEAM RADIOTHERAPY IN RADIOTHERAPY MARKET, BY PRODUCT & SERVICES, 2018-2032 (USD THOUSAND)
TABLE 83 INDIA PROTON THERAPY IN RADIOTHERAPY MARKET, BY PRODUCT & SERVICES, 2018-2032 (USD THOUSAND)
TABLE 84 INDIA INTERNAL RADIATION THERAPY IN RADIOTHERAPY MARKET, BY PRODUCT & SERVICES, 2018-2032 (USD THOUSAND)
TABLE 85 INDIA SYSTEMIC RADIOTHERAPY/RADIOPHARMACEUTICALS IN RADIOTHERAPY MARKET, BY PRODUCT & SERVICES, 2018-2032 (USD THOUSAND)
TABLE 86 INDIA SOFTWARE IN RADIOTHERAPY MARKET, BY PRODUCT & SERVICES, 2018-2032 (USD THOUSAND)
TABLE 87 INDIA RADIOTHERAPY MARKET, BY TYPE, 2018-2032 (USD THOUSAND)
TABLE 88 INDIA EXTERNAL-BEAM RADIATION THERAPY IN RADIOTHERAPY MARKET, BY TYPE, 2018-2032 (USD THOUSAND)
TABLE 89 INDIA INTERNAL RADIATION THERAPY IN RADIOTHERAPY MARKET, BY TYPE, 2018-2032 (USD THOUSAND)
TABLE 90 INDIA RADIOTHERAPY MARKET, BY APPLICATION, 2018-2032 (USD THOUSAND)
TABLE 91 INDIA RADIOTHERAPY MARKET, BY END USER, 2018-2032 (USD THOUSAND)
TABLE 92 INDIA RADIOTHERAPY MARKET, BY DISTRIBUTION CHANNEL, 2018-2032 (USD THOUSAND)
TABLE 93 SOUTH KOREA RADIOTHERAPY MARKET, BY PRODUCT & SERVICES, 2018-2032 (USD THOUSAND)
TABLE 94 SOUTH KOREA PRODUCT IN RADIOTHERAPY MARKET, BY PRODUCT & SERVICES, 2018-2032 (USD THOUSAND)
TABLE 95 SOUTH KOREA EXTERNAL BEAM RADIOTHERAPY IN RADIOTHERAPY MARKET, BY PRODUCT & SERVICES, 2018-2032 (USD THOUSAND)
TABLE 96 SOUTH KOREA PROTON THERAPY IN RADIOTHERAPY MARKET, BY PRODUCT & SERVICES, 2018-2032 (USD THOUSAND)
TABLE 97 SOUTH KOREA INTERNAL RADIATION THERAPY IN RADIOTHERAPY MARKET, BY PRODUCT & SERVICES, 2018-2032 (USD THOUSAND)
TABLE 98 SOUTH KOREA SYSTEMIC RADIOTHERAPY/RADIOPHARMACEUTICALS IN RADIOTHERAPY MARKET, BY PRODUCT & SERVICES, 2018-2032 (USD THOUSAND)
TABLE 99 SOUTH KOREA SOFTWARE IN RADIOTHERAPY MARKET, BY PRODUCT & SERVICES, 2018-2032 (USD THOUSAND)
TABLE 100 SOUTH KOREA RADIOTHERAPY MARKET, BY TYPE, 2018-2032 (USD THOUSAND)
TABLE 101 SOUTH KOREA EXTERNAL-BEAM RADIATION THERAPY IN RADIOTHERAPY MARKET, BY TYPE, 2018-2032 (USD THOUSAND)
TABLE 102 SOUTH KOREA INTERNAL RADIATION THERAPY IN RADIOTHERAPY MARKET, BY TYPE, 2018-2032 (USD THOUSAND)
TABLE 103 SOUTH KOREA RADIOTHERAPY MARKET, BY APPLICATION, 2018-2032 (USD THOUSAND)
TABLE 104 SOUTH KOREA RADIOTHERAPY MARKET, BY END USER, 2018-2032 (USD THOUSAND)
TABLE 105 SOUTH KOREA RADIOTHERAPY MARKET, BY DISTRIBUTION CHANNEL, 2018-2032 (USD THOUSAND)
TABLE 106 NEW ZEALAND RADIOTHERAPY MARKET, BY PRODUCT & SERVICES, 2018-2032 (USD THOUSAND)
TABLE 107 NEW ZEALAND PRODUCT IN RADIOTHERAPY MARKET, BY PRODUCT & SERVICES, 2018-2032 (USD THOUSAND)
TABLE 108 NEW ZEALAND EXTERNAL BEAM RADIOTHERAPY IN RADIOTHERAPY MARKET, BY PRODUCT & SERVICES, 2018-2032 (USD THOUSAND)
TABLE 109 NEW ZEALAND PROTON THERAPY IN RADIOTHERAPY MARKET, BY PRODUCT & SERVICES, 2018-2032 (USD THOUSAND)
TABLE 110 NEW ZEALAND INTERNAL RADIATION THERAPY IN RADIOTHERAPY MARKET, BY PRODUCT & SERVICES, 2018-2032 (USD THOUSAND)
TABLE 111 NEW ZEALAND SYSTEMIC RADIOTHERAPY/RADIOPHARMACEUTICALS IN RADIOTHERAPY MARKET, BY PRODUCT & SERVICES, 2018-2032 (USD THOUSAND)
TABLE 112 NEW ZEALAND SOFTWARE IN RADIOTHERAPY MARKET, BY PRODUCT & SERVICES, 2018-2032 (USD THOUSAND)
TABLE 113 NEW ZEALAND RADIOTHERAPY MARKET, BY TYPE, 2018-2032 (USD THOUSAND)
TABLE 114 NEW ZEALAND EXTERNAL-BEAM RADIATION THERAPY IN RADIOTHERAPY MARKET, BY TYPE, 2018-2032 (USD THOUSAND)
TABLE 115 NEW ZEALAND INTERNAL RADIATION THERAPY IN RADIOTHERAPY MARKET, BY TYPE, 2018-2032 (USD THOUSAND)
TABLE 116 NEW ZEALAND RADIOTHERAPY MARKET, BY APPLICATION, 2018-2032 (USD THOUSAND)
TABLE 117 NEW ZEALAND RADIOTHERAPY MARKET, BY END USER, 2018-2032 (USD THOUSAND)
TABLE 118 NEW ZEALAND RADIOTHERAPY MARKET, BY DISTRIBUTION CHANNEL, 2018-2032 (USD THOUSAND)
TABLE 119 SINGAPORE RADIOTHERAPY MARKET, BY PRODUCT & SERVICES, 2018-2032 (USD THOUSAND)
TABLE 120 SINGAPORE PRODUCT IN RADIOTHERAPY MARKET, BY PRODUCT & SERVICES, 2018-2032 (USD THOUSAND)
TABLE 121 SINGAPORE EXTERNAL BEAM RADIOTHERAPY IN RADIOTHERAPY MARKET, BY PRODUCT & SERVICES, 2018-2032 (USD THOUSAND)
TABLE 122 SINGAPORE PROTON THERAPY IN RADIOTHERAPY MARKET, BY PRODUCT & SERVICES, 2018-2032 (USD THOUSAND)
TABLE 123 SINGAPORE INTERNAL RADIATION THERAPY IN RADIOTHERAPY MARKET, BY PRODUCT & SERVICES, 2018-2032 (USD THOUSAND)
TABLE 124 SINGAPORE SYSTEMIC RADIOTHERAPY/RADIOPHARMACEUTICALS IN RADIOTHERAPY MARKET, BY PRODUCT & SERVICES, 2018-2032 (USD THOUSAND)
TABLE 125 SINGAPORE SOFTWARE IN RADIOTHERAPY MARKET, BY PRODUCT & SERVICES, 2018-2032 (USD THOUSAND)
TABLE 126 SINGAPORE RADIOTHERAPY MARKET, BY TYPE, 2018-2032 (USD THOUSAND)
TABLE 127 SINGAPORE EXTERNAL-BEAM RADIATION THERAPY IN RADIOTHERAPY MARKET, BY TYPE, 2018-2032 (USD THOUSAND)
TABLE 128 SINGAPORE INTERNAL RADIATION THERAPY IN RADIOTHERAPY MARKET, BY TYPE, 2018-2032 (USD THOUSAND)
TABLE 129 SINGAPORE RADIOTHERAPY MARKET, BY APPLICATION, 2018-2032 (USD THOUSAND)
TABLE 130 SINGAPORE RADIOTHERAPY MARKET, BY END USER, 2018-2032 (USD THOUSAND)
TABLE 131 SINGAPORE RADIOTHERAPY MARKET, BY DISTRIBUTION CHANNEL, 2018-2032 (USD THOUSAND)
TABLE 132 THAILAND RADIOTHERAPY MARKET, BY PRODUCT & SERVICES, 2018-2032 (USD THOUSAND)
TABLE 133 THAILAND PRODUCT IN RADIOTHERAPY MARKET, BY PRODUCT & SERVICES, 2018-2032 (USD THOUSAND)
TABLE 134 THAILAND EXTERNAL BEAM RADIOTHERAPY IN RADIOTHERAPY MARKET, BY PRODUCT & SERVICES, 2018-2032 (USD THOUSAND)
TABLE 135 THAILAND PROTON THERAPY IN RADIOTHERAPY MARKET, BY PRODUCT & SERVICES, 2018-2032 (USD THOUSAND)
TABLE 136 THAILAND INTERNAL RADIATION THERAPY IN RADIOTHERAPY MARKET, BY PRODUCT & SERVICES, 2018-2032 (USD THOUSAND)
TABLE 137 THAILAND SYSTEMIC RADIOTHERAPY/RADIOPHARMACEUTICALS IN RADIOTHERAPY MARKET, BY PRODUCT & SERVICES, 2018-2032 (USD THOUSAND)
TABLE 138 THAILAND SOFTWARE IN RADIOTHERAPY MARKET, BY PRODUCT & SERVICES, 2018-2032 (USD THOUSAND)
TABLE 139 THAILAND RADIOTHERAPY MARKET, BY TYPE, 2018-2032 (USD THOUSAND)
TABLE 140 THAILAND EXTERNAL-BEAM RADIATION THERAPY IN RADIOTHERAPY MARKET, BY TYPE, 2018-2032 (USD THOUSAND)
TABLE 141 THAILAND INTERNAL RADIATION THERAPY IN RADIOTHERAPY MARKET, BY TYPE, 2018-2032 (USD THOUSAND)
TABLE 142 THAILAND RADIOTHERAPY MARKET, BY APPLICATION, 2018-2032 (USD THOUSAND)
TABLE 143 THAILAND RADIOTHERAPY MARKET, BY END USER, 2018-2032 (USD THOUSAND)
TABLE 144 THAILAND RADIOTHERAPY MARKET, BY DISTRIBUTION CHANNEL, 2018-2032 (USD THOUSAND)
TABLE 145 MALAYSIA RADIOTHERAPY MARKET, BY PRODUCT & SERVICES, 2018-2032 (USD THOUSAND)
TABLE 146 MALAYSIA PRODUCT IN RADIOTHERAPY MARKET, BY PRODUCT & SERVICES, 2018-2032 (USD THOUSAND)
TABLE 147 MALAYSIA EXTERNAL BEAM RADIOTHERAPY IN RADIOTHERAPY MARKET, BY PRODUCT & SERVICES, 2018-2032 (USD THOUSAND)
TABLE 148 MALAYSIA PROTON THERAPY IN RADIOTHERAPY MARKET, BY PRODUCT & SERVICES, 2018-2032 (USD THOUSAND)
TABLE 149 MALAYSIA INTERNAL RADIATION THERAPY IN RADIOTHERAPY MARKET, BY PRODUCT & SERVICES, 2018-2032 (USD THOUSAND)
TABLE 150 MALAYSIA SYSTEMIC RADIOTHERAPY/RADIOPHARMACEUTICALS IN RADIOTHERAPY MARKET, BY PRODUCT & SERVICES, 2018-2032 (USD THOUSAND)
TABLE 151 MALAYSIA SOFTWARE IN RADIOTHERAPY MARKET, BY PRODUCT & SERVICES, 2018-2032 (USD THOUSAND)
TABLE 152 MALAYSIA RADIOTHERAPY MARKET, BY TYPE, 2018-2032 (USD THOUSAND)
TABLE 153 MALAYSIA EXTERNAL-BEAM RADIATION THERAPY IN RADIOTHERAPY MARKET, BY TYPE, 2018-2032 (USD THOUSAND)
TABLE 154 MALAYSIA INTERNAL RADIATION THERAPY IN RADIOTHERAPY MARKET, BY TYPE, 2018-2032 (USD THOUSAND)
TABLE 155 MALAYSIA RADIOTHERAPY MARKET, BY APPLICATION, 2018-2032 (USD THOUSAND)
TABLE 156 MALAYSIA RADIOTHERAPY MARKET, BY END USER, 2018-2032 (USD THOUSAND)
TABLE 157 MALAYSIA RADIOTHERAPY MARKET, BY DISTRIBUTION CHANNEL, 2018-2032 (USD THOUSAND)
TABLE 158 VIETNAM RADIOTHERAPY MARKET, BY PRODUCT & SERVICES, 2018-2032 (USD THOUSAND)
TABLE 159 VIETNAM PRODUCT IN RADIOTHERAPY MARKET, BY PRODUCT & SERVICES, 2018-2032 (USD THOUSAND)
TABLE 160 VIETNAM EXTERNAL BEAM RADIOTHERAPY IN RADIOTHERAPY MARKET, BY PRODUCT & SERVICES, 2018-2032 (USD THOUSAND)
TABLE 161 VIETNAM PROTON THERAPY IN RADIOTHERAPY MARKET, BY PRODUCT & SERVICES, 2018-2032 (USD THOUSAND)
TABLE 162 VIETNAM INTERNAL RADIATION THERAPY IN RADIOTHERAPY MARKET, BY PRODUCT & SERVICES, 2018-2032 (USD THOUSAND)
TABLE 163 VIETNAM SYSTEMIC RADIOTHERAPY/RADIOPHARMACEUTICALS IN RADIOTHERAPY MARKET, BY PRODUCT & SERVICES, 2018-2032 (USD THOUSAND)
TABLE 164 VIETNAM SOFTWARE IN RADIOTHERAPY MARKET, BY PRODUCT & SERVICES, 2018-2032 (USD THOUSAND)
TABLE 165 VIETNAM RADIOTHERAPY MARKET, BY TYPE, 2018-2032 (USD THOUSAND)
TABLE 166 VIETNAM EXTERNAL-BEAM RADIATION THERAPY IN RADIOTHERAPY MARKET, BY TYPE, 2018-2032 (USD THOUSAND)
TABLE 167 VIETNAM INTERNAL RADIATION THERAPY IN RADIOTHERAPY MARKET, BY TYPE, 2018-2032 (USD THOUSAND)
TABLE 168 VIETNAM RADIOTHERAPY MARKET, BY APPLICATION, 2018-2032 (USD THOUSAND)
TABLE 169 VIETNAM RADIOTHERAPY MARKET, BY END USER, 2018-2032 (USD THOUSAND)
TABLE 170 VIETNAM RADIOTHERAPY MARKET, BY DISTRIBUTION CHANNEL, 2018-2032 (USD THOUSAND)
TABLE 171 TAIWAN RADIOTHERAPY MARKET, BY PRODUCT & SERVICES, 2018-2032 (USD THOUSAND)
TABLE 172 TAIWAN PRODUCT IN RADIOTHERAPY MARKET, BY PRODUCT & SERVICES, 2018-2032 (USD THOUSAND)
TABLE 173 TAIWAN EXTERNAL BEAM RADIOTHERAPY IN RADIOTHERAPY MARKET, BY PRODUCT & SERVICES, 2018-2032 (USD THOUSAND)
TABLE 174 TAIWAN PROTON THERAPY IN RADIOTHERAPY MARKET, BY PRODUCT & SERVICES, 2018-2032 (USD THOUSAND)
TABLE 175 TAIWAN INTERNAL RADIATION THERAPY IN RADIOTHERAPY MARKET, BY PRODUCT & SERVICES, 2018-2032 (USD THOUSAND)
TABLE 176 TAIWAN SYSTEMIC RADIOTHERAPY/RADIOPHARMACEUTICALS IN RADIOTHERAPY MARKET, BY PRODUCT & SERVICES, 2018-2032 (USD THOUSAND)
TABLE 177 TAIWAN SOFTWARE IN RADIOTHERAPY MARKET, BY PRODUCT & SERVICES, 2018-2032 (USD THOUSAND)
TABLE 178 TAIWAN RADIOTHERAPY MARKET, BY TYPE, 2018-2032 (USD THOUSAND)
TABLE 179 TAIWAN EXTERNAL-BEAM RADIATION THERAPY IN RADIOTHERAPY MARKET, BY TYPE, 2018-2032 (USD THOUSAND)
TABLE 180 TAIWAN INTERNAL RADIATION THERAPY IN RADIOTHERAPY MARKET, BY TYPE, 2018-2032 (USD THOUSAND)
TABLE 181 TAIWAN RADIOTHERAPY MARKET, BY APPLICATION, 2018-2032 (USD THOUSAND)
TABLE 182 TAIWAN RADIOTHERAPY MARKET, BY END USER, 2018-2032 (USD THOUSAND)
TABLE 183 TAIWAN RADIOTHERAPY MARKET, BY DISTRIBUTION CHANNEL, 2018-2032 (USD THOUSAND)
TABLE 184 INDONESIA RADIOTHERAPY MARKET, BY PRODUCT & SERVICES, 2018-2032 (USD THOUSAND)
TABLE 185 INDONESIA PRODUCT IN RADIOTHERAPY MARKET, BY PRODUCT & SERVICES, 2018-2032 (USD THOUSAND)
TABLE 186 INDONESIA EXTERNAL BEAM RADIOTHERAPY IN RADIOTHERAPY MARKET, BY PRODUCT & SERVICES, 2018-2032 (USD THOUSAND)
TABLE 187 INDONESIA PROTON THERAPY IN RADIOTHERAPY MARKET, BY PRODUCT & SERVICES, 2018-2032 (USD THOUSAND)
TABLE 188 INDONESIA INTERNAL RADIATION THERAPY IN RADIOTHERAPY MARKET, BY PRODUCT & SERVICES, 2018-2032 (USD THOUSAND)
TABLE 189 INDONESIA SYSTEMIC RADIOTHERAPY/RADIOPHARMACEUTICALS IN RADIOTHERAPY MARKET, BY PRODUCT & SERVICES, 2018-2032 (USD THOUSAND)
TABLE 190 INDONESIA SOFTWARE IN RADIOTHERAPY MARKET, BY PRODUCT & SERVICES, 2018-2032 (USD THOUSAND)
TABLE 191 INDONESIA RADIOTHERAPY MARKET, BY TYPE, 2018-2032 (USD THOUSAND)
TABLE 192 INDONESIA EXTERNAL-BEAM RADIATION THERAPY IN RADIOTHERAPY MARKET, BY TYPE, 2018-2032 (USD THOUSAND)
TABLE 193 INDONESIA INTERNAL RADIATION THERAPY IN RADIOTHERAPY MARKET, BY TYPE, 2018-2032 (USD THOUSAND)
TABLE 194 INDONESIA RADIOTHERAPY MARKET, BY APPLICATION, 2018-2032 (USD THOUSAND)
TABLE 195 INDONESIA RADIOTHERAPY MARKET, BY END USER, 2018-2032 (USD THOUSAND)
TABLE 196 INDONESIA RADIOTHERAPY MARKET, BY DISTRIBUTION CHANNEL, 2018-2032 (USD THOUSAND)
TABLE 197 PHILIPPINES RADIOTHERAPY MARKET, BY PRODUCT & SERVICES, 2018-2032 (USD THOUSAND)
TABLE 198 PHILIPPINES PRODUCT IN RADIOTHERAPY MARKET, BY PRODUCT & SERVICES, 2018-2032 (USD THOUSAND)
TABLE 199 PHILIPPINES EXTERNAL BEAM RADIOTHERAPY IN RADIOTHERAPY MARKET, BY PRODUCT & SERVICES, 2018-2032 (USD THOUSAND)
TABLE 200 PHILIPPINES PROTON THERAPY IN RADIOTHERAPY MARKET, BY PRODUCT & SERVICES, 2018-2032 (USD THOUSAND)
TABLE 201 PHILIPPINES INTERNAL RADIATION THERAPY IN RADIOTHERAPY MARKET, BY PRODUCT & SERVICES, 2018-2032 (USD THOUSAND)
TABLE 202 PHILIPPINES SYSTEMIC RADIOTHERAPY/RADIOPHARMACEUTICALS IN RADIOTHERAPY MARKET, BY PRODUCT & SERVICES, 2018-2032 (USD THOUSAND)
TABLE 203 PHILIPPINES SOFTWARE IN RADIOTHERAPY MARKET, BY PRODUCT & SERVICES, 2018-2032 (USD THOUSAND)
TABLE 204 PHILIPPINES RADIOTHERAPY MARKET, BY TYPE, 2018-2032 (USD THOUSAND)
TABLE 205 PHILIPPINES EXTERNAL-BEAM RADIATION THERAPY IN RADIOTHERAPY MARKET, BY TYPE, 2018-2032 (USD THOUSAND)
TABLE 206 PHILIPPINES INTERNAL RADIATION THERAPY IN RADIOTHERAPY MARKET, BY TYPE, 2018-2032 (USD THOUSAND)
TABLE 207 PHILIPPINES RADIOTHERAPY MARKET, BY APPLICATION, 2018-2032 (USD THOUSAND)
TABLE 208 PHILIPPINES RADIOTHERAPY MARKET, BY END USER, 2018-2032 (USD THOUSAND)
TABLE 209 PHILIPPINES RADIOTHERAPY MARKET, BY DISTRIBUTION CHANNEL, 2018-2032 (USD THOUSAND)
TABLE 210 REST OF ASIA-PACIFIC RADIOTHERAPY MARKET, BY PRODUCT & SERVICES, 2018-2032 (USD THOUSAND)
Lista de figuras
FIGURE 1 ASIA-PACIFIC RADIOTHERAPY MARKET: SEGMENTATION
FIGURE 2 ASIA-PACIFIC RADIOTHERAPY MARKET: DATA TRIANGULATION
FIGURE 3 ASIA-PACIFIC RADIOTHERAPY MARKET: DROC ANALYSIS
FIGURE 4 ASIA-PACIFIC RADIOTHERAPY MARKET: ASIA-PACIFIC VS REGIONAL MARKET ANALYSIS
FIGURE 5 ASIA-PACIFIC RADIOTHERAPY MARKET: COMPANY RESEARCH ANALYSIS
FIGURE 6 ASIA-PACIFIC RADIOTHERAPY MARKET: INTERVIEW DEMOGRAPHICS
FIGURE 7 ASIA-PACIFIC RADIOTHERAPY MARKET: MULTIVARIATE MODELLING
FIGURE 8 ASIA-PACIFIC RADIOTHERAPY MARKET: PRODUCT & SERVICES LIFELINE CURVE
FIGURE 9 ASIA-PACIFIC RADIOTHERAPY MARKET: MARKET END USER COVERAGE GRID
FIGURE 10 ASIA-PACIFIC RADIOTHERAPY MARKET: DBMR MARKET POSITION GRID
FIGURE 11 ASIA-PACIFIC RADIOTHERAPY MARKET: VENDOR SHARE ANALYSIS
FIGURE 12 ASIA-PACIFIC RADIOTHERAPY MARKET: SEGMENTATION
FIGURE 13 ASIA-PACIFIC RADIOTHERAPY MARKET: EXECUTIVE SUMMARY
FIGURE 14 ASIA-PACIFIC RADIOTHERAPY MARKET: STRATEGIC DECISIONS
FIGURE 15 NOVEL TECHNOLOGY IN RADIOTHERAPY FOR CANCER TREATMENT IS EXPECTED TO DRIVE THE GROWTH OF THE ASIA-PACIFIC RADIOTHERAPY MARKET FROM 2025 TO 2032
FIGURE 16 THE SERVICES SEGMENT IS EXPECTED TO ACCOUNT FOR THE LARGEST SHARE OF THE ASIA-PACIFIC RADIOTHERAPY MARKET IN 2025 & 2032
FIGURE 17 DRIVERS, RESTRAINTS, OPPORTUNITIES AND CHALLENGES OF ASIA-PACIFIC RADIOTHERAPY MARKET
FIGURE 18 ASIA-PACIFIC RADIOTHERAPY MARKET: BY PRODUCT & SERVICES, 2024
FIGURE 19 ASIA-PACIFIC RADIOTHERAPY MARKET: BY PRODUCT & SERVICES, 2025-2032 (USD THOUSAND)
FIGURE 20 ASIA-PACIFIC RADIOTHERAPY MARKET: BY PRODUCT & SERVICES, CAGR (2025-2032)
FIGURE 21 ASIA-PACIFIC RADIOTHERAPY MARKET: BY PRODUCT & SERVICES, LIFELINE CURVE
FIGURE 22 ASIA-PACIFIC RADIOTHERAPY MARKET: BY TYPE, 2024
FIGURE 23 ASIA-PACIFIC RADIOTHERAPY MARKET: BY TYPE, 2025-2032 (USD THOUSAND)
FIGURE 24 ASIA-PACIFIC RADIOTHERAPY MARKET: BY TYPE, CAGR (2025-2032)
FIGURE 25 ASIA-PACIFIC RADIOTHERAPY MARKET: BY TYPE, LIFELINE CURVE
FIGURE 26 ASIA-PACIFIC RADIOTHERAPY MARKET: BY APPLICATION, 2024
FIGURE 27 ASIA-PACIFIC RADIOTHERAPY MARKET: BY APPLICATION, 2025-2032 (USD THOUSAND)
FIGURE 28 ASIA-PACIFIC RADIOTHERAPY MARKET: BY APPLICATION, CAGR (2025-2032)
FIGURE 29 ASIA-PACIFIC RADIOTHERAPY MARKET: BY APPLICATION, LIFELINE CURVE
FIGURE 30 ASIA-PACIFIC RADIOTHERAPY MARKET: BY END USER, 2024
FIGURE 31 ASIA-PACIFIC RADIOTHERAPY MARKET: BY END USER, 2025-2032 (USD THOUSAND)
FIGURE 32 ASIA-PACIFIC RADIOTHERAPY MARKET: BY END USER, CAGR (2025-2032)
FIGURE 33 ASIA-PACIFIC RADIOTHERAPY MARKET: BY END USER LIFELINE CURVE
FIGURE 34 ASIA-PACIFIC RADIOTHERAPY MARKET: BY DISTRIBUTION CHANNEL, 2024
FIGURE 35 ASIA-PACIFIC RADIOTHERAPY MARKET: BY DISTRIBUTION CHANNEL, 2025-2032 (USD THOUSAND)
FIGURE 36 ASIA-PACIFIC RADIOTHERAPY MARKET: BY DISTRIBUTION CHANNEL, CAGR (2025-2032)
FIGURE 37 ASIA-PACIFIC RADIOTHERAPY MARKET: BY DISTRIBUTION CHANNEL, LIFELINE CURVE
FIGURE 38 ASIA-PACIFIC RADIOTHERAPY MARKET: SNAPSHOT (2024)
FIGURE 39 ASIA-PACIFIC RADIOTHERAPY MARKET: COMPANY SHARE 2024 (%)
Metodología de investigación
La recopilación de datos y el análisis del año base se realizan utilizando módulos de recopilación de datos con muestras de gran tamaño. La etapa incluye la obtención de información de mercado o datos relacionados a través de varias fuentes y estrategias. Incluye el examen y la planificación de todos los datos adquiridos del pasado con antelación. Asimismo, abarca el examen de las inconsistencias de información observadas en diferentes fuentes de información. Los datos de mercado se analizan y estiman utilizando modelos estadísticos y coherentes de mercado. Además, el análisis de la participación de mercado y el análisis de tendencias clave son los principales factores de éxito en el informe de mercado. Para obtener más información, solicite una llamada de un analista o envíe su consulta.
La metodología de investigación clave utilizada por el equipo de investigación de DBMR es la triangulación de datos, que implica la extracción de datos, el análisis del impacto de las variables de datos en el mercado y la validación primaria (experto en la industria). Los modelos de datos incluyen cuadrícula de posicionamiento de proveedores, análisis de línea de tiempo de mercado, descripción general y guía del mercado, cuadrícula de posicionamiento de la empresa, análisis de patentes, análisis de precios, análisis de participación de mercado de la empresa, estándares de medición, análisis global versus regional y de participación de proveedores. Para obtener más información sobre la metodología de investigación, envíe una consulta para hablar con nuestros expertos de la industria.
Personalización disponible
Data Bridge Market Research es líder en investigación formativa avanzada. Nos enorgullecemos de brindar servicios a nuestros clientes existentes y nuevos con datos y análisis que coinciden y se adaptan a sus objetivos. El informe se puede personalizar para incluir análisis de tendencias de precios de marcas objetivo, comprensión del mercado de países adicionales (solicite la lista de países), datos de resultados de ensayos clínicos, revisión de literatura, análisis de mercado renovado y base de productos. El análisis de mercado de competidores objetivo se puede analizar desde análisis basados en tecnología hasta estrategias de cartera de mercado. Podemos agregar tantos competidores sobre los que necesite datos en el formato y estilo de datos que esté buscando. Nuestro equipo de analistas también puede proporcionarle datos en archivos de Excel sin procesar, tablas dinámicas (libro de datos) o puede ayudarlo a crear presentaciones a partir de los conjuntos de datos disponibles en el informe.