North America Residential Energy Management Market
Marktgröße in Milliarden USD
CAGR :
% 
 USD
8.63 Billion
USD
84.06 Billion
2025
2033
USD
8.63 Billion
USD
84.06 Billion
2025
2033
| 2026 –2033 | |
| USD 8.63 Billion | |
| USD 84.06 Billion | |
|
|
|
|
Nordamerikanischer Markt für Energiemanagement im Wohnbereich (REM), nach Benutzeroberflächenanwendung (Smart Meter, Smart Thermostats, In-House Displays (IHD) und Smart Appliances), Plattform (Energiemanagementplattform (EMP), Energieanalyse- und Kundenbindungsplattform (CEP)), Komponente (Hardware und Software), Kommunikationstechnologie (ZigBee, Z-Wave, Wi-Fi, Homeplug, Wireless M-Bus und Thread), Endbenutzer (unabhängige Häuser und Wohnungen), Land (USA, Kanada und Mexiko) Branchentrends und Prognose bis 2028
 Marktanalyse und Einblicke: Nordamerikanischer Residential Energy Management (REM)-Markt
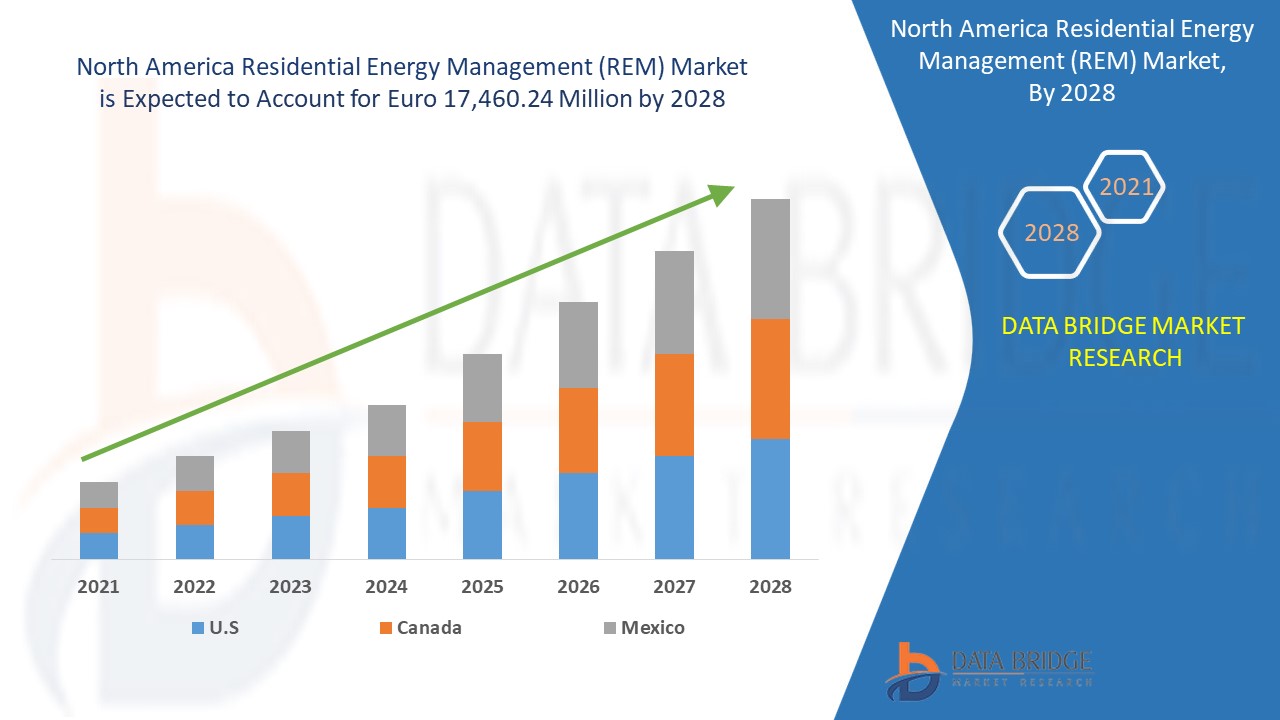
Der Markt für Energiemanagement im Wohnbereich (REM) dürfte im Prognosezeitraum 2021 bis 2028 an Marktwachstum gewinnen. Data Bridge Market Research analysiert, dass der Markt im Prognosezeitraum 2021 bis 2028 mit einer durchschnittlichen jährlichen Wachstumsrate (CAGR) von 32,9 % wächst und bis 2028 voraussichtlich 17.460,24 Millionen Euro erreichen wird. Das Bewusstsein der Verbraucher für effiziente Energiemanagementsysteme und die Einführung einer fortschrittlichen Messinfrastruktur (AMI) sind einige der Faktoren, die das Wachstum des Marktes für Energiemanagement im Wohnbereich (REM) vorantreiben.
Ein Energiemanagementsystem für Privathaushalte ist eine Hardware- und Software-Technologieplattform, die es dem Benutzer ermöglicht, die Nutzung und Produktion von Energie zu überwachen und die Energienutzung innerhalb eines Haushalts manuell zu steuern und/oder zu automatisieren. In den Produktions-, Übertragungs- und Verteilungssystemen von Stromnetzen hat das Energiemanagement für Privathaushalte (REM) schwierige Anwendungen. Nachfragemanagement ist unter den Anwendungen wichtig, und Echtzeitpreisgestaltung (RTP) sind zwei gewöhnliche Techniken des Nachfragemanagements (DSM), die von speziellen Energieversorgern mit Funktionen des Energiemanagementsystems entwickelt wurden.
Der zunehmende Bedarf, die Effizienz des Versorgungssektors zu verbessern, fördert das Wachstum des Marktes für Energiemanagement im Wohnbereich (REM). Der Mangel an Bewusstsein und Standardrichtlinien hemmt das Wachstum des Marktes für Energiemanagement im Wohnbereich (REM). Die Smart Homes, die sowohl private als auch staatliche Investitionen anregen, eröffnen dem Markt für Energiemanagement im Wohnbereich (REM) zahlreiche Möglichkeiten. Das Problem, das durch die Konnektivität mit IoT-fähigen Geräten wie Smartphones entsteht, ist das Datenschutzproblem, das eine Herausforderung für den Markt für Energiemanagement im Wohnbereich (REM) darstellt.
Dieser Marktbericht zum Thema Energiemanagement für Wohngebäude (REM) enthält Einzelheiten zu Marktanteilen, neuen Entwicklungen und Produktpipeline-Analysen, Auswirkungen inländischer und lokaler Marktteilnehmer, analysiert Chancen in Bezug auf neu entstehende Umsatzbereiche, Änderungen der Marktvorschriften, Produktzulassungen, strategische Entscheidungen, Produkteinführungen, geografische Expansionen und technologische Innovationen auf dem Markt. Um die Analyse und das Marktszenario zum Thema Energiemanagement für Wohngebäude (REM) zu verstehen, wenden Sie sich an Data Bridge Market Research, um ein Analyst Briefing zu erhalten. Unser Team hilft Ihnen dabei, eine Umsatzlösung zu entwickeln, mit der Sie Ihr gewünschtes Ziel erreichen.
 Residential Energy Management (REM) Marktumfang und Marktgröße
Der Markt für Energiemanagement im Wohnbereich (REM) ist nach Plattform, Benutzeroberflächenanwendung, Komponente, Kommunikationstechnologie und Endbenutzer segmentiert. Das Wachstum zwischen den Segmenten hilft Ihnen bei der Analyse von Wachstumsnischen und Strategien zur Marktbearbeitung und zur Bestimmung Ihrer wichtigsten Anwendungsbereiche und der Unterschiede in Ihren Zielmärkten.
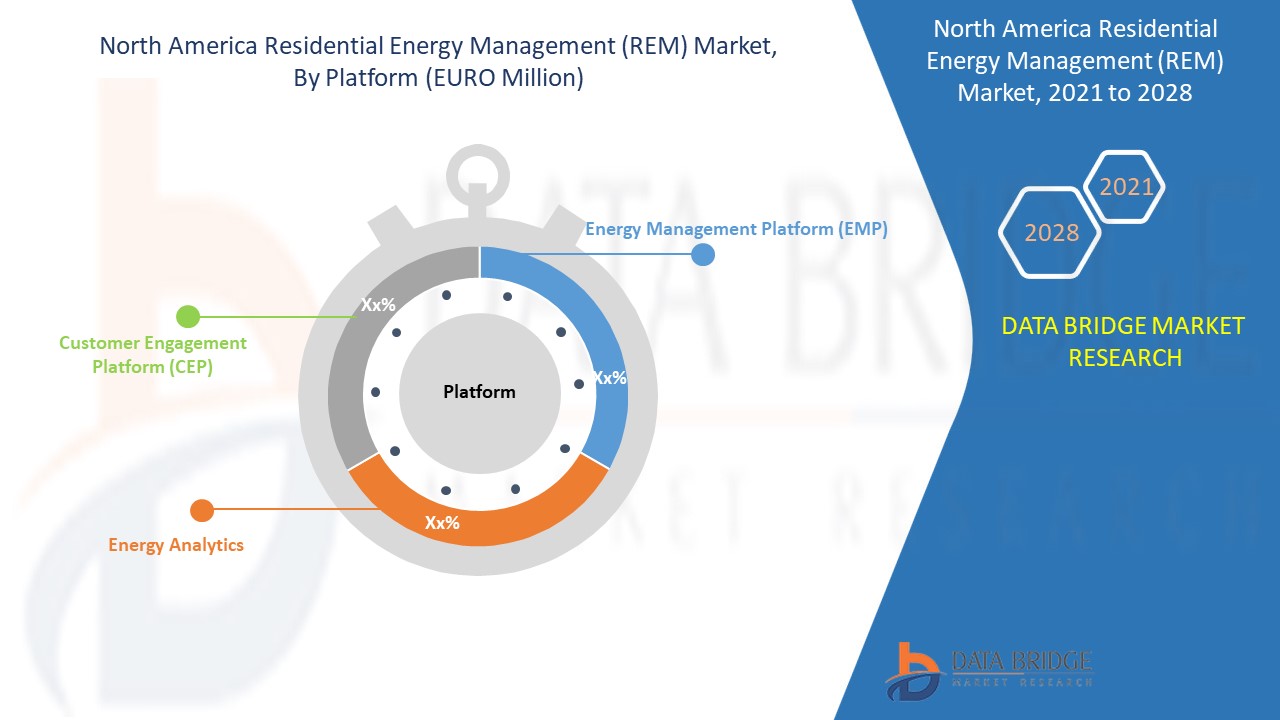
- Auf der Grundlage der Plattform ist der Markt für Energiemanagement im Wohnbereich (REM) in Energiemanagementplattformen (EMP), Energieanalysen und Kundenbindungsplattformen (CEP) segmentiert. Im Jahr 2021 dominiert das Segment der Energiemanagementplattformen (EMP) aufgrund der zunehmenden Einführung intelligenter Zähler, strenger staatlicher Vorschriften zur Energieeinsparung, technologischer Entwicklungen, die zur Erfassung und Überwachung der Datennutzung beitragen, erhöhter Energieeinsparungen und vereinfachter Energieberichterstattung. Dies sind einige der Faktoren, die dazu beitragen, den Markt für Energiemanagement im Wohnbereich (REM) anzukurbeln.
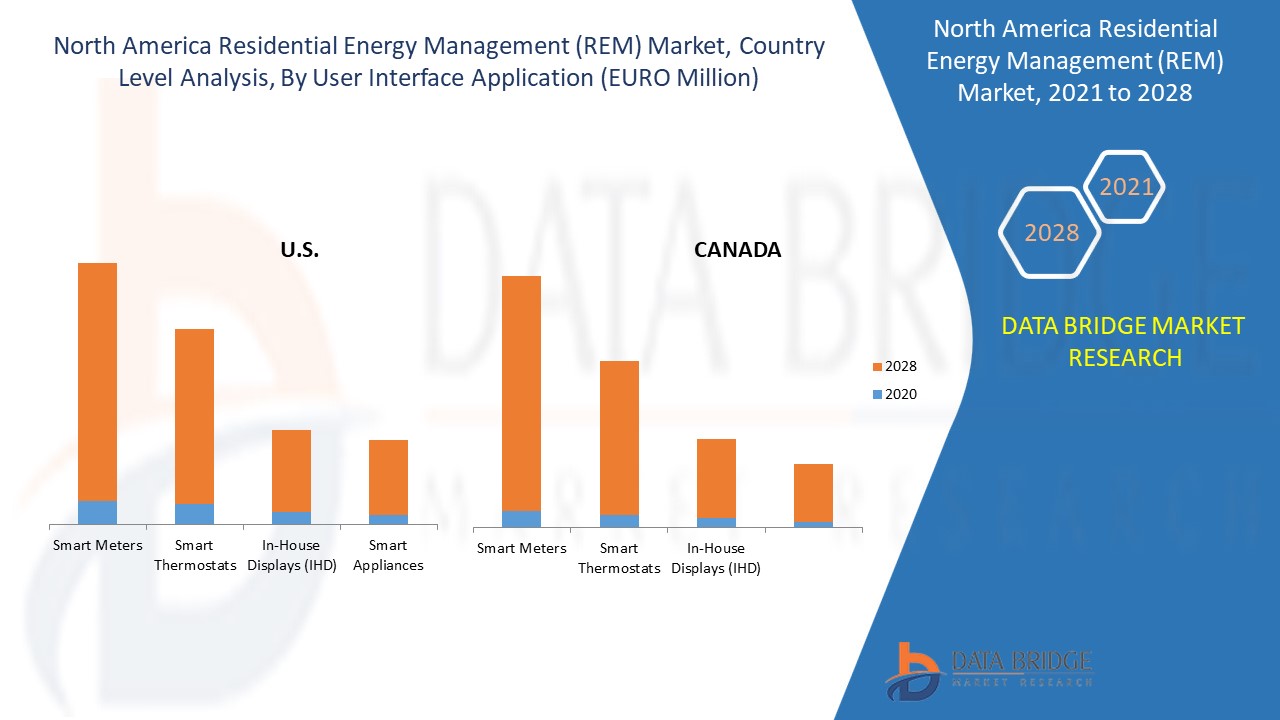
- Auf der Grundlage der Benutzeroberflächenanwendung ist der Markt für Energiemanagement im Wohnbereich (REM) in intelligente Zähler, intelligente Thermostate, In-House-Displays (IHD) und intelligente Haushaltsgeräte segmentiert. Im Jahr 2021 hält das Segment der intelligenten Zähler den größten Marktanteil aufgrund niedriger Betriebskosten, Zeitersparnis für die Verbraucher bei der Meldung des Zählerstands an die Energieversorger, höherer Genauigkeit bei den Rechnungen, informiertem tatsächlichen Energieverbrauch und besserer Überwachung und Verwaltung des Energieverbrauchs mit einer Echtzeit-Datenanzeige sind einige der Faktoren, die dem Segment helfen, den Markt für Energiemanagement im Wohnbereich (REM) zu dominieren.
- Auf der Grundlage der Komponenten ist der Markt für Energiemanagement im Wohnbereich (REM) in Hardware und Software segmentiert . Im Jahr 2021 hält das Hardwaresegment den größten Marktanteil aufgrund der zunehmenden Entwicklung von Komponenten wie HVAC, Demand-Response-Geräten und Gateways. Darüber hinaus hat die Online-Analyse mit Echtzeit-Überwachungslösung die große Nachfrage nach fortschrittlichen Komponenten geschaffen, was ebenfalls einer der Faktoren ist, die das Segmentwachstum im Markt für Energiemanagement im Wohnbereich (REM) ankurbeln.
- Basierend auf der Kommunikationstechnologie ist der Markt für Energiemanagement im Wohnbereich (REM) in Zigbee, Z-Wave, Wi-Fi, Homeplug, Wireless M-Bus und Thread segmentiert . Im Jahr 2021 hält das Zigbee-Segment den größten Marktanteil, da sich Zigbee als dominierender Standard für drahtlose Automatisierungsnetzwerke etabliert hat.
- Auf der Grundlage des Endverbrauchers ist der Markt für Energiemanagement im Wohnbereich (REM) in Einfamilienhäuser und Wohnungen unterteilt. Im Jahr 2021 hatte das Segment der Einfamilienhäuser den größten Marktanteil, da es fortschrittlichere Funktionen bietet, um die Umwandlung traditioneller Strukturen in Smart Homes zu ermöglichen.
 Nordamerika Residential Energy Management (REM) Markt – Länderebene-Analyse
Der nordamerikanische Markt für Energiemanagement im Wohnbereich (REM) wird analysiert und Informationen zur Marktgröße werden nach Land, Plattform, Benutzeroberflächenanwendung, Komponente, Kommunikationstechnologie und Endbenutzer wie oben angegeben bereitgestellt.
Die im nordamerikanischen Marktbericht zum Energiemanagement für Wohngebäude (REM) abgedeckten Länder sind die USA, Kanada und Mexiko.
Die USA haben den größten Marktanteil am Wachstum des nordamerikanischen Marktes für Energiemanagement im Wohnbereich (REM) aufgrund der zunehmenden Verbreitung von Smart Homes zusammen mit intelligenten Zählern, intelligenten Thermostaten, In-House-Displays (IHD) und intelligenten Geräten und der steigenden Nachfrage nach energie- und kostensparenden Technologien im Land. Kanada dominiert mit dem zweithöchsten Anteil, da das Land über eine große Anzahl namhafter Akteure sowie intelligente Automatisierung für intelligente Zähler verfügt, um eine umweltfreundliche Struktur für das zuverlässige Energiemanagement im Wohnbereich (REM) bereitzustellen.
Der Länderabschnitt des Berichts enthält auch Angaben zu einzelnen marktbeeinflussenden Faktoren und Änderungen der Regulierung auf dem Inlandsmarkt, die sich auf die aktuellen und zukünftigen Markttrends auswirken. Datenpunkte wie Neuverkäufe, Ersatzverkäufe, demografische Daten des Landes, Regulierungsgesetze und Import-/Exportzölle sind einige der wichtigsten Anhaltspunkte, die zur Prognose des Marktszenarios für einzelne Länder verwendet werden. Bei der Prognoseanalyse der Länderdaten werden auch die Präsenz und Verfügbarkeit nordamerikanischer Marken und ihre Herausforderungen aufgrund großer oder geringer Konkurrenz durch lokale und inländische Marken sowie die Auswirkungen der Vertriebskanäle berücksichtigt.
Steigender Bedarf zur Verbesserung der Effizienz im Versorgungssektor im Markt für Energiemanagement im Wohnbereich (REM)
Der Markt für Energiemanagement im Wohnbereich (REM) bietet Ihnen außerdem eine detaillierte Marktanalyse für jedes Branchenwachstum in jedem Land mit Umsatz, Komponentenverkäufen, Auswirkungen der technologischen Entwicklung im Bereich Energiemanagement im Wohnbereich (REM) und Änderungen der regulatorischen Szenarien mit ihrer Unterstützung für den Markt für Energiemanagement im Wohnbereich (REM). Die Daten sind für den historischen Zeitraum von 2011 bis 2019 verfügbar.
Wettbewerbsumfeld und Residential Energy Management (REM) Marktanteilsanalyse
Die Wettbewerbslandschaft des Marktes für Energiemanagement im Wohnbereich (REM) bietet Details nach Wettbewerbern. Die enthaltenen Details sind Unternehmensübersicht, Unternehmensfinanzen, erzielter Umsatz, Marktpotenzial, Investitionen in Forschung und Entwicklung, neue Marktinitiativen, Präsenz in Nordamerika, Produktionsstandorte und -einrichtungen, Stärken und Schwächen des Unternehmens, Produkteinführung, Produkttestpipelines, Produktzulassungen, Patente, Produktbreite und -umfang, Anwendungsdominanz, Technologie-Lebenslinienkurve. Die oben angegebenen Datenpunkte beziehen sich nur auf den Fokus der Unternehmen in Bezug auf den nordamerikanischen Markt für Energiemanagement im Wohnbereich (REM).
Die wichtigsten Akteure, die im nordamerikanischen Marktbericht zum Energiemanagement für Privathaushalte (REM) behandelt werden, sind Lutron Electronics Co., Inc., SAVANT TECHNOLOGIES LLC (eine Tochtergesellschaft von GENERAL ELECTRIC COMPANY), Schneider Electric, Elster Solutions (eine Tochtergesellschaft von Honeywell International Inc.), ABB, Siemens, Aclara Technologies LLC, ecobee, Uplight, Inc., e-peas, Cisco, LG Electronics, Itron Inc., SAMSUNG SDI CO.,LTD. (eine Tochtergesellschaft von SAMSUNG ELECTRONICS CO., LTD.), EcoFactor, GridPoint, Landis+Gyr, Panasonic Corporation, COMCAST und andere inländische Akteure. DBMR-Analysten verstehen die Stärken der Konkurrenz und erstellen für jeden Wettbewerber eine separate Wettbewerbsanalyse.
Darüber hinaus werden viele Produktentwicklungen von Unternehmen weltweit initiiert, die auch das Wachstum des Marktes für Energiemanagement im Wohnbereich (REM) beschleunigen.
Zum Beispiel,
- Im November 2020 ging Itron Inc. eine Partnerschaft mit der Residential Energy Assistance Partnership (REAP) von CPS Energy ein, die die Verwaltung der Energierechnungen übernimmt. Der Beitrag wird von CPS Energy umgesetzt, um die Energie- und Wasserkompetenz zu verbessern und zu inspirieren. Das Unternehmen verbesserte sein Geschäftsergebnis durch die Erweiterung seines Produktportfolios aus der Partnerschaft und konnte so mehr Kunden gewinnen.
Zusammenarbeit, Joint Ventures und andere Strategien der Marktteilnehmer stärken den Unternehmensmarkt im Bereich Wohn-Energiemanagement (REM), was den Unternehmen auch den Vorteil bietet, ihr Angebot im Bereich Wohn-Energiemanagement (REM) zu verbessern.
SKU-
Erhalten Sie Online-Zugriff auf den Bericht zur weltweit ersten Market Intelligence Cloud
- Interaktives Datenanalyse-Dashboard
- Unternehmensanalyse-Dashboard für Chancen mit hohem Wachstumspotenzial
- Zugriff für Research-Analysten für Anpassungen und Abfragen
- Konkurrenzanalyse mit interaktivem Dashboard
- Aktuelle Nachrichten, Updates und Trendanalyse
- Nutzen Sie die Leistungsfähigkeit der Benchmark-Analyse für eine umfassende Konkurrenzverfolgung
Forschungsmethodik
Die Datenerfassung und Basisjahresanalyse werden mithilfe von Datenerfassungsmodulen mit großen Stichprobengrößen durchgeführt. Die Phase umfasst das Erhalten von Marktinformationen oder verwandten Daten aus verschiedenen Quellen und Strategien. Sie umfasst die Prüfung und Planung aller aus der Vergangenheit im Voraus erfassten Daten. Sie umfasst auch die Prüfung von Informationsinkonsistenzen, die in verschiedenen Informationsquellen auftreten. Die Marktdaten werden mithilfe von marktstatistischen und kohärenten Modellen analysiert und geschätzt. Darüber hinaus sind Marktanteilsanalyse und Schlüsseltrendanalyse die wichtigsten Erfolgsfaktoren im Marktbericht. Um mehr zu erfahren, fordern Sie bitte einen Analystenanruf an oder geben Sie Ihre Anfrage ein.
Die wichtigste Forschungsmethodik, die vom DBMR-Forschungsteam verwendet wird, ist die Datentriangulation, die Data Mining, die Analyse der Auswirkungen von Datenvariablen auf den Markt und die primäre (Branchenexperten-)Validierung umfasst. Zu den Datenmodellen gehören ein Lieferantenpositionierungsraster, eine Marktzeitlinienanalyse, ein Marktüberblick und -leitfaden, ein Firmenpositionierungsraster, eine Patentanalyse, eine Preisanalyse, eine Firmenmarktanteilsanalyse, Messstandards, eine globale versus eine regionale und Lieferantenanteilsanalyse. Um mehr über die Forschungsmethodik zu erfahren, senden Sie eine Anfrage an unsere Branchenexperten.
Anpassung möglich
Data Bridge Market Research ist ein führendes Unternehmen in der fortgeschrittenen formativen Forschung. Wir sind stolz darauf, unseren bestehenden und neuen Kunden Daten und Analysen zu bieten, die zu ihren Zielen passen. Der Bericht kann angepasst werden, um Preistrendanalysen von Zielmarken, Marktverständnis für zusätzliche Länder (fordern Sie die Länderliste an), Daten zu klinischen Studienergebnissen, Literaturübersicht, Analysen des Marktes für aufgearbeitete Produkte und Produktbasis einzuschließen. Marktanalysen von Zielkonkurrenten können von technologiebasierten Analysen bis hin zu Marktportfoliostrategien analysiert werden. Wir können so viele Wettbewerber hinzufügen, wie Sie Daten in dem von Ihnen gewünschten Format und Datenstil benötigen. Unser Analystenteam kann Ihnen auch Daten in groben Excel-Rohdateien und Pivot-Tabellen (Fact Book) bereitstellen oder Sie bei der Erstellung von Präsentationen aus den im Bericht verfügbaren Datensätzen unterstützen.


