

Global Surface Analysis Market
Marktgröße in Milliarden USD
CAGR :
% 
 USD
6.10 Billion
USD
8.68 Billion
2024
2032
USD
6.10 Billion
USD
8.68 Billion
2024
2032
| 2025 –2032 | |
| USD 6.10 Billion | |
| USD 8.68 Billion | |
| % | |
|
Globaler Markt für Oberflächenanalysen, nach Technologie (Mikroskopie, Spektroskopie, Röntgenbeugung (XRD) und Oberflächenanalysatoren), Typ (XPS (Röntgen-Photoelektronenspektroskopie), TOF-SIMS (Time-Of-Flight-Sekundärionen-Massenspektrometrie), AES (Auger-Elektronenspektroskopie), Raman (Raman-Spektroskopie), UPS (UV-Photoelektronenspektroskopie), ISS (Ionenstreuspektroskopie) und anderen), Methodentyp (Spektroskopische Methode, Mikroskopische Methode und Klassische Methode), Gerätetyp (Rasterkraftmikroskope (SPM)/Rasterkraftmikroskope (AFM), Elektronensonden-Mikroanalysatoren (EPMA), Röntgen-Photoelektronenspektrometer (XPS)/Elektronenspektroskopie für chemische Analysen (ESCA) und anderen), Anwendung (Materialzusammensetzung, Oberflächenrauheit und -topographie, Dünnschichtanalyse, Kontamination, Fehleranalyse, Korrosionsanalyse und Oberflächenmodifizierung), Endbenutzer (Industrie, Forschungsorganisationen und akademische Institute) – Branchentrends und Prognose bis 2032
Oberflächenanalyse Marktanalyse
Der globale Markt für Oberflächenanalysen verzeichnet ein starkes Wachstum, angetrieben durch die steigende Nachfrage nach präziser Materialcharakterisierung in Branchen wie der Halbleiter-, Pharma- und Luft- und Raumfahrtindustrie. Dieser Markt umfasst fortschrittliche Techniken wie Röntgen-Photoelektronenspektroskopie (XPS), Rasterkraftmikroskopie (AFM) und Sekundärionen-Massenspektrometrie (SIMS), die eine detaillierte Analyse der Oberflächenzusammensetzung und -struktur ermöglichen. Technologische Fortschritte, darunter KI-gestützte Dateninterpretation, hybride Analyseverfahren und Automatisierung, erhöhen Genauigkeit und Effizienz. Steigende Investitionen in Forschung und Entwicklung, die Ausweitung von Anwendungen in der Nanotechnologie und wachsende regulatorische Anforderungen an Materialqualität und -sicherheit treiben den Markt zusätzlich voran.
Oberflächenanalyse Marktgröße
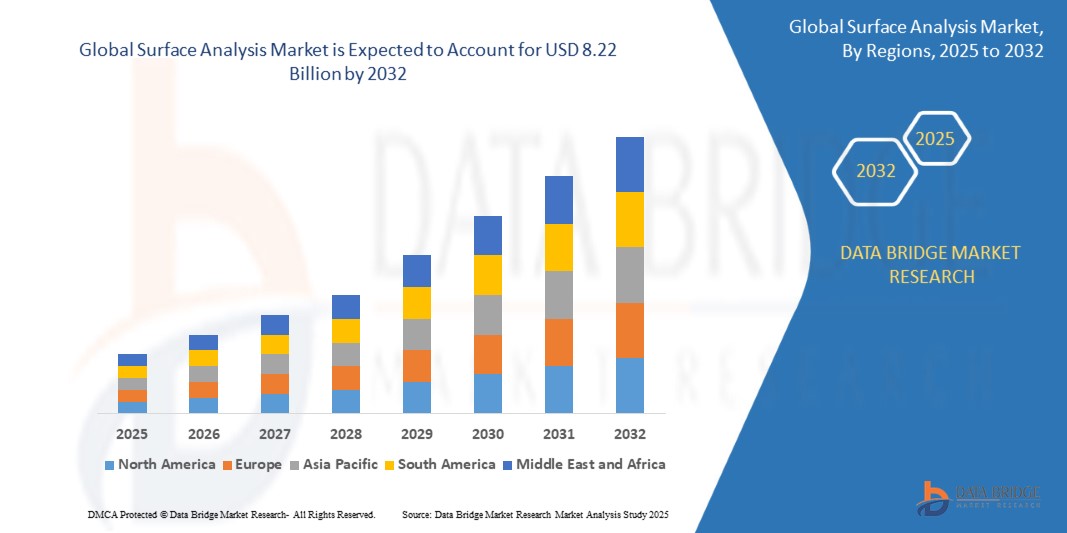
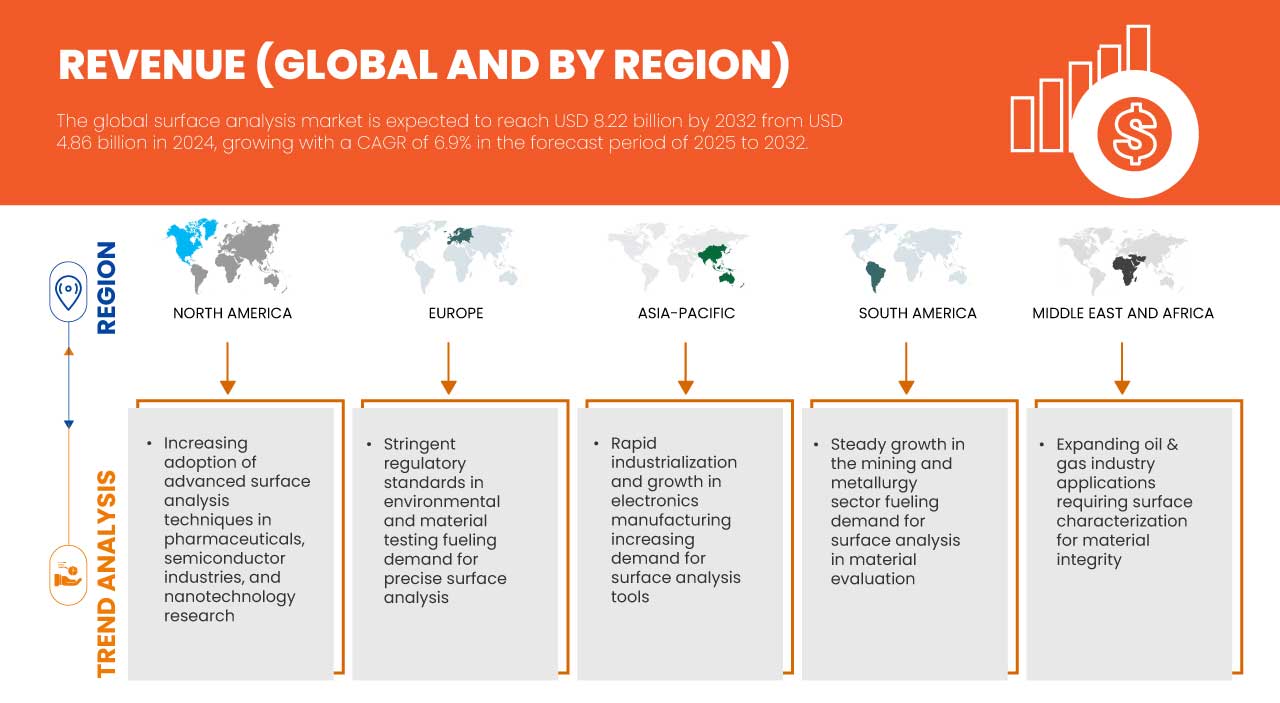
Der globale Markt für Oberflächenanalysen hatte im Jahr 2024 einen Wert von 4,86 Milliarden US-Dollar und soll bis 2032 voraussichtlich 8,22 Milliarden US-Dollar erreichen, mit einer durchschnittlichen jährlichen Wachstumsrate (CAGR) von 6,9 % im Prognosezeitraum 2025 bis 2032. Neben Einblicken in Marktszenarien wie Marktwert, Wachstumsrate, Segmentierung, geografische Abdeckung und wichtige Akteure enthalten die von Data Bridge Market Research kuratierten Marktberichte auch ausführliche Expertenanalysen, Import-/Exportanalysen, Preisanalysen, Produktionsverbrauchsanalysen und Pistillanalysen.
Markttrends zur Oberflächenanalyse
„Steigende Nachfrage nach hochpräziser Materialcharakterisierung“
Der steigende Bedarf an hochpräziser Materialcharakterisierung treibt die Entwicklung im Markt für Oberflächenanalysen voran. Branchen wie die Halbleiter-, Pharma- und Luft- und Raumfahrtindustrie benötigen präzisere und zuverlässigere Verfahren zur Oberflächenbewertung, um Produktqualität und -leistung sicherzustellen. Innovationen in den Bereichen Spektroskopie, Mikroskopie und Massenspektrometrie verbessern die Analysemöglichkeiten und ermöglichen detaillierte Oberflächenanalysen in Echtzeit. Automatisierung und KI-gestützte Datenverarbeitung steigern zudem die Effizienz, reduzieren Fehler und beschleunigen Forschungs- und Entwicklungsprozesse. Angesichts der verschärften gesetzlichen Standards für Materialintegrität und -sicherheit wird der Einsatz fortschrittlicher Oberflächenanalysetechnologien voraussichtlich zunehmen und ihre entscheidende Rolle in verschiedenen Hightech-Sektoren stärken.
Berichtsumfang und Oberflächenanalyse Marktsegmentierung
|
Eigenschaften |
Wichtige Markteinblicke zur Oberflächenanalyse |
|
Abgedeckte Segmente |
|
|
Abgedeckte Länder |
USA, Kanada und Mexiko, Großbritannien, Deutschland, Frankreich, Italien, Spanien, Russland, Niederlande, Schweiz, Belgien, Türkei, Luxemburg, Restliches Europa, China, Japan, Indien, Südkorea, Australien, Neuseeland, Singapur, Malaysia, Thailand, Indonesien, Philippinen, Taiwan, Vietnam, Restlicher Asien-Pazifik-Raum, Brasilien, Argentinien, Restliches Südamerika und Vereinigte Arabische Emirate, Saudi-Arabien, Südafrika, Ägypten, Israel und Restlicher Naher Osten und Afrika |
|
Wichtige Marktteilnehmer |
SERMA GROUP (Frankreich), Shimadzu Corporation (Japan), Eurofins Scientific (Luxemburg), Thermo Fisher Scientific Inc (USA), SAI Ltd (Großbritannien), SPECS GmbH (Deutschland), Physical Electronics, Inc. (PHI) (USA), Staib Instruments (Deutschland), Hiden Analytical (Großbritannien), Bruker (USA), HORIBA Group (Japan), JEOL Ltd (Japan), Carl Zeiss AG (Deutschland), TESCAN GROUP, as (Tschechische Republik), TSI (USA) und Nikon Instruments Inc. (USA) |
|
Marktchancen |
|
|
Wertschöpfungsdaten-Infosets |
Zusätzlich zu den Einblicken in Marktszenarien wie Marktwert, Wachstumsrate, Segmentierung, geografische Abdeckung und wichtige Akteure umfassen die von Data Bridge Market Research kuratierten Marktberichte auch ausführliche Expertenanalysen, Patientenepidemiologie, Pipeline-Analysen, Preisanalysen und regulatorische Rahmenbedingungen. |
Oberflächenanalyse Marktdefinition
Oberflächenanalyse ist die Untersuchung der äußersten Schicht eines Materials, um dessen Zusammensetzung, Struktur, Rauheit und chemische Eigenschaften zu bestimmen. Sie umfasst fortschrittliche Techniken wie Röntgen-Photoelektronenspektroskopie (XPS), Rasterkraftmikroskopie (AFM) und Sekundärionen-Massenspektrometrie (SIMS), um Oberflächen auf mikroskopischer und atomarer Ebene zu analysieren. Oberflächenanalyse ist in Branchen wie der Halbleiter-, Pharma-, Luft- und Raumfahrt- und Nanotechnologiebranche unverzichtbar, da Materialeigenschaften maßgeblich Leistung und Zuverlässigkeit beeinflussen. Durch detaillierte Einblicke in die Oberflächeneigenschaften trägt diese Analyse dazu bei, die Produktqualität zu verbessern, Herstellungsprozesse zu optimieren und die Einhaltung gesetzlicher Vorschriften sicherzustellen.
Marktdynamik für Oberflächenanalysen
Treiber
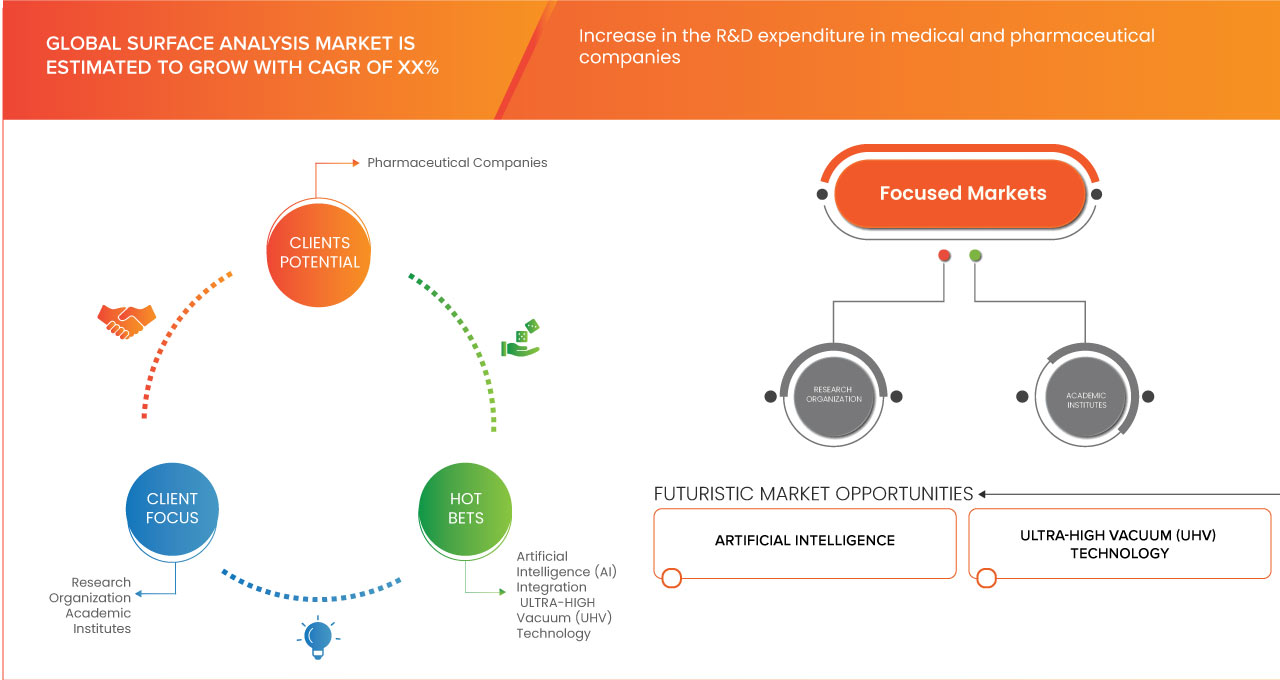
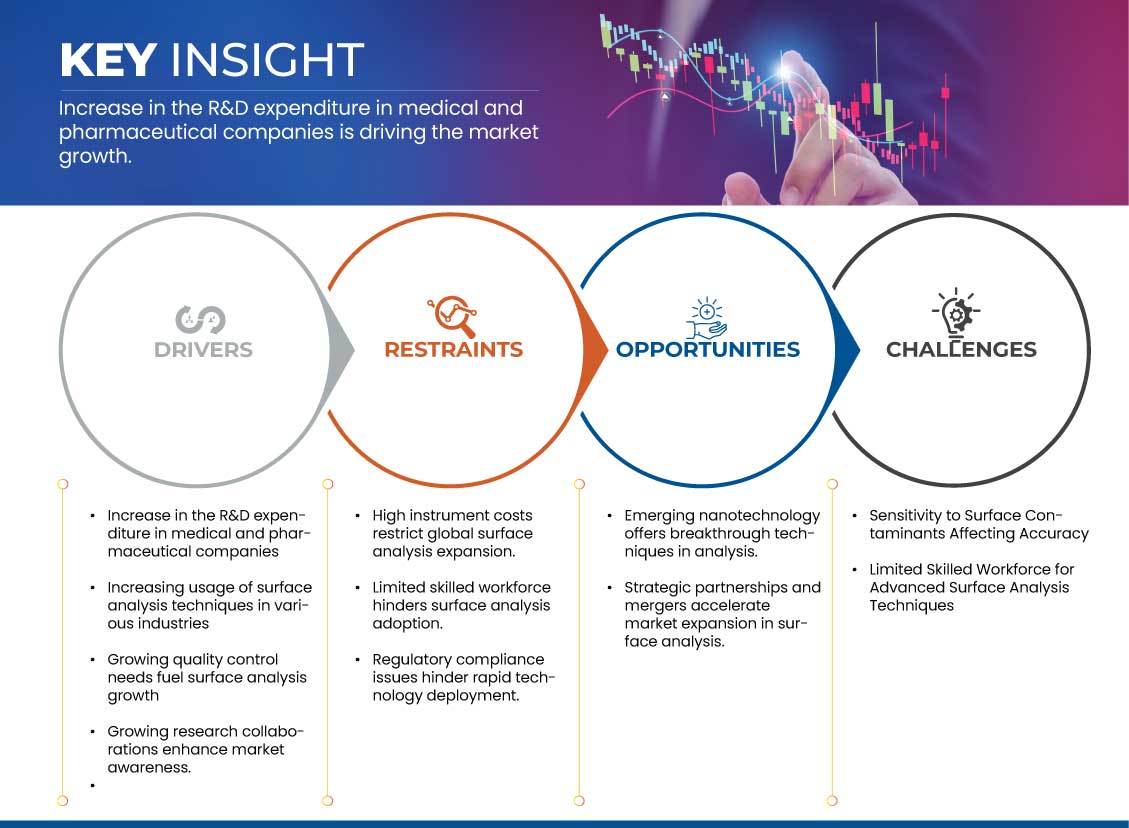
- Anstieg der F&E-Ausgaben in Medizin- und Pharmaunternehmen
Da sich diese Branchen auf die Entwicklung innovativer Medikamente und Medizinprodukte konzentrieren, ist eine präzise Oberflächencharakterisierung unerlässlich, um Produktqualität und die Einhaltung gesetzlicher Vorschriften sicherzustellen. Der Anstieg der Forschungs- und Entwicklungsausgaben beschleunigt Innovationen in der Oberflächenanalyse und erweitert deren Anwendung in wichtigen Gesundheitssektoren. Darüber hinaus hat die erhöhte Finanzierung zur Entwicklung modernster Analysegeräte mit höherer Auflösung und Empfindlichkeit geführt. Diese Fortschritte ermöglichen es Unternehmen, strenge regulatorische Standards einzuhalten und gleichzeitig bahnbrechende Forschung in der Produktentwicklung zu fördern.
Zum Beispiel,
- Laut einem von Deloitte veröffentlichten Artikel steigerten globale Pharmaunternehmen im April 2024 ihre Rendite auf F&E-Investitionen auf 4,1 % im Jahr 2023 und erholten sich damit von einem Rekordtief. Die 20 größten Pharmaunternehmen gaben 145 Milliarden US-Dollar für F&E aus, getrieben durch komplexe Studien und regulatorische Änderungen. Dieser Innovationsschub führte zu höheren Investitionen in Qualitätskontrolle und Prozessoptimierung. Infolgedessen gewannen fortschrittliche Analysetechniken, einschließlich der Oberflächenanalyse, an Bedeutung für die Gewährleistung der Arzneimittelsicherheit und -leistung und trugen zum Wachstum des Marktes für Oberflächenanalysen bei.
Zunehmende Nutzung von Methoden der Oberflächenanalyse
Die Integration von Oberflächenanalysemethoden optimiert Fertigungsprozesse durch die präzise Erkennung von Oberflächendefekten und die Gewährleistung der Konsistenz. Diese weit verbreitete Nutzung unterstreicht die Vielseitigkeit von Oberflächenanalysewerkzeugen und fördert ihr Marktwachstum in verschiedenen industriellen Anwendungen. Darüber hinaus haben technologische Verbesserungen die Betriebskosten gesenkt und diese Techniken für ein breiteres Branchenspektrum zugänglich gemacht. Die kontinuierliche Weiterentwicklung benutzerfreundlicher Software verbessert die Dateninterpretation und Prozesssteuerung und steigert die Gesamteffizienz.
Zum Beispiel,
Im März 2025 nutzten Forscher laut einem von Elsevier Inc. veröffentlichten Artikel KI-gestützte Röntgenmikroskopie, um kristallines Miconazol in amorphen Feststoffdispersionen zerstörungsfrei zu erkennen und zu quantifizieren. Sie kombinierten fortschrittliche Bildgebung mit KI-gestützter Segmentierung, um detaillierte Partikelgrößenverteilungen zu erhalten und menschliche Fehler zu reduzieren. Diese Technologie verbesserte die Qualitätskontrolle in der Arzneimittelherstellung und zeigte einen klaren Vorteil für die präzise Oberflächenanalyse, was voraussichtlich das Wachstum des globalen Marktes für Oberflächenanalysen vorantreiben wird.
Gelegenheiten
- Neue Nanotechnologie bietet bahnbrechende Analysetechniken
Die aufkommende Nanotechnologie treibt Innovationen voran, indem sie Analysen auf atomarer und molekularer Ebene ermöglicht und so eine beispiellose Auflösung und Genauigkeit bietet. Dieser Fortschritt erlaubt die Erkennung und Charakterisierung kleinster Oberflächenmerkmale, die mit herkömmlichen Methoden bisher nicht zugänglich waren. Die Weiterentwicklung dieser nanotechnologischen Techniken eröffnet neue Möglichkeiten für die Materialwissenschaft und Qualitätskontrolle und fördert das Wachstum von Oberflächenanalyseanwendungen in verschiedenen Branchen.
Zum Beispiel: -
- Im Juni 2024 nutzten Forscher laut einem von Springer Nature Limited veröffentlichten Artikel fortschrittliche Umwelt-Rasterelektronenmikroskopie (A-ESEM), um die natürliche Nanomorphologie kondensierter mitotischer Chromosomen zu enthüllen. Sie nutzten maschinelles Lernen, um die Bedingungen zu optimieren und so die hochauflösende Abbildung empfindlicher, feuchter Proben ohne Beschädigung zu ermöglichen. Dieser Durchbruch ermöglichte die Entdeckung bisher unbeobachteter Strukturdetails auf Chromosomenoberflächen. Die Studie zeigte, dass die Nanotechnologie erhebliche Chancen bietet, den Markt für Oberflächenanalysen voranzutreiben.
Strategische Partnerschaften und Fusionen beschleunigen die Marktexpansion
Strategische Partnerschaften und Fusionen bündeln komplementäres Fachwissen und Ressourcen und schaffen so Synergieeffekte, die das Marktwachstum vorantreiben. Diese Kooperationen optimieren die Entwicklung und den Einsatz fortschrittlicher Oberflächenanalysetechnologien durch die Nutzung gemeinsamer Technologien, Kundennetzwerke und Marktkenntnisse. Dadurch können Unternehmen die Markteinführungszeit verkürzen, ihre globale Präsenz ausbauen und die sich entwickelnden Branchenherausforderungen effektiver bewältigen. Dies beschleunigt letztlich das Wachstum des Oberflächenanalysemarktes.
Zum Beispiel,
Im Februar 2025 gab Nanovis laut einem von Cision US Inc. veröffentlichten Artikel bekannt, dass Medtronic bestimmte Vermögenswerte im Bereich der Nanooberflächentechnologie, darunter geistiges Eigentum an OsteoSync-Titan-Pads, für den Einsatz in seinen PEEK-Interbody-Fusionsimplantaten der nächsten Generation erworben hat. Die von der FDA zugelassene Nanotechnologie verbesserte die Osseointegration und damit die Implantatfixierung in der Wirbelsäulenchirurgie. Diese strategische Akquisition unterstreicht, wie Partnerschaften und Fusionen die Marktexpansion in der Oberflächenanalyse beschleunigen, indem sie fortschrittliche Nanoinnovationen mit führenden Medizinproduktedesigns integrieren. Die Zusammenarbeit versprach, Chirurgen erstklassige Geräte zu liefern und so Innovation und Marktwachstum im Bereich medizinischer Implantate weiter voranzutreiben.
Einschränkungen/Herausforderungen
- Empfindlichkeit gegenüber Oberflächenverunreinigungen beeinträchtigt die Genauigkeit
Techniken wie Röntgen-Photoelektronenspektroskopie (XPS), Auger-Elektronenspektroskopie (AES) und Flugzeit-Sekundärionen-Massenspektrometrie (ToF-SIMS) sind hochgradig oberflächenempfindlich. Verunreinigungen aus der Umgebung, Handhabung oder Probenvorbereitung können daher zu Fehlern führen. Diese Herausforderung ist besonders kritisch in Branchen wie der Halbleiter-, Pharma- und Hochleistungswerkstoffindustrie, wo eine präzise Analyse der Oberflächenzusammensetzung für die Qualitätskontrolle und die Einhaltung gesetzlicher Vorschriften unerlässlich ist. Die Lösung dieser Probleme erfordert strenge Protokolle zur Probenhandhabung, kontrollierte Umgebungen und fortschrittliche Reinigungstechniken, um unerwünschte Oberflächenveränderungen zu minimieren.
Darüber hinaus verstärkt die wachsende Nachfrage nach hochauflösender und quantitativer Oberflächenanalyse in der Nanotechnologie- und Biomaterialforschung den Bedarf an verbesserten Kontaminationskontrollmaßnahmen. Innovative Lösungen wie Ultrahochvakuum (UHV), In-situ-Reinigungsverfahren wie Ionensputtern und fortschrittliche Datenkorrekturalgorithmen werden erforscht, um die Auswirkungen von Verunreinigungen zu mildern. Diese Ansätze können jedoch den Analyseprozess komplexer und teurer machen und stellen eine Herausforderung für die breite Akzeptanz dar, insbesondere für kleinere Forschungslabore und aufstrebende Branchen. Mit der Weiterentwicklung der Oberflächenanalysetechnologien werden Fortschritte in der Automatisierung, der Echtzeit-Kontaminationserkennung und maschinell lernenden Korrekturtechniken entscheidend zur Verbesserung von Genauigkeit und Zuverlässigkeit in verschiedenen Anwendungen beitragen.
Zum Beispiel
Laut XPS Metrology beeinträchtigen Oberflächenverunreinigungen Materialeigenschaften, Beschichtungen und Haftung und führen häufig zu Korrosion und Materialverschleiß. Verunreinigungen wie Öle, Salze und Luftschadstoffe verfälschen die Ergebnisse der Oberflächenanalyse, insbesondere bei XPS, wo selbst nanometerdicke Schichten die Genauigkeit beeinträchtigen. Handhabungspraktiken, Handschuhe und Reinigungssprays beeinträchtigen die Messzuverlässigkeit in Branchen wie der Luft- und Raumfahrt und der Halbleiterfertigung zusätzlich.
- Begrenzte Fachkräfte für fortgeschrittene Oberflächenanalysetechniken
Techniken wie XPS, SIMS und AFM erfordern Fachwissen in den Bereichen Instrumentierung, Dateninterpretation und Probenvorbereitung, die für präzise und zuverlässige Ergebnisse unerlässlich sind. Der Mangel an ausgebildeten Fachkräften kann zu Ineffizienzen, inkonsistenter Datenqualität und verlängerten Analysezeiten führen, was sich letztendlich auf Forschung, Qualitätskontrolle und industrielle Anwendungen auswirkt, die auf Oberflächencharakterisierung angewiesen sind.
Zum Beispiel:
Laut der National Library of Medicine war die Röntgen-Photoelektronenspektroskopie (XPS) im Januar 2020 die am weitesten verbreitete Oberflächenanalysetechnik. Ihre schnelle Verbreitung führte jedoch aufgrund des Fachkräftemangels häufig zu Fehlanwendungen. Viele unerfahrene Anwender haben Schwierigkeiten mit genauen Messungen und der Dateninterpretation, was zu Fehlern und Inkonsistenzen führt. Abweichungen in der Gerätekalibrierung erschweren den Prozess zusätzlich. Der Mangel an ausgebildeten Fachkräften stellt eine zentrale Herausforderung für den Markt der Oberflächenanalyse dar und beeinträchtigt die Zuverlässigkeit und Reproduzierbarkeit der Ergebnisse.
Dieser Marktbericht enthält Details zu aktuellen Entwicklungen, Handelsbestimmungen, Import-Export-Analysen, Produktionsanalysen, Wertschöpfungskettenoptimierungen, Marktanteilen, dem Einfluss inländischer und lokaler Marktteilnehmer, analysiert Chancen hinsichtlich neuer Umsatzfelder, Änderungen der Marktregulierung, strategische Marktwachstumsanalysen, Marktgröße, Kategoriemarktwachstum, Anwendungsnischen und Marktdominanz, Produktzulassungen, Produkteinführungen, geografischer Expansion und technologischen Innovationen. Für weitere Marktinformationen kontaktieren Sie Data Bridge Market Research für ein Analysten-Briefing. Unser Team unterstützt Sie bei fundierten Marktentscheidungen und unterstützt Sie bei Ihrem Marktwachstum.
Marktumfang der Oberflächenanalyse
Der globale Markt für Oberflächenanalysen ist in fünf Segmente unterteilt, basierend auf Angebot, Bereitstellungsmodell, Unternehmensgröße, Betriebssystem und Anwendung. Das Wachstum dieser Segmente hilft Ihnen, schwache Wachstumssegmente in den Branchen zu analysieren und bietet den Nutzern einen wertvollen Marktüberblick und Markteinblicke, die ihnen helfen, strategische Entscheidungen zur Identifizierung zentraler Marktanwendungen zu treffen.
Technologie
- Mikroskopie
- Nach Methode
- Elektronenmikroskopie
- Optische Mikroskopie
- Konfokale Mikroskopie
- Sondenmikroskopie
- Nach Technik
- Rasterelektronenmikroskopie (Sem)
- Transmissionselektronenmikroskopie (Tem)
- Rasterkraftmikroskopie (Spm)
- Bildanalyse
- Kryo-Elektronenmikroskopie (Cryo-Em)
- Sonstige
- Nach Methode
- Spektroskopie
- Röntgenbeugung (Xrd)
- Oberflächenanalysatoren
Typ
- XPS (Röntgen-Photoelektronenspektroskopie)
- Tof-Sims (Flugzeit-Sekundärionen-Massenspektrometrie)
- Aes (Auger-Elektronenspektroskopie)
- Raman (Raman-Spektroskopie)
- Ups (UV-Photoelektronenspektroskopie)
- Iss (Ionenstreuspektroskopie)
- Sonstige
Methodentyp
- Spektroskopische Methode
- Mikroskopische Methode
- Klassische Methode
Gerätetyp
- Rasterkraftmikroskope (SPM)/Rasterkraftmikroskope (AFM)
- Nach Vorgang
- Automatisch
- Handbuch
- Nach Geräuschpegel
- Niedrig
- Extrem niedrig
- Standard
- Nach Vorgang
- Elektronenstrahl-Mikroanalysatoren (Epma)
- Röntgen-Photoelektronenspektrometer (Xps)/Elektronenspektroskopie für chemische Analysen (Esca)
- Sonstige
Anwendung
- Materialzusammensetzung
- Oberflächenrauheit und Topographie
- Dünnschichtanalyse
- Oberflächenkontamination
- Fehleranalyse
- Korrosionsanalyse
- Oberflächenmodifizierung
Endbenutzer
- Branchen
- Nach Typ
- Halbleiter
- Biowissenschaften und Pharma
- Polymere
- Energie
- Metallurgie und Mineralien
- Automobilindustrie
- Essen und Getränke
- Textil
- Papier und Verpackung
- Sonstige
- Nach Technologie
- Mikroskopie
- Spektroskopie
- Röntgenbeugung (Xrd)
- Oberflächenanalysatoren
- Nach Typ
- Forschungsorganisation
- Mikroskopie
- Spektroskopie
- Röntgenbeugung (Xrd)
- Oberflächenanalysatoren
- Akademische Institute
- Mikroskopie
- Spektroskopie
- Röntgenbeugung (XRD)
- Oberflächenanalysatoren

Regionale Analyse des Oberflächenanalysemarktes
Der Markt wird analysiert und es werden Einblicke in die Marktgröße und Trends nach Technologie, Typ, Methodentyp, Gerätetyp, Anwendung und Endbenutzer bereitgestellt.
Die vom Markt abgedeckten Länder sind die USA, Kanada, Mexiko, Großbritannien, Deutschland, Frankreich, Italien, Spanien, Russland, die Niederlande, die Schweiz, Belgien, die Türkei, Luxemburg und der Rest von Europa, China, Japan, Indien, Südkorea, Australien, Neuseeland, Singapur, Malaysia, Thailand, Indonesien, die Philippinen, Taiwan, Vietnam und der Rest des asiatisch-pazifischen Raums, Brasilien, Argentinien und der Rest von Südamerika und den Vereinigten Arabischen Emiraten, Saudi-Arabien, Südafrika, Ägypten, Israel und der Rest des Nahen Ostens und Afrikas.
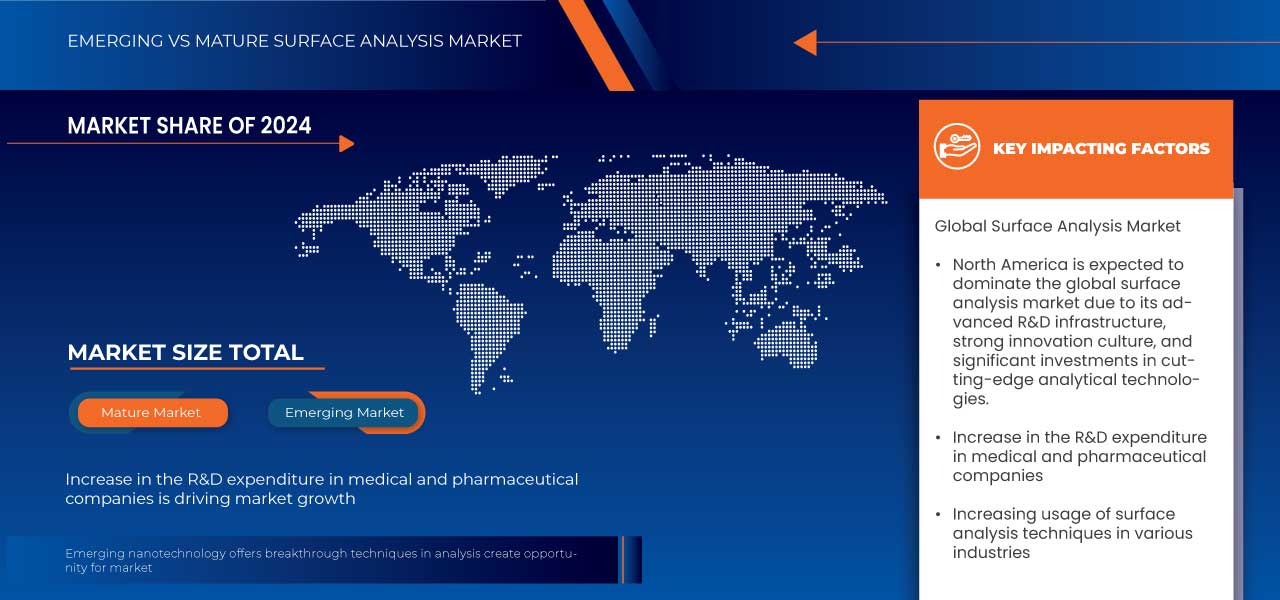
Nordamerika wird voraussichtlich den globalen Markt für Oberflächenanalysen dominieren. Dies ist auf seine fortschrittliche Forschungs- und Entwicklungsinfrastruktur, seine starke Innovationskultur und seine hohen Investitionen in modernste Analysetechnologien zurückzuführen. Die etablierte industrielle Basis der Region in Branchen wie Luft- und Raumfahrt, Gesundheitswesen, Automobilindustrie und Elektronik treibt die hohe Nachfrage nach präziser Qualitätskontrolle und Materialcharakterisierung voran. Enge Kooperationen zwischen Wissenschaft und Industrie sowie unterstützende regulatorische Rahmenbedingungen fördern die Technologieakzeptanz zusätzlich.
Aufgrund der Präsenz führender Technologieunternehmen, starker Investitionen in Forschung und Entwicklung, fortschrittlicher Halbleiter- und Nanotechnologieindustrie und der hohen Akzeptanz hochmoderner Analysetechniken in verschiedenen Sektoren wie dem Gesundheitswesen, der Elektronik und der Materialwissenschaft dürfte Nordamerika die am schnellsten wachsende Region auf dem globalen Markt für Oberflächenanalyse sein.
Der Länderteil des Berichts enthält zudem Informationen zu einzelnen marktbeeinflussenden Faktoren und regulatorischen Veränderungen im Inland, die sich auf die aktuellen und zukünftigen Markttrends auswirken. Datenpunkte wie die Analyse der nachgelagerten und vorgelagerten Wertschöpfungskette, technische Trends, die Fünf-Kräfte-Analyse nach Porter sowie Fallstudien dienen unter anderem der Prognose des Marktszenarios für einzelne Länder. Auch die Präsenz und Verfügbarkeit südamerikanischer Marken und die damit verbundenen Herausforderungen aufgrund starker oder geringer Konkurrenz durch lokale und inländische Marken sowie die Auswirkungen inländischer Zölle und Handelsrouten werden bei der Prognoseanalyse der Länderdaten berücksichtigt.
Marktanteile der Oberflächenanalyse
Die Wettbewerbslandschaft des Marktes liefert detaillierte Informationen zu den einzelnen Wettbewerbern. Zu den Details gehören Unternehmensübersicht, Finanzzahlen, Umsatz, Marktpotenzial, Investitionen in Forschung und Entwicklung, neue Marktinitiativen, Präsenz in Südamerika, Produktionsstandorte und -anlagen, Produktionskapazitäten, Stärken und Schwächen des Unternehmens, Produkteinführung, Produktbreite und -umfang sowie Anwendungsdominanz. Die oben genannten Datenpunkte beziehen sich ausschließlich auf die Marktausrichtung der Unternehmen.
Die auf dem Markt tätigen Marktführer für Oberflächenanalyse sind:
- SERMA GROUP (Frankreich)
- Shimadzu Corporation (Japan)
- Eurofins Scientific (Luxemburg)
- Thermo Fisher Scientific Inc (USA)
- SAI Ltd (Großbritannien)
- SPECS GmbH (Deutschland)
- Physical Electronics, Inc. (PHI) (USA)
- Staib Instruments (Deutschland)
- Hiden Analytical (Großbritannien)
- Bruker (USA)
- HORIBA-Gruppe (Japan)
- JEOL Ltd (Japan)
- Carl Zeiss AG (Deutschland)
- TESCAN GROUP, as (Tschechische Republik)
- TSI (USA)
- Nikon Instruments Inc. (USA)
Neueste Entwicklungen auf dem globalen Markt für Oberflächenanalysen
- Im Januar 2025 hat Eurofins Environment Testing Eaton Analytical eine innovative Methode zum Nachweis von Chlornitramid-Anionen, einem neu entdeckten Desinfektionsnebenprodukt in Trinkwasser, entwickelt und damit die Wasserqualitätsanalyse und -sicherheit verbessert. Dieser Fortschritt erweitert die Expertise von Eurofins Scientific in der Oberflächen- und Chemikalienanalyse, indem er die Fähigkeit zur Identifizierung und Bewertung von Schadstoffen verfeinert und so seine Führungsposition in der analytischen Prüfung von Wasser- und Umweltsicherheit weiter festigt.
- Im Juli 2022 brachte ULVAC-PHI PHI GENESIS auf den Markt, ein vollautomatisches XPS/HAXPES-System für die schnelle und hochempfindliche Oberflächen- und Grenzflächenanalyse. Diese Weiterentwicklung stärkt die Position von Physical Electronics, Inc. durch verbesserte Automatisierung, Empfindlichkeit und Analysemöglichkeiten für Metalle, Halbleiter, Keramik und organische Materialien.
- Im Juli 2024 hat sich die Shimadzu Corporation mit der TESCAN Group zusammengeschlossen, um die Rasterelektronenmikroskope von TESCAN im Herbst in Japan auf den Markt zu bringen und damit ihr Angebot an analytischen Messungen zu erweitern. Diese Partnerschaft erweitert Shimadzus Möglichkeiten zur Oberflächenanalyse durch die Kombination der hochmodernen TESCAN-SEM-Technologie mit den bestehenden Instrumenten und ermöglicht so eine präzisere und umfassendere Materialcharakterisierung.
- Im Juli 2024 fusionierten die FOCUS GmbH und die SPECS Surface Nano Analysis GmbH, beide unter der LAB14 GmbH, zur SPECS Surface Nano Analysis GmbH unter Beibehaltung ihrer Markenidentitäten. Diese Fusion erweitert die Oberflächenanalysekapazitäten der SPECS GmbH durch die Integration der Expertise der FOCUS GmbH in Impulsmikroskopen und Elektronenspektroskopie und ermöglicht so präzisere und umfassendere Forschungslösungen.
- Im Februar 2025 übernimmt Thermo Fisher Scientific das Purification & Filtration-Geschäft von Solventum für 4,1 Milliarden US-Dollar und stärkt damit seine Präsenz im wachsenden Bioprozessmarkt. Die Übernahme stärkt die Filtrations- und Reinigungskapazitäten von Thermo Fisher und verbessert die Probenvorbereitung für Oberflächenanalyseverfahren wie XPS und Spektroskopie. Dies führt zu höherer Präzision und Effizienz bei der Materialcharakterisierung.
SKU-
Erhalten Sie Online-Zugriff auf den Bericht zur weltweit ersten Market Intelligence Cloud

- Interaktives Datenanalyse-Dashboard
- Unternehmensanalyse-Dashboard für Chancen mit hohem Wachstumspotenzial
- Zugriff für Research-Analysten für Anpassungen und Abfragen
- Konkurrenzanalyse mit interaktivem Dashboard
- Aktuelle Nachrichten, Updates und Trendanalyse
- Nutzen Sie die Leistungsfähigkeit der Benchmark-Analyse für eine umfassende Konkurrenzverfolgung
Inhaltsverzeichnis
1 INTRODUCTION
1.1 OBJECTIVES OF THE STUDY
1.2 MARKET DEFINITION
1.3 OVERVIEW OF GLOBAL SURFACE ANALYSIS MARKET
1.4 CURRENCY AND PRICING
1.5 LIMITATIONS
1.6 MARKETS COVERED
2 MARKET SEGMENTATION
2.1 MARKETS COVERED
2.2 GEOGRAPHICAL SCOPE
2.3 YEARS CONSIDERED FOR THE STUDY
2.4 DBMR TRIPOD DATA VALIDATION MODEL
2.5 PRIMARY INTERVIEWS WITH KEY OPINION LEADERS
2.6 DBMR MARKET POSITION GRID
2.7 MULTIVARIATE MODELING
2.8 THECNOLOGY TIMELINE CURVE
2.9 MARKET APPLICATION COVERAGE GRID
2.1 SECONDARY SOURCES
2.11 ASSUMPTIONS
3 EXECUTIVE SUMMARY
4 PREMIUM INSIGHTS
4.1 INDUSTRY ANALYSIS & FUTURISTIC SCENARIO
4.1.1 SURFACE ANALYSIS IN THE SEMICONDUCTOR INDUSTRY
4.1.2 SURFACE ANALYSIS IN THE ACADEMIC INSTITUTES
4.1.3 SURFACE ANALYSIS IN THE RESEARCH ORGANIZATIONS
4.2 PENETRATION AND GROWTH PROSPECT MAPPING
4.2.1 GROWTH PROSPECT
4.3 COMPETITOR KEY PRICING STRATEGIES
4.4 KEY TECHNOLOGIES
4.4.1 COMPLEMENTARY TECHNOLOGIES
4.4.2 ADJACENT TECHNOLOGIES
4.4.3 CHALLENGES
4.4.4 TECHNOLOGY SPEND OF COMPANY
4.5 COMPANY COMPARATIVE ANALYSIS
5 MARKET OVERVIEW
5.1 DRIVERS
5.1.1 INCREASE IN THE R&D EXPENDITURE IN MEDICAL AND PHARMACEUTICAL COMPANIES
5.1.2 GROWING UTILIZATION OF SURFACE ANALYSIS METHODS IS EXPANDING ACROSS SECTORS LIKE ELECTRONICS, AUTOMOTIVE, AEROSPACE, AND ADVANCED MATERIALS
5.1.3 INCREASING QUALITY CONTROL DEMANDS ARE DRIVING THE EXPANSION OF SURFACE ANALYSIS.
5.1.4 GROWING RESEARCH COLLABORATION AMONG ACADEMIA, INDUSTRY, AND GOVERNMENT BOOST MARKET AWARENESS
5.2 RESTRAINTS
5.2.1 HIGH INSTRUMENT COSTS RESTRICT GLOBAL SURFACE ANALYSIS EXPANSION
5.2.2 REGULATORY COMPLIANCE ISSUES HINDER RAPID TECHNOLOGY DEPLOYMENT
5.3 OPPORTUNITIES
5.3.1 EMERGING NANOTECHNOLOGY OFFERS BREAKTHROUGH TECHNIQUES IN ANALYSIS
5.3.2 STRATEGIC PARTNERSHIPS AND MERGERS ACCELERATE MARKET EXPANSION IN SURFACE ANALYSIS
5.4 CHALLENGES
5.4.1 SENSITIVITY TO SURFACE CONTAMINANTS AFFECTING ACCURACY
5.4.2 LIMITED SKILLED WORKFORCE FOR ADVANCED SURFACE ANALYSIS TECHNIQUES
6 GLOBAL SURFACE ANALYSIS MARKET, BY TECHNOLOGY
6.1 OVERVIEW
6.2 MICROSCOPY
6.2.1 MICROSCOPY, BY METHOD
6.2.1.1 ELECTRON MICROSCOPY
6.2.1.2 OPTICAL MICROSCOPY
6.2.1.3 CONFOCAL MICROSCOPY
6.2.1.4 PROBE MICROSCOPY
6.2.2 MICROSCOPY, BY TECHNIQUE
6.2.2.1 SCANNING ELECTRON MICROSCOPY (SEM)
6.2.2.2 TRANSMISSION ELECTRON MICROSCOPY (TEM)
6.2.2.3 SCANNING PROBE MICROSCOPY (SPM)
6.2.2.4 IMAGE ANALYSIS
6.2.2.5 CRYO-ELECTRON MICROSCOPY (CRYO-EM)
6.2.2.6 OTHERS
6.3 SPECTROSCOPY
6.4 X-RAY DIFFRACTION (XRD)
6.5 SURFACE ANALYZERS
7 GLOBAL SURFACE ANALYSIS MARKET, BY TYPE
7.1 OVERVIEW
7.2 XPS (X-RAY PHOTOELECTRON SPECTROSCOPY)
7.3 TOF-SIMS (TIME-OF-FLIGHT SECONDARY ION MASS SPECTROMETRY)
7.4 AES (AUGER ELECTRON SPECTROSCOPY)
7.5 RAMAN (RAMAN SPECTROSCOPY)
7.6 UPS (UV PHOTOELECTRON SPECTROSCOPY)
7.7 ISS (ION SCATTERING SPECTROSCOPY)
7.8 OTHERS
8 GLOBAL SURFACE ANALYSIS MARKET, BY METHOD TYPE
8.1 OVERVIEW
8.2 SPECTROSCOPIC METHOD
8.3 MICROSCOPIC METHOD
8.4 CLASSICAL METHOD
9 GLOBAL SURFACE ANALYSIS MARKET, BY EQUIPMENT TYPE
9.1 OVERVIEW
9.2 SCANNING PROBE MICROSCOPES (SPM)/ATOMIC FORCE MICROSCOPES (AFM)
9.2.1 SCANNING PROBE MICROSCOPES (SPM)/ATOMIC FORCE MICROSCOPES (AFM), BY OPERATION
9.2.1.1 AUTOMATIC
9.2.1.2 MANUAL
9.2.2 SCANNING PROBE MICROSCOPES (SPM)/ATOMIC FORCE MICROSCOPES (AFM), BY NOISE LEVEL
9.2.2.1 LOW
9.2.2.2 EXTREMELY LOW
9.2.2.3 STANDARD
9.3 ELECTRON PROBE MICRO-ANALYZERS (EPMA)
9.4 X-RAY PHOTOELECTRON SPECTROMETERS (XPS)/ELECTRON SPECTROSCOPY FOR CHEMICAL ANALYSIS (ESCA)
9.5 OTHERS
10 GLOBAL SURFACE ANALYSIS MARKET, BY APPLICATION
10.1 OVERVIEW
10.2 MATERIAL COMPOSITION
10.3 SURFACE ROUGHNESS AND TOPOGRAPHY
10.4 THIN FILM ANALYSIS
10.5 SURFACE CONTAMINATION
10.6 FAILURE ANALYSIS
10.7 CORROSION ANALYSIS
10.8 SURFACE MODIFICATION
11 GLOBAL SURFACE ANALYSIS MARKET, BY END USER
11.1 OVERVIEW
11.2 INDUSTRIES
11.2.1 INDUSTRIES, BY TYPE
11.2.1.1 LIFE SCIENCES & PHARMACEUTICALS
11.2.1.2 SEMICONDUCTOR
11.2.1.3 METALLURGY AND MINERALS
11.2.1.4 AUTOMOTIVE
11.2.1.5 ENERGY
11.2.1.6 FOOD AND BEVERAGES
11.2.1.7 POLYMERS
11.2.1.8 TEXTILE
11.2.1.9 PAPER AND PACKAGING
11.2.1.10 OTHERS
11.2.2 INDUSTRIES, BY TECHNOLOGY
11.2.2.1 MICROSCOPY
11.2.2.2 SPECTROSCOPY
11.2.2.3 X-RAY DIFFRACTION (XRD)
11.2.2.4 SURFACE ANALYZERS
11.3 RESEARCH ORGANIZATION
11.3.1 RESEARCH ORGANIZATION, BY TECHNOLOGY
11.3.1.1 MICROSCOPY
11.3.1.2 SPECTROSCOPY
11.3.1.3 X-RAY DIFFRACTION (XRD)
11.3.1.4 SURFACE ANALYZERS
11.4 ACADEMIC INSTITUTES
11.4.1 ACADEMIC INSTITUTES, BY TECHNOLOGY
11.4.1.1 MICROSCOPY
11.4.1.2 SPECTROSCOPY
11.4.1.3 X-RAY DIFFRACTION (XRD)
11.4.1.4 SURFACE ANALYZERS
12 GLOBAL SURFACE ANALYSIS MARKET, BY REGION
12.1 OVERVIEW
12.2 NORTH AMERICA
12.2.1 U.S.
12.2.2 CANADA
12.2.3 MEXICO
12.3 EUROPE
12.3.1 GERMANY
12.3.2 FRANCE
12.3.3 U.K.
12.3.4 ITALY
12.3.5 SPAIN
12.3.6 NETHERLANDS
12.3.7 SWITZERLAND
12.3.8 RUSS.IA
12.3.9 TURKEY
12.3.10 BELGIUM
12.3.11 REST OF EUROPE
12.4 ASIA-PACIFIC
12.4.1 CHINA
12.4.2 JAPAN
12.4.3 SOUTH KOREA
12.4.4 INDIA
12.4.5 AUST.RALIA
12.4.6 SINGAPORE
12.4.7 INDONESIA
12.4.8 THAILAND
12.4.9 MALAYSIA
12.4.10 PHILIPPINES
12.4.11 NEW-ZEALAND
12.4.12 REST OF ASIA-PACIFIC
12.5 SOUTH AMERICA
12.5.1 BRAZIL
12.5.2 ARGENTINA
12.5.3 REST OF SOUTH AMERICA
12.6 MIDDLE EAST AND AFRICA
12.6.1 SAUDI ARABIA
12.6.2 SOUTH AFRICA
12.6.3 U.A.E.
12.6.4 EGYPT
12.6.5 ISRAEL
12.6.6 REST OF MIDDLE EAST AND AFRICA
13 GLOBAL SURFACE ANALYSIS MARKET, COMPANY LANDSCAPE
13.1 COMPANY SHARE ANALYSIS: GLOBAL
13.2 COMPANY SHARE ANALYSIS: NORTH AMERICA
13.3 COMPANY SHARE ANALYSIS: EUROPE
13.4 COMPANY SHARE ANALYSIS: ASIA-PACIFIC
14 SWOT ANALYSIS
15 COMPANY PROFILES
15.1 THERMO FISHER SCIENTIFIC INC.
15.1.1 COMPANY SNAPSHOTS
15.1.2 REVENUE ANALYSIS
15.1.3 COMPANY SHARE ANALYSIS
15.1.4 PRODUCT PORTFOLIO
15.1.5 RECENT DEVELOPMENT
15.2 CARL ZEISS AG
15.2.1 COMPANY SNAPSHOT
15.2.2 COMPANY SHARE ANALYSIS
15.2.3 PRODUCT PORTFOLIO
15.2.4 RECENT DEVELOPMENTS/NEWS
15.3 BRUKER
15.3.1 COMPANY SNAPSHOT
15.3.2 REVENUE ANALYSIS
15.3.3 COMPANY SHARE ANALYSIS
15.3.4 PRODUCT PORTFOLIO
15.3.5 RECENT DEVELOPMENT/ NEWS
15.4 HORIBA GROUP
15.4.1 COMPANY SNAPSHOT
15.4.2 REVENUE ANALYSIS
15.4.3 COMPANY SHARE ANALYSIS
15.4.4 PRODUCT PORTFOLIO
15.4.5 RECENT DEVELOPMENTS
15.5 EUROFINS SCIENTIFIC
15.5.1 COMPANY SNAPSHOT
15.5.2 REVENUE ANALYSIS
15.5.3 COMPANY SHARE ANALYSIS
15.5.4 SERVICE PORTFOLIO
15.5.5 RECENT DEVELOPMENT
15.6 HIDDEN ANALYTICAL
15.6.1 COMPANY SNAPSHOT
15.6.2 PRODUCT PORTFOLIO
15.6.3 RECENT DEVELOPMENT
15.7 JEOL LTD.
15.7.1 COMPANY SNAPSHOTS
15.7.2 REVENUE ANALYSIS
15.7.3 PRODUCT PORTFOLIO
15.7.4 RECENT DEVELOPMENTS/NEWS
15.8 NIKON INSTRUMENTS INC.
15.8.1 COMPANY SNAPSHOT
15.8.2 PRODUCT PORTFOLIO
15.8.3 RECENT DEVELOPMENT
15.9 PHYSICAL ELECTRONICS, INC. (AS A PART OF ULVAC-PHI)
15.9.1 COMPANY SNAPSHOT
15.9.2 PRODUCT PORTFOLIO
15.9.3 RECENT DEVELOPMENT
15.1 S A I LTD
15.10.1 COMPANY SNAPSHOT
15.10.2 PRODUCT PORTFOLIO
15.10.3 RECENT DEVELOPMENT
15.11 SERMA GROUP
15.11.1 COMPANY SNAPSHOT
15.11.2 PRODUCT PORTFOLIO
15.11.3 RECENT DEVELOPMENT / NEWS
15.12 SHIMADZU CORPORATION
15.12.1 COMPANY SNAPSHOT
15.12.2 REVENUE ANALYSIS
15.12.3 PRODUCT PORTFOLIO
15.12.4 RECENT DEVELOPMENT
15.13 SPECS GMBH
15.13.1 COMPANY SNAPSHOT
15.13.2 PRODUCT PORTFOLIO
15.13.3 RECENT DEVELOPMENT
15.14 STAIB INSTRUMENTS
15.14.1 COMPANY SNAPSHOT
15.14.2 PRODUCT PORTFOLIO
15.14.3 RECENT DEVELOPMENT
15.15 TESCAN
15.15.1 COMPANY SNAPSHOT
15.15.2 PRODUCT PORTFOLIO
15.15.3 RECENT DEVELOPMENT/NEWS
15.16 TSI
15.16.1 COMPANY SNAPSHOT
15.16.2 PRODUCT PORTFOLIO
15.16.3 RECENT DEVELOPMENT/NEWS
16 QUESTIONNAIRE
17 RELATED REPORTS
Tabellenverzeichnis
TABLE 1 MARKET PENETRATION ANALYSIS
TABLE 2 PRICING
TABLE 3 COMPANY COMPARATIVE ANALYSIS
TABLE 4 SEVERAL SOURCES OF SUBSTRATE SURFACE CONTAMINATION
TABLE 5 GLOBAL SURFACE ANALYSIS MARKET, BY TECHNOLOGY, 2018-2032 (USD THOUSAND)
TABLE 6 GLOBAL MICROSCOPY IN SURFACE ANALYSIS MARKET, BY REGION, 2018-2032 (USD THOUSAND)
TABLE 7 GLOBAL MICROSCOPY IN SURFACE ANALYSIS MARKET, BY METHOD, 2018-2032 (USD THOUSAND)
TABLE 8 GLOBAL MICROSCOPY IN SURFACE ANALYSIS MARKET, BY TECHNIQUE, 2018-2032 (USD THOUSAND)
TABLE 9 GLOBAL SPECTROSCOPY IN SURFACE ANALYSIS MARKET, BY REGION, 2018-2032 (USD THOUSAND)
TABLE 10 GLOBAL X-RAY DIFFRACTION (XRD) IN SURFACE ANALYSIS MARKET, BY RGION, 2018-2032 (USD THOUSAND)
TABLE 11 GLOBAL SURFACE ANALYZERS IN SURFACE ANALYSIS MARKET, BY REGION, 2018-2032 (USD THOUSAND)
TABLE 12 GLOBAL SURFACE ANALYSIS MARKET, BY TYPE, 2018-2032 (USD THOUSAND)
TABLE 13 GLOBAL XPS (X-RAY PHOTOELECTRON SPECTROSCOPY) IN SURFACE ANALYSIS MARKET, BY REGION, 2018-2032 (USD THOUSAND)
TABLE 14 GLOBAL TOF-SIMS (TIME-OF-FLIGHT SECONDARY ION MASS SPECTROMETRY) IN SURFACE ANALYSIS MARKET, BY REGION, 2018-2032 (USD THOUSAND)
TABLE 15 GLOBAL AES (AUGER ELECTRON SPECTROSCOPY) IN SURFACE ANALYSIS MARKET, BY REGION, 2018-2032 (USD THOUSAND)
TABLE 16 GLOBAL RAMAN (RAMAN SPECTROSCOPY) IN SURFACE ANALYSIS MARKET, BY REGION, 2018-2032 (USD THOUSAND)
TABLE 17 GLOBAL UPS (UV PHOTOELECTRON SPECTROSCOPY) IN SURFACE ANALYSIS MARKET, BY REGION, 2018-2032 (USD THOUSAND)
TABLE 18 GLOBAL ISS (ION SCATTERING SPECTROSCOPY) IN SURFACE ANALYSIS MARKET, BY REGION, 2018-2032 (USD THOUSAND)
TABLE 19 GLOBAL OTHERS IN SURFACE ANALYSIS MARKET, BY REGION, 2018-2032 (USD THOUSAND)
TABLE 20 GLOBAL SURFACE ANALYSIS MARKET, BY METHOD TYPE, 2018-2032 (USD THOUSAND)
TABLE 21 GLOBAL SPECTROSCOPIC METHOD IN SURFACE ANALYSIS MARKET, BY REGION, 2018-2032 (USD THOUSAND)
TABLE 22 GLOBAL MICROSCOPIC METHOD IN SURFACE ANALYSIS MARKET, BY REGION, 2018-2032 (USD THOUSAND)
TABLE 23 GLOBAL CLASSICAL METHOD IN SURFACE ANALYSIS MARKET, BY REGION, 2018-2032 (USD THOUSAND)
TABLE 24 GLOBAL SURFACE ANALYSIS MARKET, BY EQUIPMENT TYPE, 2018-2032 (USD THOUSAND)
TABLE 25 GLOBAL SCANNING PROBE MICROSCOPES (SPM)/ATOMIC FORCE MICROSCOPES (AFM) IN SURFACE ANALYSIS MARKET, BY REGION, 2018-2032 (USD THOUSAND)
TABLE 26 GLOBAL SCANNING PROBE MICROSCOPES (SPM)/ATOMIC FORCE MICROSCOPES (AFM) IN SURFACE ANALYSIS MARKET, BY OPERATION, 2018-2032 (USD THOUSAND)
TABLE 27 GLOBAL SCANNING PROBE MICROSCOPES (SPM)/ATOMIC FORCE MICROSCOPES (AFM) IN SURFACE ANALYSIS MARKET, BY NOISE LEVEL, 2018-2032 (USD THOUSAND)
TABLE 28 GLOBAL ELECTRON PROBE MICRO-ANALYZERS (EPMA) IN SURFACE ANALYSIS MARKET, BY REGION, 2018-2032 (USD THOUSAND)
TABLE 29 GLOBAL X-RAY PHOTOELECTRON SPECTROMETERS (XPS)/ELECTRON SPECTROSCOPY FOR CHEMICAL ANALYSIS (ESCA) IN SURFACE ANALYSIS MARKET, BY REGION, 2018-2032 (USD THOUSAND)
TABLE 30 GLOBAL OTHERS IN SURFACE ANALYSIS MARKET, BY REGION, 2018-2032 (USD THOUSAND)
TABLE 31 GLOBAL SURFACE ANALYSIS MARKET, BY APPLICATION, 2018-2032 (USD THOUSAND)
TABLE 32 GLOBAL MATERIAL COMPOSITION IN SURFACE ANALYSIS MARKET, BY REGION, 2018-2032 (USD THOUSAND)
TABLE 33 GLOBAL SURFACE ROUGHNESS AND TOPOGRAPHY IN SURFACE ANALYSIS MARKET, BY REGION, 2018-2032 (USD THOUSAND)
TABLE 34 GLOBAL THIN FILM ANALYSIS IN SURFACE ANALYSIS MARKET, BY REGION, 2018-2032 (USD THOUSAND)
TABLE 35 GLOBAL SURFACE CONTAMINATION IN SURFACE ANALYSIS MARKET, BY REGION, 2018-2032 (USD THOUSAND)
TABLE 36 GLOBAL FAILURE ANALYSIS IN SURFACE ANALYSIS MARKET, BY REGION, 2018-2032 (USD THOUSAND)
TABLE 37 GLOBAL CORROSION ANALYSIS IN SURFACE ANALYSIS MARKET, BY REGION, 2018-2032 (USD THOUSAND)
TABLE 38 GLOBAL SURFACE MODIFICATION IN SURFACE ANALYSIS MARKET, BY REGION, 2018-2032 (USD THOUSAND)
TABLE 39 GLOBAL SURFACE ANALYSIS MARKET, BY END USER, 2018-2032 (USD THOUSAND)
TABLE 40 GLOBAL INDUSTRIES IN SURFACE ANALYSIS MARKET, BY REGION, 2018-2032 (USD THOUSAND)
TABLE 41 GLOBAL INDUSTRIES IN SURFACE ANALYSIS MARKET, BY TYPE, 2018-2032 (USD THOUSAND)
TABLE 42 GLOBAL INDUSTRIES IN SURFACE ANALYSIS MARKET, BY TECHNOLOGY, 2018-2032 (USD THOUSAND)
TABLE 43 GLOBAL RESEARCH ORGANIZATION IN SURFACE ANALYSIS MARKET, BY REGION, 2018-2032 (USD THOUSAND)
TABLE 44 GLOBAL RESEARCH ORGANIZATION IN SURFACE ANALYSIS MARKET, BY TECHNOLOGY, 2018-2032 (USD THOUSAND)
TABLE 45 GLOBAL ACADEMIC INSTITUTES IN SURFACE ANALYSIS MARKET, BY REGION, 2018-2032 (USD THOUSAND)
TABLE 46 GLOBAL ACADEMIC INSTITUTES IN SURFACE ANALYSIS MARKET, BY TECHNOLOGY, 2018-2032 (USD THOUSAND)
TABLE 47 GLOBAL SURFACE ANALYSIS MARKET, BY REGION 2018-2032, USD (THOUSAND)
TABLE 48 NORTH AMERICA SURFACE ANALYSIS MARKET, BY COUNTRY, 2018-2032 (USD THOUSAND)
TABLE 49 NORTH AMERICA SURFACE ANALYSIS MARKET, BY TECHNOLOGY, 2018-2032 (USD THOUSAND)
TABLE 50 NORTH AMERICA MICROSCOPY IN SURFACE ANALYSIS MARKET, BY METHOD, 2018-2032 (USD THOUSAND)
TABLE 51 NORTH AMERICA MICROSCOPY IN SURFACE ANALYSIS MARKET, BY TECHNIQUE, 2018-2032 (USD THOUSAND)
TABLE 52 NORTH AMERICA SURFACE ANALYSIS MARKET, BY TYPE, 2018-2032 (USD THOUSAND)
TABLE 53 NORTH AMERICA SURFACE ANALYSIS MARKET, BY METHOD TYPE, 2018-2032 (USD THOUSAND)
TABLE 54 NORTH AMERICA SURFACE ANALYSIS MARKET, BY EQUIPMENT TYPE, 2018-2032 (USD THOUSAND)
TABLE 55 NORTH AMERICA SCANNING PROBE MICROSCOPES (SPM)/ATOMIC FORCE MICROSCOPES (AFM) IN SURFACE ANALYSIS MARKET, BY OPERATION, 2018-2032 (USD THOUSAND)
TABLE 56 NORTH AMERICA SCANNING PROBE MICROSCOPES (SPM)/ATOMIC FORCE MICROSCOPES (AFM) IN SURFACE ANALYSIS MARKET, BY NOISE LEVEL, 2018-2032 (USD THOUSAND)
TABLE 57 NORTH AMERICA SURFACE ANALYSIS MARKET, BY APPLICATION, 2018-2032 (USD THOUSAND)
TABLE 58 NORTH AMERICA SURFACE ANALYSIS MARKET, BY END USER, 2018-2032 (USD THOUSAND)
TABLE 59 NORTH AMERICA INDUSTRIES IN SURFACE ANALYSIS MARKET, BY TYPE, 2018-2032 (USD THOUSAND)
TABLE 60 NORTH AMERICA INDUSTRIES IN SURFACE ANALYSIS MARKET, BY TECHNOLOGY, 2018-2032 (USD THOUSAND)
TABLE 61 NORTH AMERICA RESEARCH ORGANIZATION IN SURFACE ANALYSIS MARKET, BY TECHNOLOGY, 2018-2032 (USD THOUSAND)
TABLE 62 NORTH AMERICA ACADEMIC INSTITUTES IN SURFACE ANALYSIS MARKET, BY TECHNOLOGY, 2018-2032 (USD THOUSAND)
TABLE 63 U.S. SURFACE ANALYSIS MARKET, BY TECHNOLOGY, 2018-2032 (USD THOUSAND)
TABLE 64 U.S. MICROSCOPY IN SURFACE ANALYSIS MARKET, BY METHOD, 2018-2032 (USD THOUSAND)
TABLE 65 U.S. MICROSCOPY IN SURFACE ANALYSIS MARKET, BY TECHNIQUE, 2018-2032 (USD THOUSAND)
TABLE 66 U.S. SURFACE ANALYSIS MARKET, BY TYPE, 2018-2032 (USD THOUSAND)
TABLE 67 U.S. SURFACE ANALYSIS MARKET, BY METHOD TYPE, 2018-2032 (USD THOUSAND)
TABLE 68 U.S. SURFACE ANALYSIS MARKET, BY EQUIPMENT TYPE, 2018-2032 (USD THOUSAND)
TABLE 69 U.S. SCANNING PROBE MICROSCOPES (SPM)/ATOMIC FORCE MICROSCOPES (AFM) IN SURFACE ANALYSIS MARKET, BY OPERATION, 2018-2032 (USD THOUSAND)
TABLE 70 U.S. SCANNING PROBE MICROSCOPES (SPM)/ATOMIC FORCE MICROSCOPES (AFM) IN SURFACE ANALYSIS MARKET, BY NOISE LEVEL, 2018-2032 (USD THOUSAND)
TABLE 71 U.S. SURFACE ANALYSIS MARKET, BY APPLICATION, 2018-2032 (USD THOUSAND)
TABLE 72 U.S. SURFACE ANALYSIS MARKET, BY END USER, 2018-2032 (USD THOUSAND)
TABLE 73 U.S. INDUSTRIES IN SURFACE ANALYSIS MARKET, BY TYPE, 2018-2032 (USD THOUSAND)
TABLE 74 U.S. INDUSTRIES IN SURFACE ANALYSIS MARKET, BY TECHNOLOGY, 2018-2032 (USD THOUSAND)
TABLE 75 U.S. RESEARCH ORGANIZATION IN SURFACE ANALYSIS MARKET, BY TECHNOLOGY, 2018-2032 (USD THOUSAND)
TABLE 76 U.S. ACADEMIC INSTITUTES IN SURFACE ANALYSIS MARKET, BY TECHNOLOGY, 2018-2032 (USD THOUSAND)
TABLE 77 CANADA SURFACE ANALYSIS MARKET, BY TECHNOLOGY, 2018-2032 (USD THOUSAND)
TABLE 78 CANADA MICROSCOPY IN SURFACE ANALYSIS MARKET, BY METHOD, 2018-2032 (USD THOUSAND)
TABLE 79 CANADA MICROSCOPY IN SURFACE ANALYSIS MARKET, BY TECHNIQUE, 2018-2032 (USD THOUSAND)
TABLE 80 CANADA SURFACE ANALYSIS MARKET, BY TYPE, 2018-2032 (USD THOUSAND)
TABLE 81 CANADA SURFACE ANALYSIS MARKET, BY METHOD TYPE, 2018-2032 (USD THOUSAND)
TABLE 82 CANADA SURFACE ANALYSIS MARKET, BY EQUIPMENT TYPE, 2018-2032 (USD THOUSAND)
TABLE 83 CANADA SCANNING PROBE MICROSCOPES (SPM)/ATOMIC FORCE MICROSCOPES (AFM) IN SURFACE ANALYSIS MARKET, BY OPERATION, 2018-2032 (USD THOUSAND)
TABLE 84 CANADA SCANNING PROBE MICROSCOPES (SPM)/ATOMIC FORCE MICROSCOPES (AFM) IN SURFACE ANALYSIS MARKET, BY NOISE LEVEL, 2018-2032 (USD THOUSAND)
TABLE 85 CANADA SURFACE ANALYSIS MARKET, BY APPLICATION, 2018-2032 (USD THOUSAND)
TABLE 86 CANADA SURFACE ANALYSIS MARKET, BY END USER, 2018-2032 (USD THOUSAND)
TABLE 87 CANADA INDUSTRIES IN SURFACE ANALYSIS MARKET, BY TYPE, 2018-2032 (USD THOUSAND)
TABLE 88 CANADA INDUSTRIES IN SURFACE ANALYSIS MARKET, BY TECHNOLOGY, 2018-2032 (USD THOUSAND)
TABLE 89 CANADA RESEARCH ORGANIZATION IN SURFACE ANALYSIS MARKET, BY TECHNOLOGY, 2018-2032 (USD THOUSAND)
TABLE 90 CANADA ACADEMIC INSTITUTES IN SURFACE ANALYSIS MARKET, BY TECHNOLOGY, 2018-2032 (USD THOUSAND)
TABLE 91 MEXICO SURFACE ANALYSIS MARKET, BY TECHNOLOGY, 2018-2032 (USD THOUSAND)
TABLE 92 MEXICO MICROSCOPY IN SURFACE ANALYSIS MARKET, BY METHOD, 2018-2032 (USD THOUSAND)
TABLE 93 MEXICO MICROSCOPY IN SURFACE ANALYSIS MARKET, BY TECHNIQUE, 2018-2032 (USD THOUSAND)
TABLE 94 MEXICO SURFACE ANALYSIS MARKET, BY TYPE, 2018-2032 (USD THOUSAND)
TABLE 95 MEXICO SURFACE ANALYSIS MARKET, BY METHOD TYPE, 2018-2032 (USD THOUSAND)
TABLE 96 MEXICO SURFACE ANALYSIS MARKET, BY EQUIPMENT TYPE, 2018-2032 (USD THOUSAND)
TABLE 97 MEXICO SCANNING PROBE MICROSCOPES (SPM)/ATOMIC FORCE MICROSCOPES (AFM) IN SURFACE ANALYSIS MARKET, BY OPERATION, 2018-2032 (USD THOUSAND)
TABLE 98 MEXICO SCANNING PROBE MICROSCOPES (SPM)/ATOMIC FORCE MICROSCOPES (AFM) IN SURFACE ANALYSIS MARKET, BY NOISE LEVEL, 2018-2032 (USD THOUSAND)
TABLE 99 MEXICO SURFACE ANALYSIS MARKET, BY APPLICATION, 2018-2032 (USD THOUSAND)
TABLE 100 MEXICO SURFACE ANALYSIS MARKET, BY END USER, 2018-2032 (USD THOUSAND)
TABLE 101 MEXICO INDUSTRIES IN SURFACE ANALYSIS MARKET, BY TYPE, 2018-2032 (USD THOUSAND)
TABLE 102 MEXICO INDUSTRIES IN SURFACE ANALYSIS MARKET, BY TECHNOLOGY, 2018-2032 (USD THOUSAND)
TABLE 103 MEXICO RESEARCH ORGANIZATION IN SURFACE ANALYSIS MARKET, BY TECHNOLOGY, 2018-2032 (USD THOUSAND)
TABLE 104 MEXICO ACADEMIC INSTITUTES IN SURFACE ANALYSIS MARKET, BY TECHNOLOGY, 2018-2032 (USD THOUSAND)
TABLE 105 EUROPE SURFACE ANALYSIS MARKET, BY COUNTRY, 2018-2032 (USD THOUSAND)
TABLE 106 EUROPE SURFACE ANALYSIS MARKET, BY TECHNOLOGY, 2018-2032 (USD THOUSAND)
TABLE 107 EUROPE MICROSCOPY IN SURFACE ANALYSIS MARKET, BY METHOD, 2018-2032 (USD THOUSAND)
TABLE 108 EUROPE MICROSCOPY IN SURFACE ANALYSIS MARKET, BY TECHNIQUE, 2018-2032 (USD THOUSAND)
TABLE 109 EUROPE SURFACE ANALYSIS MARKET, BY TYPE, 2018-2032 (USD THOUSAND)
TABLE 110 EUROPE SURFACE ANALYSIS MARKET, BY METHOD TYPE, 2018-2032 (USD THOUSAND)
TABLE 111 EUROPE SURFACE ANALYSIS MARKET, BY EQUIPMENT TYPE, 2018-2032 (USD THOUSAND)
TABLE 112 EUROPE SCANNING PROBE MICROSCOPES (SPM)/ATOMIC FORCE MICROSCOPES (AFM) IN SURFACE ANALYSIS MARKET, BY OPERATION, 2018-2032 (USD THOUSAND)
TABLE 113 EUROPE SCANNING PROBE MICROSCOPES (SPM)/ATOMIC FORCE MICROSCOPES (AFM) IN SURFACE ANALYSIS MARKET, BY NOISE LEVEL, 2018-2032 (USD THOUSAND)
TABLE 114 EUROPE SURFACE ANALYSIS MARKET, BY APPLICATION, 2018-2032 (USD THOUSAND)
TABLE 115 EUROPE SURFACE ANALYSIS MARKET, BY END USER, 2018-2032 (USD THOUSAND)
TABLE 116 EUROPE INDUSTRIES IN SURFACE ANALYSIS MARKET, BY TYPE, 2018-2032 (USD THOUSAND)
TABLE 117 EUROPE INDUSTRIES IN SURFACE ANALYSIS MARKET, BY TECHNOLOGY, 2018-2032 (USD THOUSAND)
TABLE 118 EUROPE RESEARCH ORGANIZATION IN SURFACE ANALYSIS MARKET, BY TECHNOLOGY, 2018-2032 (USD THOUSAND)
TABLE 119 EUROPE ACADEMIC INSTITUTES IN SURFACE ANALYSIS MARKET, BY TECHNOLOGY, 2018-2032 (USD THOUSAND)
TABLE 120 GERMANY SURFACE ANALYSIS MARKET, BY TECHNOLOGY, 2018-2032 (USD THOUSAND)
TABLE 121 GERMANY MICROSCOPY IN SURFACE ANALYSIS MARKET, BY METHOD, 2018-2032 (USD THOUSAND)
TABLE 122 GERMANY MICROSCOPY IN SURFACE ANALYSIS MARKET, BY TECHNIQUE, 2018-2032 (USD THOUSAND)
TABLE 123 GERMANY SURFACE ANALYSIS MARKET, BY TYPE, 2018-2032 (USD THOUSAND)
TABLE 124 GERMANY SURFACE ANALYSIS MARKET, BY METHOD TYPE, 2018-2032 (USD THOUSAND)
TABLE 125 GERMANY SURFACE ANALYSIS MARKET, BY EQUIPMENT TYPE, 2018-2032 (USD THOUSAND)
TABLE 126 GERMANY SCANNING PROBE MICROSCOPES (SPM)/ATOMIC FORCE MICROSCOPES (AFM) IN SURFACE ANALYSIS MARKET, BY OPERATION, 2018-2032 (USD THOUSAND)
TABLE 127 GERMANY SCANNING PROBE MICROSCOPES (SPM)/ATOMIC FORCE MICROSCOPES (AFM) IN SURFACE ANALYSIS MARKET, BY NOISE LEVEL, 2018-2032 (USD THOUSAND)
TABLE 128 GERMANY SURFACE ANALYSIS MARKET, BY APPLICATION, 2018-2032 (USD THOUSAND)
TABLE 129 GERMANY SURFACE ANALYSIS MARKET, BY END USER, 2018-2032 (USD THOUSAND)
TABLE 130 GERMANY INDUSTRIES IN SURFACE ANALYSIS MARKET, BY TYPE, 2018-2032 (USD THOUSAND)
TABLE 131 GERMANY INDUSTRIES IN SURFACE ANALYSIS MARKET, BY TECHNOLOGY, 2018-2032 (USD THOUSAND)
TABLE 132 GERMANY RESEARCH ORGANIZATION IN SURFACE ANALYSIS MARKET, BY TECHNOLOGY, 2018-2032 (USD THOUSAND)
TABLE 133 GERMANY ACADEMIC INSTITUTES IN SURFACE ANALYSIS MARKET, BY TECHNOLOGY, 2018-2032 (USD THOUSAND)
TABLE 134 FRANCE SURFACE ANALYSIS MARKET, BY TECHNOLOGY, 2018-2032 (USD THOUSAND)
TABLE 135 FRANCE MICROSCOPY IN SURFACE ANALYSIS MARKET, BY METHOD, 2018-2032 (USD THOUSAND)
TABLE 136 FRANCE MICROSCOPY IN SURFACE ANALYSIS MARKET, BY TECHNIQUE, 2018-2032 (USD THOUSAND)
TABLE 137 FRANCE SURFACE ANALYSIS MARKET, BY TYPE, 2018-2032 (USD THOUSAND)
TABLE 138 FRANCE SURFACE ANALYSIS MARKET, BY METHOD TYPE, 2018-2032 (USD THOUSAND)
TABLE 139 FRANCE SURFACE ANALYSIS MARKET, BY EQUIPMENT TYPE, 2018-2032 (USD THOUSAND)
TABLE 140 FRANCE SCANNING PROBE MICROSCOPES (SPM)/ATOMIC FORCE MICROSCOPES (AFM) IN SURFACE ANALYSIS MARKET, BY OPERATION, 2018-2032 (USD THOUSAND)
TABLE 141 FRANCE SCANNING PROBE MICROSCOPES (SPM)/ATOMIC FORCE MICROSCOPES (AFM) IN SURFACE ANALYSIS MARKET, BY NOISE LEVEL, 2018-2032 (USD THOUSAND)
TABLE 142 FRANCE SURFACE ANALYSIS MARKET, BY APPLICATION, 2018-2032 (USD THOUSAND)
TABLE 143 FRANCE SURFACE ANALYSIS MARKET, BY END USER, 2018-2032 (USD THOUSAND)
TABLE 144 FRANCE INDUSTRIES IN SURFACE ANALYSIS MARKET, BY TYPE, 2018-2032 (USD THOUSAND)
TABLE 145 FRANCE INDUSTRIES IN SURFACE ANALYSIS MARKET, BY TECHNOLOGY, 2018-2032 (USD THOUSAND)
TABLE 146 FRANCE RESEARCH ORGANIZATION IN SURFACE ANALYSIS MARKET, BY TECHNOLOGY, 2018-2032 (USD THOUSAND)
TABLE 147 FRANCE ACADEMIC INSTITUTES IN SURFACE ANALYSIS MARKET, BY TECHNOLOGY, 2018-2032 (USD THOUSAND)
TABLE 148 U.K. SURFACE ANALYSIS MARKET, BY TECHNOLOGY, 2018-2032 (USD THOUSAND)
TABLE 149 U.K. MICROSCOPY IN SURFACE ANALYSIS MARKET, BY METHOD, 2018-2032 (USD THOUSAND)
TABLE 150 U.K. MICROSCOPY IN SURFACE ANALYSIS MARKET, BY TECHNIQUE, 2018-2032 (USD THOUSAND)
TABLE 151 U.K. SURFACE ANALYSIS MARKET, BY TYPE, 2018-2032 (USD THOUSAND)
TABLE 152 U.K. SURFACE ANALYSIS MARKET, BY METHOD TYPE, 2018-2032 (USD THOUSAND)
TABLE 153 U.K. SURFACE ANALYSIS MARKET, BY EQUIPMENT TYPE, 2018-2032 (USD THOUSAND)
TABLE 154 U.K. SCANNING PROBE MICROSCOPES (SPM)/ATOMIC FORCE MICROSCOPES (AFM) IN SURFACE ANALYSIS MARKET, BY OPERATION, 2018-2032 (USD THOUSAND)
TABLE 155 U.K. SCANNING PROBE MICROSCOPES (SPM)/ATOMIC FORCE MICROSCOPES (AFM) IN SURFACE ANALYSIS MARKET, BY NOISE LEVEL, 2018-2032 (USD THOUSAND)
TABLE 156 U.K. SURFACE ANALYSIS MARKET, BY APPLICATION, 2018-2032 (USD THOUSAND)
TABLE 157 U.K. SURFACE ANALYSIS MARKET, BY END USER, 2018-2032 (USD THOUSAND)
TABLE 158 U.K. INDUSTRIES IN SURFACE ANALYSIS MARKET, BY TYPE, 2018-2032 (USD THOUSAND)
TABLE 159 U.K. INDUSTRIES IN SURFACE ANALYSIS MARKET, BY TECHNOLOGY, 2018-2032 (USD THOUSAND)
TABLE 160 U.K. RESEARCH ORGANIZATION IN SURFACE ANALYSIS MARKET, BY TECHNOLOGY, 2018-2032 (USD THOUSAND)
TABLE 161 U.K. ACADEMIC INSTITUTES IN SURFACE ANALYSIS MARKET, BY TECHNOLOGY, 2018-2032 (USD THOUSAND)
TABLE 162 ITALY SURFACE ANALYSIS MARKET, BY TECHNOLOGY, 2018-2032 (USD THOUSAND)
TABLE 163 ITALY MICROSCOPY IN SURFACE ANALYSIS MARKET, BY METHOD, 2018-2032 (USD THOUSAND)
TABLE 164 ITALY MICROSCOPY IN SURFACE ANALYSIS MARKET, BY TECHNIQUE, 2018-2032 (USD THOUSAND)
TABLE 165 ITALY SURFACE ANALYSIS MARKET, BY TYPE, 2018-2032 (USD THOUSAND)
TABLE 166 ITALY SURFACE ANALYSIS MARKET, BY METHOD TYPE, 2018-2032 (USD THOUSAND)
TABLE 167 ITALY SURFACE ANALYSIS MARKET, BY EQUIPMENT TYPE, 2018-2032 (USD THOUSAND)
TABLE 168 ITALY SCANNING PROBE MICROSCOPES (SPM)/ATOMIC FORCE MICROSCOPES (AFM) IN SURFACE ANALYSIS MARKET, BY OPERATION, 2018-2032 (USD THOUSAND)
TABLE 169 ITALY SCANNING PROBE MICROSCOPES (SPM)/ATOMIC FORCE MICROSCOPES (AFM) IN SURFACE ANALYSIS MARKET, BY NOISE LEVEL, 2018-2032 (USD THOUSAND)
TABLE 170 ITALY SURFACE ANALYSIS MARKET, BY APPLICATION, 2018-2032 (USD THOUSAND)
TABLE 171 ITALY SURFACE ANALYSIS MARKET, BY END USER, 2018-2032 (USD THOUSAND)
TABLE 172 ITALY INDUSTRIES IN SURFACE ANALYSIS MARKET, BY TYPE, 2018-2032 (USD THOUSAND)
TABLE 173 ITALY INDUSTRIES IN SURFACE ANALYSIS MARKET, BY TECHNOLOGY, 2018-2032 (USD THOUSAND)
TABLE 174 ITALY RESEARCH ORGANIZATION IN SURFACE ANALYSIS MARKET, BY TECHNOLOGY, 2018-2032 (USD THOUSAND)
TABLE 175 ITALY ACADEMIC INSTITUTES IN SURFACE ANALYSIS MARKET, BY TECHNOLOGY, 2018-2032 (USD THOUSAND)
TABLE 176 SPAIN SURFACE ANALYSIS MARKET, BY TECHNOLOGY, 2018-2032 (USD THOUSAND)
TABLE 177 SPAIN MICROSCOPY IN SURFACE ANALYSIS MARKET, BY METHOD, 2018-2032 (USD THOUSAND)
TABLE 178 SPAIN MICROSCOPY IN SURFACE ANALYSIS MARKET, BY TECHNIQUE, 2018-2032 (USD THOUSAND)
TABLE 179 SPAIN SURFACE ANALYSIS MARKET, BY TYPE, 2018-2032 (USD THOUSAND)
TABLE 180 SPAIN SURFACE ANALYSIS MARKET, BY METHOD TYPE, 2018-2032 (USD THOUSAND)
TABLE 181 SPAIN SURFACE ANALYSIS MARKET, BY EQUIPMENT TYPE, 2018-2032 (USD THOUSAND)
TABLE 182 SPAIN SCANNING PROBE MICROSCOPES (SPM)/ATOMIC FORCE MICROSCOPES (AFM) IN SURFACE ANALYSIS MARKET, BY OPERATION, 2018-2032 (USD THOUSAND)
TABLE 183 SPAIN SCANNING PROBE MICROSCOPES (SPM)/ATOMIC FORCE MICROSCOPES (AFM) IN SURFACE ANALYSIS MARKET, BY NOISE LEVEL, 2018-2032 (USD THOUSAND)
TABLE 184 SPAIN SURFACE ANALYSIS MARKET, BY APPLICATION, 2018-2032 (USD THOUSAND)
TABLE 185 SPAIN SURFACE ANALYSIS MARKET, BY END USER, 2018-2032 (USD THOUSAND)
TABLE 186 SPAIN INDUSTRIES IN SURFACE ANALYSIS MARKET, BY TYPE, 2018-2032 (USD THOUSAND)
TABLE 187 SPAIN INDUSTRIES IN SURFACE ANALYSIS MARKET, BY TECHNOLOGY, 2018-2032 (USD THOUSAND)
TABLE 188 SPAIN RESEARCH ORGANIZATION IN SURFACE ANALYSIS MARKET, BY TECHNOLOGY, 2018-2032 (USD THOUSAND)
TABLE 189 SPAIN ACADEMIC INSTITUTES IN SURFACE ANALYSIS MARKET, BY TECHNOLOGY, 2018-2032 (USD THOUSAND)
TABLE 190 NETHERLANDS SURFACE ANALYSIS MARKET, BY TECHNOLOGY, 2018-2032 (USD THOUSAND)
TABLE 191 NETHERLANDS MICROSCOPY IN SURFACE ANALYSIS MARKET, BY METHOD, 2018-2032 (USD THOUSAND)
TABLE 192 NETHERLANDS MICROSCOPY IN SURFACE ANALYSIS MARKET, BY TECHNIQUE, 2018-2032 (USD THOUSAND)
TABLE 193 NETHERLANDS SURFACE ANALYSIS MARKET, BY TYPE, 2018-2032 (USD THOUSAND)
TABLE 194 NETHERLANDS SURFACE ANALYSIS MARKET, BY METHOD TYPE, 2018-2032 (USD THOUSAND)
TABLE 195 NETHERLANDS SURFACE ANALYSIS MARKET, BY EQUIPMENT TYPE, 2018-2032 (USD THOUSAND)
TABLE 196 NETHERLANDS SCANNING PROBE MICROSCOPES (SPM)/ATOMIC FORCE MICROSCOPES (AFM) IN SURFACE ANALYSIS MARKET, BY OPERATION, 2018-2032 (USD THOUSAND)
TABLE 197 NETHERLANDS SCANNING PROBE MICROSCOPES (SPM)/ATOMIC FORCE MICROSCOPES (AFM) IN SURFACE ANALYSIS MARKET, BY NOISE LEVEL, 2018-2032 (USD THOUSAND)
TABLE 198 NETHERLANDS SURFACE ANALYSIS MARKET, BY APPLICATION, 2018-2032 (USD THOUSAND)
TABLE 199 NETHERLANDS SURFACE ANALYSIS MARKET, BY END USER, 2018-2032 (USD THOUSAND)
TABLE 200 NETHERLANDS INDUSTRIES IN SURFACE ANALYSIS MARKET, BY TYPE, 2018-2032 (USD THOUSAND)
TABLE 201 NETHERLANDS INDUSTRIES IN SURFACE ANALYSIS MARKET, BY TECHNOLOGY, 2018-2032 (USD THOUSAND)
TABLE 202 NETHERLANDS RESEARCH ORGANIZATION IN SURFACE ANALYSIS MARKET, BY TECHNOLOGY, 2018-2032 (USD THOUSAND)
TABLE 203 NETHERLANDS ACADEMIC INSTITUTES IN SURFACE ANALYSIS MARKET, BY TECHNOLOGY, 2018-2032 (USD THOUSAND)
TABLE 204 SWITZERLAND SURFACE ANALYSIS MARKET, BY TECHNOLOGY, 2018-2032 (USD THOUSAND)
TABLE 205 SWITZERLAND MICROSCOPY IN SURFACE ANALYSIS MARKET, BY METHOD, 2018-2032 (USD THOUSAND)
TABLE 206 SWITZERLAND MICROSCOPY IN SURFACE ANALYSIS MARKET, BY TECHNIQUE, 2018-2032 (USD THOUSAND)
TABLE 207 SWITZERLAND SURFACE ANALYSIS MARKET, BY TYPE, 2018-2032 (USD THOUSAND)
TABLE 208 SWITZERLAND SURFACE ANALYSIS MARKET, BY METHOD TYPE, 2018-2032 (USD THOUSAND)
TABLE 209 SWITZERLAND SURFACE ANALYSIS MARKET, BY EQUIPMENT TYPE, 2018-2032 (USD THOUSAND)
TABLE 210 SWITZERLAND SCANNING PROBE MICROSCOPES (SPM)/ATOMIC FORCE MICROSCOPES (AFM) IN SURFACE ANALYSIS MARKET, BY OPERATION, 2018-2032 (USD THOUSAND)
TABLE 211 SWITZERLAND SCANNING PROBE MICROSCOPES (SPM)/ATOMIC FORCE MICROSCOPES (AFM) IN SURFACE ANALYSIS MARKET, BY NOISE LEVEL, 2018-2032 (USD THOUSAND)
TABLE 212 SWITZERLAND SURFACE ANALYSIS MARKET, BY APPLICATION, 2018-2032 (USD THOUSAND)
TABLE 213 SWITZERLAND SURFACE ANALYSIS MARKET, BY END USER, 2018-2032 (USD THOUSAND)
TABLE 214 SWITZERLAND INDUSTRIES IN SURFACE ANALYSIS MARKET, BY TYPE, 2018-2032 (USD THOUSAND)
TABLE 215 SWITZERLAND INDUSTRIES IN SURFACE ANALYSIS MARKET, BY TECHNOLOGY, 2018-2032 (USD THOUSAND)
TABLE 216 SWITZERLAND RESEARCH ORGANIZATION IN SURFACE ANALYSIS MARKET, BY TECHNOLOGY, 2018-2032 (USD THOUSAND)
TABLE 217 SWITZERLAND ACADEMIC INSTITUTES IN SURFACE ANALYSIS MARKET, BY TECHNOLOGY, 2018-2032 (USD THOUSAND)
TABLE 218 RUSSIA SURFACE ANALYSIS MARKET, BY TECHNOLOGY, 2018-2032 (USD THOUSAND)
TABLE 219 RUSSIA MICROSCOPY IN SURFACE ANALYSIS MARKET, BY METHOD, 2018-2032 (USD THOUSAND)
TABLE 220 RUSSIA MICROSCOPY IN SURFACE ANALYSIS MARKET, BY TECHNIQUE, 2018-2032 (USD THOUSAND)
TABLE 221 RUSSIA SURFACE ANALYSIS MARKET, BY TYPE, 2018-2032 (USD THOUSAND)
TABLE 222 RUSSIA SURFACE ANALYSIS MARKET, BY METHOD TYPE, 2018-2032 (USD THOUSAND)
TABLE 223 RUSSIA SURFACE ANALYSIS MARKET, BY EQUIPMENT TYPE, 2018-2032 (USD THOUSAND)
TABLE 224 RUSSIA SCANNING PROBE MICROSCOPES (SPM)/ATOMIC FORCE MICROSCOPES (AFM) IN SURFACE ANALYSIS MARKET, BY OPERATION, 2018-2032 (USD THOUSAND)
TABLE 225 RUSSIA SCANNING PROBE MICROSCOPES (SPM)/ATOMIC FORCE MICROSCOPES (AFM) IN SURFACE ANALYSIS MARKET, BY NOISE LEVEL, 2018-2032 (USD THOUSAND)
TABLE 226 RUSSIA SURFACE ANALYSIS MARKET, BY APPLICATION, 2018-2032 (USD THOUSAND)
TABLE 227 RUSSIA SURFACE ANALYSIS MARKET, BY END USER, 2018-2032 (USD THOUSAND)
TABLE 228 RUSSIA INDUSTRIES IN SURFACE ANALYSIS MARKET, BY TYPE, 2018-2032 (USD THOUSAND)
TABLE 229 RUSSIA INDUSTRIES IN SURFACE ANALYSIS MARKET, BY TECHNOLOGY, 2018-2032 (USD THOUSAND)
TABLE 230 RUSSIA RESEARCH ORGANIZATION IN SURFACE ANALYSIS MARKET, BY TECHNOLOGY, 2018-2032 (USD THOUSAND)
TABLE 231 RUSSIA ACADEMIC INSTITUTES IN SURFACE ANALYSIS MARKET, BY TECHNOLOGY, 2018-2032 (USD THOUSAND)
TABLE 232 TURKEY SURFACE ANALYSIS MARKET, BY TECHNOLOGY, 2018-2032 (USD THOUSAND)
TABLE 233 TURKEY MICROSCOPY IN SURFACE ANALYSIS MARKET, BY METHOD, 2018-2032 (USD THOUSAND)
TABLE 234 TURKEY MICROSCOPY IN SURFACE ANALYSIS MARKET, BY TECHNIQUE, 2018-2032 (USD THOUSAND)
TABLE 235 TURKEY SURFACE ANALYSIS MARKET, BY TYPE, 2018-2032 (USD THOUSAND)
TABLE 236 TURKEY SURFACE ANALYSIS MARKET, BY METHOD TYPE, 2018-2032 (USD THOUSAND)
TABLE 237 TURKEY SURFACE ANALYSIS MARKET, BY EQUIPMENT TYPE, 2018-2032 (USD THOUSAND)
TABLE 238 TURKEY SCANNING PROBE MICROSCOPES (SPM)/ATOMIC FORCE MICROSCOPES (AFM) IN SURFACE ANALYSIS MARKET, BY OPERATION, 2018-2032 (USD THOUSAND)
TABLE 239 TURKEY SCANNING PROBE MICROSCOPES (SPM)/ATOMIC FORCE MICROSCOPES (AFM) IN SURFACE ANALYSIS MARKET, BY NOISE LEVEL, 2018-2032 (USD THOUSAND)
TABLE 240 TURKEY SURFACE ANALYSIS MARKET, BY APPLICATION, 2018-2032 (USD THOUSAND)
TABLE 241 TURKEY SURFACE ANALYSIS MARKET, BY END USER, 2018-2032 (USD THOUSAND)
TABLE 242 TURKEY INDUSTRIES IN SURFACE ANALYSIS MARKET, BY TYPE, 2018-2032 (USD THOUSAND)
TABLE 243 TURKEY INDUSTRIES IN SURFACE ANALYSIS MARKET, BY TECHNOLOGY, 2018-2032 (USD THOUSAND)
TABLE 244 TURKEY RESEARCH ORGANIZATION IN SURFACE ANALYSIS MARKET, BY TECHNOLOGY, 2018-2032 (USD THOUSAND)
TABLE 245 TURKEY ACADEMIC INSTITUTES IN SURFACE ANALYSIS MARKET, BY TECHNOLOGY, 2018-2032 (USD THOUSAND)
TABLE 246 BELGIUM SURFACE ANALYSIS MARKET, BY TECHNOLOGY, 2018-2032 (USD THOUSAND)
TABLE 247 BELGIUM MICROSCOPY IN SURFACE ANALYSIS MARKET, BY METHOD, 2018-2032 (USD THOUSAND)
TABLE 248 BELGIUM MICROSCOPY IN SURFACE ANALYSIS MARKET, BY TECHNIQUE, 2018-2032 (USD THOUSAND)
TABLE 249 BELGIUM SURFACE ANALYSIS MARKET, BY TYPE, 2018-2032 (USD THOUSAND)
TABLE 250 BELGIUM SURFACE ANALYSIS MARKET, BY METHOD TYPE, 2018-2032 (USD THOUSAND)
TABLE 251 BELGIUM SURFACE ANALYSIS MARKET, BY EQUIPMENT TYPE, 2018-2032 (USD THOUSAND)
TABLE 252 BELGIUM SCANNING PROBE MICROSCOPES (SPM)/ATOMIC FORCE MICROSCOPES (AFM) IN SURFACE ANALYSIS MARKET, BY OPERATION, 2018-2032 (USD THOUSAND)
TABLE 253 BELGIUM SCANNING PROBE MICROSCOPES (SPM)/ATOMIC FORCE MICROSCOPES (AFM) IN SURFACE ANALYSIS MARKET, BY NOISE LEVEL, 2018-2032 (USD THOUSAND)
TABLE 254 BELGIUM SURFACE ANALYSIS MARKET, BY APPLICATION, 2018-2032 (USD THOUSAND)
TABLE 255 BELGIUM SURFACE ANALYSIS MARKET, BY END USER, 2018-2032 (USD THOUSAND)
TABLE 256 BELGIUM INDUSTRIES IN SURFACE ANALYSIS MARKET, BY TYPE, 2018-2032 (USD THOUSAND)
TABLE 257 BELGIUM INDUSTRIES IN SURFACE ANALYSIS MARKET, BY TECHNOLOGY, 2018-2032 (USD THOUSAND)
TABLE 258 BELGIUM RESEARCH ORGANIZATION IN SURFACE ANALYSIS MARKET, BY TECHNOLOGY, 2018-2032 (USD THOUSAND)
TABLE 259 BELGIUM ACADEMIC INSTITUTES IN SURFACE ANALYSIS MARKET, BY TECHNOLOGY, 2018-2032 (USD THOUSAND)
TABLE 260 REST OF EUROPE SURFACE ANALYSIS MARKET, BY TECHNOLOGY, 2018-2032 (USD THOUSAND)
TABLE 261 ASIA-PACIFIC SURFACE ANALYSIS MARKET, BY COUNTRY, 2018-2032 (USD THOUSAND)
TABLE 262 ASIA-PACIFIC SURFACE ANALYSIS MARKET, BY TECHNOLOGY, 2018-2032 (USD THOUSAND)
TABLE 263 ASIA-PACIFIC MICROSCOPY IN SURFACE ANALYSIS MARKET, BY METHOD, 2018-2032 (USD THOUSAND)
TABLE 264 ASIA-PACIFIC MICROSCOPY IN SURFACE ANALYSIS MARKET, BY TECHNIQUE, 2018-2032 (USD THOUSAND)
TABLE 265 ASIA-PACIFIC SURFACE ANALYSIS MARKET, BY TYPE, 2018-2032 (USD THOUSAND)
TABLE 266 ASIA-PACIFIC SURFACE ANALYSIS MARKET, BY METHOD TYPE, 2018-2032 (USD THOUSAND)
TABLE 267 ASIA-PACIFIC SURFACE ANALYSIS MARKET, BY EQUIPMENT TYPE, 2018-2032 (USD THOUSAND)
TABLE 268 ASIA-PACIFIC SCANNING PROBE MICROSCOPES (SPM)/ATOMIC FORCE MICROSCOPES (AFM) IN SURFACE ANALYSIS MARKET, BY OPERATION, 2018-2032 (USD THOUSAND)
TABLE 269 ASIA-PACIFIC SCANNING PROBE MICROSCOPES (SPM)/ATOMIC FORCE MICROSCOPES (AFM) IN SURFACE ANALYSIS MARKET, BY NOISE LEVEL, 2018-2032 (USD THOUSAND)
TABLE 270 ASIA-PACIFIC SURFACE ANALYSIS MARKET, BY APPLICATION, 2018-2032 (USD THOUSAND)
TABLE 271 ASIA-PACIFIC SURFACE ANALYSIS MARKET, BY END USER, 2018-2032 (USD THOUSAND)
TABLE 272 ASIA-PACIFIC INDUSTRIES IN SURFACE ANALYSIS MARKET, BY TYPE, 2018-2032 (USD THOUSAND)
TABLE 273 ASIA-PACIFIC INDUSTRIES IN SURFACE ANALYSIS MARKET, BY TECHNOLOGY, 2018-2032 (USD THOUSAND)
TABLE 274 ASIA-PACIFIC RESEARCH ORGANIZATION IN SURFACE ANALYSIS MARKET, BY TECHNOLOGY, 2018-2032 (USD THOUSAND)
TABLE 275 ASIA-PACIFIC ACADEMIC INSTITUTES IN SURFACE ANALYSIS MARKET, BY TECHNOLOGY, 2018-2032 (USD THOUSAND)
TABLE 276 CHINA SURFACE ANALYSIS MARKET, BY TECHNOLOGY, 2018-2032 (USD THOUSAND)
TABLE 277 CHINA MICROSCOPY IN SURFACE ANALYSIS MARKET, BY METHOD, 2018-2032 (USD THOUSAND)
TABLE 278 CHINA MICROSCOPY IN SURFACE ANALYSIS MARKET, BY TECHNIQUE, 2018-2032 (USD THOUSAND)
TABLE 279 CHINA SURFACE ANALYSIS MARKET, BY TYPE, 2018-2032 (USD THOUSAND)
TABLE 280 CHINA SURFACE ANALYSIS MARKET, BY METHOD TYPE, 2018-2032 (USD THOUSAND)
TABLE 281 CHINA SURFACE ANALYSIS MARKET, BY EQUIPMENT TYPE, 2018-2032 (USD THOUSAND)
TABLE 282 CHINA SCANNING PROBE MICROSCOPES (SPM)/ATOMIC FORCE MICROSCOPES (AFM) IN SURFACE ANALYSIS MARKET, BY OPERATION, 2018-2032 (USD THOUSAND)
TABLE 283 CHINA SCANNING PROBE MICROSCOPES (SPM)/ATOMIC FORCE MICROSCOPES (AFM) IN SURFACE ANALYSIS MARKET, BY NOISE LEVEL, 2018-2032 (USD THOUSAND)
TABLE 284 CHINA SURFACE ANALYSIS MARKET, BY APPLICATION, 2018-2032 (USD THOUSAND)
TABLE 285 CHINA SURFACE ANALYSIS MARKET, BY END USER, 2018-2032 (USD THOUSAND)
TABLE 286 CHINA INDUSTRIES IN SURFACE ANALYSIS MARKET, BY TYPE, 2018-2032 (USD THOUSAND)
TABLE 287 CHINA INDUSTRIES IN SURFACE ANALYSIS MARKET, BY TECHNOLOGY, 2018-2032 (USD THOUSAND)
TABLE 288 CHINA RESEARCH ORGANIZATION IN SURFACE ANALYSIS MARKET, BY TECHNOLOGY, 2018-2032 (USD THOUSAND)
TABLE 289 CHINA ACADEMIC INSTITUTES IN SURFACE ANALYSIS MARKET, BY TECHNOLOGY, 2018-2032 (USD THOUSAND)
TABLE 290 JAPAN SURFACE ANALYSIS MARKET, BY TECHNOLOGY, 2018-2032 (USD THOUSAND)
TABLE 291 JAPAN MICROSCOPY IN SURFACE ANALYSIS MARKET, BY METHOD, 2018-2032 (USD THOUSAND)
TABLE 292 JAPAN MICROSCOPY IN SURFACE ANALYSIS MARKET, BY TECHNIQUE, 2018-2032 (USD THOUSAND)
TABLE 293 JAPAN SURFACE ANALYSIS MARKET, BY TYPE, 2018-2032 (USD THOUSAND)
TABLE 294 JAPAN SURFACE ANALYSIS MARKET, BY METHOD TYPE, 2018-2032 (USD THOUSAND)
TABLE 295 JAPAN SURFACE ANALYSIS MARKET, BY EQUIPMENT TYPE, 2018-2032 (USD THOUSAND)
TABLE 296 JAPAN SCANNING PROBE MICROSCOPES (SPM)/ATOMIC FORCE MICROSCOPES (AFM) IN SURFACE ANALYSIS MARKET, BY OPERATION, 2018-2032 (USD THOUSAND)
TABLE 297 JAPAN SCANNING PROBE MICROSCOPES (SPM)/ATOMIC FORCE MICROSCOPES (AFM) IN SURFACE ANALYSIS MARKET, BY NOISE LEVEL, 2018-2032 (USD THOUSAND)
TABLE 298 JAPAN SURFACE ANALYSIS MARKET, BY APPLICATION, 2018-2032 (USD THOUSAND)
TABLE 299 JAPAN SURFACE ANALYSIS MARKET, BY END USER, 2018-2032 (USD THOUSAND)
TABLE 300 JAPAN INDUSTRIES IN SURFACE ANALYSIS MARKET, BY TYPE, 2018-2032 (USD THOUSAND)
TABLE 301 JAPAN INDUSTRIES IN SURFACE ANALYSIS MARKET, BY TECHNOLOGY, 2018-2032 (USD THOUSAND)
TABLE 302 JAPAN RESEARCH ORGANIZATION IN SURFACE ANALYSIS MARKET, BY TECHNOLOGY, 2018-2032 (USD THOUSAND)
TABLE 303 JAPAN ACADEMIC INSTITUTES IN SURFACE ANALYSIS MARKET, BY TECHNOLOGY, 2018-2032 (USD THOUSAND)
TABLE 304 SOUTH KOREA SURFACE ANALYSIS MARKET, BY TECHNOLOGY, 2018-2032 (USD THOUSAND)
TABLE 305 SOUTH KOREA MICROSCOPY IN SURFACE ANALYSIS MARKET, BY METHOD, 2018-2032 (USD THOUSAND)
TABLE 306 SOUTH KOREA MICROSCOPY IN SURFACE ANALYSIS MARKET, BY TECHNIQUE, 2018-2032 (USD THOUSAND)
TABLE 307 SOUTH KOREA SURFACE ANALYSIS MARKET, BY TYPE, 2018-2032 (USD THOUSAND)
TABLE 308 SOUTH KOREA SURFACE ANALYSIS MARKET, BY METHOD TYPE, 2018-2032 (USD THOUSAND)
TABLE 309 SOUTH KOREA SURFACE ANALYSIS MARKET, BY EQUIPMENT TYPE, 2018-2032 (USD THOUSAND)
TABLE 310 SOUTH KOREA SCANNING PROBE MICROSCOPES (SPM)/ATOMIC FORCE MICROSCOPES (AFM) IN SURFACE ANALYSIS MARKET, BY OPERATION, 2018-2032 (USD THOUSAND)
TABLE 311 SOUTH KOREA SCANNING PROBE MICROSCOPES (SPM)/ATOMIC FORCE MICROSCOPES (AFM) IN SURFACE ANALYSIS MARKET, BY NOISE LEVEL, 2018-2032 (USD THOUSAND)
TABLE 312 SOUTH KOREA SURFACE ANALYSIS MARKET, BY APPLICATION, 2018-2032 (USD THOUSAND)
TABLE 313 SOUTH KOREA SURFACE ANALYSIS MARKET, BY END USER, 2018-2032 (USD THOUSAND)
TABLE 314 SOUTH KOREA INDUSTRIES IN SURFACE ANALYSIS MARKET, BY TYPE, 2018-2032 (USD THOUSAND)
TABLE 315 SOUTH KOREA INDUSTRIES IN SURFACE ANALYSIS MARKET, BY TECHNOLOGY, 2018-2032 (USD THOUSAND)
TABLE 316 SOUTH KOREA RESEARCH ORGANIZATION IN SURFACE ANALYSIS MARKET, BY TECHNOLOGY, 2018-2032 (USD THOUSAND)
TABLE 317 SOUTH KOREA ACADEMIC INSTITUTES IN SURFACE ANALYSIS MARKET, BY TECHNOLOGY, 2018-2032 (USD THOUSAND)
TABLE 318 INDIA SURFACE ANALYSIS MARKET, BY TECHNOLOGY, 2018-2032 (USD THOUSAND)
TABLE 319 INDIA MICROSCOPY IN SURFACE ANALYSIS MARKET, BY METHOD, 2018-2032 (USD THOUSAND)
TABLE 320 INDIA MICROSCOPY IN SURFACE ANALYSIS MARKET, BY TECHNIQUE, 2018-2032 (USD THOUSAND)
TABLE 321 INDIA SURFACE ANALYSIS MARKET, BY TYPE, 2018-2032 (USD THOUSAND)
TABLE 322 INDIA SURFACE ANALYSIS MARKET, BY METHOD TYPE, 2018-2032 (USD THOUSAND)
TABLE 323 INDIA SURFACE ANALYSIS MARKET, BY EQUIPMENT TYPE, 2018-2032 (USD THOUSAND)
TABLE 324 INDIA SCANNING PROBE MICROSCOPES (SPM)/ATOMIC FORCE MICROSCOPES (AFM) IN SURFACE ANALYSIS MARKET, BY OPERATION, 2018-2032 (USD THOUSAND)
TABLE 325 INDIA SCANNING PROBE MICROSCOPES (SPM)/ATOMIC FORCE MICROSCOPES (AFM) IN SURFACE ANALYSIS MARKET, BY NOISE LEVEL, 2018-2032 (USD THOUSAND)
TABLE 326 INDIA SURFACE ANALYSIS MARKET, BY APPLICATION, 2018-2032 (USD THOUSAND)
TABLE 327 INDIA SURFACE ANALYSIS MARKET, BY END USER, 2018-2032 (USD THOUSAND)
TABLE 328 INDIA INDUSTRIES IN SURFACE ANALYSIS MARKET, BY TYPE, 2018-2032 (USD THOUSAND)
TABLE 329 INDIA INDUSTRIES IN SURFACE ANALYSIS MARKET, BY TECHNOLOGY, 2018-2032 (USD THOUSAND)
TABLE 330 INDIA RESEARCH ORGANIZATION IN SURFACE ANALYSIS MARKET, BY TECHNOLOGY, 2018-2032 (USD THOUSAND)
TABLE 331 INDIA ACADEMIC INSTITUTES IN SURFACE ANALYSIS MARKET, BY TECHNOLOGY, 2018-2032 (USD THOUSAND)
TABLE 332 AUSTRALIA SURFACE ANALYSIS MARKET, BY TECHNOLOGY, 2018-2032 (USD THOUSAND)
TABLE 333 AUSTRALIA MICROSCOPY IN SURFACE ANALYSIS MARKET, BY METHOD, 2018-2032 (USD THOUSAND)
TABLE 334 AUSTRALIA MICROSCOPY IN SURFACE ANALYSIS MARKET, BY TECHNIQUE, 2018-2032 (USD THOUSAND)
TABLE 335 AUSTRALIA SURFACE ANALYSIS MARKET, BY TYPE, 2018-2032 (USD THOUSAND)
TABLE 336 AUSTRALIA SURFACE ANALYSIS MARKET, BY METHOD TYPE, 2018-2032 (USD THOUSAND)
TABLE 337 AUSTRALIA SURFACE ANALYSIS MARKET, BY EQUIPMENT TYPE, 2018-2032 (USD THOUSAND)
TABLE 338 AUSTRALIA SCANNING PROBE MICROSCOPES (SPM)/ATOMIC FORCE MICROSCOPES (AFM) IN SURFACE ANALYSIS MARKET, BY OPERATION, 2018-2032 (USD THOUSAND)
TABLE 339 AUSTRALIA SCANNING PROBE MICROSCOPES (SPM)/ATOMIC FORCE MICROSCOPES (AFM) IN SURFACE ANALYSIS MARKET, BY NOISE LEVEL, 2018-2032 (USD THOUSAND)
TABLE 340 AUSTRALIA SURFACE ANALYSIS MARKET, BY APPLICATION, 2018-2032 (USD THOUSAND)
TABLE 341 AUSTRALIA SURFACE ANALYSIS MARKET, BY END USER, 2018-2032 (USD THOUSAND)
TABLE 342 AUSTRALIA INDUSTRIES IN SURFACE ANALYSIS MARKET, BY TYPE, 2018-2032 (USD THOUSAND)
TABLE 343 AUSTRALIA INDUSTRIES IN SURFACE ANALYSIS MARKET, BY TECHNOLOGY, 2018-2032 (USD THOUSAND)
TABLE 344 AUSTRALIA RESEARCH ORGANIZATION IN SURFACE ANALYSIS MARKET, BY TECHNOLOGY, 2018-2032 (USD THOUSAND)
TABLE 345 AUSTRALIA ACADEMIC INSTITUTES IN SURFACE ANALYSIS MARKET, BY TECHNOLOGY, 2018-2032 (USD THOUSAND)
TABLE 346 SINGAPORE SURFACE ANALYSIS MARKET, BY TECHNOLOGY, 2018-2032 (USD THOUSAND)
TABLE 347 SINGAPORE MICROSCOPY IN SURFACE ANALYSIS MARKET, BY METHOD, 2018-2032 (USD THOUSAND)
TABLE 348 SINGAPORE MICROSCOPY IN SURFACE ANALYSIS MARKET, BY TECHNIQUE, 2018-2032 (USD THOUSAND)
TABLE 349 SINGAPORE SURFACE ANALYSIS MARKET, BY TYPE, 2018-2032 (USD THOUSAND)
TABLE 350 SINGAPORE SURFACE ANALYSIS MARKET, BY METHOD TYPE, 2018-2032 (USD THOUSAND)
TABLE 351 SINGAPORE SURFACE ANALYSIS MARKET, BY EQUIPMENT TYPE, 2018-2032 (USD THOUSAND)
TABLE 352 SINGAPORE SCANNING PROBE MICROSCOPES (SPM)/ATOMIC FORCE MICROSCOPES (AFM) IN SURFACE ANALYSIS MARKET, BY OPERATION, 2018-2032 (USD THOUSAND)
TABLE 353 SINGAPORE SCANNING PROBE MICROSCOPES (SPM)/ATOMIC FORCE MICROSCOPES (AFM) IN SURFACE ANALYSIS MARKET, BY NOISE LEVEL, 2018-2032 (USD THOUSAND)
TABLE 354 SINGAPORE SURFACE ANALYSIS MARKET, BY APPLICATION, 2018-2032 (USD THOUSAND)
TABLE 355 SINGAPORE SURFACE ANALYSIS MARKET, BY END USER, 2018-2032 (USD THOUSAND)
TABLE 356 SINGAPORE INDUSTRIES IN SURFACE ANALYSIS MARKET, BY TYPE, 2018-2032 (USD THOUSAND)
TABLE 357 SINGAPORE INDUSTRIES IN SURFACE ANALYSIS MARKET, BY TECHNOLOGY, 2018-2032 (USD THOUSAND)
TABLE 358 SINGAPORE RESEARCH ORGANIZATION IN SURFACE ANALYSIS MARKET, BY TECHNOLOGY, 2018-2032 (USD THOUSAND)
TABLE 359 SINGAPORE ACADEMIC INSTITUTES IN SURFACE ANALYSIS MARKET, BY TECHNOLOGY, 2018-2032 (USD THOUSAND)
TABLE 360 INDONESIA SURFACE ANALYSIS MARKET, BY TECHNOLOGY, 2018-2032 (USD THOUSAND)
TABLE 361 INDONESIA MICROSCOPY IN SURFACE ANALYSIS MARKET, BY METHOD, 2018-2032 (USD THOUSAND)
TABLE 362 INDONESIA MICROSCOPY IN SURFACE ANALYSIS MARKET, BY TECHNIQUE, 2018-2032 (USD THOUSAND)
TABLE 363 INDONESIA SURFACE ANALYSIS MARKET, BY TYPE, 2018-2032 (USD THOUSAND)
TABLE 364 INDONESIA SURFACE ANALYSIS MARKET, BY METHOD TYPE, 2018-2032 (USD THOUSAND)
TABLE 365 INDONESIA SURFACE ANALYSIS MARKET, BY EQUIPMENT TYPE, 2018-2032 (USD THOUSAND)
TABLE 366 INDONESIA SCANNING PROBE MICROSCOPES (SPM)/ATOMIC FORCE MICROSCOPES (AFM) IN SURFACE ANALYSIS MARKET, BY OPERATION, 2018-2032 (USD THOUSAND)
TABLE 367 INDONESIA SCANNING PROBE MICROSCOPES (SPM)/ATOMIC FORCE MICROSCOPES (AFM) IN SURFACE ANALYSIS MARKET, BY NOISE LEVEL, 2018-2032 (USD THOUSAND)
TABLE 368 INDONESIA SURFACE ANALYSIS MARKET, BY APPLICATION, 2018-2032 (USD THOUSAND)
TABLE 369 INDONESIA SURFACE ANALYSIS MARKET, BY END USER, 2018-2032 (USD THOUSAND)
TABLE 370 INDONESIA INDUSTRIES IN SURFACE ANALYSIS MARKET, BY TYPE, 2018-2032 (USD THOUSAND)
TABLE 371 INDONESIA INDUSTRIES IN SURFACE ANALYSIS MARKET, BY TECHNOLOGY, 2018-2032 (USD THOUSAND)
TABLE 372 INDONESIA RESEARCH ORGANIZATION IN SURFACE ANALYSIS MARKET, BY TECHNOLOGY, 2018-2032 (USD THOUSAND)
TABLE 373 INDONESIA ACADEMIC INSTITUTES IN SURFACE ANALYSIS MARKET, BY TECHNOLOGY, 2018-2032 (USD THOUSAND)
TABLE 374 THAILAND SURFACE ANALYSIS MARKET, BY TECHNOLOGY, 2018-2032 (USD THOUSAND)
TABLE 375 THAILAND MICROSCOPY IN SURFACE ANALYSIS MARKET, BY METHOD, 2018-2032 (USD THOUSAND)
TABLE 376 THAILAND MICROSCOPY IN SURFACE ANALYSIS MARKET, BY TECHNIQUE, 2018-2032 (USD THOUSAND)
TABLE 377 THAILAND SURFACE ANALYSIS MARKET, BY TYPE, 2018-2032 (USD THOUSAND)
TABLE 378 THAILAND SURFACE ANALYSIS MARKET, BY METHOD TYPE, 2018-2032 (USD THOUSAND)
TABLE 379 THAILAND SURFACE ANALYSIS MARKET, BY EQUIPMENT TYPE, 2018-2032 (USD THOUSAND)
TABLE 380 THAILAND SCANNING PROBE MICROSCOPES (SPM)/ATOMIC FORCE MICROSCOPES (AFM) IN SURFACE ANALYSIS MARKET, BY OPERATION, 2018-2032 (USD THOUSAND)
TABLE 381 THAILAND SCANNING PROBE MICROSCOPES (SPM)/ATOMIC FORCE MICROSCOPES (AFM) IN SURFACE ANALYSIS MARKET, BY NOISE LEVEL, 2018-2032 (USD THOUSAND)
TABLE 382 THAILAND SURFACE ANALYSIS MARKET, BY APPLICATION, 2018-2032 (USD THOUSAND)
TABLE 383 THAILAND SURFACE ANALYSIS MARKET, BY END USER, 2018-2032 (USD THOUSAND)
TABLE 384 THAILAND INDUSTRIES IN SURFACE ANALYSIS MARKET, BY TYPE, 2018-2032 (USD THOUSAND)
TABLE 385 THAILAND INDUSTRIES IN SURFACE ANALYSIS MARKET, BY TECHNOLOGY, 2018-2032 (USD THOUSAND)
TABLE 386 THAILAND RESEARCH ORGANIZATION IN SURFACE ANALYSIS MARKET, BY TECHNOLOGY, 2018-2032 (USD THOUSAND)
TABLE 387 THAILAND ACADEMIC INSTITUTES IN SURFACE ANALYSIS MARKET, BY TECHNOLOGY, 2018-2032 (USD THOUSAND)
TABLE 388 MALAYSIA SURFACE ANALYSIS MARKET, BY TECHNOLOGY, 2018-2032 (USD THOUSAND)
TABLE 389 MALAYSIA MICROSCOPY IN SURFACE ANALYSIS MARKET, BY METHOD, 2018-2032 (USD THOUSAND)
TABLE 390 MALAYSIA MICROSCOPY IN SURFACE ANALYSIS MARKET, BY TECHNIQUE, 2018-2032 (USD THOUSAND)
TABLE 391 MALAYSIA SURFACE ANALYSIS MARKET, BY TYPE, 2018-2032 (USD THOUSAND)
TABLE 392 MALAYSIA SURFACE ANALYSIS MARKET, BY METHOD TYPE, 2018-2032 (USD THOUSAND)
TABLE 393 MALAYSIA SURFACE ANALYSIS MARKET, BY EQUIPMENT TYPE, 2018-2032 (USD THOUSAND)
TABLE 394 MALAYSIA SCANNING PROBE MICROSCOPES (SPM)/ATOMIC FORCE MICROSCOPES (AFM) IN SURFACE ANALYSIS MARKET, BY OPERATION, 2018-2032 (USD THOUSAND)
TABLE 395 MALAYSIA SCANNING PROBE MICROSCOPES (SPM)/ATOMIC FORCE MICROSCOPES (AFM) IN SURFACE ANALYSIS MARKET, BY NOISE LEVEL, 2018-2032 (USD THOUSAND)
TABLE 396 MALAYSIA SURFACE ANALYSIS MARKET, BY APPLICATION, 2018-2032 (USD THOUSAND)
TABLE 397 MALAYSIA SURFACE ANALYSIS MARKET, BY END USER, 2018-2032 (USD THOUSAND)
TABLE 398 MALAYSIA INDUSTRIES IN SURFACE ANALYSIS MARKET, BY TYPE, 2018-2032 (USD THOUSAND)
TABLE 399 MALAYSIA INDUSTRIES IN SURFACE ANALYSIS MARKET, BY TECHNOLOGY, 2018-2032 (USD THOUSAND)
TABLE 400 MALAYSIA RESEARCH ORGANIZATION IN SURFACE ANALYSIS MARKET, BY TECHNOLOGY, 2018-2032 (USD THOUSAND)
TABLE 401 MALAYSIA ACADEMIC INSTITUTES IN SURFACE ANALYSIS MARKET, BY TECHNOLOGY, 2018-2032 (USD THOUSAND)
TABLE 402 PHILIPPINES SURFACE ANALYSIS MARKET, BY TECHNOLOGY, 2018-2032 (USD THOUSAND)
TABLE 403 PHILIPPINES MICROSCOPY IN SURFACE ANALYSIS MARKET, BY METHOD, 2018-2032 (USD THOUSAND)
TABLE 404 PHILIPPINES MICROSCOPY IN SURFACE ANALYSIS MARKET, BY TECHNIQUE, 2018-2032 (USD THOUSAND)
TABLE 405 PHILIPPINES SURFACE ANALYSIS MARKET, BY TYPE, 2018-2032 (USD THOUSAND)
TABLE 406 PHILIPPINES SURFACE ANALYSIS MARKET, BY METHOD TYPE, 2018-2032 (USD THOUSAND)
TABLE 407 PHILIPPINES SURFACE ANALYSIS MARKET, BY EQUIPMENT TYPE, 2018-2032 (USD THOUSAND)
TABLE 408 PHILIPPINES SCANNING PROBE MICROSCOPES (SPM)/ATOMIC FORCE MICROSCOPES (AFM) IN SURFACE ANALYSIS MARKET, BY OPERATION, 2018-2032 (USD THOUSAND)
TABLE 409 PHILIPPINES SCANNING PROBE MICROSCOPES (SPM)/ATOMIC FORCE MICROSCOPES (AFM) IN SURFACE ANALYSIS MARKET, BY NOISE LEVEL, 2018-2032 (USD THOUSAND)
TABLE 410 PHILIPPINES SURFACE ANALYSIS MARKET, BY APPLICATION, 2018-2032 (USD THOUSAND)
TABLE 411 PHILIPPINES SURFACE ANALYSIS MARKET, BY END USER, 2018-2032 (USD THOUSAND)
TABLE 412 PHILIPPINES INDUSTRIES IN SURFACE ANALYSIS MARKET, BY TYPE, 2018-2032 (USD THOUSAND)
TABLE 413 PHILIPPINES INDUSTRIES IN SURFACE ANALYSIS MARKET, BY TECHNOLOGY, 2018-2032 (USD THOUSAND)
TABLE 414 PHILIPPINES RESEARCH ORGANIZATION IN SURFACE ANALYSIS MARKET, BY TECHNOLOGY, 2018-2032 (USD THOUSAND)
TABLE 415 PHILIPPINES ACADEMIC INSTITUTES IN SURFACE ANALYSIS MARKET, BY TECHNOLOGY, 2018-2032 (USD THOUSAND)
TABLE 416 NEW-ZEALAND SURFACE ANALYSIS MARKET, BY TECHNOLOGY, 2018-2032 (USD THOUSAND)
TABLE 417 NEW-ZEALAND MICROSCOPY IN SURFACE ANALYSIS MARKET, BY METHOD, 2018-2032 (USD THOUSAND)
TABLE 418 NEW-ZEALAND MICROSCOPY IN SURFACE ANALYSIS MARKET, BY TECHNIQUE, 2018-2032 (USD THOUSAND)
TABLE 419 NEW-ZEALAND SURFACE ANALYSIS MARKET, BY TYPE, 2018-2032 (USD THOUSAND)
TABLE 420 NEW-ZEALAND SURFACE ANALYSIS MARKET, BY METHOD TYPE, 2018-2032 (USD THOUSAND)
TABLE 421 NEW-ZEALAND SURFACE ANALYSIS MARKET, BY EQUIPMENT TYPE, 2018-2032 (USD THOUSAND)
TABLE 422 NEW-ZEALAND SCANNING PROBE MICROSCOPES (SPM)/ATOMIC FORCE MICROSCOPES (AFM) IN SURFACE ANALYSIS MARKET, BY OPERATION, 2018-2032 (USD THOUSAND)
TABLE 423 NEW-ZEALAND SCANNING PROBE MICROSCOPES (SPM)/ATOMIC FORCE MICROSCOPES (AFM) IN SURFACE ANALYSIS MARKET, BY NOISE LEVEL, 2018-2032 (USD THOUSAND)
TABLE 424 NEW-ZEALAND SURFACE ANALYSIS MARKET, BY APPLICATION, 2018-2032 (USD THOUSAND)
TABLE 425 NEW-ZEALAND SURFACE ANALYSIS MARKET, BY END USER, 2018-2032 (USD THOUSAND)
TABLE 426 NEW-ZEALAND INDUSTRIES IN SURFACE ANALYSIS MARKET, BY TYPE, 2018-2032 (USD THOUSAND)
TABLE 427 NEW-ZEALAND INDUSTRIES IN SURFACE ANALYSIS MARKET, BY TECHNOLOGY, 2018-2032 (USD THOUSAND)
TABLE 428 NEW-ZEALAND RESEARCH ORGANIZATION IN SURFACE ANALYSIS MARKET, BY TECHNOLOGY, 2018-2032 (USD THOUSAND)
TABLE 429 NEW-ZEALAND ACADEMIC INSTITUTES IN SURFACE ANALYSIS MARKET, BY TECHNOLOGY, 2018-2032 (USD THOUSAND)
TABLE 430 REST OF ASIA-PACIFIC SURFACE ANALYSIS MARKET, BY TECHNOLOGY, 2018-2032 (USD THOUSAND)
TABLE 431 SOUTH AMERICA SURFACE ANALYSIS MARKET, BY COUNTRY, 2018-2032 (USD THOUSAND)
TABLE 432 SOUTH AMERICA SURFACE ANALYSIS MARKET, BY TECHNOLOGY, 2018-2032 (USD THOUSAND)
TABLE 433 SOUTH AMERICA MICROSCOPY IN SURFACE ANALYSIS MARKET, BY METHOD, 2018-2032 (USD THOUSAND)
TABLE 434 SOUTH AMERICA MICROSCOPY IN SURFACE ANALYSIS MARKET, BY TECHNIQUE, 2018-2032 (USD THOUSAND)
TABLE 435 SOUTH AMERICA SURFACE ANALYSIS MARKET, BY TYPE, 2018-2032 (USD THOUSAND)
TABLE 436 SOUTH AMERICA SURFACE ANALYSIS MARKET, BY METHOD TYPE, 2018-2032 (USD THOUSAND)
TABLE 437 SOUTH AMERICA SURFACE ANALYSIS MARKET, BY EQUIPMENT TYPE, 2018-2032 (USD THOUSAND)
TABLE 438 SOUTH AMERICA SCANNING PROBE MICROSCOPES (SPM)/ATOMIC FORCE MICROSCOPES (AFM) IN SURFACE ANALYSIS MARKET, BY OPERATION, 2018-2032 (USD THOUSAND)
TABLE 439 SOUTH AMERICA SCANNING PROBE MICROSCOPES (SPM)/ATOMIC FORCE MICROSCOPES (AFM) IN SURFACE ANALYSIS MARKET, BY NOISE LEVEL, 2018-2032 (USD THOUSAND)
TABLE 440 SOUTH AMERICA SURFACE ANALYSIS MARKET, BY APPLICATION, 2018-2032 (USD THOUSAND)
TABLE 441 SOUTH AMERICA SURFACE ANALYSIS MARKET, BY END USER, 2018-2032 (USD THOUSAND)
TABLE 442 SOUTH AMERICA INDUSTRIES IN SURFACE ANALYSIS MARKET, BY TYPE, 2018-2032 (USD THOUSAND)
TABLE 443 SOUTH AMERICA INDUSTRIES IN SURFACE ANALYSIS MARKET, BY TECHNOLOGY, 2018-2032 (USD THOUSAND)
TABLE 444 SOUTH AMERICA RESEARCH ORGANIZATION IN SURFACE ANALYSIS MARKET, BY TECHNOLOGY, 2018-2032 (USD THOUSAND)
TABLE 445 SOUTH AMERICA ACADEMIC INSTITUTES IN SURFACE ANALYSIS MARKET, BY TECHNOLOGY, 2018-2032 (USD THOUSAND)
TABLE 446 BRAZIL SURFACE ANALYSIS MARKET, BY TECHNOLOGY, 2018-2032 (USD THOUSAND)
TABLE 447 BRAZIL MICROSCOPY IN SURFACE ANALYSIS MARKET, BY METHOD, 2018-2032 (USD THOUSAND)
TABLE 448 BRAZIL MICROSCOPY IN SURFACE ANALYSIS MARKET, BY TECHNIQUE, 2018-2032 (USD THOUSAND)
TABLE 449 BRAZIL SURFACE ANALYSIS MARKET, BY TYPE, 2018-2032 (USD THOUSAND)
TABLE 450 BRAZIL SURFACE ANALYSIS MARKET, BY METHOD TYPE, 2018-2032 (USD THOUSAND)
TABLE 451 BRAZIL SURFACE ANALYSIS MARKET, BY EQUIPMENT TYPE, 2018-2032 (USD THOUSAND)
TABLE 452 BRAZIL SCANNING PROBE MICROSCOPES (SPM)/ATOMIC FORCE MICROSCOPES (AFM) IN SURFACE ANALYSIS MARKET, BY OPERATION, 2018-2032 (USD THOUSAND)
TABLE 453 BRAZIL SCANNING PROBE MICROSCOPES (SPM)/ATOMIC FORCE MICROSCOPES (AFM) IN SURFACE ANALYSIS MARKET, BY NOISE LEVEL, 2018-2032 (USD THOUSAND)
TABLE 454 BRAZIL SURFACE ANALYSIS MARKET, BY APPLICATION, 2018-2032 (USD THOUSAND)
TABLE 455 BRAZIL SURFACE ANALYSIS MARKET, BY END USER, 2018-2032 (USD THOUSAND)
TABLE 456 BRAZIL INDUSTRIES IN SURFACE ANALYSIS MARKET, BY TYPE, 2018-2032 (USD THOUSAND)
TABLE 457 BRAZIL INDUSTRIES IN SURFACE ANALYSIS MARKET, BY TECHNOLOGY, 2018-2032 (USD THOUSAND)
TABLE 458 BRAZIL RESEARCH ORGANIZATION IN SURFACE ANALYSIS MARKET, BY TECHNOLOGY, 2018-2032 (USD THOUSAND)
TABLE 459 BRAZIL ACADEMIC INSTITUTES IN SURFACE ANALYSIS MARKET, BY TECHNOLOGY, 2018-2032 (USD THOUSAND)
TABLE 460 ARGENTINA SURFACE ANALYSIS MARKET, BY TECHNOLOGY, 2018-2032 (USD THOUSAND)
TABLE 461 ARGENTINA MICROSCOPY IN SURFACE ANALYSIS MARKET, BY METHOD, 2018-2032 (USD THOUSAND)
TABLE 462 ARGENTINA MICROSCOPY IN SURFACE ANALYSIS MARKET, BY TECHNIQUE, 2018-2032 (USD THOUSAND)
TABLE 463 ARGENTINA SURFACE ANALYSIS MARKET, BY TYPE, 2018-2032 (USD THOUSAND)
TABLE 464 ARGENTINA SURFACE ANALYSIS MARKET, BY METHOD TYPE, 2018-2032 (USD THOUSAND)
TABLE 465 ARGENTINA SURFACE ANALYSIS MARKET, BY EQUIPMENT TYPE, 2018-2032 (USD THOUSAND)
TABLE 466 ARGENTINA SCANNING PROBE MICROSCOPES (SPM)/ATOMIC FORCE MICROSCOPES (AFM) IN SURFACE ANALYSIS MARKET, BY OPERATION, 2018-2032 (USD THOUSAND)
TABLE 467 ARGENTINA SCANNING PROBE MICROSCOPES (SPM)/ATOMIC FORCE MICROSCOPES (AFM) IN SURFACE ANALYSIS MARKET, BY NOISE LEVEL, 2018-2032 (USD THOUSAND)
TABLE 468 ARGENTINA SURFACE ANALYSIS MARKET, BY APPLICATION, 2018-2032 (USD THOUSAND)
TABLE 469 ARGENTINA SURFACE ANALYSIS MARKET, BY END USER, 2018-2032 (USD THOUSAND)
TABLE 470 ARGENTINA INDUSTRIES IN SURFACE ANALYSIS MARKET, BY TYPE, 2018-2032 (USD THOUSAND)
TABLE 471 ARGENTINA INDUSTRIES IN SURFACE ANALYSIS MARKET, BY TECHNOLOGY, 2018-2032 (USD THOUSAND)
TABLE 472 ARGENTINA RESEARCH ORGANIZATION IN SURFACE ANALYSIS MARKET, BY TECHNOLOGY, 2018-2032 (USD THOUSAND)
TABLE 473 ARGENTINA ACADEMIC INSTITUTES IN SURFACE ANALYSIS MARKET, BY TECHNOLOGY, 2018-2032 (USD THOUSAND)
TABLE 474 REST OF SOUTH AMERICA SURFACE ANALYSIS MARKET, BY TECHNOLOGY, 2018-2032 (USD THOUSAND)
TABLE 475 MIDDLE EAST AND AFRICA SURFACE ANALYSIS MARKET, BY COUNTRY, 2018-2032 (USD THOUSAND)
TABLE 476 MIDDLE EAST AND AFRICA SURFACE ANALYSIS MARKET, BY TECHNOLOGY, 2018-2032 (USD THOUSAND)
TABLE 477 MIDDLE EAST AND AFRICA MICROSCOPY IN SURFACE ANALYSIS MARKET, BY METHOD, 2018-2032 (USD THOUSAND)
TABLE 478 MIDDLE EAST AND AFRICA MICROSCOPY IN SURFACE ANALYSIS MARKET, BY TECHNIQUE, 2018-2032 (USD THOUSAND)
TABLE 479 MIDDLE EAST AND AFRICA SURFACE ANALYSIS MARKET, BY TYPE, 2018-2032 (USD THOUSAND)
TABLE 480 MIDDLE EAST AND AFRICA SURFACE ANALYSIS MARKET, BY METHOD TYPE, 2018-2032 (USD THOUSAND)
TABLE 481 MIDDLE EAST AND AFRICA SURFACE ANALYSIS MARKET, BY EQUIPMENT TYPE, 2018-2032 (USD THOUSAND)
TABLE 482 MIDDLE EAST AND AFRICA SCANNING PROBE MICROSCOPES (SPM)/ATOMIC FORCE MICROSCOPES (AFM) IN SURFACE ANALYSIS MARKET, BY OPERATION, 2018-2032 (USD THOUSAND)
TABLE 483 MIDDLE EAST AND AFRICA SCANNING PROBE MICROSCOPES (SPM)/ATOMIC FORCE MICROSCOPES (AFM) IN SURFACE ANALYSIS MARKET, BY NOISE LEVEL, 2018-2032 (USD THOUSAND)
TABLE 484 MIDDLE EAST AND AFRICA SURFACE ANALYSIS MARKET, BY APPLICATION, 2018-2032 (USD THOUSAND)
TABLE 485 MIDDLE EAST AND AFRICA SURFACE ANALYSIS MARKET, BY END USER, 2018-2032 (USD THOUSAND)
TABLE 486 MIDDLE EAST AND AFRICA INDUSTRIES IN SURFACE ANALYSIS MARKET, BY TYPE, 2018-2032 (USD THOUSAND)
TABLE 487 MIDDLE EAST AND AFRICA INDUSTRIES IN SURFACE ANALYSIS MARKET, BY TECHNOLOGY, 2018-2032 (USD THOUSAND)
TABLE 488 MIDDLE EAST AND AFRICA RESEARCH ORGANIZATION IN SURFACE ANALYSIS MARKET, BY TECHNOLOGY, 2018-2032 (USD THOUSAND)
TABLE 489 MIDDLE EAST AND AFRICA ACADEMIC INSTITUTES IN SURFACE ANALYSIS MARKET, BY TECHNOLOGY, 2018-2032 (USD THOUSAND)
TABLE 490 SAUDI ARABIA SURFACE ANALYSIS MARKET, BY TECHNOLOGY, 2018-2032 (USD THOUSAND)
TABLE 491 SAUDI ARABIA MICROSCOPY IN SURFACE ANALYSIS MARKET, BY METHOD, 2018-2032 (USD THOUSAND)
TABLE 492 SAUDI ARABIA MICROSCOPY IN SURFACE ANALYSIS MARKET, BY TECHNIQUE, 2018-2032 (USD THOUSAND)
TABLE 493 SAUDI ARABIA SURFACE ANALYSIS MARKET, BY TYPE, 2018-2032 (USD THOUSAND)
TABLE 494 SAUDI ARABIA SURFACE ANALYSIS MARKET, BY METHOD TYPE, 2018-2032 (USD THOUSAND)
TABLE 495 SAUDI ARABIA SURFACE ANALYSIS MARKET, BY EQUIPMENT TYPE, 2018-2032 (USD THOUSAND)
TABLE 496 SAUDI ARABIA SCANNING PROBE MICROSCOPES (SPM)/ATOMIC FORCE MICROSCOPES (AFM) IN SURFACE ANALYSIS MARKET, BY OPERATION, 2018-2032 (USD THOUSAND)
TABLE 497 SAUDI ARABIA SCANNING PROBE MICROSCOPES (SPM)/ATOMIC FORCE MICROSCOPES (AFM) IN SURFACE ANALYSIS MARKET, BY NOISE LEVEL, 2018-2032 (USD THOUSAND)
TABLE 498 SAUDI ARABIA SURFACE ANALYSIS MARKET, BY APPLICATION, 2018-2032 (USD THOUSAND)
TABLE 499 SAUDI ARABIA SURFACE ANALYSIS MARKET, BY END USER, 2018-2032 (USD THOUSAND)
TABLE 500 SAUDI ARABIA INDUSTRIES IN SURFACE ANALYSIS MARKET, BY TYPE, 2018-2032 (USD THOUSAND)
TABLE 501 SAUDI ARABIA INDUSTRIES IN SURFACE ANALYSIS MARKET, BY TECHNOLOGY, 2018-2032 (USD THOUSAND)
TABLE 502 SAUDI ARABIA RESEARCH ORGANIZATION IN SURFACE ANALYSIS MARKET, BY TECHNOLOGY, 2018-2032 (USD THOUSAND)
TABLE 503 SAUDI ARABIA ACADEMIC INSTITUTES IN SURFACE ANALYSIS MARKET, BY TECHNOLOGY, 2018-2032 (USD THOUSAND)
TABLE 504 SOUTH AFRICA SURFACE ANALYSIS MARKET, BY TECHNOLOGY, 2018-2032 (USD THOUSAND)
TABLE 505 SOUTH AFRICA MICROSCOPY IN SURFACE ANALYSIS MARKET, BY METHOD, 2018-2032 (USD THOUSAND)
TABLE 506 SOUTH AFRICA MICROSCOPY IN SURFACE ANALYSIS MARKET, BY TECHNIQUE, 2018-2032 (USD THOUSAND)
TABLE 507 SOUTH AFRICA SURFACE ANALYSIS MARKET, BY TYPE, 2018-2032 (USD THOUSAND)
TABLE 508 SOUTH AFRICA SURFACE ANALYSIS MARKET, BY METHOD TYPE, 2018-2032 (USD THOUSAND)
TABLE 509 SOUTH AFRICA SURFACE ANALYSIS MARKET, BY EQUIPMENT TYPE, 2018-2032 (USD THOUSAND)
TABLE 510 SOUTH AFRICA SCANNING PROBE MICROSCOPES (SPM)/ATOMIC FORCE MICROSCOPES (AFM) IN SURFACE ANALYSIS MARKET, BY OPERATION, 2018-2032 (USD THOUSAND)
TABLE 511 SOUTH AFRICA SCANNING PROBE MICROSCOPES (SPM)/ATOMIC FORCE MICROSCOPES (AFM) IN SURFACE ANALYSIS MARKET, BY NOISE LEVEL, 2018-2032 (USD THOUSAND)
TABLE 512 SOUTH AFRICA SURFACE ANALYSIS MARKET, BY APPLICATION, 2018-2032 (USD THOUSAND)
TABLE 513 SOUTH AFRICA SURFACE ANALYSIS MARKET, BY END USER, 2018-2032 (USD THOUSAND)
TABLE 514 SOUTH AFRICA INDUSTRIES IN SURFACE ANALYSIS MARKET, BY TYPE, 2018-2032 (USD THOUSAND)
TABLE 515 SOUTH AFRICA INDUSTRIES IN SURFACE ANALYSIS MARKET, BY TECHNOLOGY, 2018-2032 (USD THOUSAND)
TABLE 516 SOUTH AFRICA RESEARCH ORGANIZATION IN SURFACE ANALYSIS MARKET, BY TECHNOLOGY, 2018-2032 (USD THOUSAND)
TABLE 517 SOUTH AFRICA ACADEMIC INSTITUTES IN SURFACE ANALYSIS MARKET, BY TECHNOLOGY, 2018-2032 (USD THOUSAND)
TABLE 518 U.A.E. SURFACE ANALYSIS MARKET, BY TECHNOLOGY, 2018-2032 (USD THOUSAND)
TABLE 519 U.A.E. MICROSCOPY IN SURFACE ANALYSIS MARKET, BY METHOD, 2018-2032 (USD THOUSAND)
TABLE 520 U.A.E. MICROSCOPY IN SURFACE ANALYSIS MARKET, BY TECHNIQUE, 2018-2032 (USD THOUSAND)
TABLE 521 U.A.E. SURFACE ANALYSIS MARKET, BY TYPE, 2018-2032 (USD THOUSAND)
TABLE 522 U.A.E. SURFACE ANALYSIS MARKET, BY METHOD TYPE, 2018-2032 (USD THOUSAND)
TABLE 523 U.A.E. SURFACE ANALYSIS MARKET, BY EQUIPMENT TYPE, 2018-2032 (USD THOUSAND)
TABLE 524 U.A.E. SCANNING PROBE MICROSCOPES (SPM)/ATOMIC FORCE MICROSCOPES (AFM) IN SURFACE ANALYSIS MARKET, BY OPERATION, 2018-2032 (USD THOUSAND)
TABLE 525 U.A.E. SCANNING PROBE MICROSCOPES (SPM)/ATOMIC FORCE MICROSCOPES (AFM) IN SURFACE ANALYSIS MARKET, BY NOISE LEVEL, 2018-2032 (USD THOUSAND)
TABLE 526 U.A.E. SURFACE ANALYSIS MARKET, BY APPLICATION, 2018-2032 (USD THOUSAND)
TABLE 527 U.A.E. SURFACE ANALYSIS MARKET, BY END USER, 2018-2032 (USD THOUSAND)
TABLE 528 U.A.E. INDUSTRIES IN SURFACE ANALYSIS MARKET, BY TYPE, 2018-2032 (USD THOUSAND)
TABLE 529 U.A.E. INDUSTRIES IN SURFACE ANALYSIS MARKET, BY TECHNOLOGY, 2018-2032 (USD THOUSAND)
TABLE 530 U.A.E. RESEARCH ORGANIZATION IN SURFACE ANALYSIS MARKET, BY TECHNOLOGY, 2018-2032 (USD THOUSAND)
TABLE 531 U.A.E. ACADEMIC INSTITUTES IN SURFACE ANALYSIS MARKET, BY TECHNOLOGY, 2018-2032 (USD THOUSAND)
TABLE 532 EGYPT SURFACE ANALYSIS MARKET, BY TECHNOLOGY, 2018-2032 (USD THOUSAND)
TABLE 533 EGYPT MICROSCOPY IN SURFACE ANALYSIS MARKET, BY METHOD, 2018-2032 (USD THOUSAND)
TABLE 534 EGYPT MICROSCOPY IN SURFACE ANALYSIS MARKET, BY TECHNIQUE, 2018-2032 (USD THOUSAND)
TABLE 535 EGYPT SURFACE ANALYSIS MARKET, BY TYPE, 2018-2032 (USD THOUSAND)
TABLE 536 EGYPT SURFACE ANALYSIS MARKET, BY METHOD TYPE, 2018-2032 (USD THOUSAND)
TABLE 537 EGYPT SURFACE ANALYSIS MARKET, BY EQUIPMENT TYPE, 2018-2032 (USD THOUSAND)
TABLE 538 EGYPT SCANNING PROBE MICROSCOPES (SPM)/ATOMIC FORCE MICROSCOPES (AFM) IN SURFACE ANALYSIS MARKET, BY OPERATION, 2018-2032 (USD THOUSAND)
TABLE 539 EGYPT SCANNING PROBE MICROSCOPES (SPM)/ATOMIC FORCE MICROSCOPES (AFM) IN SURFACE ANALYSIS MARKET, BY NOISE LEVEL, 2018-2032 (USD THOUSAND)
TABLE 540 EGYPT SURFACE ANALYSIS MARKET, BY APPLICATION, 2018-2032 (USD THOUSAND)
TABLE 541 EGYPT SURFACE ANALYSIS MARKET, BY END USER, 2018-2032 (USD THOUSAND)
TABLE 542 EGYPT INDUSTRIES IN SURFACE ANALYSIS MARKET, BY TYPE, 2018-2032 (USD THOUSAND)
TABLE 543 EGYPT INDUSTRIES IN SURFACE ANALYSIS MARKET, BY TECHNOLOGY, 2018-2032 (USD THOUSAND)
TABLE 544 EGYPT RESEARCH ORGANIZATION IN SURFACE ANALYSIS MARKET, BY TECHNOLOGY, 2018-2032 (USD THOUSAND)
TABLE 545 EGYPT ACADEMIC INSTITUTES IN SURFACE ANALYSIS MARKET, BY TECHNOLOGY, 2018-2032 (USD THOUSAND)
TABLE 546 ISRAEL SURFACE ANALYSIS MARKET, BY TECHNOLOGY, 2018-2032 (USD THOUSAND)
TABLE 547 ISRAEL MICROSCOPY IN SURFACE ANALYSIS MARKET, BY METHOD, 2018-2032 (USD THOUSAND)
TABLE 548 ISRAEL MICROSCOPY IN SURFACE ANALYSIS MARKET, BY TECHNIQUE, 2018-2032 (USD THOUSAND)
TABLE 549 ISRAEL SURFACE ANALYSIS MARKET, BY TYPE, 2018-2032 (USD THOUSAND)
TABLE 550 ISRAEL SURFACE ANALYSIS MARKET, BY METHOD TYPE, 2018-2032 (USD THOUSAND)
TABLE 551 ISRAEL SURFACE ANALYSIS MARKET, BY EQUIPMENT TYPE, 2018-2032 (USD THOUSAND)
TABLE 552 ISRAEL SCANNING PROBE MICROSCOPES (SPM)/ATOMIC FORCE MICROSCOPES (AFM) IN SURFACE ANALYSIS MARKET, BY OPERATION, 2018-2032 (USD THOUSAND)
TABLE 553 ISRAEL SCANNING PROBE MICROSCOPES (SPM)/ATOMIC FORCE MICROSCOPES (AFM) IN SURFACE ANALYSIS MARKET, BY NOISE LEVEL, 2018-2032 (USD THOUSAND)
TABLE 554 ISRAEL SURFACE ANALYSIS MARKET, BY APPLICATION, 2018-2032 (USD THOUSAND)
TABLE 555 ISRAEL SURFACE ANALYSIS MARKET, BY END USER, 2018-2032 (USD THOUSAND)
TABLE 556 ISRAEL INDUSTRIES IN SURFACE ANALYSIS MARKET, BY TYPE, 2018-2032 (USD THOUSAND)
TABLE 557 ISRAEL INDUSTRIES IN SURFACE ANALYSIS MARKET, BY TECHNOLOGY, 2018-2032 (USD THOUSAND)
TABLE 558 ISRAEL RESEARCH ORGANIZATION IN SURFACE ANALYSIS MARKET, BY TECHNOLOGY, 2018-2032 (USD THOUSAND)
TABLE 559 ISRAEL ACADEMIC INSTITUTES IN SURFACE ANALYSIS MARKET, BY TECHNOLOGY, 2018-2032 (USD THOUSAND)
TABLE 560 REST OF MIDDLE EAST AND AFRICA SURFACE ANALYSIS MARKET, BY TECHNOLOGY, 2018-2032 (USD THOUSAND)
Abbildungsverzeichnis
FIGURE 1 GLOBAL SURFACE ANALYSIS MARKET: SEGMENTATION
FIGURE 2 GLOBAL SURFACE ANALYSIS MARKET: DATA TRIANGULATION
FIGURE 3 GLOBAL SURFACE ANALYSIS MARKET: DROC ANALYSIS
FIGURE 4 GLOBAL SURFACE ANALYSIS MARKET: INTERVIEW DEMOGRAPHICS
FIGURE 5 GLOBAL SURFACE ANALYSIS MARKET: DBMR MARKET POSITION GRID
FIGURE 6 GLOBAL SURFACE ANALYSIS MARKET: MULTIVARIATE MODELING
FIGURE 7 GLOBAL SURFACE ANALYSIS MARKET: TECHNOLOGY TIMELINE CURVE
FIGURE 8 GLOBAL SURFACE ANALYSIS MARKET: APPLICATION COVERAGE GRID
FIGURE 9 GLOBAL SURFACE ANALYSIS MARKET: SEGMENTATION
FIGURE 10 SEMICONDUCTOR: GLOBAL SURFACE ANALYSIS MARKET EXECUTIVE SUMMARY
FIGURE 11 FOUR SEGMENTS COMPRISE THE GLOBAL SURFACE ANALYSIS MARKET, BY TECHNOLOGY (2024)
FIGURE 12 STRATEGIC DECISIONS
FIGURE 13 INCREASE IN THE R&D EXPENDITURE IN MEDICAL AND PHARMACEUTICAL COMPANIES THE GLOBAL SURFACE ANALYSIS MARKET DURING THE FORECAST PERIOD OF 2025 TO 2032
FIGURE 14 TECHNOLOGY SEGMENT IS EXPECTED TO ACCOUNT FOR THE LARGEST SHARE OF THE GLOBAL SURFACE ANALYSIS MARKET IN 2025 & 2032
FIGURE 15 NORTH AMERICA IS EXPECTED TO BE THE DOMINANT, AND ASIA-PACIFIC IS THE FASTEST GROWING REGION IN THE GLOBAL SURFACE ANALYSIS MARKET IN THE FORECAST PERIOD OF 2025 TO 2032
FIGURE 16 ASIA-PACIFIC IS THE FASTEST-GROWING REGION FOR THE GLOBAL SURFACE ANALYSIS MARKET IN THE FORECAST PERIOD OF 2025 TO 2032
FIGURE 17 BIGGEST MANUFACTURING ECONOMIES
FIGURE 18 DROC ANALYSIS
FIGURE 19 R&D INVESTMENTS BY INDIAN PHARMA COMPANIES
FIGURE 20 GLOBAL SURFACE ANALYSIS MARKET: BY TECHNOLOGY, 2024
FIGURE 21 GLOBAL SURFACE ANALYSIS MARKET: BY TYPE, 2024
FIGURE 22 GLOBAL SURFACE ANALYSIS MARKET: BY METHOD TYPE, 2024
FIGURE 23 GLOBAL SURFACE ANALYSIS MARKET: BY EQUIPMENT TYPE, 2024
FIGURE 24 GLOBAL SURFACE ANALYSIS MARKET: BY APPLICATION, 2024
FIGURE 25 GLOBAL SURFACE ANALYSIS MARKET: BY END USER, 2024
FIGURE 26 GLOBAL SURFACE ANALYSIS MARKET: SNAPSHOT (2024)
FIGURE 27 GLOBAL SURFACE ANALYSIS MARKET: COMPANY SHARE 2024 (%)
FIGURE 28 NORTH AMERICA SURFACE ANALYSIS MARKET: COMPANY SHARE 2024 (%)
FIGURE 29 EUROPE SURFACE ANALYSIS MARKET: COMPANY SHARE 2024 (%)
FIGURE 30 ASIA-PACIFIC SURFACE ANALYSIS MARKET: COMPANY SHARE 2024 (%)
Forschungsmethodik
Die Datenerfassung und Basisjahresanalyse werden mithilfe von Datenerfassungsmodulen mit großen Stichprobengrößen durchgeführt. Die Phase umfasst das Erhalten von Marktinformationen oder verwandten Daten aus verschiedenen Quellen und Strategien. Sie umfasst die Prüfung und Planung aller aus der Vergangenheit im Voraus erfassten Daten. Sie umfasst auch die Prüfung von Informationsinkonsistenzen, die in verschiedenen Informationsquellen auftreten. Die Marktdaten werden mithilfe von marktstatistischen und kohärenten Modellen analysiert und geschätzt. Darüber hinaus sind Marktanteilsanalyse und Schlüsseltrendanalyse die wichtigsten Erfolgsfaktoren im Marktbericht. Um mehr zu erfahren, fordern Sie bitte einen Analystenanruf an oder geben Sie Ihre Anfrage ein.
Die wichtigste Forschungsmethodik, die vom DBMR-Forschungsteam verwendet wird, ist die Datentriangulation, die Data Mining, die Analyse der Auswirkungen von Datenvariablen auf den Markt und die primäre (Branchenexperten-)Validierung umfasst. Zu den Datenmodellen gehören ein Lieferantenpositionierungsraster, eine Marktzeitlinienanalyse, ein Marktüberblick und -leitfaden, ein Firmenpositionierungsraster, eine Patentanalyse, eine Preisanalyse, eine Firmenmarktanteilsanalyse, Messstandards, eine globale versus eine regionale und Lieferantenanteilsanalyse. Um mehr über die Forschungsmethodik zu erfahren, senden Sie eine Anfrage an unsere Branchenexperten.
Anpassung möglich
Data Bridge Market Research ist ein führendes Unternehmen in der fortgeschrittenen formativen Forschung. Wir sind stolz darauf, unseren bestehenden und neuen Kunden Daten und Analysen zu bieten, die zu ihren Zielen passen. Der Bericht kann angepasst werden, um Preistrendanalysen von Zielmarken, Marktverständnis für zusätzliche Länder (fordern Sie die Länderliste an), Daten zu klinischen Studienergebnissen, Literaturübersicht, Analysen des Marktes für aufgearbeitete Produkte und Produktbasis einzuschließen. Marktanalysen von Zielkonkurrenten können von technologiebasierten Analysen bis hin zu Marktportfoliostrategien analysiert werden. Wir können so viele Wettbewerber hinzufügen, wie Sie Daten in dem von Ihnen gewünschten Format und Datenstil benötigen. Unser Analystenteam kann Ihnen auch Daten in groben Excel-Rohdateien und Pivot-Tabellen (Fact Book) bereitstellen oder Sie bei der Erstellung von Präsentationen aus den im Bericht verfügbaren Datensätzen unterstützen.

