

Global Industrial Ethanol Market
Marktgröße in Milliarden USD
CAGR :
% 
 USD
3,361.98 Million
USD
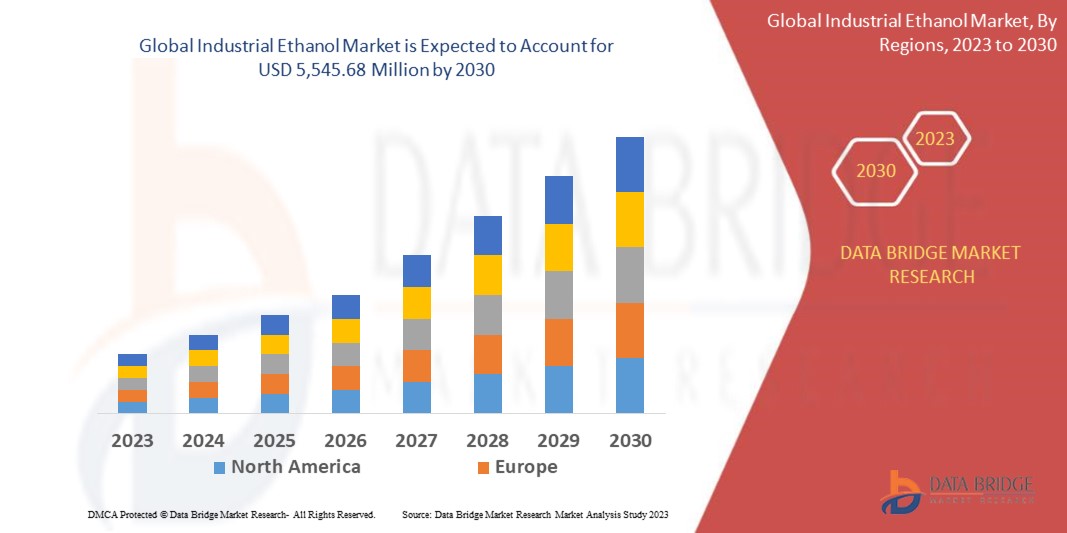
5,545.68 Million
2021
2029
USD
3,361.98 Million
USD
5,545.68 Million
2021
2029
| 2022 –2029 | |
| USD 3,361.98 Million | |
| USD 5,545.68 Million | |
| % | |
|
Globaler Markt für industriellen Ethanol, nach Rohstoff (biobasiert und synthetisch), Typ (absoluter Ethanol, Ethanol 95 %, denaturierter Ethanol und andere), Anwendung ( Farben und Beschichtungen , Pharmazeutika, Lebensmittel und Getränke, Druckfarbe, Landwirtschaft, Reinigungslösungen für Haushalt und Industrie, Kosmetik und Körperpflege, Klebstoffe und andere), Land (USA, Kanada, Mexiko, Deutschland, Großbritannien, Italien, Frankreich, Spanien, Russland, Türkei, Schweiz, Belgien, Niederlande, restliches Europa, Japan, China, Südkorea, Indien, Australien und Neuseeland, Singapur, Thailand, Indonesien, Malaysia, Philippinen, restlicher asiatisch-pazifischer Raum, Brasilien, Argentinien, restliches Südamerika, Südafrika, Ägypten, Saudi-Arabien, Vereinigte Arabische Emirate, Israel und restlicher Naher Osten und Afrika) – Branchentrends und Prognose bis 2030.
Marktanalyse und Größe für Industrieethanol
Industrieller Ethanol ist ein farbloser organischer Lösungsmittel, der sowohl durch traditionelle Fermentation als auch durch andere synthetische Methoden gewonnen wird. Er ist leicht entflammbar und erfordert spezielle Lagerungsbedingungen. Darüber hinaus findet er breite Anwendung in verschiedenen Branchen wie Farben und Lacke, Kosmetik und Körperpflege, Automobilindustrie und vielen anderen. In jüngster Zeit ist die Nachfrage nach industriellem Ethanol weltweit gestiegen, da er weit verbreitet als Biokraftstoff eingesetzt wird , der in mehreren Ländern wie den USA und Brasilien bevorzugt wird. Die zunehmende Verwendung von Ethanol als Schiffskraftstoff ist einer der Faktoren, die das Marktwachstum vorantreiben.
Data Bridge Market Research analysiert, dass der globale Markt für Industrieethanol, der im Jahr 2022 3.361,98 Millionen USD betrug, bis 2030 auf 5.545,68 Millionen USD ansteigen wird und im Prognosezeitraum von 2023 bis 2030 eine durchschnittliche jährliche Wachstumsrate von 6,2 % aufweisen wird. Das biobasierte Segment wird den Markt voraussichtlich weltweit dominieren, da es reichlich Rohstoffe gibt und die Produktion einfach ist. Neben Einblicken in Marktszenarien wie Marktwert, Wachstumsrate, Segmentierung, geografische Abdeckung und wichtige Akteure enthalten die von Data Bridge Market Research zusammengestellten Marktberichte auch eingehende Expertenanalysen, Pipeline-Analysen, Preisanalysen und regulatorische Rahmenbedingungen.
Umfang und Segmentierung des Marktes für Industrieethanol
|
Berichtsmetrik |
Details |
|
Prognosezeitraum |
2023 bis 2030 |
|
Basisjahr |
2022 |
|
Historische Jahre |
2021 (anpassbar auf 2015–2020) |
|
Quantitative Einheiten |
Umsatz in Tausend USD, Mengen in Tonnen, Preise in USD |
|
Abgedeckte Segmente |
Nach Rohstoff (biobasiert und synthetisch), Typ (absoluter Ethanol, Ethanol 95 %, denaturierter Ethanol und andere), Anwendung (Farben und Beschichtungen, Pharmazeutika, Lebensmittel und Getränke, Druckfarbe, Landwirtschaft, Reinigungslösungen für Haushalt und Industrie, Kosmetik und Körperpflege, Klebstoffe und andere) |
|
Abgedeckte Länder |
USA, Kanada, Mexiko, Deutschland, Großbritannien, Italien, Frankreich, Spanien, Russland, Türkei, Schweiz, Belgien, Niederlande, restliches Europa, Japan, China, Südkorea, Indien, Australien und Neuseeland, Singapur, Thailand, Indonesien, Malaysia, Philippinen, restlicher asiatisch-pazifischer Raum, Brasilien, Argentinien, restliches Südamerika, Südafrika, Ägypten, Saudi-Arabien, Vereinigte Arabische Emirate, Israel und restlicher Naher Osten und Afrika. |
|
Abgedeckte Marktteilnehmer |
Alto Ingredients, Inc. (USA), ADM, Bunge North America, Inc. (eine Tochtergesellschaft von Bunge Limited) (USA), Envien Group (Slowakei), Calgren Renewable Fuels, LLC (USA), INEOS (Großbritannien), Cargill, Incorporated, LyondellBasell Industries Holdings BV (Niederlande), Mitsubishi Chemical Corporation (Japan), Valero (USA), Flint Hills Resources (USA), Sasol (Johannesburg), CropEnergies AG (Deutschland), The Andersons, Inc. (USA), BASF SE (Deutschland) |
|
Marktchancen |
|
Marktdefinition
Industrielles Ethanol ist ein stark abhängiges Lösungsmittel, das in Laboren, Haushalten und Fahrzeugen gleichermaßen unverzichtbar ist. Der globale Markt für industrielles Ethanol ist ein schnell wachsender Markt, da seine Anwendungen sich über mehrere Industriesegmente erstrecken. Der jeweilige Markt ist stark konsolidiert und die Trends auf dem Markt hängen von verschiedenen Faktoren ab.
Die größte Einschränkung, die die Nachfrage auf dem globalen Markt für Industrieethanol beeinflusst, ist der Anstieg der negativen Umweltauswirkungen der Ethanolproduktion und der hohe Wasserbedarf für die Ethanolproduktion. Darüber hinaus führt Industrieethanol in Körperpflegeprodukten zu trockener Haut und Haarausfall, was das Wachstum des jeweiligen Marktes ebenfalls hemmt. Die größten Chancen für den globalen Markt für Industrieethanol sind das Wachstum der Renovierungsbaubranche weltweit und die Entwicklung umweltfreundlicherer Ethylalkoholquellen. Die zunehmende Verwendung von Ethanol als Schiffskraftstoff fördert ebenfalls das Marktwachstum. Einige der wichtigsten Treiber im Zusammenhang mit dem jeweiligen Markt sind die steigende Nachfrage nach dem Industrieethanolprodukt als Oktanzahlverbesserer und Ethanol als Kraftstoff in Autos und Fahrzeugen. Die zunehmende Verwendung von Industrieethanol in Handdesinfektionsmitteln und antibakteriellen Produkten im Pandemieszenario wird voraussichtlich auch den globalen Markt für Industrieethanol antreiben.
Globale Marktdynamik für Industrieethanol
Treiber
-
ZUNAHME DES WELTWEITEN ALKOHOLHANDELS
Die Geschichte des Konsums alkoholischer Getränke reicht bis 5400-5000 v. Chr. zurück und ist noch immer eine der wichtigsten gesellschaftlichen Aktivitäten in vielen Kulturen. Obwohl der Verkauf und die Produktion von Alkohol weltweit von Regierungen reguliert werden, verzeichneten der Konsum und der Spirituosenhandel in den letzten Jahren einen stetigen Anstieg. Darüber hinaus kurbelte der Lockdown im Zusammenhang mit COVID-19 diesen Verkauf weiter an, da die meisten Menschen in ihren Häusern eingesperrt waren. Daher betrachten viele Menschen den Konsum von Alkohol als eine Möglichkeit, mit Stress fertig zu werden und sich zu unterhalten. Dieser stetige Anstieg des globalen Alkoholhandels wirkt jedoch als Treiber für den globalen industriellen Ethanolmarkt, da Ethanol der Hauptbestandteil dieser alkoholischen Getränke ist .
-
EFFEKTIVER EINSATZ VON INDUSTRIE-ETHANOL IN DER FARBEN- UND LACKINDUSTRIE
Die Farben- und Lackindustrie ist einer der am schnellsten wachsenden Märkte weltweit und wird durch die rasanten baulichen Entwicklungen unterstützt, die den Paradigmenwechsel in der Gesellschaft signalisieren. Als Folge dieser rasanten Expansion der Farben- und Lackindustrie gilt die effektive Nutzung von Industrieethanol in dieser Branche als einer der wichtigsten Markttreiber für den globalen Industrieethanolmarkt.
Gelegenheiten
-
WACHSENDE RENOVIERUNGSBAUINDUSTRIE WELTWEIT
Die Renovierungsbaubranche ist eine der bedeutendsten und aufstrebenden Branchen weltweit und erlebt enorme Marktzuwächse. Obwohl die COVID-19-Pandemie dieses Marktwachstum der Renovierungsbaubranche in den letzten zwei Jahren gebremst hat, wird erwartet, dass der entsprechende Sektor in den kommenden Jahren erheblich wachsen wird. Darüber hinaus wird das Wachstum der Renovierungsbaubranche weltweit als Chance für den globalen Markt für Industrieethanol betrachtet, da die Renovierungsbaubranche enorme Mengen an Farben und Beschichtungen benötigt, deren Herstellung eine große Menge Ethanol erfordert.
-
ZUNEHMENDE VERÖFFENTLICHUNG GRÜNEREDER ETHYLALKOHOLQUELLEN
Ethylalkohol oder Ethanol ist ein erneuerbarer und nachhaltiger Kraftstoff, der hauptsächlich aus Biomasse wie Mais, Zuckerrohr und ähnlichen kohlenhydratreichen Pflanzenmaterialien hergestellt wird. Ethanol erfreut sich weltweit zunehmender Beliebtheit, insbesondere in den USA, da 98 % des Benzins in den USA eine gewisse Menge Ethanol enthält. Das zunehmende Aufkommen umweltfreundlicherer Ethanolquellen könnte als Chance für den globalen industriellen Ethanolmarkt betrachtet werden. Es würde zu einer Produktionssteigerung führen und damit den entsprechenden Umsatz des industriellen Ethanolmarkts steigern.
Einschränkungen/Herausforderungen
-
Steigende negative Umweltauswirkungen durch die Ethanolproduktion
Bei der Produktion von Ethanol wird Kohlendioxid (CO2) in die Atmosphäre freigesetzt. Kohlendioxid ist ein Treibhausgas, das die globale Erwärmung verursacht und schädliches bodennahes Ozon und Smog bildet. Darüber hinaus verbrennen einige Ethanol-Produktionsunternehmen Kohle und Erdgas als Wärmequellen im Fermentationsprozess, was letztendlich zur Produktion von CO2-Gas führt, das gefährliche Auswirkungen auf die Umwelt hat. Ethanol wird oft als umweltfreundlicher Kraftstoff und kostengünstige Alternative zu Benzin angesehen. Der Industriemais, aus dem Ethanol hergestellt wird, schadet der Umwelt jedoch auf andere Weise. Beim Anbau von Mais für Ethanol werden große Mengen synthetischer Düngemittel, Herbizide und Insektenvernichtungsmittel verwendet. Natürlich werden bei der Maisproduktion gefährliche Stoffe und Chemikalien freigesetzt, die sich direkt auf die Umwelt auswirken. Darüber hinaus verursacht die Maisproduktion mehr Bodenerosion als jede andere Nutzpflanze. Jüngste Forschungsergebnisse belegen, dass die Ethanolproduktion aus Mais 29 % mehr Energie benötigt, als Ethanol erzeugen kann. All diese Faktoren verschlechtern die Umweltbedingungen und tragen zur Wasser- und Luftverschmutzung bei.
-
SCHWANKUNGEN DER ROHSTOFFPREISE
Zu den Rohstoffen, aus denen Ethanol hergestellt wird, gehören Getreide und Feldfrüchte mit hohem Stärke- und Zuckergehalt, wie Mais, Gerste, Zuckerrohr und Zuckerrüben. Ethanol kann auch aus Gräsern, Bäumen und land- und forstwirtschaftlichen Rückständen wie Maiskolben und -stängeln, Reisstroh, Sägemehl und Holzspänen hergestellt werden. Was die Preise von Ethanol betrifft, so hängen diese von einer Reihe verschiedener Faktoren ab. Die wichtigsten sind die Art des im Prozess verwendeten Futters, die Anlagenkapazität und die Qualität des Endprodukts. Darüber hinaus beeinflussen die im Mehl enthaltenen Kohlenhydratarten (Zucker, Stärke oder Lignozellulose) den Endpreis von Ethanol. Die Preise der Rohstoffe werden heutzutage von verschiedenen Faktoren beeinflusst. Die meisten Industrien verwenden Mais und Zuckerrohr als primäre Rohstoffe zur Herstellung von Ethanol.
Jüngste Entwicklung
-
Im April 2021 ging Sasol eine Partnerschaft mit Toyota South Africa Motors (TSAM) zur Entwicklung und Erforschung eines auf grünem Wasserstoff basierenden Mobilitätsökosystems in Südafrika ein. Die Partnerschaft wird die Erfahrungen beider Unternehmen bündeln, wie etwa die Erfahrung von Sasol in Bezug auf die Produktion und Verwendung von grauem Wasserstoff sowie die Erfahrung von TASM mit emissionsfreien Wasserstoff-Brennstoffzellenfahrzeugen. Das Unternehmen erwartet, mit dieser Partnerschaft sein Ziel zu erreichen, eine nachhaltige und grüne Wirtschaft zu schaffen und gleichzeitig seinen Umsatz und Umsatz zu steigern.
-
Im März 2020 gab die CropEnergies AG bekannt, dass sie aufgrund der gestiegenen Nachfrage nach Desinfektionsmitteln ihren Schwerpunkt von der Produktion von Kraftstoffethanol teilweise auf die Produktion von reinem Ethanol verlagern wird. Das Unternehmen erwartet, mit dieser Produktionsausweitung seinen Absatz von reinem Ethanol und seinen Gesamtumsatz zu verbessern.
Globaler Marktumfang für Industrieethanol
Der globale Markt für Industrieethanol ist nach Rohstoff, Typ und Anwendung segmentiert. Das Wachstum dieser Segmente hilft Ihnen bei der Analyse schwacher Wachstumssegmente in den Branchen und bietet den Benutzern einen wertvollen Marktüberblick und Markteinblicke, die ihnen bei der strategischen Entscheidungsfindung zur Identifizierung der wichtigsten Marktanwendungen helfen.
ROHSTOFF
- BIOBASIERT
- SYNTHETIK
TYP
- ETHANOL 95%
- ABSOLUTES ETHANOL
- DENATURIERTES ETHANOL
- ANDERE
ANWENDUNG
- KOSMETIK UND KÖRPERPFLEGE
- ESSEN UND GETRÄNKE
- PHARMAZEUTISCHE
- LANDWIRTSCHAFT
- FARBEN UND BESCHICHTUNGEN
- REINIGUNGSLÖSUNGEN FÜR HAUSHALT UND INDUSTRIE
- KLEBSTOFFE
- DRUCKFARBE
- ANDERE
Globaler Industrieethanolmarkt – Regionale Analyse/Einblicke
Der globale Markt für Industrieethanol wird analysiert und Einblicke in die Marktgröße und Trends werden nach Rohstoff, Typ und Anwendung wie oben angegeben bereitgestellt.
Die im Bericht zum globalen Markt für Industrieethanol abgedeckten Länder sind die USA, Kanada, Mexiko, Deutschland, Großbritannien, Italien, Frankreich, Spanien, Russland, Türkei, Schweiz, Belgien, Niederlande, übriges Europa, Japan, China, Südkorea, Indien, Australien und Neuseeland, Singapur, Thailand, Indonesien, Malaysia, Philippinen, übriger asiatisch-pazifischer Raum, Brasilien, Argentinien, übriges Südamerika, Südafrika, Ägypten, Saudi-Arabien, Vereinigte Arabische Emirate, Israel und der Rest des Nahen Ostens und Afrikas.
Aufgrund der großen Bevölkerung, der Massenproduktion und der reichlichen Verfügbarkeit von Rohstoffen wird Nordamerika voraussichtlich dominieren.
Der Länderabschnitt des Berichts enthält auch Angaben zu einzelnen marktbeeinflussenden Faktoren und Änderungen der Regulierung auf dem Inlandsmarkt, die sich auf die aktuellen und zukünftigen Trends des Marktes auswirken. Datenpunkte wie Downstream- und Upstream-Wertschöpfungskettenanalysen, technische Trends und Porters Fünf-Kräfte-Analyse sowie Fallstudien sind einige der Anhaltspunkte, die zur Prognose des Marktszenarios für einzelne Länder verwendet werden. Bei der Bereitstellung von Prognoseanalysen der Länderdaten werden auch die Präsenz und Verfügbarkeit nordamerikanischer Marken und ihre Herausforderungen aufgrund großer oder geringer Konkurrenz durch lokale und inländische Marken sowie die Auswirkungen inländischer Zölle und Handelsrouten berücksichtigt.
Globales Wachstum der Industrieethanolbranche und Durchdringung neuer Technologien
Der globale Markt für Industrieethanol bietet Ihnen außerdem detaillierte Marktanalysen für jedes Land, das in der Branche der Nukleierungs- und Klärmittel wächst, neue Produktionsanlagen installiert, die Auswirkungen der Technologie anhand von Lebenslinienkurven und Änderungen in regulatorischen Szenarien und deren Auswirkungen auf den globalen Markt für Umwelttests berücksichtigt. Die Daten sind für den historischen Zeitraum 2015–2020 verfügbar.
Wettbewerbsumfeld und globale Marktanteilsanalyse für Industrieethanol
Die Wettbewerbslandschaft des globalen Marktes für Industrieethanol liefert Details nach Wettbewerbern. Die enthaltenen Details sind Unternehmensübersicht, Unternehmensfinanzen, erzielter Umsatz, Marktpotenzial, Investitionen in Forschung und Entwicklung, neue Marktinitiativen, Präsenz in Nordamerika, Produktionsstandorte und -anlagen, Produktionskapazitäten, Stärken und Schwächen des Unternehmens, Produkteinführung, Produktbreite und -umfang, Anwendungsdominanz. Die oben angegebenen Datenpunkte beziehen sich nur auf den Fokus der Unternehmen in Bezug auf den Markt für Keimbildner und Klärmittel.
Einige der wichtigsten Akteure auf dem globalen Markt für Industrieethanol sind:
- Alto Ingredients, Inc. (USA)
- ADM, Bunge North America, Inc. (eine Tochtergesellschaft von Bunge Limited) (USA)
- Envien Group (Slowakei)
- ,Calgren Renewable Fuels, LLC (USA)
- INEOS (Großbritannien)
- Cargill, Incorporated
- LyondellBasell Industries Holdings BV (Niederlande)
- Mitsubishi Chemical Corporation (Japan)
- Valero (USA)
- Flint Hills Resources (USA)
- Sasol (Johannesburg)
- CropEnergies AG (Deutschland)
- The Andersons, Inc. (USA)
- BASF SE (Deutschland)
SKU-
Erhalten Sie Online-Zugriff auf den Bericht zur weltweit ersten Market Intelligence Cloud

- Interaktives Datenanalyse-Dashboard
- Unternehmensanalyse-Dashboard für Chancen mit hohem Wachstumspotenzial
- Zugriff für Research-Analysten für Anpassungen und Abfragen
- Konkurrenzanalyse mit interaktivem Dashboard
- Aktuelle Nachrichten, Updates und Trendanalyse
- Nutzen Sie die Leistungsfähigkeit der Benchmark-Analyse für eine umfassende Konkurrenzverfolgung
Inhaltsverzeichnis
- INTRODUCTION
- OBJECTIVES OF THE STUDY
- MARKET DEFINITION
- OVERVIEW OF GLOBAL INDUSTRIAL ETHANOL MARKET
- LIMITATION
- MARKETS COVERED
- MARKET SEGMENTATION
- MARKETS COVERED
- GEOGRAPHICAL SCOPE
- YEARS CONSIDERED FOR THE STUDY
- CURRENCY AND PRICING
- DBMR TRIPOD DATA VALIDATION MODEL
- RAW MATERIAL LIFE LINE CURVE
- MULTIVARIATE MODELLING
- PRIMARY INTERVIEWS WITH KEY OPINION LEADERS
- DBMR MARKET POSITION GRID
- MARKET APPLICATION COVERAGE GRID
- DBMR MARKET CHALLENGE MATRIX
- VENDOR SHARE ANALYSIS
- IMPORT-EXPORT DATA
- SECONDARY SOURCES
- ASSUMPTIONS
- EXECUTIVE SUMMARY
- PREMIUM INSIGHTS
- PRICING ANALYSIS OF INDUSTRIAL ETHANOL (EXCLUDING FUEL MARKET)
- FIRST GENERATION BIOETHANOL
- SECOND GENERATION BIOETHANOL
- PRICING ANALYSIS
- INFLUENCING FACTORS FOR ETHANOL PRICE
- MARKET OVERVIEW
- DRIVERS
- INCREASE IN THE GLOBAL TRADE OF ALCOHOL
- EFFECTIVE USE OF INDUSTRIAL ETHANOL IN THE PAINTS AND COATING INDUSTRY
- INCREASING DEMAND FOR THE INDUSTRIAL ETHANOL PRODUCT AS AN OCTANE ENHANCER
- RISING USE OF ETHANOL AS FUEL IN AUTOMOTIVE AND TRANSPORTATION VEHICLES
- INCREASED USAGE OF INDUSTRIAL ETHANOL IN HAND SANITIZERS AND ANTIBACTERIAL PRODUCTS IN THE PANDEMIC SCENARIO
- RESTRAINTS
- RISING ADVERSE ENVIRONMENTAL IMPACT OF ETHANOL PRODUCTION
- LARGE SCALE WATER REQUIREMENT FOR THE PRODUCTION OF ETHANOL
- USE OF INDUSTRIAL ETHANOL IN PERSONAL CARE PRODUCTS RESULTS IN DRY SKIN AND HAIR LOSS
- OPPORTUNITIES
- GROWING RENOVATION CONSTRUCTION INDUSTRY AROUND THE GLOBE
- INCREASING ADVENT OF GREENER ETHYL ALCOHOL SOURCES
- RISING USE OF ETHANOL AS MARINE FUEL
- CHALLENGES
- FLUCTUATION IN THE PRICES OF RAW MATERIALS
- REGULATORY AND ETHICAL CONCERNS REGARDING THE PRODUCTION OF ETHANOL
- IMPACT OF COVID-19 ON THE GLOBAL INDUSTRIAL ETHANOL MARKET
- ANALYSIS ON IMPACT OF COVID-19 ON THE GLOBAL INDUSTRIAL ETHANOL MARKET
- AFTERMATH OF COVID-19 AND GOVERNMENT INITIATIVE TO BOOST THE GLOBAL INDUSTRIAL ETHANOL MARKET
- STRATEGIC DECISIONS FOR MANUFACTURERS AFTER COVID-19 TO GAIN COMPETITIVE MARKET SHARE
- IMPACT ON PRICE
- IMPACT ON DEMAND
- IMPACT ON SUPPLY CHAIN
- CONCLUSION
- GLOBAL INDUSTRIAL ETHANOL MARKET, BY RAW MATERIAL
- OVERVIEW
- BIO BASED
- GRAIN
- MAIZE
- WHEAT
- OTHERS
- SUGARCANE
- SYNTHETIC
- GLOBAL INDUSTRIAL ETHANOL MARKET, BY TYPE
- OVERVIEW
- ABSOLUTE ETHANOL
- ETHANOL 95%
- DENATURED ETHANOL
- OTHERS
- GLOBAL INDUSTRIAL ETHANOL MARKET, BY APPLICATION
- OVERVIEW
- COSMETICS AND PERSONAL CARE
- HAND SANITIZERS
- FACE/SKIN CARE PRODUCTS
- FRAGRANCE PRODUCTS
- PERFUMES
- DEODORANTS
- COLOGNE
- OTHERS
- ORAL CARE
- MOUTHWASHES
- ORAL ANTISEPTIC
- OTHERS
- BODY LOTIONS
- EYE MAKEUP
- NAIL PRODUCTS
- AFTERSHAVE LOTIONS
- HAIR SPRAYS
- OTHERS
- FOOD & BEVERAGES
- FLAVORS AND EXTRACTS
- WINE
- VINEGAR
- OTHERS
- PHARMACEUTICAL
- ANTIBIOTICS
- SYRUPS
- TABLETING
- POWDERS
- OTHERS
- AGRICULTURAL
- BIOCIDES
- INSECTICIDES
- FUNGICIDES
- PAINTS AND COATINGS
- HOUSEHOLD AND INDUSTRIAL CLEANING SOLUTIONS
- ADHESIVES
- PRINTING INK
- OTHERS
- GLOBAL INDUSTRIAL ETHANOL MARKET, BY REGION
- OVERVIEW
- NORTH AMERICA
- U.S.
- CANADA
- MEXICO
- ASIA-PACIFIC
- CHINA
- JAPAN
- INDIA
- SOUTH KOREA
- AUSTRALIA AND NEW ZEALAND
- INDONESIA
- SINGAPORE
- MALAYSIA
- THAILAND
- PHILIPPINES
- REST OF ASIA-PACIFIC
- EUROPE
- GERMANY
- U.K.
- FRANCE
- RUSSIA
- TURKEY
- ITALY
- SPAIN
- SWITZERLAND
- BELGIUM
- NETHERLANDS
- REST OF EUROPE
- SOUTH AMERICA
- BRAZIL
- ARGENTINA
- REST OF SOUTH AMERICA
- MIDDLE EAST AND AFRICA
- U.A.E.
- SAUDI ARABIA
- SOUTH AFRICA
- EGYPT
- ISRAEL
- REST OF MIDDLE EAST AND AFRICA
- GLOBAL INDUSTRIAL ETHANOL MARKET, COMPANY LANDSCAPE
- COMPANY SHARE ANALYSIS: GLOBAL
- COMPANY SHARE ANALYSIS: NORTH AMERICA
- COMPANY SHARE ANALYSIS: EUROPE
- COMPANY SHARE ANALYSIS: ASIA-PACIFIC
- MERGER & ACQUISITION
- EXPANSIONS
- PARTNERSHIPS & AGREEMENTS
- SWOT ANALYSIS
- COMPANY PROFILE
- MITSUBISHI CHEMICAL CORPORATION
- COMPANY SNAPSHOT
- REVENUE ANALYSIS
- COMPANY SHARE ANALYSIS
- PRODUCT PORTFOLIO
- RECENT UPDATE
- BASF SE
- COMPANY SNAPSHOT
- REVENUE ANALYSIS
- COMPANY SHARE ANALYSIS
- PRODUCT PORTFOLIO
- RECENT UPDATES
- CARGILL, INCORPORATED
- COMPANY SNAPSHOT
- COMPANY SHARE ANALYSIS
- PRODUCT PORTFOLIO
- RECENT UPDATES
- BUNGE NORTH AMERICA, INC. (A SUBSIDIARY OF BUNGE LIMITED)
- COMPANY SNAPSHOT
- REVENUE ANALYSIS
- COMPANY SHARE ANALYSIS
- PRODUCT PORTFOLIO
- RECENT UPDATES
- FLINT HILLS RESOURCES
- COMPANY SNAPSHOT
- COMPANY SHARE ANALYSIS
- PRODUCT PORTFOLIO
- RECENT UPDATE
- LYONDELLBASELL INDUSTRIES HOLDINGS B.V.
- COMPANY SNAPSHOT
- REVENUE ANALYSIS
- PRODUCT PORTFOLIO
- RECENT UPDATE
- CALGREN RENEWABLE FUELS, LLC
- COMPANY SNAPSHOT
- PRODUCT PORTFOLIO
- RECENT UPDATES
- ADM
- COMPANY SNAPSHOT
- REVENUE ANALYSIS
- PRODUCT PORTFOLIO
- RECENT UPDATES
- INEOS
- COMPANY SNAPSHOT
- REVENUE ANALYSIS
- PRODUCT PORTFOLIO
- RECENT UPDATES
- ALTO INGREDIENTS, INC.
- COMPANY SNAPSHOT
- REVENUE ANALYSIS
- PRODUCT PORTFOLIO
- RECENT UPDATES
- CROPENERGIES AG
- COMPANY SNAPSHOT
- REVENUE ANALYSIS
- PRODUCT PORTFOLIO
- RECENT UPDATES
- ENVIEN GROUP
- COMPANY SNAPSHOT
- PRODUCT PORTFOLIO
- RECENT UPDATE
- SASOL
- COMPANY SNAPSHOT
- REVENUE ANALYSIS
- PRODUCT PORTFOLIO
- RECENT UPDATE
- THE ANDERSONS, INC.
- COMPANY SNAPSHOT
- REVENUE ANALYSIS
- PRODUCT PORTFOLIO
- RECENT UPDATE
- VALERO
- COMPANY SNAPSHOT
- REVENUE ANALYSIS
- PRODUCT PORTFOLIO
- RECENT UPDATE
- QUESTIONNAIRE
- RELATED REPORTS
Tabellenverzeichnis
TABLE 1 IMPORT DATA of Denatured ethyl alcohol and other spirits of any strength; HS Code - 220720 (USD thousand)
TABLE 2 EXPORT DATA OF DENATURED ETHYL ALCOHOL AND OTHER SPIRITS OF ANY STRENGTH; HS CODE - 220720 (USD THOUSAND)
TABLE 3 price trend for first generation ethanol (USD per litre)
TABLE 4 total production of corn and the amount of corn used for the preparation of ethanol from 2015-2019
TABLE 5 Global Industrial ethanol market, By Raw material, 2019-2028 (Thousand liter)
TABLE 6 Global Industrial ethanol market, By Raw materials, 2019-2028 (USD Thousand)
TABLE 7 GLOBAL Bio based in Industrial ethanol market, By region, 2019-2028 (USD THOUSAND)
TABLE 8 global Bio based in Industrial ethanol MARKET, by Raw material, 2019-2028 (USD thousand)
TABLE 9 global grains in Industrial ethanol MARKET, by Type, 2019-2028 (USD thousand)
TABLE 10 GLOBAL Synthetic in Industrial ethanol market, By region, 2019-2028 (USD THOUSAND)
TABLE 11 Global Industrial ethanol market, By Type, 2019-2028 (USD Thousand)
TABLE 12 GLOBAL Absolute Ethanol in Industrial ethanol market, By region, 2019-2028 (USD THOUSAND)
TABLE 13 GLOBAL industrial Ethanol 95% in Industrial ethanol market, By region, 2019-2028 (USD THOUSAND)
TABLE 14 GLOBAL DENATURED industrial Ethanol in Industrial ethanol market, By region, 2019-2028 (USD THOUSAND)
TABLE 15 GLOBAL others in Industrial ethanol market, By region, 2019-2028 (USD THOUSAND)
TABLE 16 Global Industrial ethanol market, By Application, 2019-2028 (USD Thousand)
TABLE 17 GLOBAL Cosmetics and Personal Care in Industrial ethanol market, By region, 2019-2028 (USD THOUSAND)
TABLE 18 global Cosmetic and personal care in Industrial ethanol MARKET, by Application, 2019-2028 (USD thousand)
TABLE 19 global Fragrance products in Industrial ethanol MARKET, by APPLICATION, 2019-2028 (USD thousand)
TABLE 20 global Oral care in Industrial ethanol MARKET, by APPLICATION, 2019-2028 (USD thousand)
TABLE 21 GLOBAL Food and beverages in Industrial ethanol market, By region, 2019-2028 (USD THOUSAND)
TABLE 22 global Food & beverages in Industrial ethanol MARKET, by Raw material, 2019-2028 (USD thousand)
TABLE 23 GLOBAL pharmaceutical in Industrial ethanol market, By region, 2019-2028 (USD THOUSAND)
TABLE 24 global Pharmaceutical in Industrial ethanol MARKET, by Raw material, 2019-2028 (USD thousand)
TABLE 25 GLOBAL agricultural in Industrial ethanol market, By region, 2019-2028 (USD THOUSAND)
TABLE 26 global Agricultural in Industrial ethanol MARKET, by Raw material, 2019-2028 (USD thousand)
TABLE 27 GLOBAL Paints and coatings in Industrial ethanol market, By region, 2019-2028 (USD THOUSAND)
TABLE 28 GLOBAL household and industrial cleaning solutions in Industrial ethanol market, By region, 2019-2028 (USD THOUSAND)
TABLE 29 GLOBAL adhesives in Industrial ethanol market, By region, 2019-2028 (USD THOUSAND)
TABLE 30 GLOBAL printing ink in Industrial ethanol market, By region, 2019-2028 (USD THOUSAND)
TABLE 31 GLOBAL others in Industrial ethanol market, By region, 2019-2028 (USD THOUSAND)
TABLE 32 GLOBAL Industrial ethanol Market, By region, 2019-2028 (USD Thousand)
TABLE 33 Global Industrial ethanol Market, By region, 2019-2028 (Thousand Liter)
TABLE 34 North America Industrial ethanol Market, By country, 2019-2028 (USD Thousand)
TABLE 35 North America Industrial ethanol market, BY COUNtry, 2019-2028 (Thousand liter)
TABLE 36 North America Industrial Ethanol Market, By Raw Material, 2019-2028 (USD Thousand)
TABLE 37 North America Bio-Based in Industrial Ethanol MARKET, BY RAW MATERIAL, 2019-2028 (USD Thousand)
TABLE 38 North America Grain IN INDUSTRIAL Ethanol MARKET, BY TYPE, 2019-2028 (USD Thousand)
TABLE 39 NORTH AMERICA INDUSTRIAL ETHANOL MARKET, BY RAW MATERIAL, 2019-2028 (THOUSAND liter)
TABLE 40 North America Industrial Ethanol Market, By Type, 2019-2028 (USD Thousand)
TABLE 41 North America Industrial Ethanol Market, By Application, 2019-2028 (USD Thousand)
TABLE 42 North America Pharmaceutical in Industrial Ethanol Market, By Application, 2019-2028 (USD Thousand)
TABLE 43 North America Food & BEVERAGES IN Industrial Ethanol Market, By Application, 2019-2028 (USD Thousand)
TABLE 44 North America Agricultural in Industrial Ethanol Market, By Application, 2019-2028 (USD Thousand)
TABLE 45 North America Cosmetics and Personal Care in Industrial Ethanol Market, By Application, 2019-2028 (USD Thousand)
TABLE 46 North America Oral Care in Industrial Ethanol Market, BY PRODUCTS, 2019-2028 (USD Thousand)
TABLE 47 North America Fragrance PRODUCTS IN INDUSTRIAL ETHANOL MARKET, BY PRODUCTS, 2019-2028 (USD THOUSAND)
TABLE 48 U.S. Industrial Ethanol Market, By Raw Material, 2019-2028 (USD Thousand)
TABLE 49 U.S. Bio-Based in Industrial Ethanol MARKET, BY RAW MATERIAL, 2019-2028 (USD Thousand)
TABLE 50 U.S. Grain IN INDUSTRIAL Ethanol MARKET, BY TYPE, 2019-2028 (USD Thousand)
TABLE 51 U.S. INDUSTRIAL ETHANOL MARKET, BY RAW MATERIAL, 2019-2028 (THOUSAND liter)
TABLE 52 U.S. Industrial Ethanol Market, By Type, 2019-2028 (USD Thousand)
TABLE 53 U.S. Industrial Ethanol Market, By Application, 2019-2028 (USD Thousand)
TABLE 54 U.S. Pharmaceutical in Industrial Ethanol Market, By Application, 2019-2028 (USD Thousand)
TABLE 55 U.S. Food & BEVERAGES IN Industrial Ethanol Market, By Application, 2019-2028 (USD Thousand)
TABLE 56 U.S. Agricultural in Industrial Ethanol Market, By Application, 2019-2028 (USD Thousand)
TABLE 57 U.S. Cosmetics and Personal Care in Industrial Ethanol Market, By Application, 2019-2028 (USD Thousand)
TABLE 58 U.S. Oral Care in Industrial Ethanol Market, BY PRODUCTS, 2019-2028 (USD Thousand)
TABLE 59 U.S. Fragrance PRODUCTS IN INDUSTRIAL ETHANOL MARKET, BY PRODUCTS, 2019-2028 (USD THOUSAND)
TABLE 60 CANADA Industrial Ethanol Market, By Raw Material, 2019-2028 (USD Thousand)
TABLE 61 CANADA Bio-Based in Industrial Ethanol MARKET, BY RAW MATERIAL, 2019-2028 (USD Thousand)
TABLE 62 CANADA Grain IN INDUSTRIAL Ethanol MARKET, BY TYPE, 2019-2028 (USD Thousand)
TABLE 63 CANADA INDUSTRIAL ETHANOL MARKET, BY RAW MATERIAL, 2019-2028 (THOUSAND liter)
TABLE 64 CANADA Industrial Ethanol Market, By Type, 2019-2028 (USD Thousand)
TABLE 65 CANADA Industrial Ethanol Market, By Application, 2019-2028 (USD Thousand)
TABLE 66 CANADA Pharmaceutical in Industrial Ethanol Market, By Application, 2019-2028 (USD Thousand)
TABLE 67 CANADA Food & BEVERAGES IN Industrial Ethanol Market, By Application, 2019-2028 (USD Thousand)
TABLE 68 CANADA Agricultural in Industrial Ethanol Market, By Application, 2019-2028 (USD Thousand)
TABLE 69 CANADA Cosmetics and Personal Care in Industrial Ethanol Market, By Application, 2019-2028 (USD Thousand)
TABLE 70 CANADA Oral Care in Industrial Ethanol Market, BY PRODUCTS, 2019-2028 (USD Thousand)
TABLE 71 CANADA Fragrance PRODUCTS IN INDUSTRIAL ETHANOL MARKET, BY PRODUCTS, 2019-2028 (USD THOUSAND)
TABLE 72 MEXICO Industrial Ethanol Market, By Raw Material, 2019-2028 (USD Thousand)
TABLE 73 MEXICO Bio-Based in Industrial Ethanol MARKET, BY RAW MATERIAL, 2019-2028 (USD Thousand)
TABLE 74 MEXICO Grain IN INDUSTRIAL Ethanol MARKET, BY TYPE, 2019-2028 (USD Thousand)
TABLE 75 MEXICO INDUSTRIAL ETHANOL MARKET, BY RAW MATERIAL, 2019-2028 (THOUSAND liter)
TABLE 76 MEXICO Industrial Ethanol Market, By Type, 2019-2028 (USD Thousand)
TABLE 77 MEXICO Industrial Ethanol Market, By Application, 2019-2028 (USD Thousand)
TABLE 78 MEXICO Pharmaceutical in Industrial Ethanol Market, By Application, 2019-2028 (USD Thousand)
TABLE 79 MEXICO Food & BEVERAGES IN Industrial Ethanol Market, By Application, 2019-2028 (USD Thousand)
TABLE 80 MEXICO Agricultural in Industrial Ethanol Market, By Application, 2019-2028 (USD Thousand)
TABLE 81 MEXICO Cosmetics and Personal Care in Industrial Ethanol Market, By Application, 2019-2028 (USD Thousand)
TABLE 82 MEXICO Oral Care in Industrial Ethanol Market, BY PRODUCTS, 2019-2028 (USD Thousand)
TABLE 83 MEXICO Fragrance PRODUCTS IN INDUSTRIAL ETHANOL MARKET, BY PRODUCTS, 2019-2028 (USD THOUSAND)
TABLE 84 Asia-Pacific Industrial ethanol Market, By country, 2019-2028 (USD Thousand)
TABLE 85 Asia-Pacific industrial ethanol market, BY COUNtry, 2019-2028 (Thousand liter)
TABLE 86 Asia-Pacific Industrial Ethanol Market, By Raw Material, 2019-2028 (USD Thousand)
TABLE 87 Asia-Pacific Bio-Based in Industrial Ethanol MARKET, BY RAW MATERIAL, 2019-2028 (USD Thousand)
TABLE 88 Asia-Pacific Grain in Industrial Ethanol Market, BY TYPE, 2019-2028 (USD Thousand)
TABLE 89 ASIA-PACIFIC INDUSTRIAL ETHANOL MARKET, BY RAW MATERIAL, 2019-2028 (THOUSAND liter)
TABLE 90 Asia-Pacific Industrial Ethanol Market, By Type, 2019-2028 (USD Thousand)
TABLE 91 Asia-Pacific Industrial Ethanol Market, By Application, 2019-2028 (USD Thousand)
TABLE 92 Asia-Pacific Pharmaceutical in Industrial Ethanol Market, By Application, 2019-2028 (USD Thousand)
TABLE 93 Asia-Pacific Food & BEVERAGES IN Industrial Ethanol Market, By Application, 2019-2028 (USD Thousand)
TABLE 94 Asia-Pacific Agricultural in Industrial Ethanol Market, By Application, 2019-2028 (USD Thousand)
TABLE 95 Asia-Pacific Cosmetics and Personal Care in Industrial Ethanol Market, By Application, 2019-2028 (USD Thousand)
TABLE 96 Asia-Pacific Oral Care in Industrial Ethanol Market, BY PRODUCTS, 2019-2028 (USD Thousand)
TABLE 97 Asia-Pacific FRAGRANCE PRODUCTS IN INDUSTRIAL ETHANOL MARKET, BY PRODUCTS, 2019-2028 (USD THOUSAND)
TABLE 98 China Industrial Ethanol Market, By Raw Material, 2019-2028 (USD Thousand)
TABLE 99 China Bio-Based in Industrial Ethanol MARKET, BY RAW MATERIAL, 2019-2028 (USD Thousand)
TABLE 100 China Grain IN INDUSTRIAL Ethanol MARKET, BY TYPE, 2019-2028 (USD Thousand)
TABLE 101 CHINA INDUSTRIAL ETHANOL MARKET, BY RAW MATERIAL, 2019-2028 (THOUSAND liter)
TABLE 102 China Industrial Ethanol Market, By Type, 2019-2028 (USD Thousand)
TABLE 103 China Industrial Ethanol Market, By Application, 2019-2028 (USD Thousand)
TABLE 104 China Pharmaceutical in Industrial Ethanol Market, By Application, 2019-2028 (USD Thousand)
TABLE 105 China Food & BEVERAGES IN Industrial Ethanol Market, By Application, 2019-2028 (USD Thousand)
TABLE 106 China Agricultural in Industrial Ethanol Market, By Application, 2019-2028 (USD Thousand)
TABLE 107 China Cosmetics and Personal Care in Industrial Ethanol Market, By Application, 2019-2028 (USD Thousand)
TABLE 108 China Oral Care in Industrial Ethanol Market, BY PRODUCTS, 2019-2028 (USD Thousand)
TABLE 109 China FRAGRANCE PRODUCTS IN INDUSTRIAL ETHANOL MARKET, BY PRODUCTS, 2019-2028 (USD THOUSAND)
TABLE 110 Japan Industrial Ethanol Market, By Raw Material, 2019-2028 (USD Thousand)
TABLE 111 Japan Bio-Based in Industrial Ethanol MARKET, BY RAW MATERIAL, 2019-2028 (USD Thousand)
TABLE 112 Japan Grain IN INDUSTRIAL Ethanol MARKET, BY TYPE, 2019-2028 (USD Thousand)
TABLE 113 JAPAN INDUSTRIAL ETHANOL MARKET, BY RAW MATERIAL, 2019-2028 (THOUSAND liter)
TABLE 114 Japan Industrial Ethanol Market, By Type, 2019-2028 (USD Thousand)
TABLE 115 Japan Industrial Ethanol Market, By Application, 2019-2028 (USD Thousand)
TABLE 116 Japan Pharmaceutical in Industrial Ethanol Market, By Application, 2019-2028 (USD Thousand)
TABLE 117 Japan Food & BEVERAGES IN Industrial Ethanol Market, By Application, 2019-2028 (USD Thousand)
TABLE 118 Japan Agricultural in Industrial Ethanol Market, By Application, 2019-2028 (USD Thousand)
TABLE 119 Japan Cosmetics and Personal Care in Industrial Ethanol Market, By Application, 2019-2028 (USD Thousand)
TABLE 120 Japan Oral Care in Industrial Ethanol Market, BY PRODUCTS, 2019-2028 (USD Thousand)
TABLE 121 Japan FRAGRANCE PRODUCTS IN INDUSTRIAL ETHANOL MARKET, BY PRODUCTS, 2019-2028 (USD THOUSAND)
TABLE 122 India Industrial Ethanol Market, By Raw Material, 2019-2028 (USD Thousand)
TABLE 123 India Bio-Based in Industrial Ethanol MARKET, BY RAW MATERIAL, 2019-2028 (USD Thousand)
TABLE 124 India Grain IN INDUSTRIAL Ethanol MARKET, BY TYPE, 2019-2028 (USD Thousand)
TABLE 125 INDIA INDUSTRIAL ETHANOL MARKET, BY RAW MATERIAL, 2019-2028 (THOUSAND liter)
TABLE 126 India Industrial Ethanol Market, By Type, 2019-2028 (USD Thousand)
TABLE 127 India Industrial Ethanol Market, By Application, 2019-2028 (USD Thousand)
TABLE 128 India Pharmaceutical in Industrial Ethanol Market, By Application, 2019-2028 (USD Thousand)
TABLE 129 India Food & BEVERAGES IN Industrial Ethanol Market, By Application, 2019-2028 (USD Thousand)
TABLE 130 India Agricultural in Industrial Ethanol Market, By Application, 2019-2028 (USD Thousand)
TABLE 131 India Cosmetics and Personal Care in Industrial Ethanol Market, By Application, 2019-2028 (USD Thousand)
TABLE 132 India Oral Care in Industrial Ethanol Market, BY PRODUCTS, 2019-2028 (USD Thousand)
TABLE 133 India FRAGRANCE PRODUCTS IN INDUSTRIAL ETHANOL MARKET, BY PRODUCTS, 2019-2028 (USD THOUSAND)
TABLE 134 South Korea Industrial Ethanol Market, By Raw Material, 2019-2028 (USD Thousand)
TABLE 135 South Korea Bio-Based in Industrial Ethanol MARKET, BY RAW MATERIAL, 2019-2028 (USD Thousand)
TABLE 136 South Korea Grain IN INDUSTRIAL Ethanol MARKET, BY TYPE, 2019-2028 (USD Thousand)
TABLE 137 SOUTH KOREA INDUSTRIAL ETHANOL MARKET, BY RAW MATERIAL, 2019-2028 (THOUSAND liter)
TABLE 138 South Korea Industrial Ethanol Market, By Type, 2019-2028 (USD Thousand)
TABLE 139 South Korea Industrial Ethanol Market, By Application, 2019-2028 (USD Thousand)
TABLE 140 South Korea Pharmaceutical in Industrial Ethanol Market, By Application, 2019-2028 (USD Thousand)
TABLE 141 South Korea Food & BEVERAGES IN Industrial Ethanol Market, By Application, 2019-2028 (USD Thousand)
TABLE 142 South Korea Agricultural in Industrial Ethanol Market, By Application, 2019-2028 (USD Thousand)
TABLE 143 South Korea Cosmetics and Personal Care in Industrial Ethanol Market, By Application, 2019-2028 (USD Thousand)
TABLE 144 South Korea Oral Care in Industrial Ethanol Market, BY PRODUCTS, 2019-2028 (USD Thousand)
TABLE 145 South Korea FRAGRANCE PRODUCTS IN INDUSTRIAL ETHANOL MARKET, BY PRODUCTS, 2019-2028 (USD THOUSAND)
TABLE 146 Australia and New Zealand Industrial Ethanol Market, By Raw Material, 2019-2028 (USD Thousand)
TABLE 147 Australia and New Zealand Bio-Based in Industrial Ethanol MARKET, BY RAW MATERIAL, 2019-2028 (USD Thousand)
TABLE 148 Australia and New Zealand Grain IN INDUSTRIAL Ethanol MARKET, BY TYPE, 2019-2028 (USD Thousand)
TABLE 149 AUSTRALIA AND NEW ZEALAND INDUSTRIAL ETHANOL MARKET, BY RAW MATERIAL, 2019-2028 (THOUSAND liter)
TABLE 150 Australia and New Zealand Industrial Ethanol Market, By Type, 2019-2028 (USD Thousand)
TABLE 151 Australia and New Zealand Industrial Ethanol Market, By Application, 2019-2028 (USD Thousand)
TABLE 152 Australia and New Zealand Pharmaceutical in Industrial Ethanol Market, By Application, 2019-2028 (USD Thousand)
TABLE 153 Australia and New Zealand Food & BEVERAGES IN Industrial Ethanol Market, By Application, 2019-2028 (USD Thousand)
TABLE 154 Australia and New Zealand Agricultural in Industrial Ethanol Market, By Application, 2019-2028 (USD Thousand)
TABLE 155 Australia and New Zealand Cosmetics and Personal Care in Industrial Ethanol Market, By Application, 2019-2028 (USD Thousand)
TABLE 156 Australia and New Zealand Oral Care in Industrial Ethanol Market, BY PRODUCTS, 2019-2028 (USD Thousand)
TABLE 157 Australia and New Zealand FRAGRANCE PRODUCTS IN INDUSTRIAL ETHANOL MARKET, BY PRODUCTS, 2019-2028 (USD THOUSAND)
TABLE 158 Indonesia Industrial Ethanol Market, By Raw Material, 2019-2028 (USD Thousand)
TABLE 159 Indonesia Bio-Based in Industrial Ethanol MARKET, BY RAW MATERIAL, 2019-2028 (USD Thousand)
TABLE 160 Indonesia Grain IN INDUSTRIAL Ethanol MARKET, BY TYPE, 2019-2028 (USD Thousand)
TABLE 161 INDONESIA INDUSTRIAL ETHANOL MARKET, BY RAW MATERIAL, 2019-2028 (THOUSAND liter)
TABLE 162 Indonesia Industrial Ethanol Market, By Type, 2019-2028 (USD Thousand)
TABLE 163 Indonesia Industrial Ethanol Market, By Application, 2019-2028 (USD Thousand)
TABLE 164 Indonesia Pharmaceutical in Industrial Ethanol Market, By Application, 2019-2028 (USD Thousand)
TABLE 165 Indonesia Food & BEVERAGES IN Industrial Ethanol Market, By Application, 2019-2028 (USD Thousand)
TABLE 166 Indonesia Agricultural in Industrial Ethanol Market, By Application, 2019-2028 (USD Thousand)
TABLE 167 Indonesia Cosmetics and Personal Care in Industrial Ethanol Market, By Application, 2019-2028 (USD Thousand)
TABLE 168 Indonesia Oral Care in Industrial Ethanol Market, BY PRODUCTS, 2019-2028 (USD Thousand)
TABLE 169 Indonesia FRAGRANCE PRODUCTS IN INDUSTRIAL ETHANOL MARKET, BY PRODUCTS, 2019-2028 (USD THOUSAND)
TABLE 170 Singapore Industrial Ethanol Market, By Raw Material, 2019-2028 (USD Thousand)
TABLE 171 Singapore Bio-Based in Industrial Ethanol MARKET, BY RAW MATERIAL, 2019-2028 (USD Thousand)
TABLE 172 Singapore Grain IN INDUSTRIAL Ethanol MARKET, BY TYPE, 2019-2028 (USD Thousand)
TABLE 173 SINGAPORE INDUSTRIAL ETHANOL MARKET, BY RAW MATERIAL, 2019-2028 (THOUSAND liter)
TABLE 174 Singapore Industrial Ethanol Market, By Type, 2019-2028 (USD Thousand)
TABLE 175 Singapore Industrial Ethanol Market, By Application, 2019-2028 (USD Thousand)
TABLE 176 Singapore Pharmaceutical in Industrial Ethanol Market, By Application, 2019-2028 (USD Thousand)
TABLE 177 Singapore Food & BEVERAGES IN Industrial Ethanol Market, By Application, 2019-2028 (USD Thousand)
TABLE 178 Singapore Agricultural in Industrial Ethanol Market, By Application, 2019-2028 (USD Thousand)
TABLE 179 Singapore Cosmetics and Personal Care in Industrial Ethanol Market, By Application, 2019-2028 (USD Thousand)
TABLE 180 Singapore Oral Care in Industrial Ethanol Market, BY PRODUCTS, 2019-2028 (USD Thousand)
TABLE 181 Singapore FRAGRANCE PRODUCTS IN INDUSTRIAL ETHANOL MARKET, BY PRODUCTS, 2019-2028 (USD THOUSAND)
TABLE 182 Malaysia Industrial Ethanol Market, By Raw Material, 2019-2028 (USD Thousand)
TABLE 183 Malaysia Bio-Based in Industrial Ethanol MARKET, BY RAW MATERIAL, 2019-2028 (USD Thousand)
TABLE 184 Malaysia Grain IN INDUSTRIAL Ethanol MARKET, BY TYPE, 2019-2028 (USD Thousand)
TABLE 185 MALAYSIA INDUSTRIAL ETHANOL MARKET, BY RAW MATERIAL, 2019-2028 (THOUSAND liter)
TABLE 186 Malaysia Industrial Ethanol Market, By Type, 2019-2028 (USD Thousand)
TABLE 187 Malaysia Industrial Ethanol Market, By Application, 2019-2028 (USD Thousand)
TABLE 188 Malaysia Pharmaceutical in Industrial Ethanol Market, By Application, 2019-2028 (USD Thousand)
TABLE 189 Malaysia Food & BEVERAGES IN Industrial Ethanol Market, By Application, 2019-2028 (USD Thousand)
TABLE 190 Malaysia Agricultural in Industrial Ethanol Market, By Application, 2019-2028 (USD Thousand)
TABLE 191 Malaysia Cosmetics and Personal Care in Industrial Ethanol Market, By Application, 2019-2028 (USD Thousand)
TABLE 192 Malaysia Oral Care in Industrial Ethanol Market, BY PRODUCTS, 2019-2028 (USD Thousand)
TABLE 193 Malaysia FRAGRANCE PRODUCTS IN INDUSTRIAL ETHANOL MARKET, BY PRODUCTS, 2019-2028 (USD THOUSAND)
TABLE 194 Thailand Industrial Ethanol Market, By Raw Material, 2019-2028 (USD Thousand)
TABLE 195 Thailand Bio-Based in Industrial Ethanol MARKET, BY RAW MATERIAL, 2019-2028 (USD Thousand)
TABLE 196 Thailand Grain IN INDUSTRIAL Ethanol MARKET, BY TYPE, 2019-2028 (USD Thousand)
TABLE 197 THAILAND INDUSTRIAL ETHANOL MARKET, BY RAW MATERIAL, 2019-2028 (THOUSAND liter)
TABLE 198 Thailand Industrial Ethanol Market, By Type, 2019-2028 (USD Thousand)
TABLE 199 Thailand Industrial Ethanol Market, By Application, 2019-2028 (USD Thousand)
TABLE 200 Thailand Pharmaceutical in Industrial Ethanol Market, By Application, 2019-2028 (USD Thousand)
TABLE 201 Thailand Food & BEVERAGES IN Industrial Ethanol Market, By Application, 2019-2028 (USD Thousand)
TABLE 202 Thailand Agricultural in Industrial Ethanol Market, By Application, 2019-2028 (USD Thousand)
TABLE 203 Thailand Cosmetics and Personal Care in Industrial Ethanol Market, By Application, 2019-2028 (USD Thousand)
TABLE 204 Thailand Oral Care in Industrial Ethanol Market, BY PRODUCTS, 2019-2028 (USD Thousand)
TABLE 205 Thailand FRAGRANCE PRODUCTS IN INDUSTRIAL ETHANOL MARKET, BY PRODUCTS, 2019-2028 (USD THOUSAND)
TABLE 206 Philippines Industrial Ethanol Market, By Raw Material, 2019-2028 (USD Thousand)
TABLE 207 Philippines Bio-Based in Industrial Ethanol MARKET, BY RAW MATERIAL, 2019-2028 (USD Thousand)
TABLE 208 Philippines Grain IN INDUSTRIAL Ethanol MARKET, BY TYPE, 2019-2028 (USD Thousand)
TABLE 209 PHILIPPINES INDUSTRIAL ETHANOL MARKET, BY RAW MATERIAL, 2019-2028 (THOUSAND liter)
TABLE 210 Philippines Industrial Ethanol Market, By Type, 2019-2028 (USD Thousand)
TABLE 211 Philippines Industrial Ethanol Market, By Application, 2019-2028 (USD Thousand)
TABLE 212 Philippines Pharmaceutical in Industrial Ethanol Market, By Application, 2019-2028 (USD Thousand)
TABLE 213 Philippines Food & BEVERAGES IN Industrial Ethanol Market, By Application, 2019-2028 (USD Thousand)
TABLE 214 Philippines Agricultural in Industrial Ethanol Market, By Application, 2019-2028 (USD Thousand)
TABLE 215 Philippines Cosmetics and Personal Care in Industrial Ethanol Market, By Application, 2019-2028 (USD Thousand)
TABLE 216 Philippines Oral Care in Industrial Ethanol Market, BY PRODUCTS, 2019-2028 (USD Thousand)
TABLE 217 Philippines FRAGRANCE PRODUCTS IN INDUSTRIAL ETHANOL MARKET, BY PRODUCTS, 2019-2028 (USD THOUSAND)
TABLE 218 Rest of Asia-Pacific Industrial Ethanol Market, By Raw Material, 2019-2028 (USD Thousand)
TABLE 219 REST OF ASIA-PACIFIC INDUSTRIAL ETHANOL MARKET, BY RAW MATERIAL, 2019-2028 (THOUSAND liter)
TABLE 220 Europe Industrial ethanol Market, By country, 2019-2028 (USD Thousand)
TABLE 221 Europe industrial ethanol market, BY COUNtry, 2019-2028 (Thousand liter)
TABLE 222 Europe Industrial Ethanol Market, By Raw Material, 2019-2028 (USD Thousand)
TABLE 223 Europe Bio-Based in Industrial Ethanol MARKET, BY Raw Material, 2019-2028 (USD Thousand)
TABLE 224 Europe Grain IN INDUSTRIAL Ethanol MARKET, BY TYPE, 2019-2028 (USD Thousand)
TABLE 225 EUROPE INDUSTRIAL ETHANOL MARKET, BY RAW MATERIAL, 2019-2028 (THOUSAND liter)
TABLE 226 Europe Industrial Ethanol Market, By Type, 2019-2028 (USD Thousand)
TABLE 227 Europe Industrial Ethanol Market, By Application, 2019-2028 (USD Thousand)
TABLE 228 Europe Pharmaceutical in Industrial Ethanol Market, By Application, 2019-2028 (USD Thousand)
TABLE 229 Europe Food & BEVERAGES IN Industrial Ethanol Market, By Application, 2019-2028 (USD Thousand)
TABLE 230 Europe Agricultural in Industrial Ethanol Market, By Application, 2019-2028 (USD Thousand)
TABLE 231 Europe Cosmetics and Personal Care in Industrial Ethanol Market, By Application, 2019-2028 (USD Thousand)
TABLE 232 Europe Oral Care in Industrial Ethanol Market, By Products, 2019-2028 (USD Thousand)
TABLE 233 Europe FRAGRANCE PRODUCTS IN INDUSTRIAL ETHANOL MARKET, BY PRODUCTS, 2019-2028 (USD THOUSAND)
TABLE 234 Germany Industrial Ethanol Market, By Raw Material, 2019-2028 (USD Thousand)
TABLE 235 Germany Bio-Based in Industrial Ethanol MARKET, BY Raw Material, 2019-2028 (USD Thousand)
TABLE 236 Germany Grain IN INDUSTRIAL Ethanol MARKET, BY Type, 2019-2028 (USD Thousand)
TABLE 237 GERMANY INDUSTRIAL ETHANOL MARKET, BY RAW MATERIAL, 2019-2028 (THOUSAND liter)
TABLE 238 Germany Industrial Ethanol Market, By Type, 2019-2028 (USD Thousand)
TABLE 239 Germany Industrial Ethanol Market, By Application, 2019-2028 (USD Thousand)
TABLE 240 Germany Pharmaceutical in Industrial Ethanol Market, By Application, 2019-2028 (USD Thousand)
TABLE 241 ermany Food & BEVERAGES IN Industrial Ethanol Market, By Application, 2019-2028 (USD Thousand)
TABLE 242 Germany Agricultural in Industrial Ethanol Market, By Application, 2019-2028 (USD Thousand)
TABLE 243 Germany Cosmetics and Personal Care in Industrial Ethanol Market, By Application, 2019-2028 (USD Thousand)
TABLE 244 Germany Oral Care in Industrial Ethanol Market, BY PRODUCTS, 2019-2028 (USD Thousand)
TABLE 245 Germany FRAGRANCE PRODUCTS IN INDUSTRIAL ETHANOL MARKET, BY PRODUCTS, 2019-2028 (USD THOUSAND)
TABLE 246 U.K. Industrial Ethanol Market, By Raw Material, 2019-2028 (USD Thousand)
TABLE 247 U.K. Bio-Based in Industrial Ethanol MARKET, BY RAW MATERIAL, 2019-2028 (USD Thousand)
TABLE 248 U.K. Grain IN INDUSTRIAL Ethanol MARKET, BY TYPE, 2019-2028 (USD Thousand)
TABLE 249 U.K. INDUSTRIAL ETHANOL MARKET, BY RAW MATERIAL, 2019-2028 (THOUSAND liter)
TABLE 250 U.K. Industrial Ethanol Market, By Type, 2019-2028 (USD Thousand)
TABLE 251 U.K. Industrial Ethanol Market, By Application, 2019-2028 (USD Thousand)
TABLE 252 U.K. Pharmaceutical in Industrial Ethanol Market, By Application, 2019-2028 (USD Thousand)
TABLE 253 U.K. Food & BEVERAGES IN Industrial Ethanol Market, By Application, 2019-2028 (USD Thousand)
TABLE 254 U.K. Agricultural in Industrial Ethanol Market, By Application, 2019-2028 (USD Thousand)
TABLE 255 U.K. Cosmetics and Personal Care in Industrial Ethanol Market, By Application, 2019-2028 (USD Thousand)
TABLE 256 U.K. Oral Care in Industrial Ethanol Market, BY PRODUCTS, 2019-2028 (USD Thousand)
TABLE 257 U.K. FRAGRANCE PRODUCTS IN INDUSTRIAL ETHANOL MARKET, BY PRODUCTS, 2019-2028 (USD THOUSAND)
TABLE 258 FRANCE Industrial Ethanol Market, By Raw Material, 2019-2028 (USD Thousand)
TABLE 259 FRANCE Bio-Based in Industrial Ethanol MARKET, BY RAW MATERIAL, 2019-2028 (USD Thousand)
TABLE 260 FRANCE Grain IN INDUSTRIAL Ethanol MARKET, BY TYPE, 2019-2028 (USD Thousand)
TABLE 261 FRANCE INDUSTRIAL ETHANOL MARKET, BY RAW MATERIAL, 2019-2028 (THOUSAND liter)
TABLE 262 FRANCE Industrial Ethanol Market, By Type, 2019-2028 (USD Thousand)
TABLE 263 FRANCE Industrial Ethanol Market, By Application, 2019-2028 (USD Thousand)
TABLE 264 FRANCE Pharmaceutical in Industrial Ethanol Market, By Application, 2019-2028 (USD Thousand)
TABLE 265 FRANCE Food & BEVERAGES IN Industrial Ethanol Market, By Application, 2019-2028 (USD Thousand)
TABLE 266 FRANCE Agricultural in Industrial Ethanol Market, By Application, 2019-2028 (USD Thousand)
TABLE 267 FRANCE Cosmetics and Personal Care in Industrial Ethanol Market, By Application, 2019-2028 (USD Thousand)
TABLE 268 FRANCE Oral Care in Industrial Ethanol Market, BY PRODUCTS, 2019-2028 (USD Thousand)
TABLE 269 FRANCE FRAGRANCE PRODUCTS IN INDUSTRIAL ETHANOL MARKET, BY PRODUCTS, 2019-2028 (USD THOUSAND)
TABLE 270 RUSSIA Industrial Ethanol Market, By Raw Material, 2019-2028 (USD Thousand)
TABLE 271 RUSSIA Bio-Based in Industrial Ethanol MARKET, BY RAW MATERIAL, 2019-2028 (USD Thousand)
TABLE 272 RUSSIA Grain IN INDUSTRIAL Ethanol MARKET, BY TYPE, 2019-2028 (USD Thousand)
TABLE 273 RUSSIA INDUSTRIAL ETHANOL MARKET, BY RAW MATERIAL, 2019-2028 (THOUSAND liter)
TABLE 274 RUSSIA Industrial Ethanol Market, By Type, 2019-2028 (USD Thousand)
TABLE 275 RUSSIA Industrial Ethanol Market, By Application, 2019-2028 (USD Thousand)
TABLE 276 RUSSIA Pharmaceutical in Industrial Ethanol Market, By Application, 2019-2028 (USD Thousand)
TABLE 277 RUSSIA Food & BEVERAGES IN Industrial Ethanol Market, By Application, 2019-2028 (USD Thousand)
TABLE 278 RUSSIA Agricultural in Industrial Ethanol Market, By Application, 2019-2028 (USD Thousand)
TABLE 279 RUSSIA Cosmetics and Personal Care in Industrial Ethanol Market, By Application, 2019-2028 (USD Thousand)
TABLE 280 RUSSIA Oral Care in Industrial Ethanol Market, BY PRODUCTS, 2019-2028 (USD Thousand)
TABLE 281 RUSSIA FRAGRANCE PRODUCTS IN INDUSTRIAL ETHANOL MARKET, BY PRODUCTS, 2019-2028 (USD THOUSAND)
TABLE 282 TURKEY Industrial Ethanol Market, By Raw Material, 2019-2028 (USD Thousand)
TABLE 283 TURKEY Bio-Based in Industrial Ethanol MARKET, BY RAW MATERIAL, 2019-2028 (USD Thousand)
TABLE 284 TURKEY Grain IN INDUSTRIAL Ethanol MARKET, BY TYPE, 2019-2028 (USD Thousand)
TABLE 285 TURKEY INDUSTRIAL ETHANOL MARKET, BY RAW MATERIAL, 2019-2028 (THOUSAND liter)
TABLE 286 TURKEY Industrial Ethanol Market, By Type, 2019-2028 (USD Thousand)
TABLE 287 TURKEY Industrial Ethanol Market, By Application, 2019-2028 (USD Thousand)
TABLE 288 TURKEY Pharmaceutical in Industrial Ethanol Market, By Application, 2019-2028 (USD Thousand)
TABLE 289 TURKEY Food & BEVERAGES IN Industrial Ethanol Market, By Application, 2019-2028 (USD Thousand)
TABLE 290 TURKEY Agricultural in Industrial Ethanol Market, By Application, 2019-2028 (USD Thousand)
TABLE 291 TURKEY Cosmetics and Personal Care in Industrial Ethanol Market, By Application, 2019-2028 (USD Thousand)
TABLE 292 TURKEY Oral Care in Industrial Ethanol Market, BY PRODUCTS, 2019-2028 (USD Thousand)
TABLE 293 TURKEY FRAGRANCE PRODUCTS IN INDUSTRIAL ETHANOL MARKET, BY PRODUCTS, 2019-2028 (USD THOUSAND)
TABLE 294 ITALY Industrial Ethanol Market, By Raw Material, 2019-2028 (USD Thousand)
TABLE 295 ITALY Bio-Based in Industrial Ethanol MARKET, BY RAW MATERIAL, 2019-2028 (USD Thousand)
TABLE 296 ITALY Grain IN INDUSTRIAL Ethanol MARKET, BY TYPE, 2019-2028 (USD Thousand)
TABLE 297 ITALY INDUSTRIAL ETHANOL MARKET, BY RAW MATERIAL, 2019-2028 (THOUSAND liter)
TABLE 298 ITALY Industrial Ethanol Market, By Type, 2019-2028 (USD Thousand)
TABLE 299 ITALY Industrial Ethanol Market, By Application, 2019-2028 (USD Thousand)
TABLE 300 ITALY Pharmaceutical in Industrial Ethanol Market, By Application, 2019-2028 (USD Thousand)
TABLE 301 ITALY Food & BEVERAGES IN Industrial Ethanol Market, By Application, 2019-2028 (USD Thousand)
TABLE 302 ITALY Agricultural in Industrial Ethanol Market, By Application, 2019-2028 (USD Thousand)
TABLE 303 ITALY Cosmetics and Personal Care in Industrial Ethanol Market, By Application, 2019-2028 (USD Thousand)
TABLE 304 ITALY Oral Care in Industrial Ethanol Market, BY PRODUCTS, 2019-2028 (USD Thousand)
TABLE 305 ITALY FRAGRANCE PRODUCTS IN INDUSTRIAL ETHANOL MARKET, BY PRODUCTS, 2019-2028 (USD THOUSAND)
TABLE 306 SPAIN Industrial Ethanol Market, By Raw Material, 2019-2028 (USD Thousand)
TABLE 307 SPAIN Bio-Based in Industrial Ethanol MARKET, BY RAW MATERIAL, 2019-2028 (USD Thousand)
TABLE 308 SPAIN Grain IN INDUSTRIAL Ethanol MARKET, BY TYPE, 2019-2028 (USD Thousand)
TABLE 309 SPAIN INDUSTRIAL ETHANOL MARKET, BY RAW MATERIAL, 2019-2028 (THOUSAND liter)
TABLE 310 SPAIN Industrial Ethanol Market, By Type, 2019-2028 (USD Thousand)
TABLE 311 SPAIN Industrial Ethanol Market, By Application, 2019-2028 (USD Thousand)
TABLE 312 SPAIN Pharmaceutical in Industrial Ethanol Market, By Application, 2019-2028 (USD Thousand)
TABLE 313 SPAIN Food & BEVERAGES IN Industrial Ethanol Market, By Application, 2019-2028 (USD Thousand)
TABLE 314 SPAIN Agricultural in Industrial Ethanol Market, By Application, 2019-2028 (USD Thousand)
TABLE 315 SPAIN Cosmetics and Personal Care in Industrial Ethanol Market, By Application, 2019-2028 (USD Thousand)
TABLE 316 SPAIN Oral Care in Industrial Ethanol Market, BY PRODUCTS, 2019-2028 (USD Thousand)
TABLE 317 SPAIN FRAGRANCE PRODUCTS IN INDUSTRIAL ETHANOL MARKET, BY PRODUCTS, 2019-2028 (USD THOUSAND)
TABLE 318 SWITZERLAND Industrial Ethanol Market, By Raw Material, 2019-2028 (USD Thousand)
TABLE 319 SWITZERLAND Bio-Based in Industrial Ethanol MARKET, BY RAW MATERIAL, 2019-2028 (USD Thousand)
TABLE 320 SWITZERLAND Grain IN INDUSTRIAL Ethanol MARKET, BY TYPE, 2019-2028 (USD Thousand)
TABLE 321 SWITZERLAND INDUSTRIAL ETHANOL MARKET, BY RAW MATERIAL, 2019-2028 (THOUSAND liter)
TABLE 322 SWITZERLAND Industrial Ethanol Market, By Type, 2019-2028 (USD Thousand)
TABLE 323 SWITZERLAND Industrial Ethanol Market, By Application, 2019-2028 (USD Thousand)
TABLE 324 SWITZERLAND Pharmaceutical in Industrial Ethanol Market, By Application, 2019-2028 (USD Thousand)
TABLE 325 SWITZERLAND Food & BEVERAGES IN Industrial Ethanol Market, By Application, 2019-2028 (USD Thousand)
TABLE 326 SWITZERLAND Agricultural in Industrial Ethanol Market, By Application, 2019-2028 (USD Thousand)
TABLE 327 SWITZERLAND Cosmetics and Personal Care in Industrial Ethanol Market, By Application, 2019-2028 (USD Thousand)
TABLE 328 SWITZERLAND Oral Care in Industrial Ethanol Market, BY PRODUCTS, 2019-2028 (USD Thousand)
TABLE 329 SWITZERLAND FRAGRANCE PRODUCTS IN INDUSTRIAL ETHANOL MARKET, BY PRODUCTS, 2019-2028 (USD THOUSAND)
TABLE 330 BELGIUM Industrial Ethanol Market, By Raw Material, 2019-2028 (USD Thousand)
TABLE 331 BELGIUM Bio-Based in Industrial Ethanol MARKET, BY RAW MATERIAL, 2019-2028 (USD Thousand)
TABLE 332 BELGIUM Grain IN INDUSTRIAL Ethanol MARKET, BY TYPE, 2019-2028 (USD Thousand)
TABLE 333 BELGIUM INDUSTRIAL ETHANOL MARKET, BY RAW MATERIAL, 2019-2028 (THOUSAND liter)
TABLE 334 BELGIUM Industrial Ethanol Market, By Type, 2019-2028 (USD Thousand)
TABLE 335 BELGIUM Industrial Ethanol Market, By Application, 2019-2028 (USD Thousand)
TABLE 336 BELGIUM Pharmaceutical in Industrial Ethanol Market, By Application, 2019-2028 (USD Thousand)
TABLE 337 BELGIUM Food & BEVERAGES IN Industrial Ethanol Market, By Application, 2019-2028 (USD Thousand)
TABLE 338 BELGIUM Agricultural in Industrial Ethanol Market, By Application, 2019-2028 (USD Thousand)
TABLE 339 BELGIUM Cosmetics and Personal Care in Industrial Ethanol Market, By Application, 2019-2028 (USD Thousand)
TABLE 340 BELGIUM Oral Care in Industrial Ethanol Market, BY PRODUCTS, 2019-2028 (USD Thousand)
TABLE 341 BELGIUM FRAGRANCE PRODUCTS IN INDUSTRIAL ETHANOL MARKET, BY PRODUCTS, 2019-2028 (USD THOUSAND)
TABLE 342 NETHERLANDS Industrial Ethanol Market, By Raw Material, 2019-2028 (USD Thousand)
TABLE 343 NETHERLANDS Bio-Based in Industrial Ethanol MARKET, BY RAW MATERIAL, 2019-2028 (USD Thousand)
TABLE 344 NETHERLANDS Grain IN INDUSTRIAL Ethanol MARKET, BY TYPE, 2019-2028 (USD Thousand)
TABLE 345 NETHERLANDS INDUSTRIAL ETHANOL MARKET, BY RAW MATERIAL, 2019-2028 (THOUSAND liter)
TABLE 346 NETHERLANDS Industrial Ethanol Market, By Type, 2019-2028 (USD Thousand)
TABLE 347 NETHERLANDS Industrial Ethanol Market, By Application, 2019-2028 (USD Thousand)
TABLE 348 NETHERLANDS Pharmaceutical in Industrial Ethanol Market, By Application, 2019-2028 (USD Thousand)
TABLE 349 NETHERLANDS Food & BEVERAGES IN Industrial Ethanol Market, By Application, 2019-2028 (USD Thousand)
TABLE 350 NETHERLANDS Agricultural in Industrial Ethanol Market, By Application, 2019-2028 (USD Thousand)
TABLE 351 NETHERLANDS Cosmetics and Personal Care in Industrial Ethanol Market, By Application, 2019-2028 (USD Thousand)
TABLE 352 NETHERLANDS Oral Care in Industrial Ethanol Market, BY PRODUCTS, 2019-2028 (USD Thousand)
TABLE 353 NETHERLANDS FRAGRANCE PRODUCTS IN INDUSTRIAL ETHANOL MARKET, BY PRODUCTS, 2019-2028 (USD THOUSAND)
TABLE 354 REST OF EUROPE Industrial Ethanol Market, By Raw Material, 2019-2028 (USD Thousand)
TABLE 355 REST OF EUROPE INDUSTRIAL ETHANOL MARKET, BY RAW MATERIAL, 2019-2028 (THOUSAND liter)
TABLE 356 South America Industrial ethanol Market, By country, 2019-2028 (USD Thousand)
TABLE 357 South America industrial ethanol market, BY COUNtry, 2019-2028 (Thousand liter)
TABLE 358 South America Industrial Ethanol Market, By Raw Material, 2019-2028 (USD Thousand)
TABLE 359 South America Bio-Based in Industrial Ethanol MARKET, BY RAW MATERIAL, 2019-2028 (USD Thousand)
TABLE 360 South America Grain IN INDUSTRIAL Ethanol MARKET, BY TYPE, 2019-2028 (USD Thousand)
TABLE 361 SOUTH AMERICA INDUSTRIAL ETHANOL MARKET, BY RAW MATERIAL, 2019-2028 (THOUSAND liter)
TABLE 362 South America Industrial Ethanol Market, By Type, 2019-2028 (USD Thousand)
TABLE 363 South America Industrial Ethanol Market, By Application, 2019-2028 (USD Thousand)
TABLE 364 South America Pharmaceutical in Industrial Ethanol Market, By Application, 2019-2028 (USD Thousand)
TABLE 365 South America Food & BEVERAGES IN Industrial Ethanol Market, By Application, 2019-2028 (USD Thousand)
TABLE 366 South America Agricultural in Industrial Ethanol Market, By Application, 2019-2028 (USD Thousand)
TABLE 367 South America Cosmetics and Personal Care in Industrial Ethanol Market, By Application, 2019-2028 (USD Thousand)
TABLE 368 South America Oral Care in Industrial Ethanol Market, BY PRODUCTS, 2019-2028 (USD Thousand)
TABLE 369 South America FRAGRANCE PRODUCTS IN INDUSTRIAL ETHANOL MARKET, BY PRODUCTS, 2019-2028 (USD THOUSAND)
TABLE 370 BRAZIL Industrial Ethanol Market, By Raw Material, 2019-2028 (USD Thousand)
TABLE 371 BRAZIL Bio-Based in Industrial Ethanol MARKET, BY RAW MATERIAL, 2019-2028 (USD Thousand)
TABLE 372 BRAZIL Grain IN INDUSTRIAL Ethanol MARKET, BY TYPE, 2019-2028 (USD Thousand)
TABLE 373 BRAZIL INDUSTRIAL ETHANOL MARKET, BY RAW MATERIAL, 2019-2028 (THOUSAND liter)
TABLE 374 BRAZIL Industrial Ethanol Market, By Type, 2019-2028 (USD Thousand)
TABLE 375 BRAZIL Industrial Ethanol Market, By Application, 2019-2028 (USD Thousand)
TABLE 376 BRAZIL Pharmaceutical in Industrial Ethanol Market, By Application, 2019-2028 (USD Thousand)
TABLE 377 BRAZIL Food & BEVERAGES IN Industrial Ethanol Market, By Application, 2019-2028 (USD Thousand)
TABLE 378 BRAZIL Agricultural in Industrial Ethanol Market, By Application, 2019-2028 (USD Thousand)
TABLE 379 BRAZIL Cosmetics and Personal Care in Industrial Ethanol Market, By Application, 2019-2028 (USD Thousand)
TABLE 380 BRAZIL Oral Care in Industrial Ethanol Market, BY PRODUCTS, 2019-2028 (USD Thousand)
TABLE 381 BRAZIL FRAGRANCE PRODUCTS IN INDUSTRIAL ETHANOL MARKET, BY PRODUCTS, 2019-2028 (USD THOUSAND)
TABLE 382 ARGENTINA Industrial Ethanol Market, By Raw Material, 2019-2028 (USD Thousand)
TABLE 383 ARGENTINA Bio-Based in Industrial Ethanol MARKET, BY RAW MATERIAL, 2019-2028 (USD Thousand)
TABLE 384 ARGENTINA Grain IN INDUSTRIAL Ethanol MARKET, BY TYPE, 2019-2028 (USD Thousand)
TABLE 385 ARGENTINA INDUSTRIAL ETHANOL MARKET, BY RAW MATERIAL, 2019-2028 (THOUSAND liter)
TABLE 386 ARGENTINA Industrial Ethanol Market, By Type, 2019-2028 (USD Thousand)
TABLE 387 ARGENTINA Industrial Ethanol Market, By Application, 2019-2028 (USD Thousand)
TABLE 388 ARGENTINA Pharmaceutical in Industrial Ethanol Market, By Application, 2019-2028 (USD Thousand)
TABLE 389 ARGENTINA Food & BEVERAGES IN Industrial Ethanol Market, By Application, 2019-2028 (USD Thousand)
TABLE 390 ARGENTINA Agricultural in Industrial Ethanol Market, By Application, 2019-2028 (USD Thousand)
TABLE 391 ARGENTINA Cosmetics and Personal Care in Industrial Ethanol Market, By Application, 2019-2028 (USD Thousand)
TABLE 392 ARGENTINA Oral Care in Industrial Ethanol Market, BY PRODUCTS, 2019-2028 (USD Thousand)
TABLE 393 ARGENTINA FRAGRANCE PRODUCTS IN INDUSTRIAL ETHANOL MARKET, BY PRODUCTS, 2019-2028 (USD THOUSAND)
TABLE 394 REST OF SOUTH AMERICA Industrial Ethanol Market, By Raw Material, 2019-2028 (USD Thousand)
TABLE 395 REST OF SOUTH AMERICA INDUSTRIAL ETHANOL MARKET, BY RAW MATERIAL, 2019-2028 (THOUSAND liter)
TABLE 396 Middle East and Africa Industrial ethanol Market, By country, 2019-2028 (USD Thousand)
TABLE 397 Middle East and Africa Industrial ethanol market, BY COUNtry, 2019-2028 (Thousand liter)
TABLE 398 Middle East and Africa Industrial Ethanol Market, By Raw Material, 2019-2028 (USD Thousand)
TABLE 399 Middle East and Africa Bio-Based in Industrial Ethanol MARKET, BY RAW MATERIAL, 2019-2028 (USD Thousand)
TABLE 400 Middle East and Africa Grain in Industrial Ethanol Market, BY TYPE, 2019-2028 (USD Thousand)
TABLE 401 MIDDLE EAST AND AFRICA INDUSTRIAL ETHANOL MARKET, BY RAW MATERIAL, 2019-2028 (THOUSAND liter)
TABLE 402 Middle East and Africa Industrial Ethanol Market, By Type, 2019-2028 (USD Thousand)
TABLE 403 Middle East and Africa Industrial Ethanol Market, By Application, 2019-2028 (USD Thousand)
TABLE 404 Middle East and Africa Pharmaceutical in Industrial Ethanol Market, By Application, 2019-2028 (USD Thousand)
TABLE 405 Middle East and Africa Food & BEVERAGES IN Industrial Ethanol Market, By Application, 2019-2028 (USD Thousand)
TABLE 406 Middle East and Africa Agricultural in Industrial Ethanol Market, By Application, 2019-2028 (USD Thousand)
TABLE 407 Middle East and Africa Cosmetics and Personal Care in Industrial Ethanol Market, By Application, 2019-2028 (USD Thousand)
TABLE 408 Middle East and Africa Oral Care in Industrial Ethanol Market, BY PRODUCTS, 2019-2028 (USD Thousand)
TABLE 409 Middle East and Africa Fragrance Products in Industrial Ethanol Market, BY PRODUCTS, 2019-2028 (USD Thousand)
TABLE 410 U.A.E. Industrial Ethanol Market, By Raw Material, 2019-2028 (USD Thousand)
TABLE 411 U.A.E. Bio-Based in Industrial Ethanol MARKET, BY RAW MATERIAL, 2019-2028 (USD Thousand)
TABLE 412 U.A.E. Grain IN INDUSTRIAL Ethanol MARKET, BY TYPE, 2019-2028 (USD Thousand)
TABLE 413 U.A.E. INDUSTRIAL ETHANOL MARKET, BY RAW MATERIAL, 2019-2028 (THOUSAND liter)
TABLE 414 U.A.E. Industrial Ethanol Market, By Type, 2019-2028 (USD Thousand)
TABLE 415 U.A.E. Industrial Ethanol Market, By Application, 2019-2028 (USD Thousand)
TABLE 416 U.A.E. Pharmaceutical in Industrial Ethanol Market, By Application, 2019-2028 (USD Thousand)
TABLE 417 U.A.E. Food & BEVERAGES IN Industrial Ethanol Market, By Application, 2019-2028 (USD Thousand)
TABLE 418 U.A.E. Agricultural in Industrial Ethanol Market, By Application, 2019-2028 (USD Thousand)
TABLE 419 U.A.E. Cosmetics and Personal Care in Industrial Ethanol Market, By Application, 2019-2028 (USD Thousand)
TABLE 420 U.A.E. Oral Care in Industrial Ethanol Market, BY PRODUCTS, 2019-2028 (USD Thousand)
TABLE 421 U.A.E. Fragrance Products in Industrial Ethanol Market, BY PRODUCTS, 2019-2028 (USD Thousand)
TABLE 422 Saudi Arabia Industrial Ethanol Market, By Raw Material, 2019-2028 (USD Thousand)
TABLE 423 Saudi Arabia Bio-Based in Industrial Ethanol MARKET, BY RAW MATERIAL, 2019-2028 (USD Thousand)
TABLE 424 Saudi Arabia Grain IN INDUSTRIAL Ethanol MARKET, BY TYPE, 2019-2028 (USD Thousand)
TABLE 425 SAUDI ARABIA INDUSTRIAL ETHANOL MARKET, BY RAW MATERIAL, 2019-2028 (THOUSAND liter)
TABLE 426 Saudi Arabia Industrial Ethanol Market, By Type, 2019-2028 (USD Thousand)
TABLE 427 Saudi Arabia Industrial Ethanol Market, By Application, 2019-2028 (USD Thousand)
TABLE 428 Saudi Arabia Pharmaceutical in Industrial Ethanol Market, By Application, 2019-2028 (USD Thousand)
TABLE 429 Saudi Arabia Food & BEVERAGES IN Industrial Ethanol Market, By Application, 2019-2028 (USD Thousand)
TABLE 430 Saudi Arabia Agricultural in Industrial Ethanol Market, By Application, 2019-2028 (USD Thousand)
TABLE 431 Saudi Arabia Cosmetics and Personal Care in Industrial Ethanol Market, By Application, 2019-2028 (USD Thousand)
TABLE 432 Saudi Arabia Oral Care in Industrial Ethanol Market, BY PRODUCTS, 2019-2028 (USD Thousand)
TABLE 433 Saudi Arabia Fragrance Products in Industrial Ethanol Market, BY PRODUCTS, 2019-2028 (USD Thousand)
TABLE 434 South Africa Industrial Ethanol Market, By Raw Material, 2019-2028 (USD Thousand)
TABLE 435 South Africa Bio-Based in Industrial Ethanol MARKET, BY RAW MATERIAL, 2019-2028 (USD Thousand)
TABLE 436 South Africa Grain IN INDUSTRIAL Ethanol MARKET, BY TYPE, 2019-2028 (USD Thousand)
TABLE 437 SOUTH AFRICA INDUSTRIAL ETHANOL MARKET, BY RAW MATERIAL, 2019-2028 (THOUSAND liter)
TABLE 438 South Africa Industrial Ethanol Market, By Type, 2019-2028 (USD Thousand)
TABLE 439 South Africa Industrial Ethanol Market, By Application, 2019-2028 (USD Thousand)
TABLE 440 South Africa Pharmaceutical in Industrial Ethanol Market, By Application, 2019-2028 (USD Thousand)
TABLE 441 South Africa Food & BEVERAGES IN Industrial Ethanol Market, By Application, 2019-2028 (USD Thousand)
TABLE 442 South Africa Agricultural in Industrial Ethanol Market, By Application, 2019-2028 (USD Thousand)
TABLE 443 South Africa Cosmetics and Personal Care in Industrial Ethanol Market, By Application, 2019-2028 (USD Thousand)
TABLE 444 South Africa Oral Care in Industrial Ethanol Market, BY PRODUCTS, 2019-2028 (USD Thousand)
TABLE 445 South Africa Fragrance Products in Industrial Ethanol Market, BY PRODUCTS, 2019-2028 (USD Thousand)
TABLE 446 Egypt Industrial Ethanol Market, By Raw Material, 2019-2028 (USD Thousand)
TABLE 447 Egypt Bio-Based in Industrial Ethanol MARKET, BY RAW MATERIAL, 2019-2028 (USD Thousand)
TABLE 448 Egypt Grain IN INDUSTRIAL Ethanol MARKET, BY TYPE, 2019-2028 (USD Thousand)
TABLE 449 EGYPT INDUSTRIAL ETHANOL MARKET, BY RAW MATERIAL, 2019-2028 (THOUSAND liter)
TABLE 450 Egypt Industrial Ethanol Market, By Type, 2019-2028 (USD Thousand)
TABLE 451 Egypt Industrial Ethanol Market, By Application, 2019-2028 (USD Thousand)
TABLE 452 Egypt Pharmaceutical in Industrial Ethanol Market, By Application, 2019-2028 (USD Thousand)
TABLE 453 Egypt Food & BEVERAGES IN Industrial Ethanol Market, By Application, 2019-2028 (USD Thousand)
TABLE 454 Egypt Agricultural in Industrial Ethanol Market, By Application, 2019-2028 (USD Thousand)
TABLE 455 Egypt Cosmetics and Personal Care in Industrial Ethanol Market, By Application, 2019-2028 (USD Thousand)
TABLE 456 Egypt Oral Care in Industrial Ethanol Market, BY PRODUCTS, 2019-2028 (USD Thousand)
TABLE 457 Egypt Fragrance Products in Industrial Ethanol Market, BY PRODUCTS, 2019-2028 (USD Thousand)
TABLE 458 Israel Industrial Ethanol Market, By Raw Material, 2019-2028 (USD Thousand)
TABLE 459 Israel Bio-Based in Industrial Ethanol MARKET, BY RAW MATERIAL, 2019-2028 (USD Thousand)
TABLE 460 Israel Grain IN INDUSTRIAL Ethanol MARKET, BY TYPE, 2019-2028 (USD Thousand)
TABLE 461 ISRAEL INDUSTRIAL ETHANOL MARKET, BY RAW MATERIAL, 2019-2028 (THOUSAND liter)
TABLE 462 Israel Industrial Ethanol Market, By Type, 2019-2028 (USD Thousand)
TABLE 463 Israel Industrial Ethanol Market, By Application, 2019-2028 (USD Thousand)
TABLE 464 Israel Pharmaceutical in Industrial Ethanol Market, By Application, 2019-2028 (USD Thousand)
TABLE 465 Israel Food & BEVERAGES IN Industrial Ethanol Market, By Application, 2019-2028 (USD Thousand)
TABLE 466 Israel Agricultural in Industrial Ethanol Market, By Application, 2019-2028 (USD Thousand)
TABLE 467 Israel Cosmetics and Personal Care in Industrial Ethanol Market, By Application, 2019-2028 (USD Thousand)
TABLE 468 Israel Oral Care in Industrial Ethanol Market, BY PRODUCTS, 2019-2028 (USD Thousand)
TABLE 469 Israel Fragrance Products in Industrial Ethanol Market, BY PRODUCTS, 2019-2028 (USD Thousand)
TABLE 470 Rest of Middle East and Africa INDUSTRIAL ETHANOL MARKET, BY RAW MATERIAL, 2019-2028 (THOUSAND liter)
TABLE 471 Rest of Middle East and Africa INDUSTRIAL ETHANOL MARKET, BY RAW MATERIAL, 2019-2028 (THOUSAND liter)
Abbildungsverzeichnis
FIGURE 1 GLOBAL INDUSTRIAL ETHANOL MARKET: segmentation
FIGURE 2 GLOBAL INDUSTRIAL ETHANOL MARKET: data triangulation
FIGURE 3 GLOBAL INDUSTRIAL ETHANOL MARKET: DROC ANALYSIS
FIGURE 4 GLOBAL INDUSTRIAL ETHANOL MARKET: global vs regional MARKET analysiS
FIGURE 5 GLOBAL INDUSTRIAL ETHANOL MARKET: company research analysis
FIGURE 6 GLOBAL INDUSTRIAL ETHANOL MARKET: THE raw material LIFE LINE CURVE
FIGURE 7 GLOBAL INDUSTRIAL ETHANOL MARKET: MULTIVARIATE MODELLING
FIGURE 8 GLOBAL INDUSTRIAL ETHANOL MARKET: INTERVIEW DEMOGRAPHICS
FIGURE 9 GLOBAL INDUSTRIAL ETHANOL MARKET: DBMR MARKET POSITION GRID
FIGURE 10 GLOBAL INDUSTRIAL ETHANOL MARKET: MARKET Application COVERAGE GRID
FIGURE 11 GLOBAL INDUSTRIAL ETHANOL MARKET: THE MARKET CHALLENGE MATRIX
FIGURE 12 GLOBAL Industrial ethanol Market: vendor share analysis
FIGURE 13 GLOBAL INDUSTRIAL ETHANOL MARKET: SEGMENTATION
FIGURE 14 North AMERICA IS expected to DOMINATE THE global industrial ethanol market and IS EXPECTED TO GROW WITH THE HIGHEST CAGR IN the forecast period of 2021 to 2028
FIGURE 15 AN IncreasE IN demand for the industrial ethanol products as an octane enhancer is a growing factor that drives the global industrial ethanol market in the forecast period of 2021 to 2028
FIGURE 16 bio based SEGMENT is expected to account for the largest share of the GLOBAL INDUSTRIAL ETHANOL MARKET in 2021 & 2028
FIGURE 17 North AMerica is the fastest growing market for INDUSTRIAL ETHANOL MARKET manufacturers in the forecast period of 2021 to 2028
FIGURE 18 DRIVERS, RESTRAINTs, OPPORTUNITies AND CHALLENGEs OF global industrial Ethanol market
FIGURE 19 growth in the sales of alcoholic beverages
FIGURE 20 Amount of paints produced in Korea between 2017-2020
FIGURE 21 fluctuation in the U.S. corn price between 2018-2021
FIGURE 22 Global Industrial ethanol market: BY raw material, 2020
FIGURE 23 Global Industrial ethanol market: BY Type, 2020
FIGURE 24 Global Industrial ethanol market: BY Application, 2020
FIGURE 25 GLOBAL Industrial ethanol Market: SNAPSHOT (2020)
FIGURE 26 GLOBAL Industrial ethanol Market: by REGION (2020)
FIGURE 27 GLOBAL Industrial ethanol Market: by REGION (2021 & 2028)
FIGURE 28 GLOBAL Industrial ethanol Market: by REGION (2020 & 2028)
FIGURE 29 GLOBAL Industrial ethanol Market: by RAW MATERIAL (2021-2028)
FIGURE 30 NORTH AMERICA Industrial ethanol market: SNAPSHOT (2020)
FIGURE 31 NORTH AMERICA Industrial ethanol market: by COUNTRY (2020)
FIGURE 32 NORTH AMERICA Industrial ethanol market: by COUNTRY (2021 & 2028)
FIGURE 33 NORTH AMERICA Industrial ethanol market: by COUNTRY (2020 & 2028)
FIGURE 34 NORTH AMERICA Industrial ethanol market: by Raw MATERIAL (2021-2028)
FIGURE 35 ASIA-PACIFIC industrial ethanol market: SNAPSHOT (2020)
FIGURE 36 ASIA-PACIFIC industrial ethanol market: by COUNTRY (2020)
FIGURE 37 ASIA-PACIFIC industrial ethanol market: by COUNTRY (2021 & 2028)
FIGURE 38 ASIA-PACIFIC industrial ethanol market: by COUNTRY (2020 & 2028)
FIGURE 39 ASIA-PACIFIC industrial ethanol market: by Raw material (2021-2028)
FIGURE 40 EUROPE industrial ethanol market: SNAPSHOT (2020)
FIGURE 41 EUROPE industrial ethanol market: by COUNTRY (2020)
FIGURE 42 EUROPE industrial ethanol market: by COUNTRY (2021 & 2028)
FIGURE 43 EUROPE industrial ethanol market: by COUNTRY (2020 & 2028)
FIGURE 44 EUROPE industrial ethanol market: by Raw MATERIAL (2021-2028)
FIGURE 45 SOUTH AMERICA industrial ethanol market: SNAPSHOT (2020)
FIGURE 46 SOUTH AMERICA industrial ethanol market: by COUNTRY (2020)
FIGURE 47 SOUTH AMERICA industrial ethanol market: by COUNTRY (2021 & 2028)
FIGURE 48 SOUTH AMERICA industrial ethanol market: by COUNTRY (2020 & 2028)
FIGURE 49 SOUTH AMERICA industrial ethanol market: by Raw MATERIAL (2021-2028)
FIGURE 50 MIDDLE EAST AND AFRICA Industrial ethanol market: SNAPSHOT (2020)
FIGURE 51 MIDDLE EAST AND AFRICA Industrial ethanol market: by COUNTRY (2020)
FIGURE 52 MIDDLE EAST AND AFRICA Industrial ethanol market: by COUNTRY (2021 & 2028)
FIGURE 53 MIDDLE EAST AND AFRICA Industrial ethanol market: by COUNTRY (2020 & 2028)
FIGURE 54 MIDDLE EAST AND AFRICA Industrial ethanol market: by Raw MATERIAL (2021-2028)
FIGURE 55 GLOBAL industrial ethanol MARKET: company share 2020 (%)
FIGURE 56 north AMERICA industrial ethanol MARKET: COMPANY SHARE 2020 (%)
FIGURE 57 EUROPE industrial ethanol MARKET: company share 2020 (%)
FIGURE 58 Asia-Pacific industrial ethanol MARKET: COMPANY SHARE 2020 (%)
Forschungsmethodik
Die Datenerfassung und Basisjahresanalyse werden mithilfe von Datenerfassungsmodulen mit großen Stichprobengrößen durchgeführt. Die Phase umfasst das Erhalten von Marktinformationen oder verwandten Daten aus verschiedenen Quellen und Strategien. Sie umfasst die Prüfung und Planung aller aus der Vergangenheit im Voraus erfassten Daten. Sie umfasst auch die Prüfung von Informationsinkonsistenzen, die in verschiedenen Informationsquellen auftreten. Die Marktdaten werden mithilfe von marktstatistischen und kohärenten Modellen analysiert und geschätzt. Darüber hinaus sind Marktanteilsanalyse und Schlüsseltrendanalyse die wichtigsten Erfolgsfaktoren im Marktbericht. Um mehr zu erfahren, fordern Sie bitte einen Analystenanruf an oder geben Sie Ihre Anfrage ein.
Die wichtigste Forschungsmethodik, die vom DBMR-Forschungsteam verwendet wird, ist die Datentriangulation, die Data Mining, die Analyse der Auswirkungen von Datenvariablen auf den Markt und die primäre (Branchenexperten-)Validierung umfasst. Zu den Datenmodellen gehören ein Lieferantenpositionierungsraster, eine Marktzeitlinienanalyse, ein Marktüberblick und -leitfaden, ein Firmenpositionierungsraster, eine Patentanalyse, eine Preisanalyse, eine Firmenmarktanteilsanalyse, Messstandards, eine globale versus eine regionale und Lieferantenanteilsanalyse. Um mehr über die Forschungsmethodik zu erfahren, senden Sie eine Anfrage an unsere Branchenexperten.
Anpassung möglich
Data Bridge Market Research ist ein führendes Unternehmen in der fortgeschrittenen formativen Forschung. Wir sind stolz darauf, unseren bestehenden und neuen Kunden Daten und Analysen zu bieten, die zu ihren Zielen passen. Der Bericht kann angepasst werden, um Preistrendanalysen von Zielmarken, Marktverständnis für zusätzliche Länder (fordern Sie die Länderliste an), Daten zu klinischen Studienergebnissen, Literaturübersicht, Analysen des Marktes für aufgearbeitete Produkte und Produktbasis einzuschließen. Marktanalysen von Zielkonkurrenten können von technologiebasierten Analysen bis hin zu Marktportfoliostrategien analysiert werden. Wir können so viele Wettbewerber hinzufügen, wie Sie Daten in dem von Ihnen gewünschten Format und Datenstil benötigen. Unser Analystenteam kann Ihnen auch Daten in groben Excel-Rohdateien und Pivot-Tabellen (Fact Book) bereitstellen oder Sie bei der Erstellung von Präsentationen aus den im Bericht verfügbaren Datensätzen unterstützen.

