Europäischer Markt für Lecksuche, nach Typ (Upstream, Midstream und Downstream), Produkttyp (Handgasdetektoren, UAV-basierte Detektoren, bemannte Flugzeugdetektoren und fahrzeugbasierte Detektoren), Technologie (Akustik/Ultraschall, Druck-Fluss-Abweichungsmethoden, erweitertes Echtzeit-Transientenmodell (E-RTTM), Wärmebildgebung , Masse-/Volumenbilanz, Dampferkennung, Laserabsorption und Lidar, hydraulische Lecksuche, Unterdruckventile und andere), Endverbraucher (Öl und Gas, Chemieanlagen, Wasseraufbereitungsanlagen, Wärmekraftwerke, Bergbau und Schlammgewinnung und andere), Land (Deutschland, Frankreich, Großbritannien, Italien, Spanien, Russland, Türkei, Belgien, Niederlande, Schweiz, übriges Europa) Branchentrends und Prognose bis 2028
Marktanalyse und Einblicke : Europäischer Markt für Leckerkennung
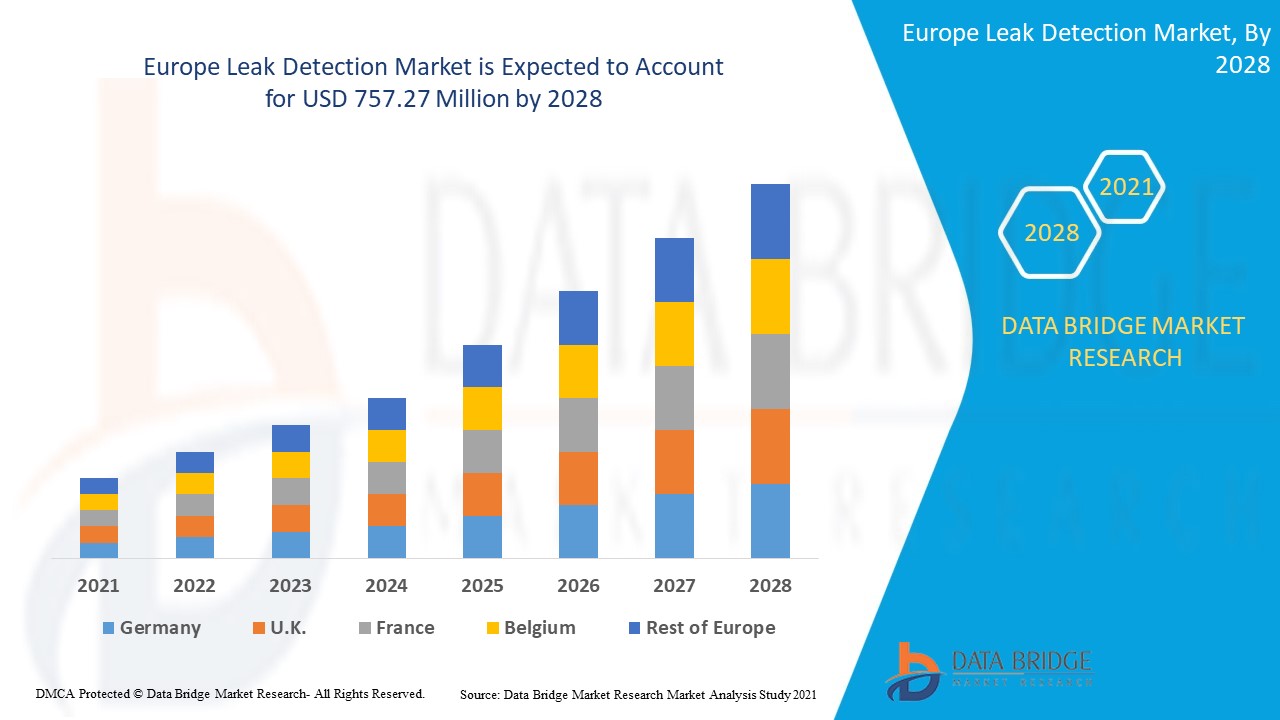
Der europäische Markt für Lecksuche dürfte im Prognosezeitraum 2021 bis 2028 ein Marktwachstum verzeichnen. Data Bridge Market Research analysiert, dass der Markt im Prognosezeitraum 2021 bis 2028 mit einer durchschnittlichen jährlichen Wachstumsrate von 7,4 % wächst und bis 2028 voraussichtlich 757,27 Millionen USD erreichen wird. Das zunehmende Wachstum im Bereich der Infrastruktur für Öl- und Gaspipelines sowie Speicheranlagen ist der wichtigste Faktor, der das Wachstum des Marktes vorantreibt.
Der Begriff Leck oder Leckage bezeichnet einen unbeabsichtigten Riss, ein Loch oder eine Porosität in einer umhüllenden Wand oder Verbindung von Rohren, Batterien, versiegelten Produkten, Kammern oder Lagerbehältern, die verschiedene Flüssigkeiten und Gase enthalten/transportieren müssen. Diese Risse oder Löcher ermöglichen das Entweichen von Flüssigkeiten und Gasen aus geschlossenen Medien. Die Leckagen müssen so früh wie möglich erkannt werden, um den Verlust und die Umweltschäden zu verringern. Dazu werden verschiedene Leckerkennungssensoren und -instrumente verwendet. Die Hauptfunktion eines Leckerkennungssystems besteht in der Lokalisierung und Größenmessung von Lecks in versiegelten Produkten.
Die hohe Zahl von Pipeline-Leckagen und die zunehmende Integration fortschrittlicher Technologie in Lecksuchgeräte beflügeln den Markt für Lecksuchgeräte. So hat beispielsweise FLIR Systems Inc. im Januar 2020 die FLIR GF77a auf den Markt gebracht, seine erste ungekühlte, fest montierte, vernetzte Wärmebildkamera zur Erkennung von Methan und anderen Industriegasen. Mit dieser neuen Produktreihe zur optischen Gasbildgebung (OGI) hat das Unternehmen sein Produktportfolio erweitert und wird seinen Kundenstamm vergrößern.
Dieser Marktbericht zur Lecksuche liefert Einzelheiten zu Marktanteilen, neuen Entwicklungen und Produktpipeline-Analysen, Auswirkungen inländischer und lokaler Marktteilnehmer, analysiert Chancen in Bezug auf neu entstehende Umsatzbereiche, Änderungen der Marktvorschriften, Produktzulassungen, strategische Entscheidungen, Produkteinführungen, geografische Expansionen und technologische Innovationen auf dem Markt. Um die Analyse und das Marktszenario zu verstehen, kontaktieren Sie uns für ein Analyst Briefing. Unser Team wird Ihnen helfen, eine Umsatzauswirkungslösung zu entwickeln, um Ihr gewünschtes Ziel zu erreichen.
Lecksuche – Marktumfang und Marktgröße in Europa
Der Markt für Leckerkennung ist nach Typ, Produkttyp, Technologie und Endbenutzer segmentiert. Das Wachstum zwischen den Segmenten hilft Ihnen bei der Analyse von Wachstumsnischen und Strategien zur Marktbearbeitung und zur Bestimmung Ihrer Hauptanwendungsbereiche und der Unterschiede in Ihren Zielmärkten.
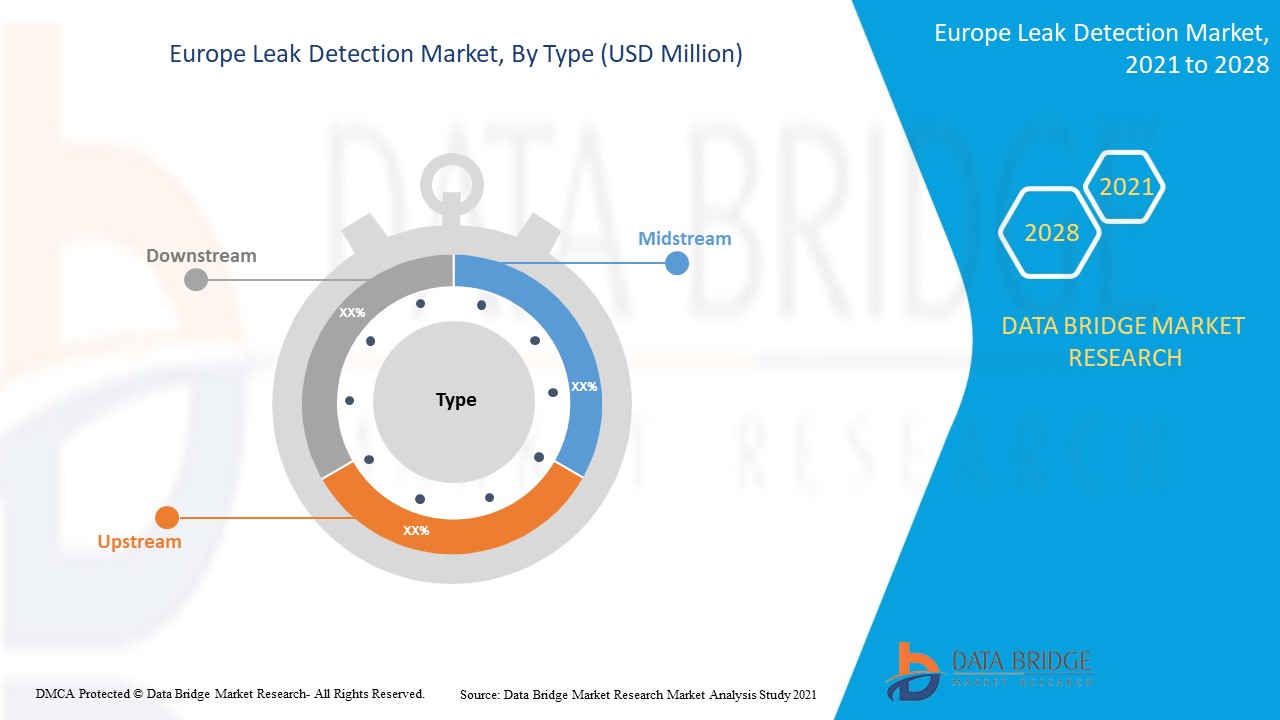
- Der Markt für Leckerkennung ist nach Typ in Upstream, Midstream und Downstream unterteilt. Im Jahr 2021 hatte das Midstream-Segment den größten Marktanteil, da sich das Midstream-Segment im Wesentlichen mit dem Transport von Rohöl und Erdgas über verschiedene Transportmittel wie Pipelines befasst. Diese Pipelines müssen vor Leckagen geschützt werden, um Leckagen und damit den Verlust von Menschenleben und Eigentum zu vermeiden. Somit dominiert das Midstream-Segment das Typensegment.
- Auf der Grundlage des Produkttyps ist der Markt für Leckerkennung in tragbare Gasdetektoren, UAV-basierte Detektoren, bemannte Flugzeugdetektoren und fahrzeugbasierte Detektoren unterteilt. Im Jahr 2021 hatten fahrzeugbasierte Detektoren den größten Marktanteil, da sie leicht auf einem Fahrzeug montiert und zur Überwachung der Pipelines durch das fahrende Fahrzeug verwendet werden können. Dies ist die wirtschaftlichste und schnellste Methode zur Erkennung von Lecks und dominiert daher das Produkttypsegment.
- Auf der Grundlage der Technologie ist der Markt für Leckerkennung segmentiert in Akustik/Ultraschall, Glasfaser, Druck-Fluss-Abweichungsmethoden, erweitertes Echtzeit-Transientenmodell (E-RTTM), Wärmebildgebung, Masse-/Volumenbilanz, Dampfsensorik, Laserabsorption und LIDAR, hydraulische Leckerkennung, negative Druckwellen und andere. Im Jahr 2021 hatte Akustik/Ultraschall den größten Marktanteil, da es eine schnellere Erkennung von Lecks ermöglicht und eine kostengünstige Lösung ist. Darüber hinaus ermöglicht es eine Früherkennung und der Verlust kann frühzeitig verhindert werden. Diese Faktoren führen zum höchsten Wachstum von Akustik/Ultraschall im Technologiesegment.
- Auf der Grundlage des Endverbrauchers ist der Markt für Lecksuche in Öl und Gas, Chemieanlagen, Wasseraufbereitungsanlagen, Wärmekraftwerke, Bergbau und Schlammgewinnung und andere unterteilt. Im Jahr 2021 hatten Öl und Gas den größten Marktanteil, da diese Branche ein Hauptnutzer von Lecksuchsystemen ist, um Leckagen von Rohöl und Gas sowie Methanemission zu verhindern. Die Leckage kann zu schweren Verlusten an Leben und Eigentum führen. Darüber hinaus haben mehrere staatliche Vorschriften zur Verhinderung von Leckagen die Nachfrage nach Lecksuche in der Öl- und Gasindustrie erhöht.
Europa: Leckerkennungsmarkt – Länderebeneanalyse
Der Markt für Leckerkennung wird analysiert und Informationen zur Marktgröße werden nach Land, Typ, Produkttyp, Technologie und Endbenutzer bereitgestellt.
Die im europäischen Marktbericht zur Lecksuche abgedeckten Länder sind Deutschland, Großbritannien, Frankreich, die Schweiz, Italien, Spanien, die Niederlande, Russland, Belgien, die Türkei und das übrige Europa.
Den größten Marktanteil hatte Russland aufgrund der großen Zahl an Öl- und Gasproduktions- und -pipeline-Projekten in der Region.
Der Länderabschnitt des Berichts enthält auch Angaben zu einzelnen marktbeeinflussenden Faktoren und Änderungen der Regulierung auf dem Inlandsmarkt, die sich auf die aktuellen und zukünftigen Markttrends auswirken. Datenpunkte wie Neuverkäufe, Ersatzverkäufe, demografische Daten des Landes, Regulierungsgesetze und Import-/Exportzölle sind einige der wichtigsten Anhaltspunkte, die zur Prognose des Marktszenarios für einzelne Länder verwendet werden. Bei der Prognoseanalyse der Länderdaten werden auch die Präsenz und Verfügbarkeit europäischer Marken und ihre Herausforderungen aufgrund großer oder geringer Konkurrenz durch lokale und inländische Marken sowie die Auswirkungen der Vertriebskanäle berücksichtigt.
Hohe Zahl an Pipeline-Leckagen
Der Markt für Lecksuche bietet Ihnen außerdem eine detaillierte Marktanalyse für jedes Branchenwachstum in jedem Land mit Umsatz, Komponentenverkäufen, Auswirkungen der technologischen Entwicklung bei der Lecksuche und Änderungen der regulatorischen Szenarien mit ihrer Unterstützung für den Markt für Lecksuche. Die Daten sind für den historischen Zeitraum 2011 bis 2019 verfügbar.
Wettbewerbsumfeld und Leckerkennung Marktanteilsanalyse
Die Wettbewerbslandschaft auf dem Markt für Leckerkennung liefert Details nach Wettbewerbern. Die enthaltenen Details sind Unternehmensübersicht, Unternehmensfinanzen, erzielter Umsatz, Marktpotenzial, Investitionen in Forschung und Entwicklung, neue Marktinitiativen, Präsenz in Europa, Produktionsstandorte und -anlagen, Stärken und Schwächen des Unternehmens, Produkteinführung, Produkttestpipelines, Produktzulassungen, Patente, Produktbreite und -umfang, Anwendungsdominanz, Technologie-Lebenslinienkurve. Die oben angegebenen Datenpunkte beziehen sich nur auf den Fokus der Unternehmen in Bezug auf den Markt für Leckerkennung.
Die wichtigsten im Bericht behandelten Akteure sind u. a. FLIR SYSTEMS, Inc., ABB, Honeywell International Inc., Siemens Energy, Pentair, ClampOn AS, Schneider Electric, Atmos International, Xylem, Emerson Electric Co., KROHNE Messtechnik GmbH, PERMA-PIPE International Holdings, Inc., TTK, PSI Software AG, MSA, HIMA, AVEVA Group plc, Yokogawa Electric Corporation, INFICON, Fotech Group Ltd., Asel-Tech Inc., MAGNUM Pirex AG / MAGNUM LEO-Pipe GmbH und OptaSense Ltd. DBMR-Analysten kennen die Stärken der Konkurrenz und erstellen für jeden Wettbewerber eine separate Wettbewerbsanalyse.
Darüber hinaus werden viele Produktentwicklungen von Unternehmen weltweit initiiert, die das Wachstum des Marktes für Leckerkennung ebenfalls beschleunigen.
Zum Beispiel,
- Im Oktober 2020 hat ABB den neuen ABB MicroGuard auf den Markt gebracht, die erste umfassende Gasleckerkennungslösung für die Versorgungswirtschaft zum Schutz der Stadtbevölkerung. Der MicroGuard wird zusammen mit ABBs MobileGuard gefährliche Gaslecks schneller und einfacher lokalisieren. Mit dieser neuen Produkteinführung hat das Unternehmen seine Produktlinie erweitert.
- Im Dezember 2019 gab Honeywell International Inc. die Übernahme von Rebellion Photonics bekannt, einem Anbieter innovativer, intelligenter, visueller Gasüberwachungslösungen, die zur Maximierung von Sicherheit, Betriebsleistung und Emissionsminderung in der Öl- und Gas-, Petrochemie- und Energieindustrie beitragen. Diese Übernahme wird dem Unternehmen helfen, sein Produktportfolio zu erweitern.
Produktionsausweitung, Entwicklung neuer Produkte und andere Strategien steigern den Marktanteil des Unternehmens durch größere Reichweite und Präsenz. Unternehmen profitieren außerdem davon, ihr Angebot zur Lecksuche zu verbessern.
SKU-
Erhalten Sie Online-Zugriff auf den Bericht zur weltweit ersten Market Intelligence Cloud
- Interaktives Datenanalyse-Dashboard
- Unternehmensanalyse-Dashboard für Chancen mit hohem Wachstumspotenzial
- Zugriff für Research-Analysten für Anpassungen und Abfragen
- Konkurrenzanalyse mit interaktivem Dashboard
- Aktuelle Nachrichten, Updates und Trendanalyse
- Nutzen Sie die Leistungsfähigkeit der Benchmark-Analyse für eine umfassende Konkurrenzverfolgung
Inhaltsverzeichnis
- introduction
- OBJECTIVES OF THE STUDY
- MARKET DEFINITION
- OVERVIEW of EUROPE LEAK DETECTION MARKET
- LIMITATIONs
- MARKETS COVERED
- MARKET SEGMENTATION
- MARKETS COVERED
- geographical scope
- years considered for the study
- currency and pricing
- DBMR TRIPOD DATA VALIDATION MODEL
- primary interviews with key opinion leaders
- DBMR MARKET POSITION GRID
- vendor share analysis
- MULTIVARIATE MODELLING
- type LIFELINE CURVE
- secondary sourcEs
- assumptions
- EXECUTIVE SUMMARY
- premium insights
- Oil and gas Projects incorporating Leak detection products
- Upcoming Leak detection Tenders for Various End-Users
- market overview
- drivers
- Increasing growth in oil and gas pipeline and storage plant infrastructure
- High number of pipeline leakages incidents
- Rising Government initiatives to prevent methane leak detection
- Aging water infrastructure in developed countries
- Increasing need of leak detectors in chemical plants
- RESTRAINT
- technical complications with leak detectors
- OPPoRTUNITies
- Rising oil and gas production Europely
- Increasing Europe oil and natural gas consumption
- Increasing integration of advanced technology in leak detectors
- increasing GROWTH IN INVESTMENTS AND EXPANSIONS MADE BY the MARKET PLAYERS
- Emergence of new product developments
- CHALLENGES
- challenge associated with large diameter pipelines for effective leak detection
- rising focus on the development of renewable energy generation
- Europe economic crisis
- Impact of Covid-19 on Europe Leak Detection Market
- ANALYSIS ON IMPACT OF COVID-19 ON THE MARKET
- AFTERMATH OF COVID-19 AND GOVERNMENT INITIATIVE TO BOOST THE MARKET
- STRATEGIC DECISIONS FOR MANUFACTURERS AFTER COVID-19 TO GAIN COMPETITIVE MARKET SHARE
- IMPACT ON DEMAND
- IMPACT ON SUPPLY CHAIN
- CONCLUSION
- Europe leak detection MARKET, BY type
- overview
- Midstream
- Downstream
- upstream
- Europe leak detection MARKET, BY product type
- overview
- Vehicle-Based Detectors
- UAV-Based Detectors
- Handheld Gas Detectors
- Manned Aircraft Detectors
- others
- Europe leak detection MARKET, BY technology
- overview
- Acoustic/Ultrasound
- Extended Real-Time Transient Model (E-RTTM)
- Negative Pressure Waves
- Thermal Imaging
- Fiber Optic
- Laser Absorption and LIDAR
- Pressure-Flow Deviation Method
- Mass/Volume Balance
- Vapor Sensing
- Hydraulic Leak Detection
- others
- Europe leak detection MARKET, BY end-user
- overview
- Oil and Gas
- By loCation
- onshore
- Offshore
- By Medium
- Oil and Condensate
- Natural Gas
- By Technology
- Acoustic/Ultrasound
- Negative Pressure Waves
- Extended Real-Time Transient Model (E-RTTM)
- Thermal Imaging
- Laser Absorption and LIDAR
- Hydraulic Leak Detection
- Fiber Optic
- Pressure-Flow Deviation Method
- Mass/Volume Balance
- Vapor Sensing
- Others
- chemical plant
- By technology
- Acoustic/Ultrasound
- Thermal Imaging
- Pressure-Flow Deviation Method
- Extended Real-Time Transient Model (E-RTTM)
- Fiber Optic
- Mass/Volume Balance
- Vapor Sensing
- Laser Absorption and LIDAR
- Hydraulic Leak Detection
- Negative Pressure Waves
- Others
- water treatment Plant
- By technology
- Acoustic/Ultrasound
- Pressure-Flow Deviation Method
- Extended Real-Time Transient Model (E-RTTM)
- Vapor Sensing
- Negative Pressure Waves
- Mass/Volume Balance
- Thermal Imaging
- Laser Absorption and LIDAR
- Hydraulic Leak Detection
- Fiber Optic
- Others
- THERMAL POWER PLANT
- By technology
- Acoustic/Ultrasound
- Pressure-Flow Deviation Method
- Extended Real-Time Transient Model (E-RTTM)
- Vapor Sensing
- Negative Pressure Waves
- Mass/Volume Balance
- Thermal Imaging
- Laser Absorption and LIDAR
- Hydraulic Leak Detection
- Fiber Optic
- Others
- Mining and Slurry
- By technology
- Acoustic/Ultrasound
- Fiber Optic
- Pressure-Flow Deviation Method
- Extended Real-Time Transient Model (E-RTTM)
- Thermal Imaging
- Mass/Volume Balance
- Vapor Sensing
- Laser Absorption and LIDAR
- Hydraulic Leak Detection
- Negative Pressure Waves
- Others
- others
- EUROPE Leak detection market, by geography
- Europe
- Russia
- U.K.
- Italy
- Turkey
- Germany
- Netherlands
- Spain
- france
- belgium
- switzerland
- Rest of Europe
- Europe leak detection Market: COMPANY landscape
- Company share analysis: Europe
- swot
- company profiles
- flir systems, inc.
- COMPANY snapshot
- Revenue Analysis
- company share analysis
- product PORTFOLIO
- recent DEVELOPMENTS
- honeywell international inc.
- COMPANY snapshot
- revenue analysis
- company share analysis
- PRODUCT PORTFOLIO
- recent DEVELOPMENTS
- siemens energy
- COMPANY snapshot
- revenue analysis
- company share analysis
- PRODUCT PORTFOLIO
- recent DEVELOPMENT
- schneider electric
- COMPANY snapshot
- revenue analysis
- company share analysis
- PRODUCT PORTFOLIO
- recent DEVELOPMENTS
- inficon
- COMPANY snapshot
- Revenue analysis
- company share analysis
- PRODUCT PORTFOLIO
- recent DEVELOPMENTS
- ABB
- COMPANY snapshot
- Revenue Analysis
- company share analysis
- product PORTFOLIO
- recent DEVELOPMENTs
- asel-tech inc.
- COMPANY snapshot
- PRODUCT PORTFOLIO
- recent DEVELOPMENT
- atmos international
- COMPANY snapshot
- PRODUCT PORTFOLIO
- recent DEVELOPMENT
- aveva group plc
- COMPANY snapshot
- Revenue Analysis
- product PORTFOLIO
- recent DEVELOPMENT
- clampon as
- COMPANY snapshot
- PRODUCT PORTFOLIO
- recent DEVELOPMENT
- emerson electric co.
- COMPANY snapshot
- Revenue Analysis
- company share analysis
- product PORTFOLIO
- recent DEVELOPMENTS
- fotech group ltd.
- COMPANY snapshot
- PRODUCT PORTFOLIO
- recent DEVELOPMENT
- hawk measurement systems
- COMPANY snapshot
- PRODUCT PORTFOLIO
- recent DEVELOPMENTS
- hima
- COMPANY snapshot
- PRODUCT PORTFOLIO
- recent DEVELOPMENTS
- krohne messtechnik gmbh
- COMPANY snapshot
- PRODUCT PORTFOLIO
- recent DEVELOPMENTS
- magnum pirex ag / magnum leo-pipe gmbh
- COMPANY snapshot
- PRODUCT PORTFOLIO
- recent DEVELOPMENT
- msa
- COMPANY snapshot
- revenue analysis
- PRODUCT PORTFOLIO
- recent DEVELOPMENTS
- optasense ltd
- COMPANY snapshot
- PRODUCT PORTFOLIO
- recent DEVELOPMENTS
- pentair
- COMPANY snapshot
- revenue analysis
- PRODUCT PORTFOLIO
- recent DEVELOPMENT
- perma-pipe international holdings, inc.
- COMPANY snapshot
- revenue analysis
- PRODUCT PORTFOLIO
- recent DEVELOPMENTS
- psi software ag
- COMPANY snapshot
- revenue analysis
- PRODUCT PORTFOLIO
- recent DEVELOPMENT
- ttk - Leak Detection System
- COMPANY snapshot
- PRODUCT PORTFOLIO
- recent DEVELOPMENTS
- xylem
- COMPANY snapshot
- Revenue Analysis
- brand PORTFOLIO
- recent DEVELOPMENTS
- yokogawa electric corporation
- COMPANY snapshot
- Revenue Analysis
- Product PORTFOLIO
- recent developments
- questionnaire
- related reports
Tabellenverzeichnis
TABLE 1 SUMMARY OF PIPELINE INCIDENTS FROM JANUARY 2010 TO DECEMBER 2019
TABLE 2 THE 10 LARGEST OIL PRODUCERS AND SHARE OF TOTAL WORLD OIL PRODUCTION IN 2019
TABLE 3 THE 10 LARGEST OIL CONSUMERS AND SHARE OF TOTAL WORLD OIL CONSUMPTION IN 2018
TABLE 4 Europe Leak Detection Market, By Type, 2019-2028 (USD Million)
TABLE 5 Europe Midstream in Leak Detection Market, By Region,2019-2028, (USD Million)
TABLE 6 Europe Downstream in Leak Detection Market, By Region,2019-2028, (USD Million)
TABLE 7 Europe Upstream in Leak Detection Market, By Region,2019-2028, (USD Million)
TABLE 8 Europe LEAK Detection Market, By Product Type, 2019-2028 (USD Million)
TABLE 9 Europe Vehicle Based-Detectors in Leak Detection Market, By Region,2019-2028, (USD Million)
TABLE 10 Europe UAV-Based Detectors in Leak Detection Market, By Region,2019-2028, (USD Million)
TABLE 11 Europe Handheld Gas Detectors in Leak Detection Market, By Region,2019-2028, (USD Million)
TABLE 12 Europe Manned Aircraft Detectors in Leak Detection Market, By Region,2019-2028, (USD Million)
TABLE 13 Europe Others in Leak Detection Market, By Region,2019-2028, (USD Million)
TABLE 14 Europe LEAK Detection Market, By Technology, 2019-2028 (USD Million)
TABLE 15 Europe Acoustic/Ultrasound in Leak Detection Market, By Region,2019-2028, (USD Million)
TABLE 16 Europe Extended Real-Time Transient Model (E-RTTM) in Leak Detection Market, By Region,2019-2028, (USD Million)
TABLE 17 Europe Negative Pressure Waves in Leak Detection Market, By Region,2019-2028, (USD Million)
TABLE 18 Europe Thermal Imaging in Leak Detection Market, By Region,2019-2028, (USD Million)
TABLE 19 Europe Fibre Optic in Leak Detection Market, By Region,2019-2028, (USD Million)
TABLE 20 Europe Laser Absorption and LIDAR in Leak Detection Market, By Region,2019-2028, (USD Million)
TABLE 21 Europe Pressure-Flow Deviation Method in Leak Detection Market, By Region,2019-2028, (USD Million)
TABLE 22 Europe Mass/Volume Balance in Leak Detection Market, By Region,2019-2028, (USD Million)
TABLE 23 Europe Vapor Sensing in Leak Detection Market, By Region,2019-2028, (USD Million)
TABLE 24 Europe Hydraulic Leak Detection in Leak Detection Market, By Region,2019-2028, (USD Million)
TABLE 25 Europe Others in Leak Detection Market, By Region,2019-2028, (USD Million)
TABLE 26 Europe Leak Detection Market, By End User, 2019-2028 (USD Million)
TABLE 27 Europe Oil and Gas in Leak Detection Market, By Region,2019-2028, (USD Million)
TABLE 28 Europe Oil and Gas in Leak Detection Market, By Location, 2019-2028 (USD Million)
TABLE 29 Europe Oil and Gas Leak Detection Market, By Medium, 2019-2028 (USD Million)
TABLE 30 Europe Oil and Gas Leak Detection Market, By Technology, 2019-2028 (USD Million)
TABLE 31 Europe Chemical Plant in Leak Detection Market, By Region,2019-2028, (USD Million)
TABLE 32 Europe Chemical Plant Leak Detection Market, By Technology, 2019-2028 (USD Million)
TABLE 33 Europe Water Treatment Plant in Leak Detection Market, By Region,2019-2028, (USD Million)
TABLE 34 Europe Water Treatment Plant Leak Detection Market, By Technology, 2019-2028 (USD Million)
TABLE 35 Europe Thermal Power Plant in Leak Detection Market, By Region,2019-2028, (USD Million)
TABLE 36 Europe Thermal Power Plant Leak Detection Market, By Technology, 2019-2028 (USD Million)
TABLE 37 Europe Mining and Slurry in Leak Detection Market, By Region,2019-2028, (USD Million)
TABLE 38 Europe Mining and Slurry in Leak Detection Market, By technology, Market Forecast 2021-2028 (USD Million)
TABLE 39 Europe Mining and Slurry in Leak detection market, By region, Market Forecast 2021-2028 (USD Million)
TABLE 40 Europe leak detection MARKET, BY COUNTRY, 2019-2028 (USD Million)
TABLE 41 Europe Leak Detection Market, By Type, 2019-2028 (USD Million)
TABLE 42 Europe Leak Detection Market, By Product Type, 2019-2028 (USD Million)
TABLE 43 Europe Leak Detection Market, By Technology, 2019-2028 (USD Million)
TABLE 44 Europe leak detection Market, By end user, 2019-2028 (USD Million)
TABLE 45 Europe Oil and Gas in Leak Detection Market, By Location, 2019-2028 (USD Million)
TABLE 46 Europe Oil and Gas Leak Detection Market, By Medium, 2019-2028 (USD Million)
TABLE 47 Europe Oil and Gas Leak Detection Market, By Technology, 2019-2028 (USD Million)
TABLE 48 Europe Chemical Plant Leak Detection Market, By Technology, 2019-2028 (USD Million)
TABLE 49 Europe Water Treatment Plant Leak Detection Market, By Technology, 2019-2028 (USD Million)
TABLE 50 Europe Thermal Power Plant Leak Detection Market, By Technology, 2019-2028 (USD Million)
TABLE 51 Europe Mining and Slurry Leak Detection Market, By Technology, 2019-2028 (USD Million)
TABLE 52 Russia Leak Detection Market, By Type, 2019-2028 (USD Million)
TABLE 53 Russia Leak Detection Market, By Product Type, 2019-2028 (USD Million)
TABLE 54 Russia Leak Detection Market, By Technology, 2019-2028 (USD Million)
TABLE 55 Russia leak detection Market, By end user, 2019-2028 (USD Million)
TABLE 56 Russia Oil and Gas in Leak Detection Market, By Location, 2019-2028 (USD Million)
TABLE 57 Russia Oil and Gas Leak Detection Market, By Medium, 2019-2028 (USD Million)
TABLE 58 Russia Oil and Gas Leak Detection Market, By Technology, 2019-2028 (USD Million)
TABLE 59 Russia Chemical Plant Leak Detection Market, By Technology, 2019-2028 (USD Million)
TABLE 60 Russia Water Treatment Plant Leak Detection Market, By Technology, 2019-2028 (USD Million)
TABLE 61 Russia Thermal Power Plant Leak Detection Market, By Technology, 2019-2028 (USD Million)
TABLE 62 Russia Mining and Slurry Leak Detection Market, By Technology, 2019-2028 (USD Million)
TABLE 63 U.K. Leak Detection Market, By Type, 2019-2028 (USD Million)
TABLE 64 U.K. Leak Detection Market, By Product Type, 2019-2028 (USD Million)
TABLE 65 U.K. Leak Detection Market, By Technology, 2019-2028 (USD Million)
TABLE 66 U.K. leak detection Market, By end user, 2019-2028 (USD Million)
TABLE 67 U.K. Oil and Gas in Leak Detection Market, By Location, 2019-2028 (USD Million)
TABLE 68 U.K. Oil and Gas Leak Detection Market, By Medium, 2019-2028 (USD Million)
TABLE 69 U.K. Oil and Gas Leak Detection Market, By Technology, 2019-2028 (USD Million)
TABLE 70 U.K. Chemical Plant Leak Detection Market, By Technology, 2019-2028 (USD Million)
TABLE 71 U.K. Water Treatment Plant Leak Detection Market, By Technology, 2019-2028 (USD Million)
TABLE 72 U.K. Thermal Power Plant Leak Detection Market, By Technology, 2019-2028 (USD Million)
TABLE 73 U.K. Mining and Slurry Leak Detection Market, By Technology, 2019-2028 (USD Million)
TABLE 74 Italy Leak Detection Market, By Type, 2019-2028 (USD Million)
TABLE 75 Italy Leak Detection Market, By Product Type, 2019-2028 (USD Million)
TABLE 76 Italy Leak Detection Market, By Technology, 2019-2028 (USD Million)
TABLE 77 Italy leak detection Market, By end user, 2019-2028 (USD Million)
TABLE 78 Italy Oil and Gas in Leak Detection Market, By Location, 2019-2028 (USD Million)
TABLE 79 Italy Oil and Gas Leak Detection Market, By Medium, 2019-2028 (USD Million)
TABLE 80 Italy Oil and Gas Leak Detection Market, By Technology, 2019-2028 (USD Million)
TABLE 81 Italy Chemical Plant Leak Detection Market, By Technology, 2019-2028 (USD Million)
TABLE 82 Italy Water Treatment Plant Leak Detection Market, By Technology, 2019-2028 (USD Million)
TABLE 83 Italy Thermal Power Plant Leak Detection Market, By Technology, 2019-2028 (USD Million)
TABLE 84 Italy Mining and Slurry Leak Detection Market, By Technology, 2019-2028 (USD Million)
TABLE 85 Turkey Leak Detection Market, By Type, 2019-2028 (USD Million)
TABLE 86 Turkey Leak Detection Market, By Product Type, 2019-2028 (USD Million)
TABLE 87 Turkey Leak Detection Market, By Technology, 2019-2028 (USD Million)
TABLE 88 Turkey leak detection Market, By end user, 2019-2028 (USD Million)
TABLE 89 Turkey Oil and Gas in Leak Detection Market, By Location, 2019-2028 (USD Million)
TABLE 90 Turkey Oil and Gas Leak Detection Market, By Medium, 2019-2028 (USD Million)
TABLE 91 Turkey Oil and Gas Leak Detection Market, By Technology, 2019-2028 (USD Million)
TABLE 92 Turkey Chemical Plant Leak Detection Market, By Technology, 2019-2028 (USD Million)
TABLE 93 Turkey Water Treatment Plant Leak Detection Market, By Technology, 2019-2028 (USD Million)
TABLE 94 Turkey Thermal Power Plant Leak Detection Market, By Technology, 2019-2028 (USD Million)
TABLE 95 Turkey Mining and Slurry Leak Detection Market, By Technology, 2019-2028 (USD Million)
TABLE 96 Germany Leak Detection Market, By Type, 2019-2028 (USD Million)
TABLE 97 Germany Leak Detection Market, By Product Type, 2019-2028 (USD Million)
TABLE 98 Germany Leak Detection Market, By Technology, 2019-2028 (USD Million)
TABLE 99 Germany leak detection Market, By end user, 2019-2028 (USD Million)
TABLE 100 Germany Oil and Gas in Leak Detection Market, By Location, 2019-2028 (USD Million)
TABLE 101 Germany Oil and Gas Leak Detection Market, By Medium, 2019-2028 (USD Million)
TABLE 102 Germany Oil and Gas Leak Detection Market, By Technology, 2019-2028 (USD Million)
TABLE 103 Germany Chemical Plant Leak Detection Market, By Technology, 2019-2028 (USD Million)
TABLE 104 Germany Water Treatment Plant Leak Detection Market, By Technology, 2019-2028 (USD Million)
TABLE 105 Germany Thermal Power Plant Leak Detection Market, By Technology, 2019-2028 (USD Million)
TABLE 106 Germany Mining and Slurry Leak Detection Market, By Technology, 2019-2028 (USD Million)
TABLE 107 Netherlands Leak Detection Market, By Type, 2019-2028 (USD Million)
TABLE 108 Netherlands Leak Detection Market, By Product Type, 2019-2028 (USD Million)
TABLE 109 Netherlands Leak Detection Market, By Technology, 2019-2028 (USD Million)
TABLE 110 Netherlands leak detection Market, By end user, 2019-2028 (USD Million)
TABLE 111 Netherlands Oil and Gas in Leak Detection Market, By Location, 2019-2028 (USD Million)
TABLE 112 Netherlands Oil and Gas Leak Detection Market, By Medium, 2019-2028 (USD Million)
TABLE 113 Netherlands Oil and Gas Leak Detection Market, By Technology, 2019-2028 (USD Million)
TABLE 114 Netherlands Chemical Plant Leak Detection Market, By Technology, 2019-2028 (USD Million)
TABLE 115 Netherlands Water Treatment Plant Leak Detection Market, By Technology, 2019-2028 (USD Million)
TABLE 116 Netherlands Thermal Power Plant Leak Detection Market, By Technology, 2019-2028 (USD Million)
TABLE 117 Netherlands Mining and Slurry Leak Detection Market, By Technology, 2019-2028 (USD Million)
TABLE 118 Spain Leak Detection Market, By Type, 2019-2028 (USD Million)
TABLE 119 Spain Leak Detection Market, By Product Type, 2019-2028 (USD Million)
TABLE 120 Spain Leak Detection Market, By Technology, 2019-2028 (USD Million)
TABLE 121 spain leak detection Market, By end user, 2019-2028 (USD Million)
TABLE 122 spain Oil and Gas in Leak Detection Market, By Location, 2019-2028 (USD Million)
TABLE 123 spain Oil and Gas Leak Detection Market, By Medium, 2019-2028 (USD Million)
TABLE 124 spain Oil and Gas Leak Detection Market, By Technology, 2019-2028 (USD Million)
TABLE 125 spain Chemical Plant Leak Detection Market, By Technology, 2019-2028 (USD Million)
TABLE 126 spain Water Treatment Plant Leak Detection Market, By Technology, 2019-2028 (USD Million)
TABLE 127 spain Thermal Power Plant Leak Detection Market, By Technology, 2019-2028 (USD Million)
TABLE 128 spain Mining and Slurry Leak Detection Market, By Technology, 2019-2028 (USD Million)
TABLE 129 france Leak Detection Market, By Type, 2019-2028 (USD Million)
TABLE 130 france Leak Detection Market, By Product Type, 2019-2028 (USD Million)
TABLE 131 france Leak Detection Market, By Technology, 2019-2028 (USD Million)
TABLE 132 france leak detection Market, By end user, 2019-2028 (USD Million)
TABLE 133 france Oil and Gas in Leak Detection Market, By Location, 2019-2028 (USD Million)
TABLE 134 france Oil and Gas Leak Detection Market, By Medium, 2019-2028 (USD Million)
TABLE 135 france Oil and Gas Leak Detection Market, By Technology, 2019-2028 (USD Million)
TABLE 136 france Chemical Plant Leak Detection Market, By Technology, 2019-2028 (USD Million)
TABLE 137 france Water Treatment Plant Leak Detection Market, By Technology, 2019-2028 (USD Million)
TABLE 138 france Thermal Power Plant Leak Detection Market, By Technology, 2019-2028 (USD Million)
TABLE 139 france Mining and Slurry Leak Detection Market, By Technology, 2019-2028 (USD Million)
TABLE 140 belgium Leak Detection Market, By Type, 2019-2028 (USD Million)
TABLE 141 belgium Leak Detection Market, By Product Type, 2019-2028 (USD Million)
TABLE 142 belgium Leak Detection Market, By Technology, 2019-2028 (USD Million)
TABLE 143 belgium leak detection Market, By end user, 2019-2028 (USD Million)
TABLE 144 belgium Oil and Gas in Leak Detection Market, By Location, 2019-2028 (USD Million)
TABLE 145 belgium Oil and Gas Leak Detection Market, By Medium, 2019-2028 (USD Million)
TABLE 146 belgium Oil and Gas Leak Detection Market, By Technology, 2019-2028 (USD Million)
TABLE 147 belgium Chemical Plant Leak Detection Market, By Technology, 2019-2028 (USD Million)
TABLE 148 belgium Water Treatment Plant Leak Detection Market, By Technology, 2019-2028 (USD Million)
TABLE 149 belgium Thermal Power Plant Leak Detection Market, By Technology, 2019-2028 (USD Million)
TABLE 150 belgium Mining and Slurry Leak Detection Market, By Technology, 2019-2028 (USD Million)
TABLE 151 Switzerland Leak Detection Market, By Type, 2019-2028 (USD Million)
TABLE 152 Switzerland Leak Detection Market, By Product Type, 2019-2028 (USD Million)
TABLE 153 Switzerland Leak Detection Market, By Technology, 2019-2028 (USD Million)
TABLE 154 Switzerland leak detection Market, By end user, 2019-2028 (USD Million)
TABLE 155 Switzerland Oil and Gas in Leak Detection Market, By Location, 2019-2028 (USD Million)
TABLE 156 Switzerland Oil and Gas Leak Detection Market, By Medium, 2019-2028 (USD Million)
TABLE 157 Switzerland Oil and Gas Leak Detection Market, By Technology, 2019-2028 (USD Million)
TABLE 158 Switzerland Chemical Plant Leak Detection Market, By Technology, 2019-2028 (USD Million)
TABLE 159 Switzerland Water Treatment Plant Leak Detection Market, By Technology, 2019-2028 (USD Million)
TABLE 160 Switzerland Thermal Power Plant Leak Detection Market, By Technology, 2019-2028 (USD Million)
TABLE 161 Switzerland Mining and Slurry Leak Detection Market, By Technology, 2019-2028 (USD Million)
TABLE 162 Rest of Europe Leak detection MARKET, BY type, 2019-2028 (USD Million)
Abbildungsverzeichnis
FIGURE 1 Europe Leak Detection market: segmentation
FIGURE 2 EUROPE LEAK DETECTION MARKET: data triangulation
FIGURE 3 Europe Leak Detection market: DROC ANALYSIS
FIGURE 4 Europe Leak Detection market: EUROPE VS regional MARKET ANALYSIS
FIGURE 5 EUROPE LEAK DETECTION MARKET: COMPANY RESEARCH ANALYSIS
FIGURE 6 EUROPE LEAK DETECTION MARKET: INTERVIEW DEMOGRAPHICS
FIGURE 7 Europe Leak Detection market: DBMR MARKET POSITION GRID
FIGURE 8 Europe leak detection market: vendor share analysis
FIGURE 9 Europe Leak Detection market: SEGMENTATION
FIGURE 10 increasing growth in oil and gas pipeline and storage plant infrastructure is expected to DRIVe Europe Leak Detection MARKET IN THE FORECAST PERIOD of 2021 to 2028
FIGURE 11 midstream segment is expected to account for the largest share of Europe Leak Detection market in 2021 & 2028
FIGURE 12 DRIVERS, RESTRAINT, OPPORTUNITIES AND CHALLENGES OF EUROPE LEAK DETECTION MARKET
FIGURE 13 Europe leak detection MARKET: BY type, 2020
FIGURE 14 Europe leak detection MARKET: BY product type, 2020
FIGURE 15 Europe leak detection MARKET: BY technology, 2020
FIGURE 16 Europe leak detection MARKET: BY end user, 2020
FIGURE 17 Europe leak detection market: SNAPSHOT (2020)
FIGURE 18 Europe leak detection market: BY COUNTRY (2020)
FIGURE 19 Europe leak detection market: BY COUNTRY (2021& 2028)
FIGURE 20 Europe leak detection market: BY COUNTRY (2020& 2028)
FIGURE 21 Europe leak detection market: BY type (2021-2028)
FIGURE 22 EUROPE LEAK DETECTION market: COMPANY SHARE 2020 (%)
Forschungsmethodik
Die Datenerfassung und Basisjahresanalyse werden mithilfe von Datenerfassungsmodulen mit großen Stichprobengrößen durchgeführt. Die Phase umfasst das Erhalten von Marktinformationen oder verwandten Daten aus verschiedenen Quellen und Strategien. Sie umfasst die Prüfung und Planung aller aus der Vergangenheit im Voraus erfassten Daten. Sie umfasst auch die Prüfung von Informationsinkonsistenzen, die in verschiedenen Informationsquellen auftreten. Die Marktdaten werden mithilfe von marktstatistischen und kohärenten Modellen analysiert und geschätzt. Darüber hinaus sind Marktanteilsanalyse und Schlüsseltrendanalyse die wichtigsten Erfolgsfaktoren im Marktbericht. Um mehr zu erfahren, fordern Sie bitte einen Analystenanruf an oder geben Sie Ihre Anfrage ein.
Die wichtigste Forschungsmethodik, die vom DBMR-Forschungsteam verwendet wird, ist die Datentriangulation, die Data Mining, die Analyse der Auswirkungen von Datenvariablen auf den Markt und die primäre (Branchenexperten-)Validierung umfasst. Zu den Datenmodellen gehören ein Lieferantenpositionierungsraster, eine Marktzeitlinienanalyse, ein Marktüberblick und -leitfaden, ein Firmenpositionierungsraster, eine Patentanalyse, eine Preisanalyse, eine Firmenmarktanteilsanalyse, Messstandards, eine globale versus eine regionale und Lieferantenanteilsanalyse. Um mehr über die Forschungsmethodik zu erfahren, senden Sie eine Anfrage an unsere Branchenexperten.
Anpassung möglich
Data Bridge Market Research ist ein führendes Unternehmen in der fortgeschrittenen formativen Forschung. Wir sind stolz darauf, unseren bestehenden und neuen Kunden Daten und Analysen zu bieten, die zu ihren Zielen passen. Der Bericht kann angepasst werden, um Preistrendanalysen von Zielmarken, Marktverständnis für zusätzliche Länder (fordern Sie die Länderliste an), Daten zu klinischen Studienergebnissen, Literaturübersicht, Analysen des Marktes für aufgearbeitete Produkte und Produktbasis einzuschließen. Marktanalysen von Zielkonkurrenten können von technologiebasierten Analysen bis hin zu Marktportfoliostrategien analysiert werden. Wir können so viele Wettbewerber hinzufügen, wie Sie Daten in dem von Ihnen gewünschten Format und Datenstil benötigen. Unser Analystenteam kann Ihnen auch Daten in groben Excel-Rohdateien und Pivot-Tabellen (Fact Book) bereitstellen oder Sie bei der Erstellung von Präsentationen aus den im Bericht verfügbaren Datensätzen unterstützen.