>Der europäische Markt für hydrophobe Beschichtungen ist nach Inhaltsstofftyp (Präbiotika, Probiotika, Aminosäuren, Peptide, Omega-3- und strukturierte Lipide, Phytochemikalien und Pflanzenextrakte, Mineralien, Vitamine, Ballaststoffe und spezielle Kohlenhydrate, Carotinoide und Antioxidantien und andere), Anwendung (funktionelle Lebensmittel, Nahrungsergänzungsmittel, Gummiergänzungsmittel, Tierernährung, Körperpflege und andere) und Quelle (pflanzlich, tierisch und mikrobiell), Land (Deutschland, Großbritannien, Frankreich, Italien, Spanien, Niederlande, Belgien, Russland, Türkei, Schweiz, Dänemark, Schweden, Polen, übriges Europa), Branchentrends und Prognose bis 2028 segmentiert.
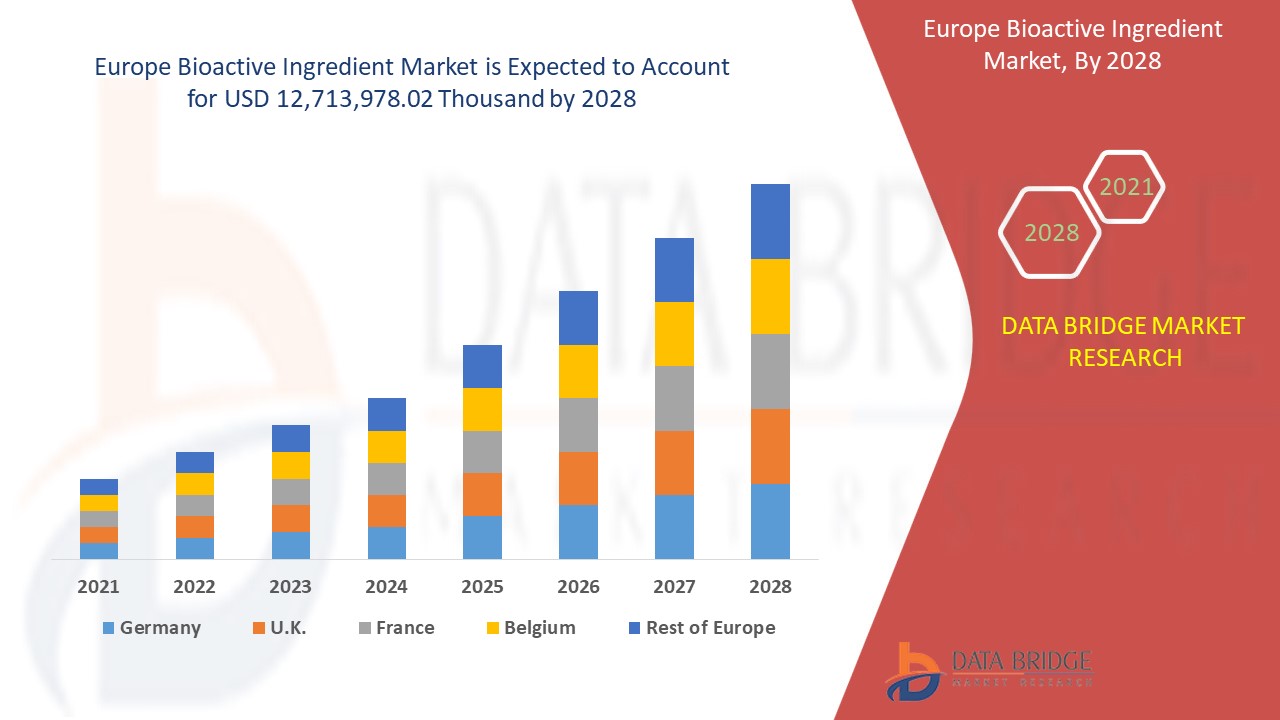
Marktanalyse und Einblicke: Europäischer Markt für bioaktive Inhaltsstoffe
Der europäische Markt für bioaktive Inhaltsstoffe wird im Prognosezeitraum 2021 bis 2028 voraussichtlich an Marktwachstum gewinnen. Data Bridge Market Research analysiert, dass der Markt im Prognosezeitraum 2021 bis 2028 mit einer durchschnittlichen jährlichen Wachstumsrate (CAGR) von 7,1 % wächst und bis 2028 voraussichtlich 12.713.978,02 Tausend USD erreichen wird.
Bioaktive Inhaltsstoffe sind Stoffe, die eine biologische Wirkung auf lebende Organismen haben. Die Komponenten stammen aus verschiedenen Quellen, darunter Pflanzen, Nahrungsmittel, Tiere, das Meer und Mikroorganismen. Bioaktive Substanzen werden Lebensmitteln und Futtermitteln zugesetzt, um die körperliche und physiologische Gesundheit der Verbraucher zu verbessern. In funktionellen Lebensmitteln und Getränken, Nahrungsergänzungsmitteln und Neugeborenennahrung werden bioaktive Substanzen in großem Umfang verwendet. Diese Chemikalien können helfen, Krebs, Herzkrankheiten und andere Krankheiten zu verhindern.
Bioaktive Substanzen werden in vielen Bereichen eingesetzt, darunter Lebensmittel und Getränke, Medikamente und Nutraceutika, Körperpflegeprodukte und Tierfutter. Carotinoide, ätherische Öle und Antioxidantien sind Beispiele für bioaktive Substanzen, die in funktionellen Mahlzeiten verwendet werden, um deren sensorische und ernährungsphysiologische Eigenschaften zu verbessern. Sie sind eine Art Biomoleküle, die den Stoffwechselprozess gesunder Moleküle unterstützen, die Lebensmitteln und verschiedenen Arten von Produkten zugesetzt werden.
Der Marktbericht zu bioaktiven Inhaltsstoffen enthält Einzelheiten zu Marktanteilen, neuen Entwicklungen und Produktpipeline-Analysen, Auswirkungen inländischer und lokaler Marktteilnehmer, analysiert Chancen in Bezug auf neue Umsatzquellen, Änderungen der Marktvorschriften, Produktzulassungen, strategische Entscheidungen, Produkteinführungen, geografische Expansionen und technologische Innovationen auf dem Markt. Um die Analyse und das Marktszenario zu verstehen, kontaktieren Sie uns für ein Analyst Briefing. Unser Team hilft Ihnen dabei, eine Umsatzauswirkungslösung zu entwickeln, mit der Sie Ihr gewünschtes Ziel erreichen.
Europa: Marktumfang und Marktgröße für bioaktive Inhaltsstoffe
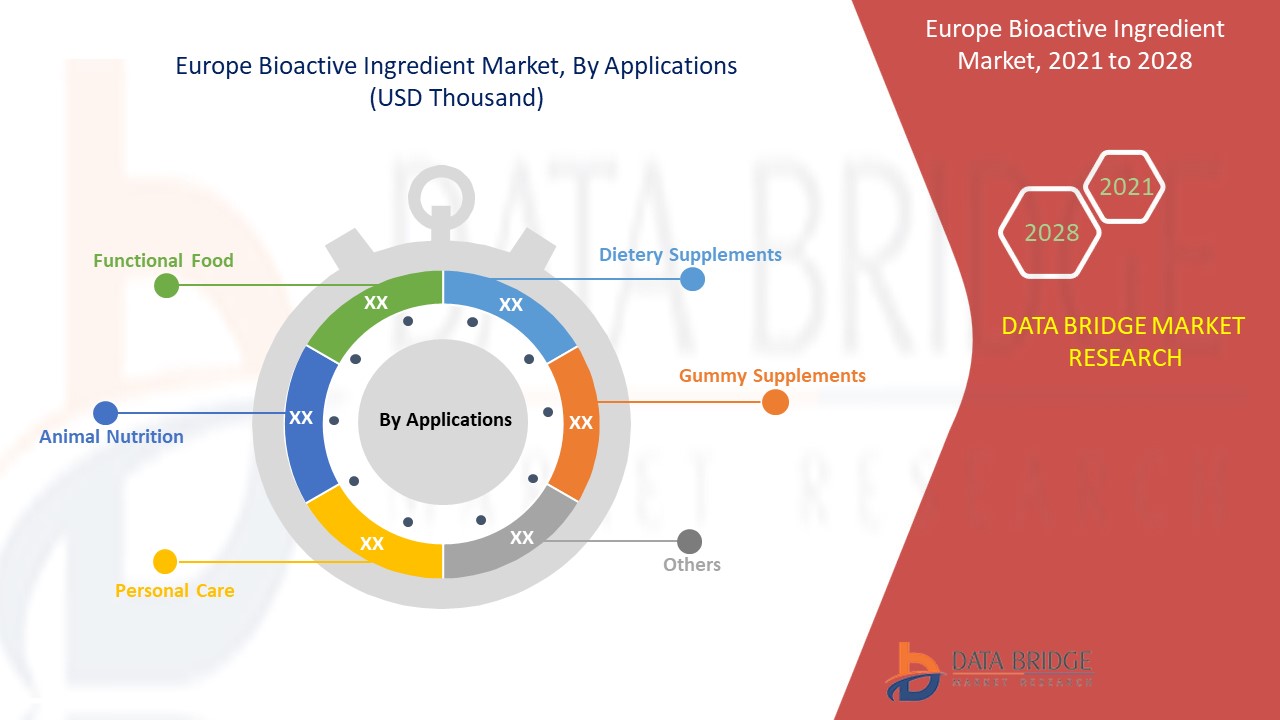
Der europäische Markt für bioaktive Inhaltsstoffe ist in drei wichtige Segmente unterteilt, die auf Inhaltsstofftyp, Anwendung und Quelle basieren. Das Wachstum zwischen den Segmenten hilft Ihnen, Wachstumsnischen und Strategien zur Marktbearbeitung zu analysieren und Ihre wichtigsten Anwendungsbereiche und die Unterschiede in Ihren Zielmärkten zu bestimmen.
- Auf der Grundlage des Inhaltsstofftyps ist der globale Markt für bioaktive Inhaltsstoffe in Präbiotika, Probiotika, Aminosäuren , Peptide, Omega-3- und strukturierte Lipide, sekundäre Pflanzenstoffe und Pflanzenextrakte, Mineralien, Vitamine, Ballaststoffe und spezielle Kohlenhydrate, Carotinoide und Antioxidantien und andere unterteilt. Präbiotika werden weiter in Fructane, Galacto-Oligosaccharide, Stärke und aus Glukose gewonnene Oligosaccharide, Nicht-Kohlenhydrat-Oligosaccharide und andere unterteilt. Probiotika werden weiter in Laktobazillen, Bifidobakterien und Hefen unterteilt. Aminosäuren werden weiter in Isoleucin, Histidin, Leucin, Lysin, Methionin, Phenylalanin, Threonin, Tryptophan, Valin und andere unterteilt. Peptide werden weiter in Dipeptide, Tripeptide, Oligopeptide und Polypeptide unterteilt. Mineralien werden weiter unterteilt in Kalzium , Phosphor, Magnesium, Natrium, Kalium, Mangan, Eisen, Kupfer, Jod, Zink und andere. Vitamine werden weiter unterteilt in Vitamin A, Vitamin C, Vitamin D, Vitamin E, Vitamin K, Vitamin B1, Vitamin B2, Vitamin B3, Vitamin B6, Vitamin B12 und andere.
- Auf Grundlage der Anwendung ist der globale Markt für bioaktive Inhaltsstoffe in funktionelle Lebensmittel, Nahrungsergänzungsmittel, Gummiergänzungsmittel, Tierernährung, Körperpflege und Sonstiges segmentiert. Funktionelle Lebensmittel werden weiter segmentiert in Milchprodukte, Milchalternativen, Brot, Nudeln, Müsli, Eierprodukte, Snackriegel, Riegel und Getränke . Milchprodukte werden weiter unterteilt in Milch, Joghurt, Käse, Butter und Sonstiges. Milchalternativen werden weiter unterteilt in pflanzliche Milch, pflanzlichen Joghurt, bioaktive Inhaltsstoffe und Sonstiges. Riegel werden weiter unterteilt in Proteinriegel, Sportnahrungsriegel, Yogariegel, Pre-Workout-Riegel, Post-Workout-Riegel und Sonstiges. Getränke werden weiter unterteilt in Säfte und Smoothies. Tierernährung wird nach Tierkategorien weiter segmentiert in Rind, Geflügel, Meeresfrüchte und Schwein. Körperpflege wird weiter segmentiert in Haarpflege und Hautpflege.
- Auf Grundlage der Quelle ist der globale Markt für bioaktive Inhaltsstoffe in pflanzliche, tierische und mikrobielle Inhaltsstoffe segmentiert.
Europa: Markt für bioaktive Inhaltsstoffe – Länderebeneanalyse
Der europäische Markt für bioaktive Inhaltsstoffe wird analysiert und Informationen zur Marktgröße werden nach Inhaltsstoff, Anwendung und Quelle bereitgestellt.
Die im europäischen Marktbericht zu bioaktiven Inhaltsstoffen abgedeckten Länder sind Deutschland, Großbritannien, Frankreich, Italien, Spanien, die Niederlande, Belgien, Russland, die Türkei, die Schweiz, Polen, Dänemark und das übrige Europa.
Der europäische Markt für bioaktive Inhaltsstoffe dominiert den Markt aufgrund der wachsenden Bevölkerung und der zunehmenden Krankheit in großen Teilen der Gesellschaft
Der Länderabschnitt des Berichts enthält auch Angaben zu einzelnen marktbeeinflussenden Faktoren und Änderungen der Regulierung auf dem Inlandsmarkt, die sich auf die aktuellen und zukünftigen Markttrends auswirken. Datenpunkte wie Neuverkäufe, Ersatzverkäufe, demografische Daten des Landes, Regulierungsgesetze und Import-/Exportzölle sind einige der wichtigsten Anhaltspunkte, die zur Prognose des Marktszenarios für einzelne Länder verwendet werden. Bei der Prognoseanalyse der Länderdaten werden auch die Präsenz und Verfügbarkeit von Marken und ihre Herausforderungen aufgrund großer oder geringer Konkurrenz durch lokale und inländische Marken sowie die Auswirkungen der Vertriebskanäle berücksichtigt.
Wachstum in der Branche der bioaktiven Inhaltsstoffe
Der europäische Markt für bioaktive Inhaltsstoffe bietet Ihnen außerdem eine detaillierte Marktanalyse für jedes Land, das Wachstum der installierten Basis verschiedener Arten von Produkten für den Markt für bioaktive Inhaltsstoffe, die Auswirkungen der Technologie anhand von Lebenslinienkurven und Änderungen der regulatorischen Szenarien für Säuglingsanfangsnahrung und deren Auswirkungen auf den Markt für bioaktive Inhaltsstoffe. Die Daten sind für den historischen Zeitraum 2010 bis 2019 verfügbar.
Wettbewerbsumfeld und Analyse der Marktanteile von bioaktiven Inhaltsstoffen
Die Wettbewerbslandschaft des europäischen Marktes für bioaktive Inhaltsstoffe liefert Details nach Wettbewerbern. Die enthaltenen Details sind Unternehmensübersicht, Unternehmensfinanzen, erzielter Umsatz, Marktpotenzial, Investitionen in Forschung und Entwicklung, neue Marktinitiativen, globale Präsenz, Produktionsstandorte und -anlagen, Stärken und Schwächen des Unternehmens, Produkteinführung, klinische Studienpipelines, Markenanalyse, Produktzulassungen, Patente, Produktbreite und -breite, Anwendungsdominanz, Technologie-Lebenslinienkurve. Die oben angegebenen Datenpunkte beziehen sich nur auf den Fokus des Unternehmens in Bezug auf den europäischen Markt für bioaktive Inhaltsstoffe.
Die wichtigsten Marktteilnehmer auf dem globalen Markt für bioaktive Inhaltsstoffe sind unter anderem DSM, BASF SE, Kerry, DuPont, ADM, Global Bio-chem Technology Group Company Limited, Evonik Industries AG, Cargill, Incorporated, Arla Food Ingredients Group P/S (eine Tochtergesellschaft von Arla Foods amba), FMC Corporation, Sunrise Nutrachem Group, Adisseo (eine Tochtergesellschaft von Bluestar Adisseo Co., Ltd.), Chr.Hansen Holding A/S, Sabinsa, Ajinomoto Co., Inc., NOVUS INTERNATIONAL (eine Tochtergesellschaft von Mitsui & Co. (USA), Inc.), Ingredion, Roquette Frères, Probi und Advanced Animal Nutrition Pty Ltd.
Zum Beispiel,
- Im Juni 2020 brachte Sabinsa den neuen Kräuterextrakt „Curcumins“ auf den Markt, der das Immunsystem stärkt. Das Produkt wurde eingeführt, um während der COVID-19-Pandemie eine neue Lösung auf den Markt zu bringen.
SKU-
Erhalten Sie Online-Zugriff auf den Bericht zur weltweit ersten Market Intelligence Cloud
- Interaktives Datenanalyse-Dashboard
- Unternehmensanalyse-Dashboard für Chancen mit hohem Wachstumspotenzial
- Zugriff für Research-Analysten für Anpassungen und Abfragen
- Konkurrenzanalyse mit interaktivem Dashboard
- Aktuelle Nachrichten, Updates und Trendanalyse
- Nutzen Sie die Leistungsfähigkeit der Benchmark-Analyse für eine umfassende Konkurrenzverfolgung
Inhaltsverzeichnis
- introduction
- OBJECTIVES OF THE STUDY
- MARKET DEFINITION
- OVERVIEW of EUROPE BIOACTIVE INGREDIENT MARKET
- LIMITATION
- MARKETS COVERED
- MARKET SEGMENTATION
- MARKETS COVERED
- geographicAL scope
- years considered for the study
- currency and pricing
- DBMR TRIPOD DATA VALIDATION MODEL
- Ingredient LIFE LINE CURVE
- MULTIVARIATE MODELING
- primary interviews with key opinion leaders
- DBMR MARKET POSITION GRID
- MARKET application COVERAGE GRID
- DBMR MARKET CHALLENGE MATRIX
- vendor share analysis
- IMPORT-EXPORT DATA
- secondary sourcEs
- assumptions
- EXECUTIVE SUMMARY
- premium insights
- Factors Influencing Purchasing Decision:
- MAJOR BRANDS COMPETITIVE ANALYSIS:
- NEW PRODUCT BRAND LAUNCHES AND INNOVATIONS
- Investments Made by Top Manufacturers
- REGULATORY FRAMEWORK AND GUIDELINES
- supply chain analysis
- market overview
- drivers
- Progressive use of bioactive ingredients in personal care products
- Growth in the co-prescription of bioactive ingredient along with traditional drugs
- Rising demand of bioactive ingredients in functional food
- Increasing adoption of bioactive ingredients in pharmaceuticals for chronic diseases
- Surge in the incidence of lifestyle diseases and lack of nutrition
- RESTRAINTS
- Lack of regulatory framework for validating heath claims
- Therapeutic constraints allied with bioactive ingredient
- Inadequate controls on safety and quality of bioactive ingredients
- OPPORTUNITIES
- Increasing awareness among consumers with rising preference for prevention instead of cure
- ADVANCEMENT IN R&D ASSOCIATED WITH ENCAPSULATION OF BIOACTIVE INGREDIENTS
- Growing trust among the consumers towards herbal ingredients and its involvement in bioactive market
- Challenges
- EXTRACTION OF THE BIOACTIVE COMPOUNDS AND MAINTAINING GOOD RECOVERY
- Valorization of fruit and vegetable wastes as bioactive compounds
- Analysis on Impact of Covid-19 on ‘Europe Bioactive ingredient Market”
- IMPACT ON PRICE
- IMPACT ON DEMAND
- Impact on supply chain
- Conclusion
- Europe Bioactive ingredient market, BY Ingredient Type
- overview
- Peptides
- Dipeptides
- Tripeptides
- Oligopeptides
- Polypeptides
- Prebiotic
- Fructans
- Galacto-Oligosaccharides
- Starch and Glucose-Derived Oligosaccharides
- Non-Carbohydrate Oligosaccharides
- Others
- Probiotics
- Lactobacilli
- Bifidobacteria
- Yeasts
- Minerals
- Zinc
- Calcium
- Phosphorus
- Magnesium
- Sodium
- Potassium
- Manganese
- Iron
- Copper
- Iodine
- Others
- Vitamins
- Vitamin A
- Vitamin c
- Vitamin d
- Vitamin E
- Vitamin K
- Vitamin B1
- Vitamin B2
- Vitamin B3
- Vitamin B6
- Vitamin B12
- Others
- Amino Acid
- Isoleucine
- Histidine
- Leucine
- Lysine
- Methionine
- Phenylalanine
- Threonine
- Tryptophan
- Valine
- Others
- Omega 3 and Structured Lipi
- Phytochemicals & Plant Extracts
- Fibers and Specialty Carbohydrates
- Carotenoids & Antioxidants
- Others
- Europe Bioactive ingredient market, BY Applications
- overview
- Functional Food
- Dairy
- Milk
- Yogurt
- Cheese
- Butter
- Others
- Dairy Alternatives
- Plant-Based Milk
- Plant-Based Yogurt
- Bioactive Ingredients
- Others
- Bread
- Cereal
- Egg Products
- Beverages
- Juices
- Smoothies
- Bars
- Protein Bars
- Sports Nutrition Bars
- Pre Work Out Bars
- Post Work Out Bars
- Others
- Pasta
- Snack Bars
- Animal Nutrition
- ANIMAL NUTRITION, BY ANIMAL CATEGORY
- Poultry
- Seafood
- Beef
- Pork
- Personal Care
- Hair Care
- Skin Care
- Dietary Supplements
- Gummy Supplements
- Others
- Europe Bioactive ingredient market, BY Source
- overview
- Plant
- Animal
- Microbial
- EUROPE Bioactive ingredient Market, BY GEOGRAPHY
- Europe
- Germany
- U.K.
- France
- ITALY
- Spain
- Netherlands
- Belgium
- Russia
- Turkey
- SWItzerland
- Denmark
- Sweden
- Poland
- Rest of Europe
- EUROPE BIOACTIVE INGREDIENT MARKET: COMPANY landscape
- company share analysis: EUROPE
- COMPANY PROFILE
- dsm
- COMPANY SNAPSHOT
- REVENUE ANALYSIS
- COMPANY SHARE ANALYSIS
- PRODUCT PORTFOLIO
- RECENT UPDATE
- basf se
- COMPANY SNAPSHOT
- REVENUE ANALYSIS
- COMPANY SHARE ANALYSIS
- PRODUCT PORTFOLIO
- RECENT UPDATES
- KERRY
- COMPANY SNAPSHOT
- REVENUE ANALYSIS
- COMPANY SHARE ANALYSIS
- PRODUCT PORTFOLIO
- RECENT UPDATE
- dupont
- COMPANY SNAPSHOT
- REVENUE ANALYSIS
- COMPANY SHARE ANALYSIS
- PRODUCT PORTFOLIO
- RECENT UPDATES
- ADM
- COMPANY SNAPSHOT
- REVENUE ANALYSIS
- COMPANY SHARE ANALYSIS
- PRODUCT PORTFOLIO
- RECENT UPDATE
- EUROPE BIO-CHEM TECHNOLOGY GROUP COMPANY LIMITED
- COMPANY SNAPSHOT
- REVENUE ANALYSIS
- PRODUCT PORTFOLIO
- RECENT UPDATE
- EVONIK Industries AG
- COMPANY SNAPSHOT
- REVENUE ANALYSIS
- PRODUCT PORTFOLIO
- RECENT UPDATE
- CARGILL, Incorporated
- COMPANY SNAPSHOT
- REVENUE ANALYSIS
- PRODUCT PORTFOLIO
- RECENT UPDATE
- Adisseo (A subsidiary of bluestar adisseo co., ltd.)
- COMPANY SNAPSHOT
- REVENUE ANALYSIS
- PRODUCT PORTFOLIO
- RECENT UPDATE
- Advanced animal nutrition pty ltd.
- COMPANY SNAPSHOT
- PRODUCT PORTFOLIO
- RECENT UPDATE
- Ajinomoto Co., Inc.
- COMPANY SNAPSHOT
- REVENUE ANALYSIS
- PRODUCT PORTFOLIO
- RECENT UPDATES
- Arla Food Ingrediants Group P/S (a subsidiary of Arla foods amba)
- COMPANY SNAPSHOT
- REVENUE ANALYSIS
- PRODUCT PORTFOLIO
- RECENT UPDATES
- Chr. hansen holding a/s
- COMPANY SNAPSHOT
- REVENUE ANALYSIS
- PRODUCT PORTFOLIO
- RECENT UPDATES
- FMC CORPORATION
- COMPANY SNAPSHOT
- REVENUE ANALYSIS
- PRODUCT PORTFOLIO
- RECENT UPDATE
- INGREDION
- COMPANY SNAPSHOT
- REVENUE ANALYSIS
- PRODUCT PORTFOLIO
- RECENT UPDATE
- novus international (A SUBSIDIARY OF Mitsui & Co. (U.S.A.), Inc.)
- COMPANY SNAPSHOT
- REVENUE ANALYSIS
- PRODUCT PORTFOLIO
- RECENT UPDATE
- pROBI
- COMPANY SNAPSHOT
- REVENUE ANALYSIS
- SOLUTION PORTFOLIO
- RECENT UPDATE
- Roquette FrèreS
- COMPANY SNAPSHOT
- PRODUCT PORTFOLIO
- RECENT UPDATE
- SabinsA
- COMPANY SNAPSHOT
- PRODUCT PORTFOLIO
- RECENT UPDATES
- sunrise nutrachem grouP
- COMPANY SNAPSHOT
- PRODUCT PORTFOLIO
- RECENT UPDATES
- QUESTIONNAIRES
- related reports
Tabellenverzeichnis
TABLE 1 IMPORT DATA of Food preparations, n.e.s.; HS Code - 210690 (USD Thousand)
TABLE 2 EXPORT DATA OF FOOD PREPARATIONS, N.E.S.; HS CODE - 210690 (USD THOUSAND)
TABLE 1 Europe bioactive ingredient market, By Ingredient Type, 2019-2028 (USD Thousand)
TABLE 2 Europe Bioactive ingredient Market, By Ingredient Type, 2019-2028 (Tons)
TABLE 3 Europe Peptides in bioactive ingredient MARKET, BY REGION, 2019-2028 (USD Thousand)
TABLE 4 Europe Peptides in bioactive ingredient MARKET, BY REGION, 2019-2028 (Tons)
TABLE 5 Europe Peptides in Bioactive Ingredient Market, By Ingredient Type, 2019-2028 (USD Thousand)
TABLE 6 Europe prebiotic in bioactive ingredient MARKET, BY REGION, 2019-2028 (USD Thousand)
TABLE 7 Europe prebiotic in bioactive ingredient MARKET, BY REGION, 2019-2028 (Tons)
TABLE 8 Europe Prebiotic in Bioactive Ingredient Market, By Ingredient Type, 2019-2028 (USD Thousand)
TABLE 9 Europe Probiotics in bioactive ingredient MARKET, BY REGION, 2019-2028 (USD Thousand)
TABLE 10 Europe Probiotics in bioactive ingredient MARKET, BY REGION, 2019-2028 (Tons)
TABLE 11 Europe Probiotic in Bioactive Ingredient Market, By Ingredient Type, 2019-2028 (USD Thousand)
TABLE 12 Europe Minerals in bioactive ingredient MARKET, BY REGION, 2019-2028 (USD Thousand)
TABLE 13 Europe Minerals in bioactive ingredient MARKET, BY REGION, 2019-2028 (Tons)
TABLE 14 Europe Minerals in Bioactive Ingredient Market, By Ingredient Type, 2019-2028 (USD Thousand)
TABLE 15 Europe Vitamins in bioactive ingredient MARKET, BY REGION, 2019-2028 (USD Thousand)
TABLE 16 Europe Vitamins in bioactive ingredient MARKET, BY REGION, 2019-2028 (Tons)
TABLE 17 Europe Vitamins in Bioactive Ingredient Market, By Ingredient Type, 2019-2028 (USD Thousand)
TABLE 18 Europe Amino Acid in bioactive ingredient MARKET, BY REGION, 2019-2028 (USD Thousand)
TABLE 19 Europe Amino Acid in bioactive ingredient MARKET, BY REGION, 2019-2028 (Tons)
TABLE 20 Europe AMINO ACID in Bioactive Ingredient Market, By Ingredient Type, 2019-2028 (USD Thousand)
TABLE 21 Europe Omega 3 and Structured Lipi in bioactive ingredient MARKET, BY REGION, 2019-2028 (USD Thousand)
TABLE 22 Europe Omega 3 and Structured Lipi in bioactive ingredient MARKET, BY REGION, 2019-2028 (Tons)
TABLE 23 Europe Phytochemicals & Plant Extracts in bioactive ingredient MARKET, BY REGION, 2019-2028 (USD Thousand)
TABLE 24 Europe Phytochemicals & Plant Extracts in bioactive ingredient MARKET, BY REGION, 2019-2028 (Tons)
TABLE 25 Europe Fibers and Specialty Carbohydrates in bioactive ingredient MARKET, BY REGION, 2019-2028 (USD Thousand)
TABLE 26 Europe Fibers and Specialty Carbohydrates in bioactive ingredient MARKET, BY REGION, 2019-2028 (Tons)
TABLE 27 Europe Carotenoids & Antioxidants in bioactive ingredient MARKET, BY REGION, 2019-2028 (USD Thousand)
TABLE 28 Europe Carotenoids & Antioxidants in bioactive ingredient MARKET, BY REGION, 2019-2028 (Tons)
TABLE 29 Europe Others in bioactive ingredient MARKET, BY REGION, 2019-2028 (USD Thousand)
TABLE 30 Europe Others in bioactive ingredient MARKET, BY REGION, 2019-2028 (Tons)
TABLE 31 Europe bioactive ingredient market, By Applications, 2019-2028 (USD Thousand)
TABLE 32 Europe Functional Food in bioactive ingredient MARKET, BY REGION, 2019-2028 (USD Thousand)
TABLE 33 Europe Functional Food in Bioactive Ingredient Market, By Applications, 2019-2028 (USD Thousand)
TABLE 34 Europe Dairy in Bioactive Ingredient Market, By Applications, 2019-2028 (USD Thousand)
TABLE 35 Europe Dairy alternatives in Bioactive Ingredient Market, By Applications, 2019-2028 (USD Thousand)
TABLE 36 Europe Beverages in Bioactive Ingredient Market, By Applications, 2019-2028 (USD Thousand)
TABLE 37 Europe Bars in Bioactive Ingredient Market, By Applications, 2019-2028 (USD Thousand)
TABLE 38 Europe Animal Nutrition in bioactive ingredient MARKET, BY REGION, 2019-2028 (USD Thousand)
TABLE 39 Europe Animal Nutrition in Bioactive Ingredient Market, By Applications, 2019-2028 (USD Thousand)
TABLE 40 Europe Personal Care in bioactive ingredient MARKET, BY REGION, 2019-2028 (USD Thousand)
TABLE 41 Europe Personal care in Bioactive Ingredient Market, By Applications, 2019-2028 (USD Thousand)
TABLE 42 Europe Dietary Supplements in bioactive ingredient MARKET, BY REGION, 2019-2028 (USD Thousand)
TABLE 43 Europe Gummy Supplements in bioactive ingredient MARKET, BY REGION, 2019-2028 (USD Thousand)
TABLE 44 Europe Others in bioactive ingredient MARKET, BY REGION, 2019-2028 (USD Thousand)
TABLE 45 Europe bioactive ingredient market, By Source, 2019-2028 (USD Thousand)
TABLE 46 Europe Plant in bioactive ingredient MARKET, BY REGION, 2019-2028 (USD Thousand)
TABLE 47 Europe Animal in bioactive ingredient MARKET, BY REGION, 2019-2028 (USD Thousand)
TABLE 48 Europe Microbial in bioactive ingredient MARKET, BY REGION, 2019-2028 (USD Thousand)
TABLE 49 Europe bioactive ingredient Market, BY COUNtry, 2019-2028 (USD Thousand)
TABLE 50 Europe bioactive ingredient Market, BY COUNtry, 2019-2028 (tons)
TABLE 51 Europe Bioactive ingredient Market, By Ingredient Type, 2019-2028 (USD Thousand)
TABLE 52 Europe Bioactive ingredient Market, By Ingredient Type, 2019-2028 (Tons)
TABLE 53 Europe Peptides in Bioactive ingredient Market, By Ingredient Type, 2019-2028 (USD Thousand)
TABLE 54 Europe Prebiotic in Bioactive ingredient Market, By Ingredient Type, 2019-2028 (USD Thousand)
TABLE 55 Europe Probiotic in Bioactive ingredient Market, By Ingredient Type, 2019-2028 (USD Thousand)
TABLE 56 Europe Minerals in Bioactive ingredient Market, By Ingredient Type, 2019-2028 (USD Thousand)
TABLE 57 Europe Vitamins in Bioactive ingredient Market, By Ingredient Type, 2019-2028 (USD Thousand)
TABLE 58 Europe Amino Acid in Bioactive ingredient Market, By Ingredient Type, 2019-2028 (USD Thousand)
TABLE 59 Europe Bioactive ingredient Market, By Applications, 2019-2028 (USD Thousand)
TABLE 60 Europe Functional Food in Bioactive ingredient Market, By Applications, 2019-2028 (USD Thousand)
TABLE 61 Europe Dairy in Bioactive ingredient Market, By Applications, 2019-2028 (USD Thousand)
TABLE 62 Europe Dairy Alternatives in Bioactive ingredient Market, By Applications, 2019-2028 (USD Thousand)
TABLE 63 Europe Beverages in Bioactive ingredient Market, By Applications, 2019-2028 (USD Thousand)
TABLE 64 Europe Bars in Bioactive ingredient Market, By Applications, 2019-2028 (USD Thousand)
TABLE 65 Europe Animal Nutrition in Bioactive ingredient Market, By Applications, 2019-2028 (USD Thousand)
TABLE 66 Europe Personal Care in Bioactive ingredient Market, By Applications, 2019-2028 (USD Thousand)
TABLE 67 Europe Bioactive ingredient Market, By Source, 2019-2028 (USD Thousand)
TABLE 68 GERMANY Bioactive ingredient Market, By Ingredient Type, 2019-2028 (USD Thousand)
TABLE 69 GERMANY Bioactive ingredient Market, By Ingredient Type, 2019-2028 (Tons)
TABLE 70 GERMANY Peptides in Bioactive ingredient Market, By Ingredient Type, 2019-2028 (USD Thousand)
TABLE 71 GERMANY Prebiotic in Bioactive ingredient Market, By Ingredient Type, 2019-2028 (USD Thousand)
TABLE 72 GERMANY Probiotic in Bioactive ingredient Market, By Ingredient Type, 2019-2028 (USD Thousand)
TABLE 73 GERMANY Minerals in Bioactive ingredient Market, By Ingredient Type, 2019-2028 (USD Thousand)
TABLE 74 GERMANY Vitamins in Bioactive ingredient Market, By Ingredient Type, 2019-2028 (USD Thousand)
TABLE 75 GERMANY Amino Acid in Bioactive ingredient Market, By Ingredient Type, 2019-2028 (USD Thousand)
TABLE 76 GERMANY Bioactive ingredient Market, By Applications, 2019-2028 (USD Thousand)
TABLE 77 GERMANY Functional Food in Bioactive ingredient Market, By Applications, 2019-2028 (USD Thousand)
TABLE 78 GERMANY Dairy in Bioactive ingredient Market, By Applications, 2019-2028 (USD Thousand)
TABLE 79 GERMANY Dairy Alternatives in Bioactive ingredient Market, By Applications, 2019-2028 (USD Thousand)
TABLE 80 GERMANY Beverages in Bioactive ingredient Market, By Applications, 2019-2028 (USD Thousand)
TABLE 81 GERMANY Bars in Bioactive ingredient Market, By Applications, 2019-2028 (USD Thousand)
TABLE 82 GERMANY Animal Nutrition in Bioactive ingredient Market, By Applications, 2019-2028 (USD Thousand)
TABLE 83 GERMANY Personal Care in Bioactive ingredient Market, By Applications, 2019-2028 (USD Thousand)
TABLE 84 GERMANY Bioactive ingredient Market, By Source, 2019-2028 (USD Thousand)
TABLE 85 U.K. Bioactive ingredient Market, By Ingredient Type, 2019-2028 (USD Thousand)
TABLE 86 U.K. Bioactive ingredient Market, By Ingredient Type, 2019-2028 (Tons)
TABLE 87 U.K. Peptides in Bioactive ingredient Market, By Ingredient Type, 2019-2028 (USD Thousand)
TABLE 88 U.K. Prebiotic in Bioactive ingredient Market, By Ingredient Type, 2019-2028 (USD Thousand)
TABLE 89 U.K. Probiotic in Bioactive ingredient Market, By Ingredient Type, 2019-2028 (USD Thousand)
TABLE 90 U.K. Minerals in Bioactive ingredient Market, By Ingredient Type, 2019-2028 (USD Thousand)
TABLE 91 U.K. Vitamins in Bioactive ingredient Market, By Ingredient Type, 2019-2028 (USD Thousand)
TABLE 92 U.K. Amino Acid in Bioactive ingredient Market, By Ingredient Type, 2019-2028 (USD Thousand)
TABLE 93 U.K. Bioactive ingredient Market, By Applications, 2019-2028 (USD Thousand)
TABLE 94 U.K. Functional Food in Bioactive ingredient Market, By Applications, 2019-2028 (USD Thousand)
TABLE 95 U.K. Dairy in Bioactive ingredient Market, By Applications, 2019-2028 (USD Thousand)
TABLE 96 U.K. Dairy Alternatives in Bioactive ingredient Market, By Applications, 2019-2028 (USD Thousand)
TABLE 97 U.K. Beverages in Bioactive ingredient Market, By Applications, 2019-2028 (USD Thousand)
TABLE 98 U.K. Bars in Bioactive ingredient Market, By Applications, 2019-2028 (USD Thousand)
TABLE 99 U.K. Animal Nutrition in Bioactive ingredient Market, By Applications, 2019-2028 (USD Thousand)
TABLE 100 U.K. Personal Care in Bioactive ingredient Market, By Applications, 2019-2028 (USD Thousand)
TABLE 101 U.K. Bioactive ingredient Market, By Source, 2019-2028 (USD Thousand)
TABLE 102 FRANCE Bioactive ingredient Market, By Ingredient Type, 2019-2028 (USD Thousand)
TABLE 103 FRANCE Bioactive ingredient Market, By Ingredient Type, 2019-2028 (Tons)
TABLE 104 FRANCE Peptides in Bioactive ingredient Market, By Ingredient Type, 2019-2028 (USD Thousand)
TABLE 105 FRANCE Prebiotic in Bioactive ingredient Market, By Ingredient Type, 2019-2028 (USD Thousand)
TABLE 106 FRANCE Probiotic in Bioactive ingredient Market, By Ingredient Type, 2019-2028 (USD Thousand)
TABLE 107 FRANCE Minerals in Bioactive ingredient Market, By Ingredient Type, 2019-2028 (USD Thousand)
TABLE 108 FRANCE Vitamins in Bioactive ingredient Market, By Ingredient Type, 2019-2028 (USD Thousand)
TABLE 109 FRANCE Amino Acid in Bioactive ingredient Market, By Ingredient Type, 2019-2028 (USD Thousand)
TABLE 110 FRANCE Bioactive ingredient Market, By Applications, 2019-2028 (USD Thousand)
TABLE 111 FRANCE Functional Food in Bioactive ingredient Market, By Applications, 2019-2028 (USD Thousand)
TABLE 112 FRANCE Dairy in Bioactive ingredient Market, By Applications, 2019-2028 (USD Thousand)
TABLE 113 FRANCE Dairy Alternatives in Bioactive ingredient Market, By Applications, 2019-2028 (USD Thousand)
TABLE 114 FRANCE Beverages in Bioactive ingredient Market, By Applications, 2019-2028 (USD Thousand)
TABLE 115 FRANCE Bars in Bioactive ingredient Market, By Applications, 2019-2028 (USD Thousand)
TABLE 116 FRANCE Animal Nutrition in Bioactive ingredient Market, By Applications, 2019-2028 (USD Thousand)
TABLE 117 FRANCE Personal Care in Bioactive ingredient Market, By Applications, 2019-2028 (USD Thousand)
TABLE 118 FRANCE Bioactive ingredient Market, By Source, 2019-2028 (USD Thousand)
TABLE 119 ITALY Bioactive ingredient Market, By Ingredient Type, 2019-2028 (USD Thousand)
TABLE 120 ITALY Bioactive ingredient Market, By Ingredient Type, 2019-2028 (Tons)
TABLE 121 ITALY Peptides in Bioactive ingredient Market, By Ingredient Type, 2019-2028 (USD Thousand)
TABLE 122 ITALY Prebiotic in Bioactive ingredient Market, By Ingredient Type, 2019-2028 (USD Thousand)
TABLE 123 ITALY Probiotic in Bioactive ingredient Market, By Ingredient Type, 2019-2028 (USD Thousand)
TABLE 124 ITALY Minerals in Bioactive ingredient Market, By Ingredient Type, 2019-2028 (USD Thousand)
TABLE 125 ITALY Vitamins in Bioactive ingredient Market, By Ingredient Type, 2019-2028 (USD Thousand)
TABLE 126 ITALY Amino Acid in Bioactive ingredient Market, By Ingredient Type, 2019-2028 (USD Thousand)
TABLE 127 ITALY Bioactive ingredient Market, By Applications, 2019-2028 (USD Thousand)
TABLE 128 ITALY Functional Food in Bioactive ingredient Market, By Applications, 2019-2028 (USD Thousand)
TABLE 129 ITALY Dairy in Bioactive ingredient Market, By Applications, 2019-2028 (USD Thousand)
TABLE 130 ITALY Dairy Alternatives in Bioactive ingredient Market, By Applications, 2019-2028 (USD Thousand)
TABLE 131 ITALY Beverages in Bioactive ingredient Market, By Applications, 2019-2028 (USD Thousand)
TABLE 132 ITALY Bars in Bioactive ingredient Market, By Applications, 2019-2028 (USD Thousand)
TABLE 133 ITALY Animal Nutrition in Bioactive ingredient Market, By Applications, 2019-2028 (USD Thousand)
TABLE 134 ITALY Personal Care in Bioactive ingredient Market, By Applications, 2019-2028 (USD Thousand)
TABLE 135 ITALY Bioactive ingredient Market, By Source, 2019-2028 (USD Thousand)
TABLE 136 SPAIN Bioactive ingredient Market, By Ingredient Type, 2019-2028 (USD Thousand)
TABLE 137 SPAIN Bioactive ingredient Market, By Ingredient Type, 2019-2028 (Tons)
TABLE 138 SPAIN Peptides in Bioactive ingredient Market, By Ingredient Type, 2019-2028 (USD Thousand)
TABLE 139 SPAIN Prebiotic in Bioactive ingredient Market, By Ingredient Type, 2019-2028 (USD Thousand)
TABLE 140 SPAIN Probiotic in Bioactive ingredient Market, By Ingredient Type, 2019-2028 (USD Thousand)
TABLE 141 SPAIN Minerals in Bioactive ingredient Market, By Ingredient Type, 2019-2028 (USD Thousand)
TABLE 142 SPAIN Vitamins in Bioactive ingredient Market, By Ingredient Type, 2019-2028 (USD Thousand)
TABLE 143 SPAIN Amino Acid in Bioactive ingredient Market, By Ingredient Type, 2019-2028 (USD Thousand)
TABLE 144 SPAIN Bioactive ingredient Market, By Applications, 2019-2028 (USD Thousand)
TABLE 145 SPAIN Functional Food in Bioactive ingredient Market, By Applications, 2019-2028 (USD Thousand)
TABLE 146 SPAIN Dairy in Bioactive ingredient Market, By Applications, 2019-2028 (USD Thousand)
TABLE 147 SPAIN Dairy Alternatives in Bioactive ingredient Market, By Applications, 2019-2028 (USD Thousand)
TABLE 148 SPAIN Beverages in Bioactive ingredient Market, By Applications, 2019-2028 (USD Thousand)
TABLE 149 SPAIN Bars in Bioactive ingredient Market, By Applications, 2019-2028 (USD Thousand)
TABLE 150 SPAIN Animal Nutrition in Bioactive ingredient Market, By Applications, 2019-2028 (USD Thousand)
TABLE 151 SPAIN Personal Care in Bioactive ingredient Market, By Applications, 2019-2028 (USD Thousand)
TABLE 152 SPAIN Bioactive ingredient Market, By Source, 2019-2028 (USD Thousand)
TABLE 153 NETHERLANDS Bioactive ingredient Market, By Ingredient Type, 2019-2028 (USD Thousand)
TABLE 154 NETHERLANDS Bioactive ingredient Market, By Ingredient Type, 2019-2028 (Tons)
TABLE 155 NETHERLANDS Peptides in Bioactive ingredient Market, By Ingredient Type, 2019-2028 (USD Thousand)
TABLE 156 NETHERLANDS Prebiotic in Bioactive ingredient Market, By Ingredient Type, 2019-2028 (USD Thousand)
TABLE 157 NETHERLANDS Probiotic in Bioactive ingredient Market, By Ingredient Type, 2019-2028 (USD Thousand)
TABLE 158 NETHERLANDS Minerals in Bioactive ingredient Market, By Ingredient Type, 2019-2028 (USD Thousand)
TABLE 159 NETHERLANDS Vitamins in Bioactive ingredient Market, By Ingredient Type, 2019-2028 (USD Thousand)
TABLE 160 NETHERLANDS Amino Acid in Bioactive ingredient Market, By Ingredient Type, 2019-2028 (USD Thousand)
TABLE 161 NETHERLANDS Bioactive ingredient Market, By Applications, 2019-2028 (USD Thousand)
TABLE 162 NETHERLANDS Functional Food in Bioactive ingredient Market, By Applications, 2019-2028 (USD Thousand)
TABLE 163 NETHERLANDS Dairy in Bioactive ingredient Market, By Applications, 2019-2028 (USD Thousand)
TABLE 164 NETHERLANDS Dairy Alternatives in Bioactive ingredient Market, By Applications, 2019-2028 (USD Thousand)
TABLE 165 NETHERLANDS Beverages in Bioactive ingredient Market, By Applications, 2019-2028 (USD Thousand)
TABLE 166 NETHERLANDS Bars in Bioactive ingredient Market, By Applications, 2019-2028 (USD Thousand)
TABLE 167 NETHERLANDS Animal Nutrition in Bioactive ingredient Market, By Applications, 2019-2028 (USD Thousand)
TABLE 168 NETHERLANDS Personal Care in Bioactive ingredient Market, By Applications, 2019-2028 (USD Thousand)
TABLE 169 NETHERLANDS Bioactive ingredient Market, By Source, 2019-2028 (USD Thousand)
TABLE 170 BELGIUM Bioactive ingredient Market, By Ingredient Type, 2019-2028 (USD Thousand)
TABLE 171 BELGIUM Bioactive ingredient Market, By Ingredient Type, 2019-2028 (Tons)
TABLE 172 BELGIUM Peptides in Bioactive ingredient Market, By Ingredient Type, 2019-2028 (USD Thousand)
TABLE 173 BELGIUM Prebiotic in Bioactive ingredient Market, By Ingredient Type, 2019-2028 (USD Thousand)
TABLE 174 BELGIUM Probiotic in Bioactive ingredient Market, By Ingredient Type, 2019-2028 (USD Thousand)
TABLE 175 BELGIUM Minerals in Bioactive ingredient Market, By Ingredient Type, 2019-2028 (USD Thousand)
TABLE 176 BELGIUM Vitamins in Bioactive ingredient Market, By Ingredient Type, 2019-2028 (USD Thousand)
TABLE 177 BELGIUM Amino Acid in Bioactive ingredient Market, By Ingredient Type, 2019-2028 (USD Thousand)
TABLE 178 BELGIUM Bioactive ingredient Market, By Applications, 2019-2028 (USD Thousand)
TABLE 179 BELGIUM Functional Food in Bioactive ingredient Market, By Applications, 2019-2028 (USD Thousand)
TABLE 180 BELGIUM Dairy in Bioactive ingredient Market, By Applications, 2019-2028 (USD Thousand)
TABLE 181 BELGIUM Dairy Alternatives in Bioactive ingredient Market, By Applications, 2019-2028 (USD Thousand)
TABLE 182 BELGIUM Beverages in Bioactive ingredient Market, By Applications, 2019-2028 (USD Thousand)
TABLE 183 BELGIUM Bars in Bioactive ingredient Market, By Applications, 2019-2028 (USD Thousand)
TABLE 184 BELGIUM Animal Nutrition in Bioactive ingredient Market, By Applications, 2019-2028 (USD Thousand)
TABLE 185 BELGIUM Personal Care in Bioactive ingredient Market, By Applications, 2019-2028 (USD Thousand)
TABLE 186 BELGIUM Bioactive ingredient Market, By Source, 2019-2028 (USD Thousand)
TABLE 187 RUSSIA Bioactive ingredient Market, By Ingredient Type, 2019-2028 (USD Thousand)
TABLE 188 RUSSIA Bioactive ingredient Market, By Ingredient Type, 2019-2028 (Tons)
TABLE 189 RUSSIA Peptides in Bioactive ingredient Market, By Ingredient Type, 2019-2028 (USD Thousand)
TABLE 190 RUSSIA Prebiotic in Bioactive ingredient Market, By Ingredient Type, 2019-2028 (USD Thousand)
TABLE 191 RUSSIA Probiotic in Bioactive ingredient Market, By Ingredient Type, 2019-2028 (USD Thousand)
TABLE 192 RUSSIA Minerals in Bioactive ingredient Market, By Ingredient Type, 2019-2028 (USD Thousand)
TABLE 193 RUSSIA Vitamins in Bioactive ingredient Market, By Ingredient Type, 2019-2028 (USD Thousand)
TABLE 194 RUSSIA Amino Acid in Bioactive ingredient Market, By Ingredient Type, 2019-2028 (USD Thousand)
TABLE 195 RUSSIA Bioactive ingredient Market, By Applications, 2019-2028 (USD Thousand)
TABLE 196 RUSSIA Functional Food in Bioactive ingredient Market, By Applications, 2019-2028 (USD Thousand)
TABLE 197 RUSSIA Dairy in Bioactive ingredient Market, By Applications, 2019-2028 (USD Thousand)
TABLE 198 RUSSIA Dairy Alternatives in Bioactive ingredient Market, By Applications, 2019-2028 (USD Thousand)
TABLE 199 RUSSIA Beverages in Bioactive ingredient Market, By Applications, 2019-2028 (USD Thousand)
TABLE 200 RUSSIA Bars in Bioactive ingredient Market, By Applications, 2019-2028 (USD Thousand)
TABLE 201 RUSSIA Animal Nutrition in Bioactive ingredient Market, By Applications, 2019-2028 (USD Thousand)
TABLE 202 RUSSIA Personal Care in Bioactive ingredient Market, By Applications, 2019-2028 (USD Thousand)
TABLE 203 RUSSIA Bioactive ingredient Market, By Source, 2019-2028 (USD Thousand)
TABLE 204 TURKEY Bioactive ingredient Market, By Ingredient Type, 2019-2028 (USD Thousand)
TABLE 205 TURKEY Bioactive ingredient Market, By Ingredient Type, 2019-2028 (Tons)
TABLE 206 TURKEY Peptides in Bioactive ingredient Market, By Ingredient Type, 2019-2028 (USD Thousand)
TABLE 207 TURKEY Prebiotic in Bioactive ingredient Market, By Ingredient Type, 2019-2028 (USD Thousand)
TABLE 208 TURKEY Probiotic in Bioactive ingredient Market, By Ingredient Type, 2019-2028 (USD Thousand)
TABLE 209 TURKEY Minerals in Bioactive ingredient Market, By Ingredient Type, 2019-2028 (USD Thousand)
TABLE 210 TURKEY Vitamins in Bioactive ingredient Market, By Ingredient Type, 2019-2028 (USD Thousand)
TABLE 211 TURKEY Amino Acid in Bioactive ingredient Market, By Ingredient Type, 2019-2028 (USD Thousand)
TABLE 212 TURKEY Bioactive ingredient Market, By Applications, 2019-2028 (USD Thousand)
TABLE 213 TURKEY Functional Food in Bioactive ingredient Market, By Applications, 2019-2028 (USD Thousand)
TABLE 214 TURKEY Dairy in Bioactive ingredient Market, By Applications, 2019-2028 (USD Thousand)
TABLE 215 TURKEY Dairy Alternatives in Bioactive ingredient Market, By Applications, 2019-2028 (USD Thousand)
TABLE 216 TURKEY Beverages in Bioactive ingredient Market, By Applications, 2019-2028 (USD Thousand)
TABLE 217 TURKEY Bars in Bioactive ingredient Market, By Applications, 2019-2028 (USD Thousand)
TABLE 218 TURKEY Animal Nutrition in Bioactive ingredient Market, By Applications, 2019-2028 (USD Thousand)
TABLE 219 TURKEY Personal Care in Bioactive ingredient Market, By Applications, 2019-2028 (USD Thousand)
TABLE 220 TURKEY Bioactive ingredient Market, By Source, 2019-2028 (USD Thousand)
TABLE 221 SWITZERLAND Bioactive ingredient Market, By Ingredient Type, 2019-2028 (USD Thousand)
TABLE 222 SWITZERLAND Bioactive ingredient Market, By Ingredient Type, 2019-2028 (Tons)
TABLE 223 SWITZERLAND Peptides in Bioactive ingredient Market, By Ingredient Type, 2019-2028 (USD Thousand)
TABLE 224 SWITZERLAND Prebiotic in Bioactive ingredient Market, By Ingredient Type, 2019-2028 (USD Thousand)
TABLE 225 SWITZERLAND Probiotic in Bioactive ingredient Market, By Ingredient Type, 2019-2028 (USD Thousand)
TABLE 226 SWITZERLAND Minerals in Bioactive ingredient Market, By Ingredient Type, 2019-2028 (USD Thousand)
TABLE 227 SWITZERLAND Vitamins in Bioactive ingredient Market, By Ingredient Type, 2019-2028 (USD Thousand)
TABLE 228 SWITZERLAND Amino Acid in Bioactive ingredient Market, By Ingredient Type, 2019-2028 (USD Thousand)
TABLE 229 SWITZERLAND Bioactive ingredient Market, By Applications, 2019-2028 (USD Thousand)
TABLE 230 SWITZERLAND Functional Food in Bioactive ingredient Market, By Applications, 2019-2028 (USD Thousand)
TABLE 231 SWITZERLAND Dairy in Bioactive ingredient Market, By Applications, 2019-2028 (USD Thousand)
TABLE 232 SWITZERLAND Dairy Alternatives in Bioactive ingredient Market, By Applications, 2019-2028 (USD Thousand)
TABLE 233 SWITZERLAND Beverages in Bioactive ingredient Market, By Applications, 2019-2028 (USD Thousand)
TABLE 234 SWITZERLAND Bars in Bioactive ingredient Market, By Applications, 2019-2028 (USD Thousand)
TABLE 235 SWITZERLAND Animal Nutrition in Bioactive ingredient Market, By Applications, 2019-2028 (USD Thousand)
TABLE 236 SWITZERLAND Personal Care in Bioactive ingredient Market, By Applications, 2019-2028 (USD Thousand)
TABLE 237 SWITZERLAND Bioactive ingredient Market, By Source, 2019-2028 (USD Thousand)
TABLE 238 DENMARK Bioactive ingredient Market, By Ingredient Type, 2019-2028 (USD Thousand)
TABLE 239 DENMARK Bioactive ingredient Market, By Ingredient Type, 2019-2028 (Tons)
TABLE 240 DENMARK Peptides in Bioactive ingredient Market, By Ingredient Type, 2019-2028 (USD Thousand)
TABLE 241 DENMARK Prebiotic in Bioactive ingredient Market, By Ingredient Type, 2019-2028 (USD Thousand)
TABLE 242 DENMARK Probiotic in Bioactive ingredient Market, By Ingredient Type, 2019-2028 (USD Thousand)
TABLE 243 DENMARK Minerals in Bioactive ingredient Market, By Ingredient Type, 2019-2028 (USD Thousand)
TABLE 244 DENMARK Vitamins in Bioactive ingredient Market, By Ingredient Type, 2019-2028 (USD Thousand)
TABLE 245 DENMARK Amino Acid in Bioactive ingredient Market, By Ingredient Type, 2019-2028 (USD Thousand)
TABLE 246 DENMARK Bioactive ingredient Market, By Applications, 2019-2028 (USD Thousand)
TABLE 247 DENMARK Functional Food in Bioactive ingredient Market, By Applications, 2019-2028 (USD Thousand)
TABLE 248 DENMARK Dairy in Bioactive ingredient Market, By Applications, 2019-2028 (USD Thousand)
TABLE 249 DENMARK Dairy Alternatives in Bioactive ingredient Market, By Applications, 2019-2028 (USD Thousand)
TABLE 250 DENMARK Beverages in Bioactive ingredient Market, By Applications, 2019-2028 (USD Thousand)
TABLE 251 DENMARK Bars in Bioactive ingredient Market, By Applications, 2019-2028 (USD Thousand)
TABLE 252 DENMARK Animal Nutrition in Bioactive ingredient Market, By Applications, 2019-2028 (USD Thousand)
TABLE 253 DENMARK Personal Care in Bioactive ingredient Market, By Applications, 2019-2028 (USD Thousand)
TABLE 254 DENMARK Bioactive ingredient Market, By Source, 2019-2028 (USD Thousand)
TABLE 255 SWEDEN Bioactive ingredient Market, By Ingredient Type, 2019-2028 (USD Thousand)
TABLE 256 SWEDEN Bioactive ingredient Market, By Ingredient Type, 2019-2028 (Tons)
TABLE 257 SWEDEN Peptides in Bioactive ingredient Market, By Ingredient Type, 2019-2028 (USD Thousand)
TABLE 258 SWEDEN Prebiotic in Bioactive ingredient Market, By Ingredient Type, 2019-2028 (USD Thousand)
TABLE 259 SWEDEN Probiotic in Bioactive ingredient Market, By Ingredient Type, 2019-2028 (USD Thousand)
TABLE 260 SWEDEN Minerals in Bioactive ingredient Market, By Ingredient Type, 2019-2028 (USD Thousand)
TABLE 261 SWEDEN Vitamins in Bioactive ingredient Market, By Ingredient Type, 2019-2028 (USD Thousand)
TABLE 262 SWEDEN Amino Acid in Bioactive ingredient Market, By Ingredient Type, 2019-2028 (USD Thousand)
TABLE 263 SWEDEN Bioactive ingredient Market, By Applications, 2019-2028 (USD Thousand)
TABLE 264 SWEDEN Functional Food in Bioactive ingredient Market, By Applications, 2019-2028 (USD Thousand)
TABLE 265 SWEDEN Dairy in Bioactive ingredient Market, By Applications, 2019-2028 (USD Thousand)
TABLE 266 SWEDEN Dairy Alternatives in Bioactive ingredient Market, By Applications, 2019-2028 (USD Thousand)
TABLE 267 SWEDEN Beverages in Bioactive ingredient Market, By Applications, 2019-2028 (USD Thousand)
TABLE 268 SWEDEN Bars in Bioactive ingredient Market, By Applications, 2019-2028 (USD Thousand)
TABLE 269 SWEDEN Animal Nutrition in Bioactive ingredient Market, By Applications, 2019-2028 (USD Thousand)
TABLE 270 SWEDEN Personal Care in Bioactive ingredient Market, By Applications, 2019-2028 (USD Thousand)
TABLE 271 SWEDEN Bioactive ingredient Market, By Source, 2019-2028 (USD Thousand)
TABLE 272 POLAND Bioactive ingredient Market, By Ingredient Type, 2019-2028 (USD Thousand)
TABLE 273 POLAND Bioactive ingredient Market, By Ingredient Type, 2019-2028 (Tons)
TABLE 274 POLAND Peptides in Bioactive ingredient Market, By Ingredient Type, 2019-2028 (USD Thousand)
TABLE 275 POLAND Prebiotic in Bioactive ingredient Market, By Ingredient Type, 2019-2028 (USD Thousand)
TABLE 276 POLAND Probiotic in Bioactive ingredient Market, By Ingredient Type, 2019-2028 (USD Thousand)
TABLE 277 POLAND Minerals in Bioactive ingredient Market, By Ingredient Type, 2019-2028 (USD Thousand)
TABLE 278 POLAND Vitamins in Bioactive ingredient Market, By Ingredient Type, 2019-2028 (USD Thousand)
TABLE 279 POLAND Amino Acid in Bioactive ingredient Market, By Ingredient Type, 2019-2028 (USD Thousand)
TABLE 280 POLAND Bioactive ingredient Market, By Applications, 2019-2028 (USD Thousand)
TABLE 281 POLAND Functional Food in Bioactive ingredient Market, By Applications, 2019-2028 (USD Thousand)
TABLE 282 POLAND Dairy in Bioactive ingredient Market, By Applications, 2019-2028 (USD Thousand)
TABLE 283 POLAND Dairy Alternatives in Bioactive ingredient Market, By Applications, 2019-2028 (USD Thousand)
TABLE 284 POLAND Beverages in Bioactive ingredient Market, By Applications, 2019-2028 (USD Thousand)
TABLE 285 POLAND Bars in Bioactive ingredient Market, By Applications, 2019-2028 (USD Thousand)
TABLE 286 POLAND Animal Nutrition in Bioactive ingredient Market, By Applications, 2019-2028 (USD Thousand)
TABLE 287 POLAND Personal Care in Bioactive ingredient Market, By Applications, 2019-2028 (USD Thousand)
TABLE 288 POLAND Bioactive ingredient Market, By Source, 2019-2028 (USD Thousand)
TABLE 289 REST OF EUROPE Bioactive ingredient Market, By Ingredient Type, 2019-2028 (USD Thousand)
TABLE 290 REST OF EUROPE Bioactive ingredient Market, By Ingredient Type, 2019-2028 (Tons)
Abbildungsverzeichnis
FIGURE 1 EUROPE BIOACTIVE INGREDIENT MARKET: segmentation
FIGURE 2 EUROPE BIOACTIVE INGREDIENT MARKET: data triangulation
FIGURE 3 EUROPE BIOACTIVE INGREDIENT MARKET: DROC ANALYSIS
FIGURE 4 EUROPE BIOACTIVE INGREDIENT MARKET: Europe VS. regional MARKET analysis
FIGURE 5 EUROPE BIOACTIVE INGREDIENT MARKET: company research analysis
FIGURE 6 EUROPE BIOACTIVE INGREDIENT MARKET: THE Ingredient Type LIFE LINE CURVE
FIGURE 7 EUROPE BIOACTIVE INGREDIENT MARKET: MULTIVARIATE MODELLING
FIGURE 8 EUROPE BIOACTIVE INGREDIENT MARKET: INTERVIEW DEMOGRAPHICS
FIGURE 9 EUROPE BIOACTIVE INGREDIENT MARKET: DBMR MARKET POSITION GRID
FIGURE 10 EUROPE BIOACTIVE INGREDIENT MARKET: MARKET application COVERAGE GRID
FIGURE 11 EUROPE BIOACTIVE INGREDIENT MARKET: THE MARKET CHALLENGE MATRIX
FIGURE 12 EUROPE BIOACTIVE INGREDIENT MARKET: vendor share analysis
FIGURE 13 EUROPE BIOACTIVE INGREDIENT MARKET: SEGMENTATION
FIGURE 14 Rising demand of bioactive ingredients in functional foodIS DRIVING the EUROPE BIOACTIVE INGREDIENT MARKET in the forecast period of 2021 to 2028
FIGURE 15 peptide SEGMENT is expected to account for the largest share of the EUROPE BIOACTIVE INGREDIENT MARKET in 2021 & 2028
FIGURE 16 Figure 1 DRIVERS, RESTRAINTS, OPPORTUNITIES AND CHALLENGEs OF Europe Bioactive Ingredient MARKET
FIGURE 17 : DRUG USED FOR DIABETES (DOSAGE PER 1,000 INHABITANTS, PER DAY)
FIGURE 1 Europe bioactive ingredient MARKET: BY Ingredient Type, 2020
FIGURE 2 Europe bioactive ingredient MARKET: BY Applications, 2020
FIGURE 3 Europe bioactive ingredient MARKET: BY source, 2020
FIGURE 4 EUROPE bioactive ingredient market: SNAPSHOT (2020)
FIGURE 5 EUROPE BIOACTIVE INGREDIENT market: by COUNTRY (2020)
FIGURE 6 EUROPE BIOACTIVE INGREDIENT market: by COUNTRY (2021 & 2028)
FIGURE 7 EUROPE BIOACTIVE INGREDIENT market: by COUNTRY (2020 & 2028)
FIGURE 8 EUROPE BIOACTIVE INGREDIENT market: by Ingredient Type (2021-2028)
FIGURE 9 EUROPE BIOACTIVE INGREDIENT MARKET: company share 2020 (%)
Forschungsmethodik
Die Datenerfassung und Basisjahresanalyse werden mithilfe von Datenerfassungsmodulen mit großen Stichprobengrößen durchgeführt. Die Phase umfasst das Erhalten von Marktinformationen oder verwandten Daten aus verschiedenen Quellen und Strategien. Sie umfasst die Prüfung und Planung aller aus der Vergangenheit im Voraus erfassten Daten. Sie umfasst auch die Prüfung von Informationsinkonsistenzen, die in verschiedenen Informationsquellen auftreten. Die Marktdaten werden mithilfe von marktstatistischen und kohärenten Modellen analysiert und geschätzt. Darüber hinaus sind Marktanteilsanalyse und Schlüsseltrendanalyse die wichtigsten Erfolgsfaktoren im Marktbericht. Um mehr zu erfahren, fordern Sie bitte einen Analystenanruf an oder geben Sie Ihre Anfrage ein.
Die wichtigste Forschungsmethodik, die vom DBMR-Forschungsteam verwendet wird, ist die Datentriangulation, die Data Mining, die Analyse der Auswirkungen von Datenvariablen auf den Markt und die primäre (Branchenexperten-)Validierung umfasst. Zu den Datenmodellen gehören ein Lieferantenpositionierungsraster, eine Marktzeitlinienanalyse, ein Marktüberblick und -leitfaden, ein Firmenpositionierungsraster, eine Patentanalyse, eine Preisanalyse, eine Firmenmarktanteilsanalyse, Messstandards, eine globale versus eine regionale und Lieferantenanteilsanalyse. Um mehr über die Forschungsmethodik zu erfahren, senden Sie eine Anfrage an unsere Branchenexperten.
Anpassung möglich
Data Bridge Market Research ist ein führendes Unternehmen in der fortgeschrittenen formativen Forschung. Wir sind stolz darauf, unseren bestehenden und neuen Kunden Daten und Analysen zu bieten, die zu ihren Zielen passen. Der Bericht kann angepasst werden, um Preistrendanalysen von Zielmarken, Marktverständnis für zusätzliche Länder (fordern Sie die Länderliste an), Daten zu klinischen Studienergebnissen, Literaturübersicht, Analysen des Marktes für aufgearbeitete Produkte und Produktbasis einzuschließen. Marktanalysen von Zielkonkurrenten können von technologiebasierten Analysen bis hin zu Marktportfoliostrategien analysiert werden. Wir können so viele Wettbewerber hinzufügen, wie Sie Daten in dem von Ihnen gewünschten Format und Datenstil benötigen. Unser Analystenteam kann Ihnen auch Daten in groben Excel-Rohdateien und Pivot-Tabellen (Fact Book) bereitstellen oder Sie bei der Erstellung von Präsentationen aus den im Bericht verfügbaren Datensätzen unterstützen.