

Global Gene Synthesis Market
حجم السوق بالمليار دولار أمريكي
CAGR :
% 
 USD
3.25 Billion
USD
16.95 Billion
2024
2032
USD
3.25 Billion
USD
16.95 Billion
2024
2032
| 2025 –2032 | |
| USD 3.25 Billion | |
| USD 16.95 Billion | |
| % | |
|
السوق العالمية لتخليق الجينات، حسب المكون (الجهاز، والمواد الاستهلاكية، والبرمجيات والخدمات)، نوع الجين (الجين القياسي، والجين السريع، والجين المعقد وغيرها)، نوع تخليق الجينات (تخليق مكتبة الجينات، وتوليف الجينات المخصصة)، التطبيق (علم الأحياء الاصطناعي، والهندسة الوراثية، وتصميم اللقاحات، والأجسام المضادة العلاجية، وغيرها)، الطريقة (تخليق الطور الصلب، وتوليف الحمض النووي القائم على الشريحة، وتوليف الإنزيم القائم على تفاعل البوليميراز المتسلسل)، المستخدم النهائي (المعاهد الأكاديمية والبحثية، ومختبرات التشخيص، وشركات التكنولوجيا الحيوية والأدوية، وغيرها)، قناة التوزيع (العطاء المباشر، والتوزيع عبر الإنترنت، والموزعين من جهات خارجية) - اتجاهات الصناعة وتوقعاتها حتى عام 2031.
تحليل وحجم سوق تخليق الجينات
في مجال التكنولوجيا الحيوية الزراعية، تلعب سوق تخليق الجينات دورًا حيويًا في تعزيز سمات المحاصيل وتحسين الإنتاجية الزراعية. ومن خلال تخليق الجينات، يعمل الباحثون على هندسة التعديلات الجينية في المحاصيل لمنحها سمات مرغوبة مثل مقاومة الآفات، وتحمل الجفاف، وزيادة الغلة. وتتيح هذه التكنولوجيا تطوير محاصيل معدلة وراثيًا ذات سمات محسنة، ومعالجة التحديات مثل أمراض المحاصيل، والضغوط البيئية، وندرة الغذاء. كما يسهل تخليق الجينات الإدخال السريع والدقيق للجينات المفيدة في جينومات المحاصيل، مما يسرع عملية التربية وتمكين إنشاء محاصيل أكثر ملاءمة للاحتياجات الزراعية الحديثة.
على سبيل المثال،
وفقًا للمركز الوطني لبحوث الأحياء، فإن تطوير العديد من علامات الحمض النووي منذ تقديم تقنيات العلامات الجزيئية مثل RFLP وPCR في عام 1980 أحدث ثورة في أبحاث علم الأحياء. توفر علامات الحمض النووي مثل RAPD وSNP وAFLP وSRAP محتوى معلوماتيًا أكبر وتعدد أشكال مقارنة بالعلامات التقليدية. إنها أدوات متعددة الاستخدامات تُستخدم على نطاق واسع في التكنولوجيا الحيوية الزراعية لمهام مثل تحديد أصناف المحاصيل وحفظ وتقييم البلازما الجرثومية النباتية وتحليل التنوع الجيني والتطور وبناء الخرائط الجينية وتسهيل التربية بمساعدة العلامات الجزيئية.
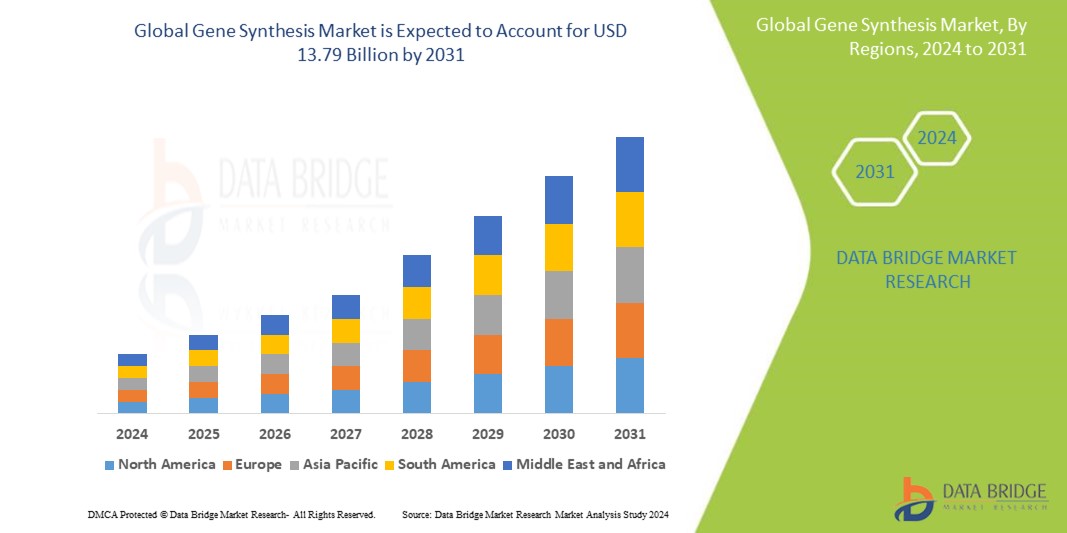
تم تقييم حجم سوق تخليق الجينات العالمي بنحو 2.65 مليار دولار أمريكي في عام 2023 ومن المتوقع أن يصل إلى 13.79 مليار دولار أمريكي بحلول عام 2031، مع معدل نمو سنوي مركب بنسبة 22.90٪ خلال الفترة المتوقعة من 2024 إلى 2031. بالإضافة إلى الرؤى حول سيناريوهات السوق مثل القيمة السوقية ومعدل النمو والتجزئة والتغطية الجغرافية واللاعبين الرئيسيين، فإن تقارير السوق التي تم تنظيمها بواسطة Data Bridge Market Research تتضمن أيضًا تحليل الخبراء المتعمق وعلم الأوبئة للمرضى وتحليل خطوط الأنابيب وتحليل الأسعار والإطار التنظيمي.
نطاق وتجزئة سوق تخليق الجينات
|
تقرير القياس |
تفاصيل |
|
فترة التنبؤ |
2024-2031 |
|
سنة الأساس |
2023 |
|
سنوات تاريخية |
2022 (قابلة للتخصيص حتى 2016-2021) |
|
وحدات كمية |
الإيرادات بالمليارات من الدولارات الأمريكية، الأحجام بالوحدات، التسعير بالدولار الأمريكي |
|
القطاعات المغطاة |
المكون (الجهاز، والمواد الاستهلاكية، والبرمجيات والخدمات)، نوع الجين (الجين القياسي، والجين السريع، والجين المعقد وغيرها)، نوع تخليق الجين (تخليق مكتبة الجينات، وتوليف الجينات المخصصة)، التطبيق ( علم الأحياء الاصطناعي ، والهندسة الوراثية، وتصميم اللقاحات، والأجسام المضادة العلاجية، وغيرها)، الطريقة (تخليق الطور الصلب، وتوليف الحمض النووي القائم على الشريحة، وتوليف الإنزيم القائم على تفاعل البوليميراز المتسلسل)، المستخدم النهائي (المعاهد الأكاديمية والبحثية، ومختبرات التشخيص، وشركات التكنولوجيا الحيوية والأدوية، وغيرها)، قناة التوزيع (العطاء المباشر، والتوزيع عبر الإنترنت، والموزعون من جهات خارجية) |
|
الدول المغطاة |
الولايات المتحدة وكندا والمكسيك في أمريكا الشمالية وألمانيا وفرنسا والمملكة المتحدة وهولندا وسويسرا وبلجيكا وروسيا وإيطاليا وإسبانيا وتركيا وبقية دول أوروبا في أوروبا والصين واليابان والهند وكوريا الجنوبية وسنغافورة وماليزيا وأستراليا وتايلاند وإندونيسيا والفلبين وبقية دول آسيا والمحيط الهادئ (APAC) في منطقة آسيا والمحيط الهادئ (APAC) والمملكة العربية السعودية والإمارات العربية المتحدة وجنوب أفريقيا ومصر وإسرائيل وبقية دول الشرق الأوسط وأفريقيا (MEA) كجزء من الشرق الأوسط وأفريقيا (MEA) والبرازيل والأرجنتين وبقية دول أمريكا الجنوبية كجزء من أمريكا الجنوبية |
|
الجهات الفاعلة في السوق المشمولة |
ATDBio Ltd (المملكة المتحدة)، General Biosystems, Inc. (الولايات المتحدة)، MACROGEN CO., LTD. (كوريا الجنوبية)، Boster Biological Technology (الولايات المتحدة)، Creative Biogene (الولايات المتحدة)، Bioneer Pacific (كوريا الجنوبية)، exonbio (الولايات المتحدة)، trenzyme GmbH (ألمانيا)، Twist Bioscience (الولايات المتحدة)، BioCat GmbH (ألمانيا)، OriGene Technologies, Inc. (الولايات المتحدة)، Integrated DNA Technologies, Inc. (الولايات المتحدة)، Eurofins Scientific (لوكسمبورج)، NZYTech (البرتغال)، Ansa Biotechnologies (الولايات المتحدة)، Thermo Fisher Scientific Inc. (الولايات المتحدة)، Genescript (الولايات المتحدة)، Synbio Technologies (الولايات المتحدة)، Proteogenix (فرنسا)، Bio Basic Inc. (كندا)، ATG:biosynthetics GmbH (ألمانيا)، Merck KGaA (ألمانيا)، Kaneka Eurogentec SA (بلجيكا)، Ginkgo Bioworks (الولايات المتحدة)، Evonetix (المملكة المتحدة)، ProMab (الولايات المتحدة)، GCC Biotech (الهند) Pvt. المحدودة (الهند) |
|
فرص السوق |
|
تعريف السوق
إن تخليق الجينات هو عملية إنشاء تسلسلات الحمض النووي بشكل مصطنع، وذلك باستخدام الطرق الكيميائية أو آلات تخليق الحمض النووي الآلية. وهو يسمح للباحثين بتصميم وإنتاج جزيئات الحمض النووي المخصصة بتسلسلات محددة، مما يتيح دراسة وظيفة الجينات، والتعبير عن البروتين، والهندسة الوراثية.
ديناميكيات سوق تخليق الجينات
السائقين
- يؤدي نمو تقنيات الحمض النووي المتكاملة إلى زيادة الطلب على خدمات تخليق الجينات
إن كتل جينات IDT عبارة عن شظايا DNA مخصصة تم تصنيعها وفقًا لمواصفات دقيقة، مما يوفر للباحثين أداة متعددة الاستخدامات لتطبيقات علم الأحياء الجزيئي. إن سمعة IDT في مجال التركيب عالي الجودة والموثوقية وقدرات التخصيص تجذب الباحثين من مختلف التخصصات، مما يغذي الطلب على خدمات تركيب الجينات. إن سهولة الطلب وأوقات التسليم السريعة والأسعار التنافسية لكتل جينات IDT تعزز جاذبيتها، مما يساهم في نمو السوق. وعلاوة على ذلك، فإن توافقها مع مجموعة واسعة من التطبيقات اللاحقة، بما في ذلك تفاعل البوليميراز المتسلسل والاستنساخ ودراسات التعبير الجيني، يعزز مكانتها كخيار مفضل بين الباحثين ويدفع توسع سوق تركيب الجينات.
على سبيل المثال،
في سبتمبر 2023، أعلنت شركة Integrated DNA Technologies (IDT) عن إطلاق منتجات xGen المصممة خصيصًا لشركة Ultima Genomics ، مما يمثل تقدمًا كبيرًا في سوق تخليق الجينات. تتماشى هذه الخطوة الاستراتيجية مع التزام IDT بالابتكار والتخصيص، وتلبية الاحتياجات المتطورة للباحثين في علم الأحياء الجزيئي. يؤكد تقديم منتجات xGen لشركة Ultima Genomics على تفاني IDT في تقديم حلول متطورة، مما يعزز مكانتها كمحرك رئيسي لنمو سوق تخليق الجينات. يمكن للباحثين الآن الاستفادة من هذه المنتجات المتخصصة لتحسين سير عمل علم الأحياء الجزيئي، وبالتالي تضخيم الطلب على خدمات تخليق الجينات من IDT والمساهمة في توسيع السوق.
- زيادة الأنشطة البحثية تعزز الجينات الاصطناعية في مجالات متنوعة
مع توسع جهود البحث في مجالات مثل المستحضرات الصيدلانية والزراعة والرعاية الصحية، تنشأ حاجة أكبر للمواد الجينية المخصصة لتطبيقات مختلفة، بما في ذلك تطوير الأدوية والهندسة الوراثية ونمذجة الأمراض. إن استكشاف وظائف الجينات الجديدة والمسارات والأهداف العلاجية يتطلب خدمات ومنتجات تخليق الجينات الفعّالة. يشهد السوق نموًا مدفوعًا بالسعي المستمر إلى حلول واكتشافات مبتكرة في التكنولوجيا الحيوية وعلوم الحياة، مما يدفع إلى تبني تقنيات تخليق الجينات.
على سبيل المثال،
إن تطوير المختبر لجهاز محسّن للتخليق المجزأ للأوليجونوكليوتيدات، كما ورد في تقرير المركز الوطني لبحوث البيولوجيا الجزيئية، يتماشى مع الأنشطة البحثية المتزايدة التي تدفع استخدام تخليق الجينات. يعد هذا الابتكار بتعزيز سرعة وكفاءة عمليات تخليق الجينات بشكل كبير. من خلال تخليق ما يصل إلى 100 تسلسل مختلف من الحمض النووي في وقت واحد باستخدام رقائق تفلون مسامية، يوفر الجهاز الجديد تغييرًا كبيرًا في قدرة التخليق، حيث يحقق كفاءة اقتران مماثلة للطرق الآلية الحالية مع استخدام عدد أقل بكثير من الكواشف. تؤكد مثل هذه التطورات على السعي المستمر نحو الابتكار في تقنيات تخليق الجينات، مما يساهم في نمو السوق وتبنيها.
فرص
- Rising Healthcare Expenditure Results in Increased Improving Patient Outcomes
As healthcare spending increases globally, there is a growing emphasis on precision medicine and personalized therapies, which often rely on custom-designed synthetic genes. Gene synthesis enables the development of tailored treatments for various diseases, including cancer and genetic disorders, driving its adoption in clinical research and therapeutics. Moreover, as healthcare systems seek cost-effective solutions and innovative approaches to address complex medical challenges and gene synthesis price, offers a promising avenue for advancing precision healthcare and improving patient outcomes.
- Expansion of Synthetic Biology Increasing Demand for Custom-Designed DNA Constructs
As synthetic biology techniques advance, there is an increasing demand for custom-designed DNA constructs and synthetic genes to enable the engineering of biological systems for various applications. This includes the development of novel therapeutics, sustainable bio-manufacturing processes, and agricultural improvements. Gene synthesis companies stand to benefit from this growing demand by providing tailored solutions to researchers and industries seeking to leverage synthetic biology for innovation and problem-solving. The flexibility and scalability of gene synthesis technologies position market players to capitalize on the expanding landscape of synthetic biology applications, driving further growth and opportunity in the gene synthesis market.
Restraints/Challenges
- High Competition within the Medical Technology Industry Limits the Adoption of Gene Synthesis Technology
As medical technology companies compete for market share and innovation, they may prioritize investment in other areas over gene synthesis research and development. This intense competition can limit the resources available to gene synthesis companies, hindering their ability to innovate, expand, and differentiate their offerings. Established players in the medical technology sector may have existing relationships and market dominance, making it challenging for gene synthesis companies to penetrate the market and gain traction. The gene synthesis market may face obstacles in achieving widespread adoption and growth amidst the competitive landscape of the medical technology industry.
- Complexity Technical Challenges Inherent in Gene Synthesis results in Achieving High-Quality
Despite advancements, issues such as error rates, sequence fidelity, and scalability persist, posing hurdles to widespread adoption. Achieving high-quality synthesized DNA sequences, especially for longer or complex sequences, requires sophisticated synthesis platforms and expertise, which may limit accessibility for smaller research institutions or companies. The need for stringent quality control measures to ensure accuracy and reliability further adds to the complexity and cost of gene synthesis services, hindering market growth and adoption in certain contexts.
This market report provides details of new recent developments, trade regulations, import-export analysis, production analysis, value chain optimization, market share, impact of domestic and localized market players, analyses opportunities in terms of emerging revenue pockets, changes in market regulations, strategic market growth analysis, market size, category market growths, application niches and dominance, product approvals, product launches, geographic expansions, technological innovations in the market. To gain more info on the market contact Data Bridge Market Research for an Analyst Brief, our team will help you take an informed market decision to achieve market growth.
Recent Developments
- In 2023, Twist Bioscience and Astellas initiated a collaborative effort in multitarget antibody discovery research, leveraging Twist's synthetic DNA technology to advance antibody development for therapeutic applications
- In 2022, GenScript collaborated with Avectas to enhance nonviral cell therapy manufacturing processes, aiming to streamline and improve the efficiency of cell therapy production, potentially leading to advancements in personalized medicine
- In 2020, Twist Bioscience expanded its product portfolio by introducing clonalready gene fragments, offering researchers versatile tools for gene cloning and expression studies. This innovation enhances efficiency in protein expression pathways, enzyme engineering, and gene expression research. Additionally, a study published in an ACS journal highlighted the pressing need for improved cancer coverage worldwide, with millions of new cases and deaths underscoring the urgency for enhanced cancer detection and treatment initiatives
Gene Synthesis Market Scope
The market is segmented into component, gene type, gene synthesis type, application, method, end user, and distribution channel. The growth amongst these segments will help you analyze meager growth segments in the industries and provide the users with a valuable market overview and market insights to make strategic decisions to identify core market applications.
Component
- Synthesizers
- Consumables
- Software and Services
Gene Type
- Standard Gene
- Express Gene
- Complex Gene
- Others
Gene Synthesis Type
- Gene Library Synthesis
- Custom gene Synthesis
Application
- Synthetic Biology
- Genetic Engineering,
- Vaccine Design
- Therapeutics Antibodies
- Others
Method
- Solid Based Synthesis
- Chip-Based DNA Synthesis
- PCR-Based Enzyme Synthesis
End User
- Academic and Research Institutes
- Diagnostics Laboratories
- Biotech and Pharmaceutical Companies
- Others
Distribution Channel
- Direct Tender
- Online Distribution
- Third party Distributors
Gene Synthesis Market Regional Analysis/Insights
The market is analyzed, and market size insights and trends are provided by the country, component, gene type, gene synthesis type, application, method, end user, and distribution channel, as referenced above.
The countries covered in the market report are U.S., Canada and Mexico in North America, Germany, France, U.K., Netherlands, Switzerland, Belgium, Russia, Italy, Spain, Turkey, Rest of Europe in Europe, China, Japan, India, South Korea, Singapore, Malaysia, Australia, Thailand, Indonesia, Philippines, Rest of Asia-Pacific (APAC) in the Asia-Pacific (APAC), Saudi Arabia, U.A.E, South Africa, Egypt, Israel, Rest of Middle East and Africa (MEA) as a part of Middle East and Africa (MEA), Brazil, Argentina and Rest of South America as part of South America.
North America dominates the gene synthesis market, both in terms of market share and revenue, a trend expected to persist into the foreseeable future. This dominance is fueled by a growing demand for robust verification and validation processes within gene synthesis, particularly within the region's thriving research and development landscape. The emphasis on stringent quality control measures and the rapid pace of scientific advancement further bolster the market's growth trajectory in North America.
The country section of the report also provides individual market impacting factors and changes in regulation in the market domestically that impacts the current and future trends of the market. Data points such as down-stream and upstream value chain analysis, technical trends and porter's five forces analysis, case studies are some of the pointers used to forecast the market scenario for individual countries. Also, the presence and availability of global brands and their challenges faced due to large or scarce competition from local and domestic brands, impact of domestic tariffs and trade routes are considered while providing forecast analysis of the country data.
Healthcare Infrastructure Growth Installed base and New Technology Penetration
The market also provides you with detailed market analysis for every country growth in healthcare expenditure for capital equipment, installed base of different kind of products for market, impact of technology using life line curves and changes in healthcare regulatory scenarios and their impact on the market. The data is available for historic period 2016-2021.
Competitive Landscape and Gene Synthesis Market Analysis
The market competitive landscape provides details by competitor. Details included are company overview, company financials, revenue generated, market potential, investment in research and development, new market initiatives, global presence, production sites and facilities, production capacities, company strengths and weaknesses, product launch, product width and breadth, application dominance. The above data points provided are only related to the companies' focus related to market.
Some of the major players operating in the market are:
- ATDBio Ltd (U.K.)
- General Biosystems, Inc. (U.S.)
- MACROGEN CO., LTD. (South Korea)
- Boster Biological Technology (U.S.)
- Creative Biogene (U.S.)
- Bioneer Pacific (South Korea)
- exonbio (U.S.)
- شركة ترينزيمي المحدودة (ألمانيا)
- تويست للعلوم البيولوجية (الولايات المتحدة)
- شركة بيوكات المحدودة (ألمانيا)
- شركة أوريجين تكنولوجيز (الولايات المتحدة)
- شركة تقنيات الحمض النووي المتكاملة (الولايات المتحدة)
- يوروفينس العلمية (لوكسمبورغ)
- NZYTech (البرتغال)
- أنسا للتكنولوجيا الحيوية (الولايات المتحدة)
- شركة ثيرمو فيشر العلمية (الولايات المتحدة)
- جينسكريبت (الولايات المتحدة)
- سينبيو تكنولوجيز (الولايات المتحدة)
- بروتيوجينيكس (فرنسا)
- شركة بيو بيسك المحدودة (كندا)
- ATG:biosynthetics GmbH (ألمانيا)
- ميرك كي جي ايه ايه (ألمانيا)
- كانيكا يوروجينتيك إس إيه (بلجيكا)
- جينكو بيووركس (الولايات المتحدة)
- إيفونتيكس (المملكة المتحدة)
- بروماب (الولايات المتحدة)
- شركة GCC Biotech (الهند) المحدودة (الهند)
- CSBio (الولايات المتحدة)
- أزينتا يو إس، المحدودة (الولايات المتحدة)
SKU-
احصل على إمكانية الوصول عبر الإنترنت إلى التقرير الخاص بأول سحابة استخبارات سوقية في العالم

- لوحة معلومات تحليل البيانات التفاعلية
- لوحة معلومات تحليل الشركة للفرص ذات إمكانات النمو العالية
- إمكانية وصول محلل الأبحاث للتخصيص والاستعلامات
- تحليل المنافسين باستخدام لوحة معلومات تفاعلية
- آخر الأخبار والتحديثات وتحليل الاتجاهات
- استغل قوة تحليل المعايير لتتبع المنافسين بشكل شامل
Table of Content
- introduction
- OBJECTIVES OF THE STUDY
- MARKET DEFINITION
- OVERVIEW of GLOBAL gene synthesis MARKET
- LIMITATIONs
- MARKETS COVERED
- MARKET SEGMENTATION
- MARKETS COVERED
- geographical scope
- years considered for the study
- currency and pricing
- DBMR TRIPOD DATA VALIDATION MODEL
- MULTIVARIATE MODELLING
- product & services LIFELINE CURVE
- primary interviews with key opinion leaders
- DBMR MARKET POSITION GRID
- MARKET APPLICATION COVERAGE GRID
- vendor share analysis
- secondary sourcEs
- assumptions
- EXECUTIVE SUMMARY
- GLOBAL GENE SYNTHESIS MARKET: REGULATIONS
- OTHER STANDARD REGULATIONS IMPLEMENTED WORLDWIDE
- REGULATIONS RELATED TO BIODIVERSITY WHILE USING SYNTHETIC BIOLOGY
- Market Overview
- Drivers
- rising prevalEnce of chronic infectious diseaseS
- rising adoption of gene therapy
- growing interest of gene synthesis in THE field of molecular biology
- favorable government initiatives
- expanding field of synthetic biology
- restraints
- ethical issues associated with genetic engineering
- threat imposed to ecosystem and biodiversity
- lack of trained professionals
- technical limitation across production process
- opportunities
- increased funding towards genomics
- technolOgical advancements
- increasing demand of personalized medicines
- challenges
- long approval process
- lack of well defined patent system
- IMPACT OF COVID-19 ON THE GLOBAL GENE SYNTHESIS MARKET
- Impact ON SUPPLY CHAIN
- IMPACT ON DEMAND
- STRATEGIC DECISION FOR MANUFACTURERS
- Conclusion
- global Gene synthesis MARKET, BY product & services
- overview
- software & services
- consumbles
- Reagents
- Assays
- Probes & Dyes
- Others
- synthesizer
- Column-Based Synthesizers
- Microarray-Based Synthesizers
- global Gene synthesis MARKET, BY gene type
- overview
- standard gene
- complex gene
- express gene
- others
- global Gene synthesis MARKET, BY product type
- overview
- CUSTOM GENE SYNTHESIS
- GENE LIBRARY SYNTHESIS
- global Gene synthesis MARKET, BY application
- overview
- synthetic biology
- genetic engineering
- therapeutic antibodies
- vaccine design
- others
- global Gene synthesis MARKET, BY method
- overview
- pcr based enzyme synthesis
- chip based dna synthesis
- solid based synthesis
- global Gene synthesis MARKET, BY end user
- OVERVIEW
- academic & research institute
- biotech & pharmaceutical companies
- diagnostic laboratories
- others
- global Gene synthesis MARKET, BY distribution channel
- overview
- direct tender
- online distribution
- third party distributors
- Global Gene Synthesis Market by geography
- overview
- NORTH AMERICA
- U.S.
- Canada
- Mexico
- EUROPE
- GERMANY
- U.K.
- ITALY
- SPAIN
- FRANCE
- NETHERLANDS
- RUSSIA
- SWITZERLAND
- TURKEY
- BELGIUM
- IRELAND
- REST OF EUROPE
- ASIA-PACIFIC
- China
- japan
- India
- South KOrea
- Australia
- Singapore
- Malaysia
- Thailand
- Indonesia
- Philippines
- Rest of Asia-Pacific
- SOUTH AMERICA
- BRAZIL
- ARGENTINA
- REST OF SOUTH AMERICA
- MIDDLE EAST AND AFRICA
- SAUDI ARAB
- SOUTH AFRICA
- UAE
- ISRAEL
- EGYPT
- REST OF MIDDLE EAST AND AFRICA
- Global Gene Synthesis Market, COMPANY landscape
- company share analysis: global
- company share analysis: north america
- company share analysis: europe
- company share analysis: Asia-Pacific
- swot analysis
- company profile
- Integrated DNA Technologies, Inc. (A Subsidiary of Danaher)
- COMPANY SNAPSHOT
- REVENUE ANALYSIS
- COMPANY SHARE ANALYSIS
- PRODUCT PORTFOLIO
- RECENT DEVELOPMENTS
- THERMO FISHER SCIENTIFIC INC.
- COMPANY SNAPSHOT
- REVENUE ANALYSIS
- COMPANY SHARE ANALYSIS
- PRODUCT PORTFOLIO
- RECENT DEVELOPMENTS
- MERCK KGAA
- COMPANY SNAPSHOT
- REVENUE ANALYSIS
- COMPANY SHARE ANALYSIS
- PRODUCT PORTFOLIO
- RECENT DEVELOPMENTS
- Eurofins Scientific
- COMPANY SNAPSHOT
- REVENUE ANALYSIS
- COMPANY SHARE ANALYSIS
- SERVICE PORTFOLIO
- RECENT DEVELOPMENT
- Bio Basic Inc.
- COMPANY SNAPSHOT
- PRODUCT PORTFOLIO
- RECENT DEVELOPMENTS
- KANEKA EUROGENTEC S.A.
- COMPANY SNAPSHOT
- PRODUCT PORTFOLIO
- RECENT DEVELOPMENTS
- GENEWIZ (a subsidiary of Brooks Automation, Inc.)
- COMPANY SNAPSHOT
- REVENUE ANALYSIS
- SERVICE PORTFOLIO
- RECENT DEVELOPMENTS
- LGC LIMITED
- COMPANY SNAPSHOT
- PRODUCT PORTFOLIO
- RECENT DEVELOPMENTS
- Creative Biogene
- COMPANY SNAPSHOT
- SERVICE PORTFOLIO
- RECENT DEVELOPMENT
- GenScript
- COMPANY SNAPSHOT
- REVENUE ANALYSIS
- REAGENT SERVICE PORTFOLIO
- RECENT DEVELOPMENT
- Codex DNA, Inc.
- COMPANY SNAPSHOT
- PRODUCT PORTFOLIO
- RECENT DEVELOPMENTS
- BBI-LIFESCIENCES
- COMPANY SNAPSHOT
- REVENUE ANALYSIS
- PRODUCT PORTFOLIO
- RECENT DEVELOPMENT
- Aldevron
- COMPANY SNAPSHOT
- PRODUCT PORTFOLIO
- RECENT DEVELOPMENTS
- ATUM
- COMPANY SNAPSHOT
- SERVICE PORTFOLIO
- RECENT DEVELOPMENTS
- Twist Bioscience
- COMPANY SNAPSHOT
- REVENUE ANALYSIS
- PRODUCT PORTFOLIO
- RECENT DEVELOPMENTS
- BioCat GmbH
- COMPANY SNAPSHOT
- PRODUCT PORTFOLIO
- RECENT DEVELOPMENT
- ATG:biosynthetics GmbH
- COMPANY SNAPSHOT
- PRODUCT PORTFOLIO
- RECENT DEVELOPMENT
- Evonetix
- COMPANY SNAPSHOT
- PLATFORM PORTFOLIO
- RECENT DEVELOPMENTS
- exonbio
- COMPANY SNAPSHOT
- SERVICE PORTFOLIO
- RECENT DEVELOPMENT
- trenzyme GmbH
- COMPANY SNAPSHOT
- SERVICE PORTFOLIO
- RECENT DEVELOPMENT
- questionnaire
- related reports
List of Table
TABLE 1 Global Gene Synthesis Market, By Product & Services, 2019-2028 (USD Million)
TABLE 2 Global Software & Services in Gene Synthesis Market, By Product & Services, 2019-2028 (USD Million)
TABLE 3 Global Consumables in Gene Synthesis Market, By Product & Services, 2019-2028 (USD Million)
TABLE 4 Global Consumables in Gene Synthesis Market, By Product & Services 2019-2028 (USD Million)
TABLE 5 Global Synthesizer in Gene Synthesis Market, By Product & Services, 2019-2028 (USD Million)
TABLE 6 Global Synthesizer in Gene Synthesis Market, By Product & Services 2019-2028 (USD Million)
TABLE 7 Global Gene Synthesis Market, By Gene Type, 2019-2028 (USD Million)
TABLE 8 Global Standard Gene in Gene Synthesis Market, By Gene Type, 2019-2028 (USD Million)
TABLE 9 Global Complex Gene in Gene Synthesis Market, By Gene Type, 2019-2028 (USD Million)
TABLE 10 Global Express Gene in Gene Synthesis Market, By Gene Type, 2019-2028 (USD Million)
TABLE 11 Global Others in Gene Synthesis Market, By Gene Type, 2019-2028 (USD Million)
TABLE 12 Global Gene Synthesis Market, By Product Type, 2019-2028 (USD Million)
TABLE 13 Global Custom Gene Synthesis in Gene Synthesis Market, By Product Type, 2019-2028 (USD Million)
TABLE 14 Global Gene Library Synthesis in Gene Synthesis Market, By Product Type, 2019-2028 (USD Million)
TABLE 15 Global Gene Synthesis Market, By Application, 2019-2028 (USD Million)
TABLE 16 Global Synthetic Biology in Gene Synthesis Market, By Application, 2019-2028 (USD Million)
TABLE 17 Global Genetic Engineering in Gene Synthesis Market, By Application, 2019-2028 (USD Million)
TABLE 18 Global Therapeutic Antibodies in Gene Synthesis Market, By Application, 2019-2028 (USD Million)
TABLE 19 Global Vaccine Design in Gene Synthesis Market, By Application, 2019-2028 (USD Million)
TABLE 20 Global Others in Gene Synthesis Market, By Application, 2019-2028 (USD Million)
TABLE 21 globaL Gene synthesis Market, By method, 2017-2028 (USD Million)
TABLE 22 globaL pcr based enzyme synthesis in Gene synthesis Market, By Region, 2017-2028 (USD Million)
TABLE 23 globaL chip based dna synthesis in Gene synthesis Market, By Region, 2017-2028 (USD Million)
TABLE 24 globaL solid pahse synthesis in Gene synthesis Market, By Region, 2017-2028 (USD Million)
TABLE 25 globaL Gene synthesis Market, By end user, 2017-2028 (USD Million)
TABLE 26 globaL academic & research institute in Gene synthesis Market, By Region, 2017-2028 (USD Million)
TABLE 27 globaL Biotech & pharmaceutical companies in Gene synthesis Market, By Region, 2017-2028 (USD Million)
TABLE 28 globaL diagnostic laboratory in Gene synthesis Market, By Region, 2017-2028 (USD Million)
TABLE 29 globaL others in Gene synthesis Market, By Region, 2017-2028 (USD Million)
TABLE 30 globaL Gene synthesis Market, By distribution channel, 2017-2028 (USD Million)
TABLE 31 globaL direct tender in Gene synthesis Market, By Region, 2017-2028 (USD Million)
TABLE 32 globaL online distribution in Gene synthesis Market, By Region, 2017-2028 (USD Million)
TABLE 33 globaL third party distributor in Gene synthesis Market, By Region, 2017-2028 (USD Million)
TABLE 34 GLOBAL Gene SynthesisMARKET, BY REGION , 2021-2028 (USD MILLION)
TABLE 35 North AMERICA GENE SYNTHESIS MARKET, By Region, 2019-2028 (USD Million)
TABLE 36 NORTH AMERICA GENE SYNTHESIS MARKET, By Product & sERVICES, 2019-2028 (USD Million)
TABLE 37 NORTH AMERICA CONSUMABLES IN GENE SYNTHESIS MARKET, By PRODUCTS & SERVICES 2019-2028 (USD Million)
TABLE 38 NORTH AMERICA SYNTHESIZER in GENE SYNTHESIS MARKET, By PRODUCTS & SERVICES, 2019-2028 (USD Million)
TABLE 39 NORTH AMERICA GENE SYNTHESIS MARKET, By GENE TYPE, 2019-2028 (USD Million)
TABLE 40 NORTH AMERICA GENE SYNTHESIS MARKET, By PRODUCT TYPE, 2019-2028 (USD Million)
TABLE 41 NORTH AMERICA GENE SYNTHESIS MARKET, By APPLICATION, 2019-2028 (USD Million)
TABLE 42 NORTH AMERICA GENE SYNTHESIS MARKET, By METHOD, 2019-2028 (USD Million)
TABLE 43 NORTH AMERICA GENE SYNTHESIS MARKET, By END USER, 2019-2028 (USD Million)
TABLE 44 NORTH AMERICA GENE SYNTHESIS MARKET, By DISTRIBUTION CHANNEL, 2019-2028 (USD Million)
TABLE 45 U.S. GENE SYNTHESIS MARKET, By Product & sERVICES, 2019-2028 (USD Million)
TABLE 46 U.S. CONSUMABLES IN GENE SYNTHESIS MARKET, By PRODUCTS & SERVICES 2019-2028 (USD Million)
TABLE 47 U.S. SYNTHESIZER in GENE SYNTHESIS MARKET, By PRODUCTS & SERVICES, 2019-2028 (USD Million)
TABLE 48 U.S. GENE SYNTHESIS MARKET, By GENE TYPE, 2019-2028 (USD Million)
TABLE 49 U.S. GENE SYNTHESIS MARKET, By PRODUCT TYPE, 2019-2028 (USD Million)
TABLE 50 U.S. GENE SYNTHESIS MARKET, By APPLICATION, 2019-2028 (USD Million)
TABLE 51 U.S. GENE SYNTHESIS MARKET, By METHOD, 2019-2028 (USD Million)
TABLE 52 U.S. GENE SYNTHESIS MARKET, By END USER, 2019-2028 (USD Million)
TABLE 53 U.S. GENE SYNTHESIS MARKET, By DISTRIBUTION CHANNEL, 2019-2028 (USD Million)
TABLE 54 CANADA GENE SYNTHESIS MARKET, By Product & sERVICES, 2019-2028 (USD Million)
TABLE 55 CANADA CONSUMABLES IN GENE SYNTHESIS MARKET, By PRODUCTS & SERVICES 2019-2028 (USD Million)
TABLE 56 CANADA SYNTHESIZER in GENE SYNTHESIS MARKET, By PRODUCTS & SERVICES, 2019-2028 (USD Million)
TABLE 57 CANADA GENE SYNTHESIS MARKET, By GENE TYPE, 2019-2028 (USD Million)
TABLE 58 CANADA GENE SYNTHESIS MARKET, By PRODUCT TYPE, 2019-2028 (USD Million)
TABLE 59 CANADA GENE SYNTHESIS MARKET, By APPLICATION, 2019-2028 (USD Million)
TABLE 60 CANADA GENE SYNTHESIS MARKET, By METHOD, 2019-2028 (USD Million)
TABLE 61 CANADA GENE SYNTHESIS MARKET, By END USER, 2019-2028 (USD Million)
TABLE 62 CANADA GENE SYNTHESIS MARKET, By DISTRIBUTION CHANNEL, 2019-2028 (USD Million)
TABLE 63 MEXICO GENE SYNTHESIS MARKET, By Product & sERVICES, 2019-2028 (USD Million)
TABLE 64 MEXICO CONSUMABLES IN GENE SYNTHESIS MARKET, By PRODUCTS & SERVICES 2019-2028 (USD Million)
TABLE 65 MEXICO SYNTHESIZER in GENE SYNTHESIS MARKET, By PRODUCTS & SERVICES, 2019-2028 (USD Million)
TABLE 66 MEXICO GENE SYNTHESIS MARKET, By GENE TYPE, 2019-2028 (USD Million)
TABLE 67 MEXICO GENE SYNTHESIS MARKET, By PRODUCT TYPE, 2019-2028 (USD Million)
TABLE 68 MEXICO GENE SYNTHESIS MARKET, By APPLICATION, 2019-2028 (USD Million)
TABLE 69 MEXICO GENE SYNTHESIS MARKET, By METHOD, 2019-2028 (USD Million)
TABLE 70 MEXICO GENE SYNTHESIS MARKET, By END USER, 2019-2028 (USD Million)
TABLE 71 MEXICO GENE SYNTHESIS MARKET, By DISTRIBUTION CHANNEL, 2019-2028 (USD Million)
TABLE 72 Europe Gene synthesis Market, By Region, 2019-2028 (USD Million)
TABLE 73 Europe Gene Synthesis Market, By Product & Services, 2019-2028 (USD Million)
TABLE 74 Europe Consumables in Gene Synthesis Market, By Product & Services 2019-2028 (USD Million)
TABLE 75 Europe Synthesizer in Gene Synthesis Market, By Product & Services 2019-2028 (USD Million)
TABLE 76 Europe Gene Synthesis Market, By Gene Type, 2019-2028 (USD Million)
TABLE 77 Europe Gene Synthesis Market, By Product Type, 2019-2028 (USD Million)
TABLE 78 Europe Gene Synthesis Market, By Application, 2019-2028 (USD Million)
TABLE 79 Europe Gene Synthesis Market, By Method, 2019-2028 (USD Million)
TABLE 80 Europe Gene Synthesis Market, By End User, 2019-2028 (USD Million)
TABLE 81 Europe Gene Synthesis Market, By Distribution Channel, 2019-2028 (USD Million)
TABLE 82 Germany Gene Synthesis Market, By Product & Services, 2019-2028 (USD Million)
TABLE 83 Germany Consumables in Gene Synthesis Market, By Product & Services 2019-2028 (USD Million)
TABLE 84 Germany Synthesizer in Gene Synthesis Market, By Product & Services 2019-2028 (USD Million)
TABLE 85 Germany Gene Synthesis Market, By Gene Type, 2019-2028 (USD Million)
TABLE 86 Germany Gene Synthesis Market, By Product Type, 2019-2028 (USD Million)
TABLE 87 Germany Gene Synthesis Market, By Application, 2019-2028 (USD Million)
TABLE 88 Germany Gene Synthesis Market, By Method, 2019-2028 (USD Million)
TABLE 89 Germany Gene Synthesis Market, By End User, 2019-2028 (USD Million)
TABLE 90 Germany Gene Synthesis Market, By Distribution Channel, 2019-2028 (USD Million)
TABLE 91 U.K Gene Synthesis Market, By Product & Services, 2019-2028 (USD Million)
TABLE 92 U.K Consumables in Gene Synthesis Market, By Product & Services 2019-2028 (USD Million)
TABLE 93 U.K Synthesizer in Gene Synthesis Market, By Product & Services 2019-2028 (USD Million)
TABLE 94 U.K Gene Synthesis Market, By Gene Type, 2019-2028 (USD Million)
TABLE 95 U.K Gene Synthesis Market, By Product Type, 2019-2028 (USD Million)
TABLE 96 U.K Gene Synthesis Market, By Application, 2019-2028 (USD Million)
TABLE 97 U.K Gene Synthesis Market, By Method, 2019-2028 (USD Million)
TABLE 98 U.K Gene Synthesis Market, By End User, 2019-2028 (USD Million)
TABLE 99 U.K Gene Synthesis Market, By Distribution Channel, 2019-2028 (USD Million)
TABLE 100 ITALY Gene Synthesis Market, By Product & Services, 2019-2028 (USD Million)
TABLE 101 ITALY Consumables in Gene Synthesis Market, By Product & Services 2019-2028 (USD Million)
TABLE 102 ITALY Synthesizer in Gene Synthesis Market, By Product & Services 2019-2028 (USD Million)
TABLE 103 ITALY Gene Synthesis Market, By Gene Type, 2019-2028 (USD Million)
TABLE 104 ITALY Gene Synthesis Market, By Product Type, 2019-2028 (USD Million)
TABLE 105 ITALY Gene Synthesis Market, By Application, 2019-2028 (USD Million)
TABLE 106 ITALY Gene Synthesis Market, By Method, 2019-2028 (USD Million)
TABLE 107 ITALY Gene Synthesis Market, By End User, 2019-2028 (USD Million)
TABLE 108 ITALY Gene Synthesis Market, By Distribution Channel, 2019-2028 (USD Million)
TABLE 109 SPAIN Gene Synthesis Market, By Product & Services, 2019-2028 (USD Million)
TABLE 110 SPAIN Consumables in Gene Synthesis Market, By Product & Services 2019-2028 (USD Million)
TABLE 111 SPAIN Synthesizer in Gene Synthesis Market, By Product & Services 2019-2028 (USD Million)
TABLE 112 SPAIN Gene Synthesis Market, By Gene Type, 2019-2028 (USD Million)
TABLE 113 SPAIN Gene Synthesis Market, By Product Type, 2019-2028 (USD Million)
TABLE 114 SPAIN Gene Synthesis Market, By Application, 2019-2028 (USD Million)
TABLE 115 SPAIN Gene Synthesis Market, By Method, 2019-2028 (USD Million)
TABLE 116 SPAIN Gene Synthesis Market, By End User, 2019-2028 (USD Million)
TABLE 117 SPAIN Gene Synthesis Market, By Distribution Channel, 2019-2028 (USD Million)
TABLE 118 FRANCE Gene Synthesis Market, By Product & Services, 2019-2028 (USD Million)
TABLE 119 FRANCE Consumables in Gene Synthesis Market, By Product & Services 2019-2028 (USD Million)
TABLE 120 FRANCE Synthesizer in Gene Synthesis Market, By Product & Services 2019-2028 (USD Million)
TABLE 121 FRANCE Gene Synthesis Market, By Gene Type, 2019-2028 (USD Million)
TABLE 122 FRANCE Gene Synthesis Market, By Product Type, 2019-2028 (USD Million)
TABLE 123 FRANCE Gene Synthesis Market, By Application, 2019-2028 (USD Million)
TABLE 124 FRANCE Gene Synthesis Market, By Method, 2019-2028 (USD Million)
TABLE 125 FRANCE Gene Synthesis Market, By End User, 2019-2028 (USD Million)
TABLE 126 FRANCE Gene Synthesis Market, By Distribution Channel, 2019-2028 (USD Million)
TABLE 127 NETHERLANDS Gene Synthesis Market, By Product & Services, 2019-2028 (USD Million)
TABLE 128 NETHERLANDS Consumables in Gene Synthesis Market, By Product & Services 2019-2028 (USD Million)
TABLE 129 NETHERLANDS Synthesizer in Gene Synthesis Market, By Product & Services 2019-2028 (USD Million)
TABLE 130 NETHERLANDS Gene Synthesis Market, By Gene Type, 2019-2028 (USD Million)
TABLE 131 NETHERLANDS Gene Synthesis Market, By Product Type, 2019-2028 (USD Million)
TABLE 132 NETHERLANDS Gene Synthesis Market, By Application, 2019-2028 (USD Million)
TABLE 133 NETHERLANDS Gene Synthesis Market, By Method, 2019-2028 (USD Million)
TABLE 134 NETHERLANDS Gene Synthesis Market, By End User, 2019-2028 (USD Million)
TABLE 135 NETHERLANDS Gene Synthesis Market, By Distribution Channel, 2019-2028 (USD Million)
TABLE 136 RUSSIA Gene Synthesis Market, By Product & Services, 2019-2028 (USD Million)
TABLE 137 RUSSIA Consumables in Gene Synthesis Market, By Product & Services 2019-2028 (USD Million)
TABLE 138 RUSSIA Synthesizer in Gene Synthesis Market, By Product & Services 2019-2028 (USD Million)
TABLE 139 RUSSIA Gene Synthesis Market, By Gene Type, 2019-2028 (USD Million)
TABLE 140 RUSSIA Gene Synthesis Market, By Product Type, 2019-2028 (USD Million)
TABLE 141 RUSSIA Gene Synthesis Market, By Application, 2019-2028 (USD Million)
TABLE 142 RUSSIA Gene Synthesis Market, By Method, 2019-2028 (USD Million)
TABLE 143 RUSSIA Gene Synthesis Market, By End User, 2019-2028 (USD Million)
TABLE 144 RUSSIA Gene Synthesis Market, By Distribution Channel, 2019-2028 (USD Million)
TABLE 145 SWITZERLAND Gene Synthesis Market, By Product & Services, 2019-2028 (USD Million)
TABLE 146 SWITZERLAND Consumables in Gene Synthesis Market, By Product & Services 2019-2028 (USD Million)
TABLE 147 SWITZERLAND Synthesizer in Gene Synthesis Market, By Product & Services 2019-2028 (USD Million)
TABLE 148 SWITZERLAND Gene Synthesis Market, By Gene Type, 2019-2028 (USD Million)
TABLE 149 SWITZERLAND Gene Synthesis Market, By Product Type, 2019-2028 (USD Million)
TABLE 150 SWITZERLAND Gene Synthesis Market, By Application, 2019-2028 (USD Million)
TABLE 151 SWITZERLAND Gene Synthesis Market, By Method, 2019-2028 (USD Million)
TABLE 152 SWITZERLAND Gene Synthesis Market, By End User, 2019-2028 (USD Million)
TABLE 153 SWITZERLAND Gene Synthesis Market, By Distribution Channel, 2019-2028 (USD Million)
TABLE 154 TURKEY Gene Synthesis Market, By Product & Services, 2019-2028 (USD Million)
TABLE 155 TURKEY Consumables in Gene Synthesis Market, By Product & Services 2019-2028 (USD Million)
TABLE 156 TURKEY Synthesizer in Gene Synthesis Market, By Product & Services 2019-2028 (USD Million)
TABLE 157 TURKEY Gene Synthesis Market, By Gene Type, 2019-2028 (USD Million)
TABLE 158 TURKEY Gene Synthesis Market, By Product Type, 2019-2028 (USD Million)
TABLE 159 TURKEY Gene Synthesis Market, By Application, 2019-2028 (USD Million)
TABLE 160 TURKEY Gene Synthesis Market, By Method, 2019-2028 (USD Million)
TABLE 161 TURKEY Gene Synthesis Market, By End User, 2019-2028 (USD Million)
TABLE 162 TURKEY Gene Synthesis Market, By Distribution Channel, 2019-2028 (USD Million)
TABLE 163 BELGIUM Gene Synthesis Market, By Product & Services, 2019-2028 (USD Million)
TABLE 164 BELGIUM Consumables in Gene Synthesis Market, By Product & Services 2019-2028 (USD Million)
TABLE 165 BELGIUM Synthesizer in Gene Synthesis Market, By Product & Services 2019-2028 (USD Million)
TABLE 166 BELGIUM Gene Synthesis Market, By Gene Type, 2019-2028 (USD Million)
TABLE 167 BELGIUM Gene Synthesis Market, By Product Type, 2019-2028 (USD Million)
TABLE 168 BELGIUM Gene Synthesis Market, By Application, 2019-2028 (USD Million)
TABLE 169 BELGIUM Gene Synthesis Market, By Method, 2019-2028 (USD Million)
TABLE 170 BELGIUM Gene Synthesis Market, By End User, 2019-2028 (USD Million)
TABLE 171 BELGIUM Gene Synthesis Market, By Distribution Channel, 2019-2028 (USD Million)
TABLE 172 IRELAND Gene Synthesis Market, By Product & Services, 2019-2028 (USD Million)
TABLE 173 IRELAND Consumables in Gene Synthesis Market, By Product & Services 2019-2028 (USD Million)
TABLE 174 IRELAND Synthesizer in Gene Synthesis Market, By Product & Services 2019-2028 (USD Million)
TABLE 175 IRELAND Gene Synthesis Market, By Gene Type, 2019-2028 (USD Million)
TABLE 176 IRELAND Gene Synthesis Market, By Product Type, 2019-2028 (USD Million)
TABLE 177 IRELAND Gene Synthesis Market, By Application, 2019-2028 (USD Million)
TABLE 178 IRELAND Gene Synthesis Market, By Method, 2019-2028 (USD Million)
TABLE 179 IRELAND Gene Synthesis Market, By End User, 2019-2028 (USD Million)
TABLE 180 IRELAND Gene Synthesis Market, By Distribution Channel, 2019-2028 (USD Million)
TABLE 181 Rest of Europe Gene Synthesis Market, By Product & Services, 2019-2028 (USD Million)
TABLE 182 Asia-Pacific GENE SYNTHESIS MARKET, By Region, 2019-2028 (USD Million)
TABLE 183 ASIA-PACIFIC GENE SYNTHESIS MARKET, By Product & sERVICES, 2019-2028 (USD Million)
TABLE 184 ASIA-PACIFIC CONSUMABLES IN GENE SYNTHESIS MARKET, By PRODUCTS & SERVICES 2019-2028 (USD Million)
TABLE 185 ASIA-PACIFIC SYNTHESIZER in GENE SYNTHESIS MARKET, By PRODUCTS & SERVICES, 2019-2028 (USD Million)
TABLE 186 ASIA-PACIFIC GENE SYNTHESIS MARKET, By GENE TYPE, 2019-2028 (USD Million)
TABLE 187 ASIA-PACIFIC GENE SYNTHESIS MARKET, By PRODUCT TYPE, 2019-2028 (USD Million)
TABLE 188 ASIA-PACIFIC GENE SYNTHESIS MARKET, By APPLICATION, 2019-2028 (USD Million)
TABLE 189 ASIA-PACIFIC GENE SYNTHESIS MARKET, By METHOD, 2019-2028 (USD Million)
TABLE 190 ASIA-PACIFIC GENE SYNTHESIS MARKET, By END USER, 2019-2028 (USD Million)
TABLE 191 ASIA-PACIFIC GENE SYNTHESIS MARKET, By DISTRIBUTION CHANNEL, 2019-2028 (USD Million)
TABLE 192 CHINA GENE SYNTHESIS MARKET, By Product & sERVICES, 2019-2028 (USD Million)
TABLE 193 CHINA CONSUMABLES IN GENE SYNTHESIS MARKET, By PRODUCTS & SERVICES 2019-2028 (USD Million)
TABLE 194 CHINA SYNTHESIZER in GENE SYNTHESIS MARKET, By PRODUCTS & SERVICES, 2019-2028 (USD Million)
TABLE 195 CHINA GENE SYNTHESIS MARKET, By GENE TYPE, 2019-2028 (USD Million)
TABLE 196 CHINA GENE SYNTHESIS MARKET, By PRODUCT TYPE, 2019-2028 (USD Million)
TABLE 197 CHINA GENE SYNTHESIS MARKET, By APPLICATION, 2019-2028 (USD Million)
TABLE 198 CHINA GENE SYNTHESIS MARKET, By METHOD, 2019-2028 (USD Million)
TABLE 199 CHINA GENE SYNTHESIS MARKET, By END USER, 2019-2028 (USD Million)
TABLE 200 CHINA GENE SYNTHESIS MARKET, By DISTRIBUTION CHANNEL, 2019-2028 (USD Million)
TABLE 201 JAPAN GENE SYNTHESIS MARKET, By Product & sERVICES, 2019-2028 (USD Million)
TABLE 202 JAPAN CONSUMABLES IN GENE SYNTHESIS MARKET, By PRODUCTS & SERVICES 2019-2028 (USD Million)
TABLE 203 JAPAN SYNTHESIZER in GENE SYNTHESIS MARKET, By PRODUCTS & SERVICES, 2019-2028 (USD Million)
TABLE 204 JAPAN GENE SYNTHESIS MARKET, By GENE TYPE, 2019-2028 (USD Million)
TABLE 205 JAPAN GENE SYNTHESIS MARKET, By PRODUCT TYPE, 2019-2028 (USD Million)
TABLE 206 JAPAN GENE SYNTHESIS MARKET, By APPLICATION, 2019-2028 (USD Million)
TABLE 207 JAPAN GENE SYNTHESIS MARKET, By METHOD, 2019-2028 (USD Million)
TABLE 208 JAPAN GENE SYNTHESIS MARKET, By END USER, 2019-2028 (USD Million)
TABLE 209 JAPAN GENE SYNTHESIS MARKET, By DISTRIBUTION CHANNEL, 2019-2028 (USD Million)
TABLE 210 INDIA GENE SYNTHESIS MARKET, By Product & sERVICES, 2019-2028 (USD Million)
TABLE 211 INDIA CONSUMABLES IN GENE SYNTHESIS MARKET, By PRODUCTS & SERVICES 2019-2028 (USD Million)
TABLE 212 INDIA SYNTHESIZER in GENE SYNTHESIS MARKET, By PRODUCTS & SERVICES, 2019-2028 (USD Million)
TABLE 213 INDIA GENE SYNTHESIS MARKET, By GENE TYPE, 2019-2028 (USD Million)
TABLE 214 INDIA GENE SYNTHESIS MARKET, By PRODUCT TYPE, 2019-2028 (USD Million)
TABLE 215 INDIA GENE SYNTHESIS MARKET, By APPLICATION, 2019-2028 (USD Million)
TABLE 216 INDIA GENE SYNTHESIS MARKET, By METHOD, 2019-2028 (USD Million)
TABLE 217 INDIA GENE SYNTHESIS MARKET, By END USER, 2019-2028 (USD Million)
TABLE 218 INDIA GENE SYNTHESIS MARKET, By DISTRIBUTION CHANNEL, 2019-2028 (USD Million)
TABLE 219 SOUTH KOREA GENE SYNTHESIS MARKET, By Product & sERVICES, 2019-2028 (USD Million)
TABLE 220 SOUTH KOREA CONSUMABLES IN GENE SYNTHESIS MARKET, By PRODUCTS & SERVICES 2019-2028 (USD Million)
TABLE 221 SOUTH KOREA SYNTHESIZER in GENE SYNTHESIS MARKET, By PRODUCTS & SERVICES, 2019-2028 (USD Million)
TABLE 222 SOUTH KOREA GENE SYNTHESIS MARKET, By GENE TYPE, 2019-2028 (USD Million)
TABLE 223 SOUTH KOREA GENE SYNTHESIS MARKET, By PRODUCT TYPE, 2019-2028 (USD Million)
TABLE 224 SOUTH KOREA GENE SYNTHESIS MARKET, By APPLICATION, 2019-2028 (USD Million)
TABLE 225 SOUTH KOREA GENE SYNTHESIS MARKET, By METHOD, 2019-2028 (USD Million)
TABLE 226 SOUTH KOREA GENE SYNTHESIS MARKET, By END USER, 2019-2028 (USD Million)
TABLE 227 SOUTH KOREA GENE SYNTHESIS MARKET, By DISTRIBUTION CHANNEL, 2019-2028 (USD Million)
TABLE 228 AUSTRALIA GENE SYNTHESIS MARKET, By Product & sERVICES, 2019-2028 (USD Million)
TABLE 229 AUSTRALIA CONSUMABLES IN GENE SYNTHESIS MARKET, By PRODUCTS & SERVICES 2019-2028 (USD Million)
TABLE 230 AUSTRALIA SYNTHESIZER in GENE SYNTHESIS MARKET, By PRODUCTS & SERVICES, 2019-2028 (USD Million)
TABLE 231 AUSTRALIA GENE SYNTHESIS MARKET, By GENE TYPE, 2019-2028 (USD Million)
TABLE 232 AUSTRALIA GENE SYNTHESIS MARKET, By PRODUCT TYPE, 2019-2028 (USD Million)
TABLE 233 AUSTRALIA GENE SYNTHESIS MARKET, By APPLICATION, 2019-2028 (USD Million)
TABLE 234 AUSTRALIA GENE SYNTHESIS MARKET, By METHOD, 2019-2028 (USD Million)
TABLE 235 AUSTRALIA GENE SYNTHESIS MARKET, By END USER, 2019-2028 (USD Million)
TABLE 236 AUSTRALIA GENE SYNTHESIS MARKET, By DISTRIBUTION CHANNEL, 2019-2028 (USD Million)
TABLE 237 SINGAPORE GENE SYNTHESIS MARKET, By Product & sERVICES, 2019-2028 (USD Million)
TABLE 238 SINGAPORE CONSUMABLES IN GENE SYNTHESIS MARKET, By PRODUCTS & SERVICES 2019-2028 (USD Million)
TABLE 239 SINGAPORE SYNTHESIZER in GENE SYNTHESIS MARKET, By PRODUCTS & SERVICES, 2019-2028 (USD Million)
TABLE 240 SINGAPORE GENE SYNTHESIS MARKET, By GENE TYPE, 2019-2028 (USD Million)
TABLE 241 SINGAPORE GENE SYNTHESIS MARKET, By PRODUCT TYPE, 2019-2028 (USD Million)
TABLE 242 SINGAPORE GENE SYNTHESIS MARKET, By APPLICATION, 2019-2028 (USD Million)
TABLE 243 SINGAPORE GENE SYNTHESIS MARKET, By METHOD, 2019-2028 (USD Million)
TABLE 244 SINGAPORE GENE SYNTHESIS MARKET, By END USER, 2019-2028 (USD Million)
TABLE 245 SINGAPORE GENE SYNTHESIS MARKET, By DISTRIBUTION CHANNEL, 2019-2028 (USD Million)
TABLE 246 MALAYSIA GENE SYNTHESIS MARKET, By Product & sERVICES, 2019-2028 (USD Million)
TABLE 247 MALAYSIA CONSUMABLES IN GENE SYNTHESIS MARKET, By PRODUCTS & SERVICES 2019-2028 (USD Million)
TABLE 248 MALAYSIA SYNTHESIZER in GENE SYNTHESIS MARKET, By PRODUCTS & SERVICES, 2019-2028 (USD Million)
TABLE 249 MALAYSIA GENE SYNTHESIS MARKET, By GENE TYPE, 2019-2028 (USD Million)
TABLE 250 MALAYSIA GENE SYNTHESIS MARKET, By PRODUCT TYPE, 2019-2028 (USD Million)
TABLE 251 MALAYSIA GENE SYNTHESIS MARKET, By APPLICATION, 2019-2028 (USD Million)
TABLE 252 MALAYSIA GENE SYNTHESIS MARKET, By METHOD, 2019-2028 (USD Million)
TABLE 253 MALAYSIA GENE SYNTHESIS MARKET, By END USER, 2019-2028 (USD Million)
TABLE 254 MALAYSIA GENE SYNTHESIS MARKET, By DISTRIBUTION CHANNEL, 2019-2028 (USD Million)
TABLE 255 THAILAND GENE SYNTHESIS MARKET, By Product & sERVICES, 2019-2028 (USD Million)
TABLE 256 THAILAND CONSUMABLES IN GENE SYNTHESIS MARKET, By PRODUCTS & SERVICES 2019-2028 (USD Million)
TABLE 257 THAILAND SYNTHESIZER in GENE SYNTHESIS MARKET, By PRODUCTS & SERVICES, 2019-2028 (USD Million)
TABLE 258 THAILAND GENE SYNTHESIS MARKET, By GENE TYPE, 2019-2028 (USD Million)
TABLE 259 THAILAND GENE SYNTHESIS MARKET, By PRODUCT TYPE, 2019-2028 (USD Million)
TABLE 260 THAILAND GENE SYNTHESIS MARKET, By APPLICATION, 2019-2028 (USD Million)
TABLE 261 THAILAND GENE SYNTHESIS MARKET, By METHOD, 2019-2028 (USD Million)
TABLE 262 THAILAND GENE SYNTHESIS MARKET, By END USER, 2019-2028 (USD Million)
TABLE 263 THAILAND GENE SYNTHESIS MARKET, By DISTRIBUTION CHANNEL, 2019-2028 (USD Million)
TABLE 264 INDONESIA GENE SYNTHESIS MARKET, By Product & sERVICES, 2019-2028 (USD Million)
TABLE 265 INDONESIA CONSUMABLES IN GENE SYNTHESIS MARKET, By PRODUCTS & SERVICES 2019-2028 (USD Million)
TABLE 266 INDONESIA SYNTHESIZER in GENE SYNTHESIS MARKET, By PRODUCTS & SERVICES, 2019-2028 (USD Million)
TABLE 267 INDONESIA GENE SYNTHESIS MARKET, By GENE TYPE, 2019-2028 (USD Million)
TABLE 268 INDONESIA GENE SYNTHESIS MARKET, By PRODUCT TYPE, 2019-2028 (USD Million)
TABLE 269 INDONESIA GENE SYNTHESIS MARKET, By APPLICATION, 2019-2028 (USD Million)
TABLE 270 INDONESIA GENE SYNTHESIS MARKET, By METHOD, 2019-2028 (USD Million)
TABLE 271 INDONESIA GENE SYNTHESIS MARKET, By END USER, 2019-2028 (USD Million)
TABLE 272 INDONESIA GENE SYNTHESIS MARKET, By DISTRIBUTION CHANNEL, 2019-2028 (USD Million)
TABLE 273 PHILIPPINES GENE SYNTHESIS MARKET, By Product & sERVICES, 2019-2028 (USD Million)
TABLE 274 PHILIPPINES CONSUMABLES IN GENE SYNTHESIS MARKET, By PRODUCTS & SERVICES 2019-2028 (USD Million)
TABLE 275 PHILIPPINES SYNTHESIZER in GENE SYNTHESIS MARKET, By PRODUCTS & SERVICES, 2019-2028 (USD Million)
TABLE 276 PHILIPPINES GENE SYNTHESIS MARKET, By GENE TYPE, 2019-2028 (USD Million)
TABLE 277 PHILIPPINES GENE SYNTHESIS MARKET, By PRODUCT TYPE, 2019-2028 (USD Million)
TABLE 278 PHILIPPINES GENE SYNTHESIS MARKET, By APPLICATION, 2019-2028 (USD Million)
TABLE 279 PHILIPPINES GENE SYNTHESIS MARKET, By METHOD, 2019-2028 (USD Million)
TABLE 280 PHILIPPINES GENE SYNTHESIS MARKET, By END USER, 2019-2028 (USD Million)
TABLE 281 PHILIPPINES GENE SYNTHESIS MARKET, By DISTRIBUTION CHANNEL, 2019-2028 (USD Million)
TABLE 282 Rest of Asia-Pacific GENE SYNTHESIS MARKET, By Product & sERVICES, 2019-2028 (USD Million)
TABLE 283 South AMERICA GENE SYNTHESIS MARKET, By Region, 2019-2028 (USD Million)
TABLE 284 SOUTH AMERICA GENE SYNTHESIS MARKET, By Product & sERVICES, 2019-2028 (USD Million)
TABLE 285 SOUTH AMERICA CONSUMABLES IN GENE SYNTHESIS MARKET, By PRODUCTS & SERVICES 2019-2028 (USD Million)
TABLE 286 SOUTH AMERICA SYNTHESIZER in GENE SYNTHESIS MARKET, By PRODUCTS & SERVICES, 2019-2028 (USD Million)
TABLE 287 SOUTH AMERICA GENE SYNTHESIS MARKET, By GENE TYPE, 2019-2028 (USD Million)
TABLE 288 SOUTH AMERICA GENE SYNTHESIS MARKET, By PRODUCT TYPE, 2019-2028 (USD Million)
TABLE 289 SOUTH AMERICA GENE SYNTHESIS MARKET, By APPLICATION, 2019-2028 (USD Million)
TABLE 290 SOUTH AMERICA GENE SYNTHESIS MARKET, By METHOD, 2019-2028 (USD Million)
TABLE 291 SOUTH AMERICA GENE SYNTHESIS MARKET, By END USER, 2019-2028 (USD Million)
TABLE 292 SOUTH AMERICA GENE SYNTHESIS MARKET, By DISTRIBUTION CHANNEL, 2019-2028 (USD Million)
TABLE 293 BRAZIL GENE SYNTHESIS MARKET, By Product & sERVICES, 2019-2028 (USD Million)
TABLE 294 BRAZIL CONSUMABLES IN GENE SYNTHESIS MARKET, By PRODUCTS & SERVICES 2019-2028 (USD Million)
TABLE 295 BRAZIL SYNTHESIZER in GENE SYNTHESIS MARKET, By PRODUCTS & SERVICES, 2019-2028 (USD Million)
TABLE 296 BRAZIL GENE SYNTHESIS MARKET, By GENE TYPE, 2019-2028 (USD Million)
TABLE 297 BRAZIL GENE SYNTHESIS MARKET, By PRODUCT TYPE, 2019-2028 (USD Million)
TABLE 298 BRAZIL GENE SYNTHESIS MARKET, By APPLICATION, 2019-2028 (USD Million)
TABLE 299 BRAZIL GENE SYNTHESIS MARKET, By METHOD, 2019-2028 (USD Million)
TABLE 300 BRAZIL GENE SYNTHESIS MARKET, By END USER, 2019-2028 (USD Million)
TABLE 301 BRAZIL GENE SYNTHESIS MARKET, By DISTRIBUTION CHANNEL, 2019-2028 (USD Million)
TABLE 302 ARGENTINA GENE SYNTHESIS MARKET, By Product & sERVICES, 2019-2028 (USD Million)
TABLE 303 ARGENTINA CONSUMABLES IN GENE SYNTHESIS MARKET, By PRODUCTS & SERVICES 2019-2028 (USD Million)
TABLE 304 ARGENTINA SYNTHESIZER in GENE SYNTHESIS MARKET, By PRODUCTS & SERVICES, 2019-2028 (USD Million)
TABLE 305 ARGENTINA GENE SYNTHESIS MARKET, By GENE TYPE, 2019-2028 (USD Million)
TABLE 306 ARGENTINA GENE SYNTHESIS MARKET, By PRODUCT TYPE, 2019-2028 (USD Million)
TABLE 307 ARGENTINA GENE SYNTHESIS MARKET, By APPLICATION, 2019-2028 (USD Million)
TABLE 308 ARGENTINA GENE SYNTHESIS MARKET, By METHOD, 2019-2028 (USD Million)
TABLE 309 ARGENTINA GENE SYNTHESIS MARKET, By END USER, 2019-2028 (USD Million)
TABLE 310 ARGENTINA GENE SYNTHESIS MARKET, By DISTRIBUTION CHANNEL, 2019-2028 (USD Million)
TABLE 311 ARGENTINA GENE SYNTHESIS MARKET, By Product & sERVICES, 2019-2028 (USD Million)
TABLE 312 Middle East and Africa Gene synthesis Market, By Region, 2019-2028 (USD Million)
TABLE 313 middle east and africa Gene Synthesis Market, By Product & Services, 2019-2028 (USD Million)
TABLE 314 middle east and africa Consumables in Gene Synthesis Market, By Product & Services 2019-2028 (USD Million)
TABLE 315 middle east and africa Synthesizer in Gene Synthesis Market, By Product & Services 2019-2028 (USD Million)
TABLE 316 middle east and africa Gene Synthesis Market, By Gene Type, 2019-2028 (USD Million)
TABLE 317 middle east and africa Gene Synthesis Market, By Product Type, 2019-2028 (USD Million)
TABLE 318 middle east and africa Gene Synthesis Market, By Application, 2019-2028 (USD Million)
TABLE 319 middle east and africa Gene Synthesis Market, By Method, 2019-2028 (USD Million)
TABLE 320 middle easta and africa Gene Synthesis Market, By End User, 2019-2028 (USD Million)
TABLE 321 middle east and africa Gene Synthesis Market, By Distribution Channel, 2019-2028 (USD Million)
TABLE 322 saudi arab Gene Synthesis Market, By Product & Services, 2019-2028 (USD Million)
TABLE 323 saudi arab Consumables in Gene Synthesis Market, By Product & Services 2019-2028 (USD Million)
TABLE 324 saudi arab Synthesizer in Gene Synthesis Market, By Product & Services 2019-2028 (USD Million)
TABLE 325 saudi arab Gene Synthesis Market, By Gene Type, 2019-2028 (USD Million)
TABLE 326 saudi arab Gene Synthesis Market, By Product Type, 2019-2028 (USD Million)
TABLE 327 saudi arab Gene Synthesis Market, By Application, 2019-2028 (USD Million)
TABLE 328 saudi arab Gene Synthesis Market, By Method, 2019-2028 (USD Million)
TABLE 329 saudi arab Gene Synthesis Market, By End User, 2019-2028 (USD Million)
TABLE 330 saudi arab Gene Synthesis Market, By Distribution Channel, 2019-2028 (USD Million)
TABLE 331 south africa Gene Synthesis Market, By Product & Services, 2019-2028 (USD Million)
TABLE 332 south africa Consumables in Gene Synthesis Market, By Product & Services 2019-2028 (USD Million)
TABLE 333 south africa Synthesizer in Gene Synthesis Market, By Product & Services 2019-2028 (USD Million)
TABLE 334 south africa Gene Synthesis Market, By Gene Type, 2019-2028 (USD Million)
TABLE 335 south africa Gene Synthesis Market, By Product Type, 2019-2028 (USD Million)
TABLE 336 south africa Gene Synthesis Market, By Application, 2019-2028 (USD Million)
TABLE 337 south africa Gene Synthesis Market, By Method, 2019-2028 (USD Million)
TABLE 338 south africa Gene Synthesis Market, By End User, 2019-2028 (USD Million)
TABLE 339 south africa Gene Synthesis Market, By Distribution Channel, 2019-2028 (USD Million)
TABLE 340 UAE Gene Synthesis Market, By Product & Services, 2019-2028 (USD Million)
TABLE 341 uae Consumables in Gene Synthesis Market, By Product & Services 2019-2028 (USD Million)
TABLE 342 uae Synthesizer in Gene Synthesis Market, By Product & Services 2019-2028 (USD Million)
TABLE 343 uae Gene Synthesis Market, By Gene Type, 2019-2028 (USD Million)
TABLE 344 uae Gene Synthesis Market, By Product Type, 2019-2028 (USD Million)
TABLE 345 uae Gene Synthesis Market, By Application, 2019-2028 (USD Million)
TABLE 346 uae Gene Synthesis Market, By Method, 2019-2028 (USD Million)
TABLE 347 uae Gene Synthesis Market, By End User, 2019-2028 (USD Million)
TABLE 348 uae Gene Synthesis Market, By Distribution Channel, 2019-2028 (USD Million)
TABLE 349 ISRAEL Gene Synthesis Market, By Product & Services, 2019-2028 (USD Million)
TABLE 350 ISRAEL Consumables in Gene Synthesis Market, By Product & Services 2019-2028 (USD Million)
TABLE 351 ISRAEL Synthesizer in Gene Synthesis Market, By Product & Services 2019-2028 (USD Million)
TABLE 352 ISRAEL Gene Synthesis Market, By Gene Type, 2019-2028 (USD Million)
TABLE 353 ISRAEL Gene Synthesis Market, By Product Type, 2019-2028 (USD Million)
TABLE 354 ISRAEL Gene Synthesis Market, By Application, 2019-2028 (USD Million)
TABLE 355 ISRAEL Gene Synthesis Market, By Method, 2019-2028 (USD Million)
TABLE 356 ISRAEL Gene Synthesis Market, By End User, 2019-2028 (USD Million)
TABLE 357 ISRAEL Gene Synthesis Market, By Distribution Channel, 2019-2028 (USD Million)
TABLE 358 egypt Gene Synthesis Market, By Product & Services, 2019-2028 (USD Million)
TABLE 359 egypt Consumables in Gene Synthesis Market, By Product & Services 2019-2028 (USD Million)
TABLE 360 egypt Synthesizer in Gene Synthesis Market, By Product & Services 2019-2028 (USD Million)
TABLE 361 egypt Gene Synthesis Market, By Gene Type, 2019-2028 (USD Million)
TABLE 362 egypt Gene Synthesis Market, By Product Type, 2019-2028 (USD Million)
TABLE 363 egypt Gene Synthesis Market, By Application, 2019-2028 (USD Million)
TABLE 364 egypt Gene Synthesis Market, By Method, 2019-2028 (USD Million)
TABLE 365 egypt Gene Synthesis Market, By End User, 2019-2028 (USD Million)
TABLE 366 egypt Gene Synthesis Market, By Distribution Channel, 2019-2028 (USD Million)
TABLE 367 REST OF MIDDLE EAST AND AFRICA Gene Synthesis Market, By Product & Services, 2019-2028 (USD Million)
TABLE 368 REST OF MIDDLE EAST AND AFRICA Consumables in Gene Synthesis Market, By Product & Services 2019-2028 (USD Million)
TABLE 369 REST OF MIDDLE EAST AND AFRICA Synthesizer in Gene Synthesis Market, By Product & Services 2019-2028 (USD Million)
TABLE 370 REST OF MIDDLE EAST AND AFRICA Gene Synthesis Market, By Gene Type, 2019-2028 (USD Million)
TABLE 371 REST OF MIDDLE EAST AND AFRICA Gene Synthesis Market, By Product Type, 2019-2028 (USD Million)
TABLE 372 REST OF MIDDLE EAST AND AFRICA Gene Synthesis Market, By Application, 2019-2028 (USD Million)
TABLE 373 REST OF MIDDLE EAST AND AFRICA Gene Synthesis Market, By Method, 2019-2028 (USD Million)
TABLE 374 REST OF MIDDLE EAST AND AFRICA Gene Synthesis Market, By End User, 2019-2028 (USD Million)
TABLE 375 REST OF MIDDLE EAST AND AFRICA Gene Synthesis Market, By Distribution Channel, 2019-2028 (USD Million)
List of Figure
FIGURE 1 Global Gene synthesis market: segmentation
FIGURE 2 Global Gene synthesis market : data triangulation
FIGURE 3 global Gene synthesis Market: DROC ANALYSIS
FIGURE 4 Global Gene synthesis market: Global VS REGIONAL MARKET ANALYSIS
FIGURE 5 Global Gene synthesis Market: COMPANY RESEARCH ANALYSIS
FIGURE 6 GLOBAL Gene synthesis MARKET: MULTIVARIATE MODELLING
FIGURE 7 GLOBAL Gene synthesis MARKET: INTERVIEW DEMOGRAPHICS
FIGURE 8 GLOBAL GENE SYNTHESIS MARKET: DBMR MARKET POSITION GRID
FIGURE 9 GLOBAL gene synthesis Market: MARKET APPLICATION COVERAGE GRID
FIGURE 10 GLOBAL GENE SYNTHESIS MARKET: VENDOR SHARE ANALYSIS
FIGURE 11 Global Gene synthesis market: SEGMENTATION
FIGURE 12 NORTH AMERICA is expected to DOMINATE and asia-pacific is growing at the fastest pace in THE GLOBAL Gene synthesis market IN the forecast period of 2021 to 2028
FIGURE 13 rising adoption of gene therapy is expected to drive THE global Gene synthesis MARKET IN THE FORECAST PERIOD OF 2021 to 2028
FIGURE 14 Software & Services SEGMENT IS EXPECTED to account for the largest share of the global GENE SYNTHESIS MARKET in 2021 & 2028
FIGURE 15 asia-pacific is the fastest growing market in global Gene synthesis market in the forecast period of 2021 to 2028
FIGURE 16 DRIVERS, RESTRAINTS, OPPORTUNITIES, AND CHALLENGEs OF Global Gene synthesis Market
FIGURE 17 Pediatric deaths cause by influenza (2017–2020) in THE U.S.
FIGURE 18 global prevalEnce of hbv infection (worldwide, 2018)
FIGURE 19 global Gene synthesis market: BY product & services, 2020
FIGURE 20 global Gene synthesis market: BY product & services, 2020-2028 (USD Million)
FIGURE 21 global Gene synthesis market: BY product & services, CAGR (2020-2028).
FIGURE 22 global Gene synthesis market: BY product & services, LIFELINE CURVE
FIGURE 23 global Gene synthesis market: BY gene type, 2020
FIGURE 24 global Gene synthesis market: BY gene type, 2020-2028 (USD Million)
FIGURE 25 global Gene synthesis market: BY gene type, CAGR (2020-2028)
FIGURE 26 global Gene synthesis market: BY gene type, LIFELINE CURVE
FIGURE 27 global Gene synthesis market: BY product type, 2020
FIGURE 28 global Gene synthesis market: BY product type, 2020-2028 (USD Million)
FIGURE 29 global Gene synthesis market: BY product type, CAGR (2020-2028)
FIGURE 30 global Gene synthesis market: BY product type, LIFELINE CURVE
FIGURE 31 global Gene synthesis market: BY application, 2020
FIGURE 32 global Gene synthesis market: BY application, 2020-2028 (USD Million)
FIGURE 33 global Gene synthesis market: BY application, CAGR (2020-2028)
FIGURE 34 global Gene synthesis market: BY application, LIFELINE CURVE
FIGURE 35 global Gene synthesis market: BY method, 2020
FIGURE 36 global Gene synthesis market: BY method, 2020-2028 (USD Million)
FIGURE 37 global Gene synthesis market: BY method, CAGR (2020-2028)
FIGURE 38 global Gene synthesis market: BY method, LIFELINE CURVE
FIGURE 39 global Gene synthesis market: BY end user, 2020
FIGURE 40 global Gene synthesis market: BY end user , 2020-2028 (USD Million)
FIGURE 41 global Gene synthesis market: BY end user, CAGR (2020-2028)
FIGURE 42 global Gene synthesis market: BY end user, LIFELINE CURVE
FIGURE 43 global Gene synthesis market: BY distribution channel, 2020
FIGURE 44 global Gene synthesis market: BY distribution channel, 2020-2028 (USD Million)
FIGURE 45 global Gene synthesis market: BY distribution channel, CAGR (2020-2028)
FIGURE 46 global Gene synthesis market: BY distribution channel, LIFELINE CURVE
FIGURE 47 GLOBAL gene Synthesis market: SNAPSHOT (2020)
FIGURE 48 GLOBAL gene Synthesismarket: BY COUNTRY (2020)
FIGURE 49 GLOBAL gene Synthesis market: BY COUNTRY (2021 & 2028)
FIGURE 50 GLOBAL gene Synthesismarket: BY COUNTRY (2020 & 2028)
FIGURE 51 GLOBAL gene Synthesismarket: BY Product Type (2021-2028)
FIGURE 52 North America Gene SYNTHESIS MARKET: SNAPSHOT (2020)
FIGURE 53 North America Gene SYNTHESIS MARKET: BY COUNTRY (2020)
FIGURE 54 North America Gene SYNTHESIS MARKET: BY COUNTRY (2021 & 2028)
FIGURE 55 North America Gene SYNTHESIS MARKET: BY COUNTRY (2020 & 2028)
FIGURE 56 North America Gene SYNTHESIS MARKET: BY product Type (2021-2028)
FIGURE 57 Europe GENE SYNTHESIS market: SNAPSHOT (2020)
FIGURE 58 Europe GENE SYNTHESIS market: BY COUNTRY (2020)
FIGURE 59 Europe GENE SYNTHESIS market: BY COUNTRY (2021 & 2028)
FIGURE 60 Europe GENE SYNTHESIS market: BY COUNTRY (2020 & 2028)
FIGURE 61 Europe GENE SYNTHESIS market: BY Product Type (2021-2028)
FIGURE 62 Asia-Pacific Gene SYNTHESIS MARKET: SNAPSHOT (2020)
FIGURE 63 Asia-Pacific Gene SYNTHESIS MARKET: BY COUNTRY (2020)
FIGURE 64 Asia-Pacific Gene SYNTHESIS MARKET: BY COUNTRY (2021 & 2028)
FIGURE 65 Asia-Pacific Gene SYNTHESIS MARKET: BY COUNTRY (2020 & 2028)
FIGURE 66 Asia-Pacific Gene SYNTHESIS MARKET: BY product Type (2021-2028)
FIGURE 67 South America Gene SYNTHESIS MARKET: SNAPSHOT (2020)
FIGURE 68 South America Gene SYNTHESIS MARKET: BY COUNTRY (2020)
FIGURE 69 South America Gene SYNTHESIS MARKET: BY COUNTRY (2021 & 2028)
FIGURE 70 South America Gene SYNTHESIS MARKET: BY COUNTRY (2020 & 2028)
FIGURE 71 South America Gene SYNTHESIS MARKET: BY products Type (2021-2028)
FIGURE 72 middle east and africa GENE SYNTHESIS market: SNAPSHOT (2020)
FIGURE 73 middle east and africa GENE SYNTHESIS market: BY COUNTRY (2020)
FIGURE 74 middle east and africa GENE SYNTHESIS market: BY COUNTRY (2021 & 2028)
FIGURE 75 middle east and africa GENE SYNTHESIS market: BY COUNTRY (2020 & 2028)
FIGURE 76 middle east and africa GENE SYNTHESIS market: BY Product Type (2021-2028)
FIGURE 77 Global Gene Synthesis market: company share 2020 (%)
FIGURE 78 North America Gene Synthesis Market: company share 2020 (%)
FIGURE 79 EUROPE Gene Synthesis Market: company share 2020 (%)
FIGURE 80 ASIA-PACIFIC Gene Synthesis Market: company share 2020 (%)
منهجية البحث
يتم جمع البيانات وتحليل سنة الأساس باستخدام وحدات جمع البيانات ذات أحجام العينات الكبيرة. تتضمن المرحلة الحصول على معلومات السوق أو البيانات ذات الصلة من خلال مصادر واستراتيجيات مختلفة. تتضمن فحص وتخطيط جميع البيانات المكتسبة من الماضي مسبقًا. كما تتضمن فحص التناقضات في المعلومات التي شوهدت عبر مصادر المعلومات المختلفة. يتم تحليل بيانات السوق وتقديرها باستخدام نماذج إحصائية ومتماسكة للسوق. كما أن تحليل حصة السوق وتحليل الاتجاهات الرئيسية هي عوامل النجاح الرئيسية في تقرير السوق. لمعرفة المزيد، يرجى طلب مكالمة محلل أو إرسال استفسارك.
منهجية البحث الرئيسية التي يستخدمها فريق بحث DBMR هي التثليث البيانات والتي تتضمن استخراج البيانات وتحليل تأثير متغيرات البيانات على السوق والتحقق الأولي (من قبل خبراء الصناعة). تتضمن نماذج البيانات شبكة تحديد موقف البائعين، وتحليل خط زمني للسوق، ونظرة عامة على السوق ودليل، وشبكة تحديد موقف الشركة، وتحليل براءات الاختراع، وتحليل التسعير، وتحليل حصة الشركة في السوق، ومعايير القياس، وتحليل حصة البائعين على المستوى العالمي مقابل الإقليمي. لمعرفة المزيد عن منهجية البحث، أرسل استفسارًا للتحدث إلى خبراء الصناعة لدينا.
التخصيص متاح
تعد Data Bridge Market Research رائدة في مجال البحوث التكوينية المتقدمة. ونحن نفخر بخدمة عملائنا الحاليين والجدد بالبيانات والتحليلات التي تتطابق مع هدفهم. ويمكن تخصيص التقرير ليشمل تحليل اتجاه الأسعار للعلامات التجارية المستهدفة وفهم السوق في بلدان إضافية (اطلب قائمة البلدان)، وبيانات نتائج التجارب السريرية، ومراجعة الأدبيات، وتحليل السوق المجدد وقاعدة المنتج. ويمكن تحليل تحليل السوق للمنافسين المستهدفين من التحليل القائم على التكنولوجيا إلى استراتيجيات محفظة السوق. ويمكننا إضافة عدد كبير من المنافسين الذين تحتاج إلى بيانات عنهم بالتنسيق وأسلوب البيانات الذي تبحث عنه. ويمكن لفريق المحللين لدينا أيضًا تزويدك بالبيانات في ملفات Excel الخام أو جداول البيانات المحورية (كتاب الحقائق) أو مساعدتك في إنشاء عروض تقديمية من مجموعات البيانات المتوفرة في التقرير.

