سوق التسييل في الشرق الأوسط وأفريقيا، حسب طريقة التوريد (التزويد بالوقود/السفن، خطوط الأنابيب، الشاحنات، والسكك الحديدية)، التطبيق (المواد الكيميائية والبتروكيماوية ، توليد الطاقة، المواد الخام الصناعية، وغيرها)، اتجاهات الصناعة والتوقعات حتى عام 2030.
تحليل ورؤى حول سوق التسييل في الشرق الأوسط وأفريقيا
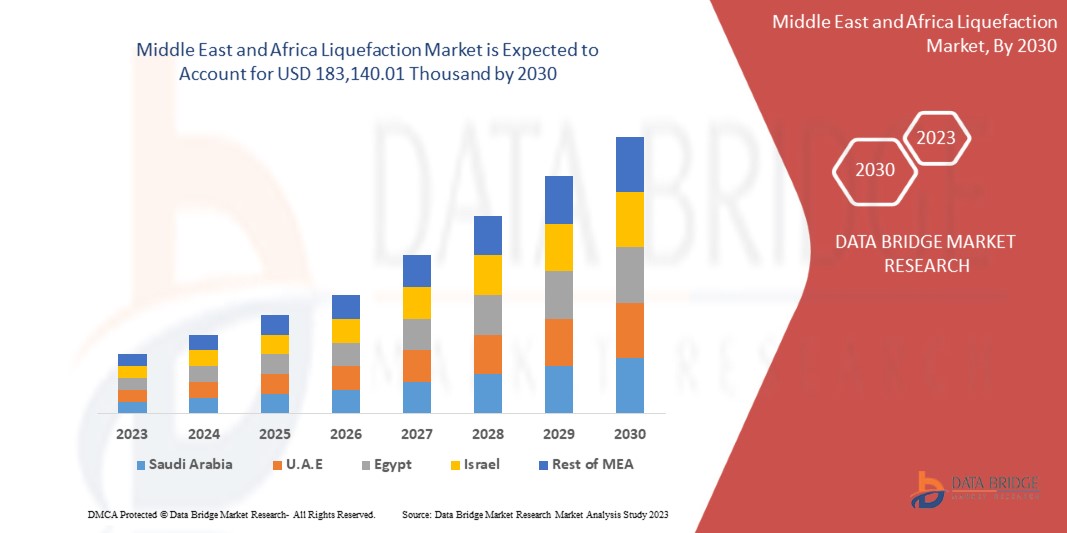
من المتوقع أن يحقق سوق التسييل في الشرق الأوسط وأفريقيا نموًا كبيرًا في الفترة المتوقعة من 2023 إلى 2030. تحلل شركة Data Bridge Market Research أن السوق ينمو بمعدل نمو سنوي مركب بنسبة 5.3٪ في الفترة المتوقعة من 2023 إلى 2030 ومن المتوقع أن يصل إلى 183،140.01 ألف دولار أمريكي بحلول عام 2030. العامل الرئيسي الذي يدفع نمو السوق هو توسع نشاط البناء البحري والبري.
التسييل هو عملية تحويل مادة غازية إلى سائل. يحدث هذا التغير نتيجة لتغيرات في المتغيرات الفيزيائية مثل درجة الحرارة والضغط والحجم. تسييل الغاز هو عملية تبريد الغاز إلى درجة حرارة أقل من نقطة غليانه بحيث يمكن تخزينه وتسليمه في صورة سائلة.
يقدم تقرير سوق التسييل في الشرق الأوسط وأفريقيا تفاصيل عن حصة السوق والتطورات الجديدة وتأثير اللاعبين المحليين والمحليين في السوق وفرص التحليل من حيث جيوب الإيرادات الناشئة والتغييرات في لوائح السوق وموافقات المنتجات والقرارات الاستراتيجية وإطلاق المنتجات والتوسعات الجغرافية والابتكارات التكنولوجية في السوق. لفهم التحليل وسيناريو السوق، اتصل بنا للحصول على موجز محلل، وسيساعدك فريقنا في إنشاء حل لتأثير الإيرادات لتحقيق هدفك المنشود.
|
تقرير القياس |
تفاصيل |
|
فترة التنبؤ |
2023 إلى 2030 |
|
سنة الأساس |
2022 |
|
سنة تاريخية |
2021 (قابلة للتخصيص حتى 2020 - 2015) |
|
وحدات كمية |
الإيرادات بالألف دولار أمريكي |
|
القطاعات المغطاة |
حسب طريقة التوريد (التزويد بالوقود/السفن، خطوط الأنابيب، الشاحنات، والسكك الحديدية)، والتطبيق (المواد الكيميائية والبتروكيماوية، وتوليد الطاقة، والمواد الخام الصناعية، وغيرها). |
|
الدول المغطاة |
جنوب أفريقيا، مصر، المملكة العربية السعودية، الإمارات العربية المتحدة، إسرائيل، وبقية دول الشرق الأوسط وأفريقيا. |
|
الجهات الفاعلة في السوق المشمولة |
Linde plc، وAir Products and Chemicals, Inc.، وBaker Hughes Company، وShell plc، وHoneywell International Inc.، وSiemens Gas and Power GmbH & Co. KG، وENGIE، وExcelerate Energy, Inc.، وEni SpA، وKunlun Energy Company Limited |
تعريف السوق
التسييل هو عملية إنتاج السائل من الغازات والمركبات الصلبة. ويحدث ذلك بشكل صناعي وطبيعي. على سبيل المثال، التطبيق التجاري الرئيسي لهذه العملية هو تسييل الهواء، والذي يسمح بفصل العناصر مثل النيتروجين والأكسجين والغازات النبيلة.
ديناميكيات سوق التسييل في الشرق الأوسط وأفريقيا
يتناول هذا القسم فهم محركات السوق والفرص والقيود والتحديات. وسيتم مناقشة كل هذا بالتفصيل أدناه:
السائقين
- أصبح الناس أكثر وعياً بالبيئة فيما يتعلق بالديزل والبنزين
تؤثر انبعاثات الديزل أو البنزين على صحة الإنسان والبيئة ومناخ الشرق الأوسط وأفريقيا والعدالة البيئية. يمكن أن يؤدي التعرض لتلوث الديزل إلى مشاكل صحية خطيرة مثل الربو والتهابات الجهاز التنفسي، فضلاً عن تفاقم أمراض القلب والرئة الموجودة مسبقًا، وخاصة عند الأطفال وكبار السن. تؤدي انبعاثات محرك الديزل إلى تكوين الأوزون على مستوى الأرض، مما يضر بالمحاصيل والأشجار والنباتات الأخرى. كما ينتج عن هذا الانبعاث أمطار حمضية تؤثر على الأراضي والبحيرات والجداول وتدخل سلسلة الغذاء البشرية من خلال الماء، مما ينتج عنه اللحوم والأسماك.
إن العواقب الضارة للديزل والبنزين تدفع الناس إلى إدراك المخاوف البيئية وزيادة الوعي بالبيئة واستخدام الديزل والبنزين. وهذا يساعدهم في البحث عن وقود له تأثير بيئي أقل من الديزل أو البنزين. وقد دفع هذا الشركات إلى تبني حلول خضراء. وقد تم استخدام الغاز الطبيعي المسال مؤخرًا كبديل للديزل والبنزين. إنه وقود نظيف يوفر للعملاء بديلاً فعالاً من حيث التكلفة.
- زيادة الطلب على الغاز الطبيعي المسال في مجال التزويد بالوقود والنقل البري والطاقة خارج الشبكة
على مدى العقد الماضي، كان هناك زيادة كبيرة في الصناعة والتحضر، مما أدى إلى زيادة انبعاثات الكربون والغازات المسببة للانحباس الحراري العالمي في الشرق الأوسط وأفريقيا. لتقليل انبعاثات الكربون والغازات المسببة للانحباس الحراري العالمي، تشجع الحكومات استخدام الغاز الطبيعي في توليد الطاقة ووقود السيارات.
ونتيجة لهذا، تطبق الحكومات مجموعة متنوعة من السياسات لتشجيع استخدام السيارات التي تعمل بالغاز الطبيعي المضغوط والغاز الطبيعي المسال، مثل تقديم الدعم والإعفاءات الضريبية لشركات صناعة السيارات والعملاء. ونتيجة لهذا، نما استهلاك الغاز الطبيعي في الشرق الأوسط وأفريقيا في العقد الأخير. ونتيجة لهذا، يتزايد استخدامه في التزود بالوقود وتوليد الطاقة والنقل البري.
- توسيع أنشطة البحث والتطوير
يتم استخدام الغاز الطبيعي المسال لنقل الغاز الطبيعي إلى أسواق بعيدة. ومع ذلك، فإن التكاليف المرتفعة للإنتاج والنقل والتخزين حدت من توسع تكنولوجيا الغاز الطبيعي المسال في ظروف معينة عندما لا توجد وسيلة أرخص لنقل الغاز الطبيعي. ومع ذلك، فإن التحديات السوقية والسياسية المحيطة بالغاز الطبيعي تزيد من الاهتمام بهذه التكنولوجيا البديلة للنقل، والتي تتمتع بميزة توسيع الأسواق المحتملة للبائعين والموردين المحتملين للمشترين. وقد أدى الاهتمام المتزايد إلى زيادة الإنفاق على البحث والتطوير في مجال الغاز الطبيعي المسال، فضلاً عن استخداماته.
إن المعالجة الأولية، وإزالة الغازات الحمضية، والتجفيف، والتسييل هي الخطوات الأربع لمصنع الغاز الطبيعي المسال. وتركز أنشطة البحث والتطوير في المقام الأول على مرحلة التسييل، بهدف تقديم التقنيات التي يمكنها تقليل استهلاك الطاقة وزيادة كفاءة عملية التسييل. وتشمل عملية التسييل الأساسية والاختراعات تقنية C3-MR، وطريقة AP-X، وطريقة Cascade، وطريقة Double Mixed Refrigerant (DMR). ولأن كل هذه التصميمات تستهلك كمية كبيرة من الطاقة (معظمها لضاغطات التبريد)، فإن جهود البحث والتطوير المتزايدة موجهة نحو تحسين العملية. وتركز أنشطة البحث والتطوير الأساسية على تصميم وتحسين المبادلات الحرارية المبردة، وتعزيز ضواغط التبريد، وكفاءة محركات الضاغط.
في تقنيات نقل الغاز الطبيعي المسال، يتم استخدام تقنيتين للسفن: وحدة التخزين العائمة (FSU) ووحدة التخزين العائمة وإعادة التغويز (FSRU). يركز البحث والتطوير في القطاع بشكل أساسي على تحسين أداء FSRU وخفض الأسعار، مما يجعل FSRU خيارًا سريعًا جذابًا للأسواق الصغيرة والدول الناشئة.
- توسيع نشاط البناء البحري والبري
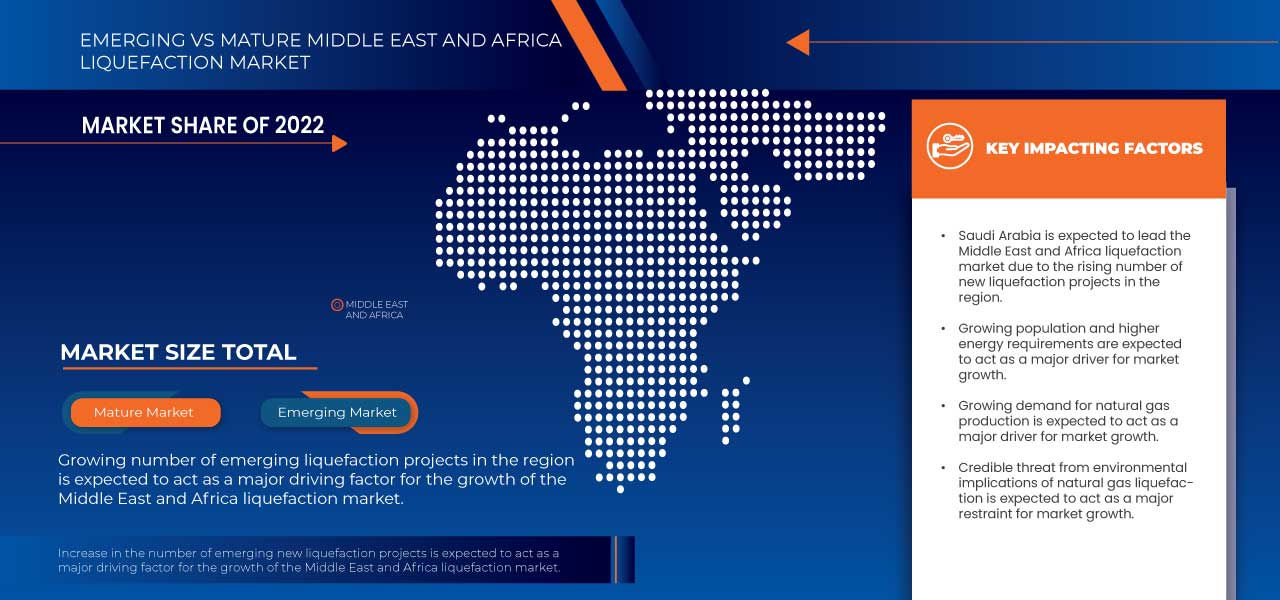
تتطور عمليات البناء البحرية والبرية في العالم المعاصر مع نمو عدد المشاريع. ويجري تطوير المزيد من مشاريع التسييل.
تُعد أنظمة الغاز الطبيعي المسال العائم (FLNG) تقنية حديثة نسبيًا في صناعة الغاز الطبيعي المسال. تُستخدم هذه الأنظمة لتسييل الغاز الطبيعي المتولد من الحقول البحرية البعيدة جدًا عن الشاطئ بحيث لا يمكن تسييلها على اليابسة. أنظمة FLNG عبارة عن قوارب مائية توضع فوق حقل غاز طبيعي تحت الماء. تعمل أنظمة FLNG بشكل عام على توليد ومعالجة وتسييل وتخزين ونقل الغاز الطبيعي المسال إلى أسواق الشرق الأوسط وأفريقيا عن طريق سفينة نقل أو إلى بنية تحتية برية تنقل الغاز إلى الأسواق المحلية. وحدات FSRU هي سفن متخصصة أو سفن بحرية تجمع وتخزن وتبخر الغاز الطبيعي المسال لتوفير الوقود لإنتاج الطاقة والمواد الخام للعمليات الصناعية والتدفئة للمباني السكنية والتجارية وغيرها من الاستخدامات النهائية.
فرص
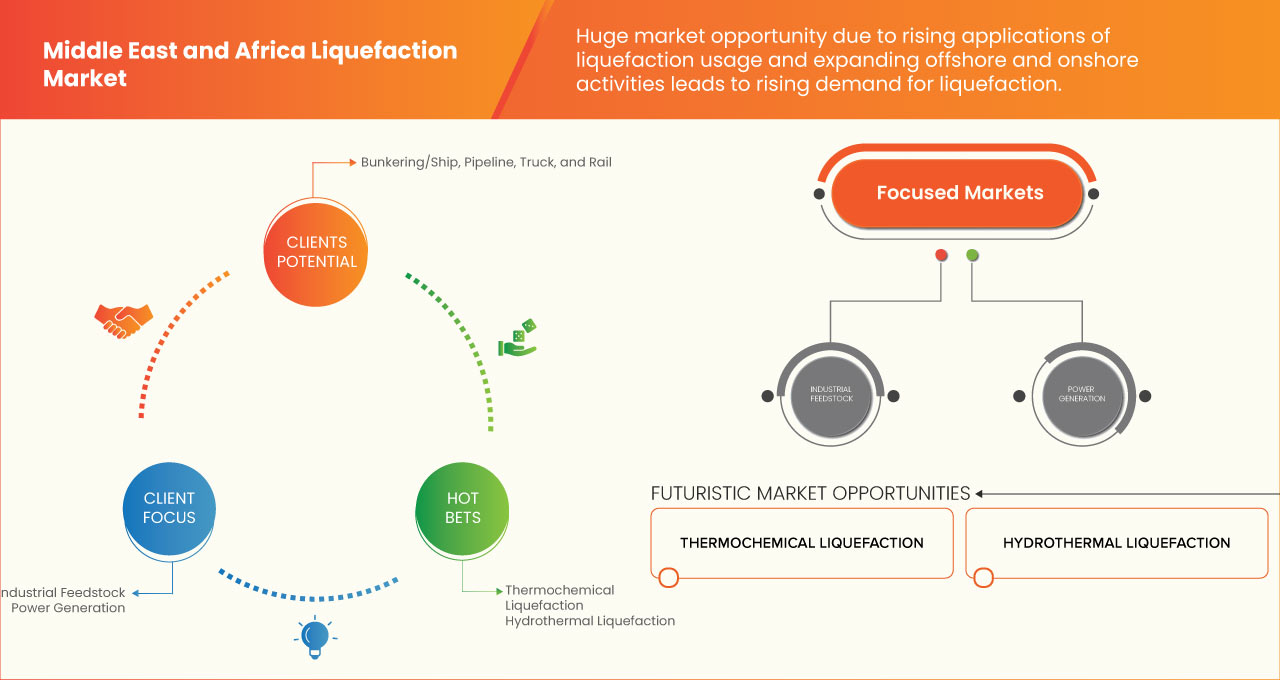
- مشاريع جديدة ناشئة في مجال التسييل
في السنوات الأخيرة، تزايدت خيارات الاستثمار في محطات تسييل الغاز الطبيعي المسال، مما مهد الطريق لتوسيع القدرة الإنتاجية على مستوى العالم بشكل أكبر. وقد تم دعم الكثير من هذا الاستثمار من خلال اتجاهات هيكل العقود التي تسمح للمطورين بالوفاء بمراحل إنجاز المشروع بمعدل أسرع من الماضي. ويرجع هذا إلى نمو الطلب المستدام الناتج عن الاقتصادات الصاعدة، فضلاً عن زيادة المشاركين في السوق.
لقد كانت ثقة السوق على المدى الطويل حاسمة في دعم هذه القرارات، حيث قد يستغرق مشروع التسييل عشر سنوات أو أكثر من التخطيط المبكر إلى وصول أولى إمدادات الغاز إلى السوق. وتعتبر مراحل الاستثمار حاسمة بالنسبة للمشاريع التي تقدمت إلى ما هو أبعد من مرحلة التخطيط إذا كانت تنوي جذب الطلب على المدى المتوسط وما بعده. وكان المستثمرون حريصين على تسريع النشاط وتفويض المشاريع في سوق تتنافس فيها العديد من المشاريع قبل أن تنتهي هذه الفرصة.
كما تزامن هذا الارتفاع الكبير في استثمارات الغاز الطبيعي المسال على مدى العامين الماضيين مع التحول عن الأساليب التقليدية لإنشاء مصانع تسييل الغاز الطبيعي المسال. ويتخذ المطورون قرارات الاستثمار النهائي بموجب نماذج الشراء الكلاسيكية بمجرد تأمين شراء المشروع من خلال عقود توريد طويلة الأجل مع أطراف ثالثة. وتوفر هذه التقنية التقليدية ثقة المستثمرين، ولكن تنظيم شراء المشروع بالكامل مع أطراف مختلفة يستغرق وقتا طويلا ويكلف المطورين الكثير.
- تزايد استخدامات التسييل
تُعرف عملية تحويل الغاز إلى سائل باسم التسييل. التسييل هو عملية اقتصادية مهمة لأن المواد الكيميائية السائلة تشغل مساحة أقل بكثير من المواد الغازية. تُستخدم الغازات المسالة بشكل شائع في التخزين والنقل المدمج للوقود القابل للاحتراق المستخدم في التدفئة أو الطهي أو تشغيل المركبات الآلية. لهذا السبب، يتم استخدام نوعين من الغازات المسالة بشكل متكرر تجاريًا: الغاز الطبيعي المسال (LNG) وغاز البترول المسال (LPG). غاز البترول المسال هو مزيج من الغازات في الحالة السائلة المشتقة من الغاز الطبيعي أو البترول. يتم تخزين المزيج في حاويات يمكنها تحمل ضغوط عالية للغاية. الغاز الطبيعي المسال مشابه لغاز البترول المسال من حيث أنه يحتوي عمليًا على كل التركيبات مثل البروبان والبوتان باستثناء الميثان. الغاز الطبيعي المسال وغاز البترول المسال لهما العديد من التطبيقات المشتركة.
تُستخدم الغازات المسالة وإجراءات التسييل في مجموعة من العمليات في مختلف الصناعات مثل الصناعات الطبية والصناعية والعلمية وما إلى ذلك. الحفاظ على العينات الحيوية، مثل تجميد الحيوانات المنوية باستخدام النيتروجين السائل، أو استخدام الأكسجين السائل في المستشفيات لتوفير نفس صحي للمرضى الذين يعانون من مشاكل في الجهاز التنفسي. يمكن لأجهزة التنفس تحت الماء استخدام مزيج من الأكسجين السائل والنيتروجين السائل.
تُستخدم عملية تسييل الغاز في أنظمة التبريد. وتُستخدم الأمونيا السائلة لتبريد مصانع الثلج. كما تُستخدم الأكسجين السائل والهيدروجين الناتجان عن تقنية تسييل الغاز في وقود الصواريخ. ويمكن تخزين الغازات ونقلها بسهولة باستخدام هذه الطريقة. على سبيل المثال، في أنظمة تكييف الهواء حيث يتم استخدام الغاز السائل المخزن، مثل R-290 أو R-600A، كمبرد. وفي القطاع الصناعي، يمكن استخدام الأسيتيلين السائل والأكسجين السائل في اللحام. كما تُعَد عملية تسييل الغازات ضرورية أيضًا في مجال أبحاث التبريد العميق. ويُستخدم الهيليوم السائل بشكل شائع في أبحاث سلوك المادة عند درجات حرارة قريبة من الصفر المطلق، 0 كلفن (صفر كلفن).
في الوقت الحالي، يتم استخدام الهيدروجين المسال في الغالب في تطبيقات الفضاء وقطاع أشباه الموصلات. وفي حين أن تطبيقات الطاقة المتجددة، مثل قطاع السيارات، لا توفر حاليًا سوى جزء ضئيل من هذا الطلب، فقد تشهد احتياجاتها زيادة كبيرة في السنوات القادمة، حيث يتجاوز الطلب على مرافق التسييل واسعة النطاق أحجام المصانع الحالية.
القيود/التحديات
- استلام كميات محدودة من الغاز الطبيعي المسال
يلعب الغاز الطبيعي المسال دورًا متزايد الأهمية في سوق الغاز الطبيعي العالمية. ومن المتوقع أن يرتفع استهلاك الغاز الطبيعي في الشرق الأوسط وأفريقيا في السنوات القليلة المقبلة. تنقل السفن الغاز الطبيعي المسال إلى محطات التفريغ في مستودعات التخزين. ويتبخر بعض الغاز الطبيعي المسال إلى الطور الغازي أثناء مراحل التخزين. ويُطلق على الغاز المتبخر اسم الغاز المتبخر. ويُحفظ الغاز الطبيعي المسال في التخزين بالتبريد العميق. وتتأثر عملية التبخر بتدفق الحرارة. ويُظهر ذلك أن نسبة ضئيلة أو جزء من الغاز الطبيعي المسال يغلي باستمرار نتيجة للحرارة أثناء عملية التخزين. وقد يكون للتبخر المتزايد تأثير ضار على استقرار عملية تخزين الغاز الطبيعي المسال وسلامته. وبسبب مخاوف تخزين الغاز الطبيعي المسال والمواقع النائية وارتفاع التكاليف، هناك ندرة في البنية التحتية لمحطات استقبال الغاز الطبيعي المسال.
- لوائح ومعايير صارمة للتسييل
تُعرف عملية تحويل الغاز إلى سائل باسم التسييل. وتكون منتجات الغازات المسالة أقل ضررًا بالبيئة. ومن الضروري أيضًا مراعاة جوانب محددة مثل كيفية تصنيعها وتخزينها ونقلها، فضلاً عن الضرر المحتمل الذي قد تسببه السلع الغازية المسالة. ويتم تنفيذ جميع هذه العمليات من قبل كل حكومة أو دولة في جميع أنحاء العالم، والتي وضعت قوانين وإرشادات ومعايير صارمة لاستخدامها المنظم دون التسبب في ضرر للبيئة أو الناس.
نطاق سوق التسييل في الشرق الأوسط وأفريقيا
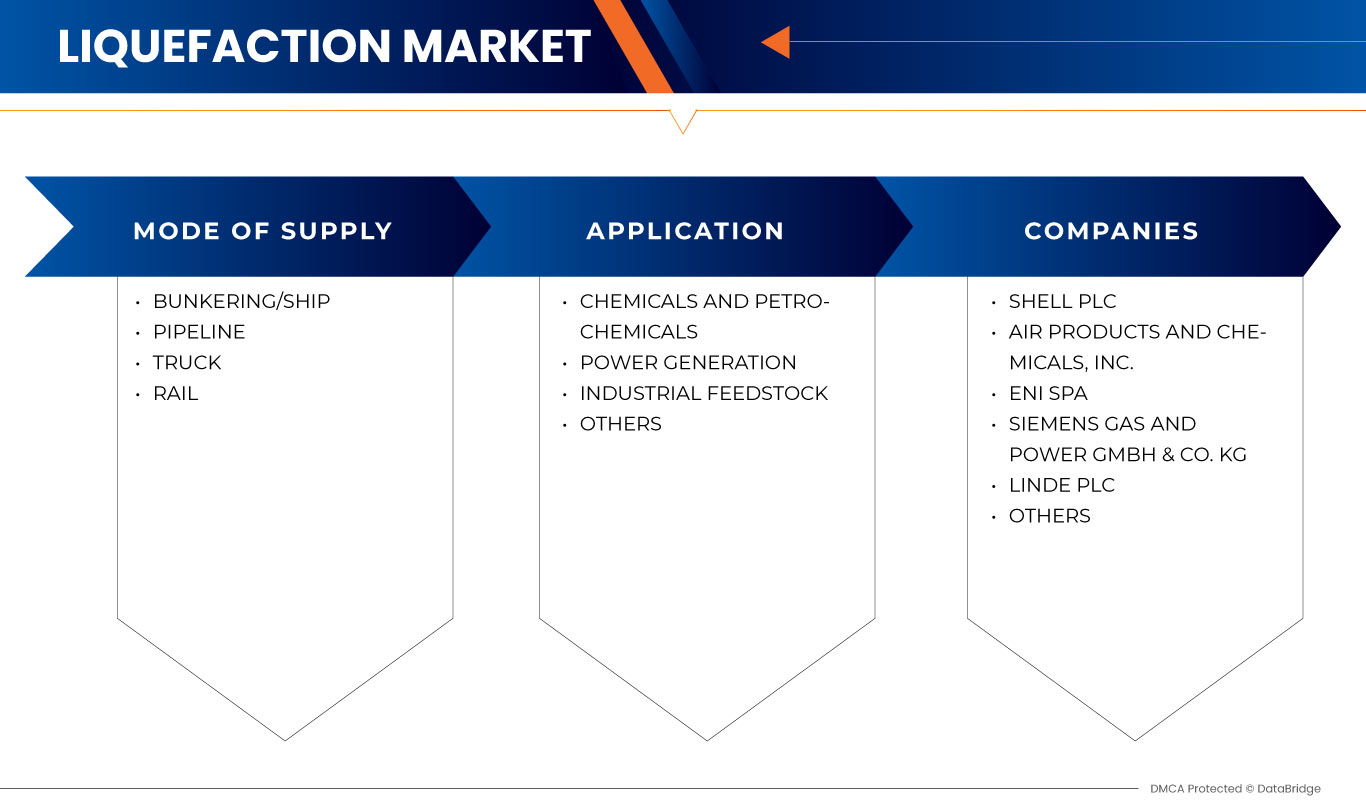
ينقسم سوق التسييل في الشرق الأوسط وأفريقيا إلى قطاعين بارزين بناءً على طريقة التوريد والتطبيق. سيساعدك النمو بين هذه القطاعات على تحليل قطاعات النمو الرئيسية في الصناعات وتزويد المستخدمين بنظرة عامة قيمة على السوق ورؤى السوق لاتخاذ قرارات استراتيجية لتحديد تطبيقات السوق الأساسية.
طريقة التوريد
- التزويد بالوقود/السفينة
- خط الأنابيب
- شاحنة
- السكك الحديدية
بناءً على طريقة التوريد، يتم تقسيم السوق إلى التزويد بالوقود/السفن، وخطوط الأنابيب، والشاحنات، والسكك الحديدية.
طلب
- المواد الكيميائية والبتروكيماويات
- توليد الطاقة
- المواد الخام الصناعية
- آحرون
بناءً على التطبيق، يتم تقسيم السوق إلى المواد الكيميائية والبتروكيماوية، وتوليد الطاقة، والمواد الخام الصناعية، وغيرها.
تحليل/رؤى إقليمية لسوق التسييل في الشرق الأوسط وأفريقيا
يتم تقسيم سوق التسييل في الشرق الأوسط وأفريقيا إلى قطاعين بارزين بناءً على طريقة التوريد والتطبيق.
تشمل الدول التي تغطيها سوق التسييل في الشرق الأوسط وأفريقيا جنوب أفريقيا ومصر والمملكة العربية السعودية والإمارات العربية المتحدة وإسرائيل وبقية دول الشرق الأوسط وأفريقيا. تهيمن المملكة العربية السعودية على سوق التسييل في الشرق الأوسط وأفريقيا من حيث حصة السوق وإيرادات السوق بسبب توسع نشاط البناء البحري والبحري.
كما يقدم قسم الدولة في التقرير عوامل فردية مؤثرة على السوق والتغيرات في تنظيم السوق التي تؤثر على الاتجاهات الحالية والمستقبلية للسوق. تعد نقاط البيانات وتحليل سلسلة القيمة المصب والمصب والاتجاهات الفنية وتحليل قوى بورتر الخمس ودراسات الحالة بعض المؤشرات المستخدمة للتنبؤ بسيناريو السوق للدول الفردية. كما يتم النظر في وجود وتوافر العلامات التجارية في الشرق الأوسط وأفريقيا والتحديات التي تواجهها بسبب المنافسة الكبيرة أو النادرة من العلامات التجارية المحلية والمحلية وتأثير التعريفات الجمركية المحلية وطرق التجارة أثناء تقديم تحليل تنبؤي لبيانات الدولة.
تحليل المشهد التنافسي وحصة سوق التسييل في الشرق الأوسط وأفريقيا
يقدم المشهد التنافسي لسوق التسييل في الشرق الأوسط وأفريقيا تفاصيل عن المنافسين. وتشمل التفاصيل نظرة عامة على الشركة، والبيانات المالية للشركة، والإيرادات المولدة، وإمكانات السوق، والاستثمار في البحث والتطوير، ومبادرات السوق الجديدة، ومواقع الإنتاج والمرافق، ونقاط القوة والضعف في الشركة، وإطلاق المنتج، وموافقات المنتج، وبراءات الاختراع، وعرض المنتج ونطاقه، وهيمنة التطبيق، ومنحنى شريان حياة المنتج. ترتبط نقاط البيانات المذكورة أعلاه فقط بتركيز الشركات فيما يتعلق بالسوق.
ومن بين المشاركين البارزين العاملين في سوق تسييل الغاز في الشرق الأوسط وأفريقيا شركة Linde plc، وشركة Air Products and Chemicals، وشركة Baker Hughes Company، وشركة Shell plc، وشركة Honeywell International Inc.، وشركة Siemens Gas and Power GmbH & Co. KG، وشركة ENGIE، وشركة Excelerate Energy، وشركة Eni SpA، وشركة Kunlun Energy Limited.
SKU-
احصل على إمكانية الوصول عبر الإنترنت إلى التقرير الخاص بأول سحابة استخبارات سوقية في العالم
- لوحة معلومات تحليل البيانات التفاعلية
- لوحة معلومات تحليل الشركة للفرص ذات إمكانات النمو العالية
- إمكانية وصول محلل الأبحاث للتخصيص والاستعلامات
- تحليل المنافسين باستخدام لوحة معلومات تفاعلية
- آخر الأخبار والتحديثات وتحليل الاتجاهات
- استغل قوة تحليل المعايير لتتبع المنافسين بشكل شامل
Table of Content
1 INTRODUCTION
1.1 OBJECTIVES OF THE STUDY
1.2 MARKET DEFINITION
1.3 OVERVIEW
1.4 LIMITATION
1.5 MARKETS COVERED
2 MARKET SEGMENTATION
2.1 MARKETS COVERED
2.2 GEOGRAPHICAL SCOPE
2.3 YEARS CONSIDERED FOR THE STUDY
2.4 CURRENCY AND PRICING
2.5 DBMR TRIPOD DATA VALIDATION MODEL
2.6 MODE OF SUPPLY LIFELINE CURVE
2.7 MULTIVARIATE MODELING
2.8 PRIMARY INTERVIEWS WITH KEY OPINION LEADERS
2.9 DBMR MARKET POSITION GRID
2.1 MARKET APPLICATION COVERAGE GRID
2.2 DBMR MARKET CHALLENGE MATRIX
2.3 DBMR VENDOR SHARE ANALYSIS
2.4 SECONDARY SOURCES
2.5 ASSUMPTIONS
3 EXECUTIVE SUMMARY
4 PREMIUM INSIGHTS
5 MARKET OVERVIEW
5.1 DRIVERS
5.1.1 PEOPLE ARE BECOMING MORE ENVIRONMENTALLY CONSCIOUS ABOUT DIESEL AND GASOLINE
5.1.2 INCREASING LNG DEMAND IN BUNKERING, ROAD TRANSPORTATION, AND OFF-GRID POWER
5.1.3 EXPANSION OF RESEARCH AND DEVELOPMENT (R&D) ACTIVITIES
5.1.4 EXPANDING BOTH OFFSHORE AND ONSHORE BUILDING ACTIVITY
5.2 RESTRAINTS
5.2.1 LIMITED LIQUEFIED NATURAL GAS (LNG) RECEIVING
5.2.2 ENVIRONMENTAL IMPLICATIONS OF NATURAL GAS LIQUEFACTION
5.3 OPPORTUNITIES
5.3.1 EMERGING NEW PROJECTS OF LIQUEFACTION
5.3.2 RISING APPLICATIONS OF LIQUEFACTION
5.4 CHALLENGES
5.4.1 STRICT LIQUEFACTION REGULATIONS AND STANDARDS
5.4.2 KEY ISSUES AND CHALLENGES OF LIQUEFACTION
6 MIDDLE EAST & AFRICA LIQUEFACTION MARKET, BY MODE OF SUPPLY
6.1 OVERVIEW
6.2 BUNKERING/SHIP
6.3 PIPELINE
6.4 TRUCK
6.5 RAIL
7 MIDDLE EAST & AFRICA LIQUEFACTION MARKET, BY APPLICATION
7.1 OVERVIEW
7.2 CHEMICALS AND PETROCHEMICALS
7.3 POWER GENERATION
7.4 INDUSTRIAL FEEDSTOCK
7.5 OTHERS
8 MIDDLE EAST & AFRICA LIQUEFACTION MARKET, BY REGION
8.1 MIDDLE EAST AND AFRICA
8.1.1 SAUDI ARABIA
8.1.2 SOUTH AFRICA
8.1.3 EGYPT
8.1.4 ISRAEL
8.1.5 UNITED ARAB EMIRATES
8.1.6 REST OF MIDDLE EAST AND AFRICA
9 MIDDLE EAST & AFRICA LIQUEFACTION MARKET: COMPANY LANDSCAPE
9.1 COMPANY SHARE ANALYSIS: MIDDLE EAST & AFRICA
9.2 PRODUCT LAUNCH
9.3 PARTNERSHIP
9.4 COLLABORATIONS
9.5 RECOGNITIONS
9.6 ACHIEVEMENTS
9.7 AGREEMENTS
9.8 INITIATE OPERATIONS
10 SWOT ANALYSIS
11 COMPANY PROFILES
11.1 SHELL PLC
11.1.1 COMPANY SNAPSHOT
11.1.2 REVENUE ANALYSIS
11.1.3 COMPANY SHARE ANALYSIS
11.1.4 PRODUCT PORTFOLIO
11.1.5 RECENT DEVELOPMENT
11.2 AIR PRODUCTS AND CHEMICLAS, INC.
11.2.1 COMPANY SNAPSHOT
11.2.2 REVENUE ANALYSIS
11.2.3 COMPANY SHARE ANALYSIS
11.2.4 PRODUCT PORTFOLIO
11.2.5 RECENT DEVELOPMENTS
11.3 ENI SPA
11.3.1 COMPANY SNAPSHOT
11.3.2 REVENUE ANALYSIS
11.3.3 COMPANY SHARE ANALYSIS
11.3.4 PRODUCT PORTFOLIO
11.3.5 RECENT DEVELOPMENTS
11.4 SIEMENS GAS AND POWER GMBH & CO. KG
11.4.1 COMPANY SNAPSHOT
11.4.2 REVENUE ANALYSIS
11.4.3 COMPANY SHARE ANALYSIS
11.4.4 PRODUCT PORTFOLIO
11.4.5 RECENT DEVELOPMENTS
11.5 LINDE PLC
11.5.1 COMPANY SNAPSHOT
11.5.2 REVENUE ANALYSIS
11.5.3 COMPANY SHARE ANALYSIS
11.5.4 PRODUCT PORTFOLIO
11.5.5 RECENT DEVELOPMENT
11.6 BAKER HUGHES COMPANY
11.6.1 COMPANY SNAPSHOT
11.6.2 REVENUE ANALYSIS
11.6.3 PRODUCT PORTFOLIO
11.6.4 RECENT DEVELOPMENT
11.7 ENGIE
11.7.1 COMPANY SNAPSHOT
11.7.2 REVENUE ANALYSIS
11.7.3 PRODUCT PORTFOLIO
11.7.4 RECENT DEVELOPMENT
11.8 EXCELERATE ENERGY, INC.
11.8.1 COMPANY SNAPSHOT
11.8.2 PRODUCT PORTFOLIO
11.8.3 RECENT DEVELOPMENTS
11.9 HONEYWELL INTERNATIONAL INC. (2022)
11.9.1 COMPANY SNAPSHOT
11.9.2 REVENUE ANALYSIS
11.9.3 PRODUCT PORTFOLIO
11.9.4 RECENT DEVELOPMENT
11.1 KUNLUN ENERGY COMPANY LIMITED
11.10.1 COMPANY SNAPSHOT
11.10.2 REVENUE ANALYSIS
11.10.3 PRODUCT PORTFOLIO
11.10.4 RECENT DEVELOPMENT
12 QUESTIONNAIRE
13 RELATED REPORTS
List of Table
TABLE 1 MIDDLE EAST & AFRICA LIQUEFACTION MARKET, BY MODE OF SUPPLY, 2021-2030 (USD THOUSAND)
TABLE 2 MIDDLE EAST & AFRICA BUNKERING/SHIP IN LIQUEFACTION MARKET, BY REGION, 2021-2030 (USD THOUSAND)
TABLE 3 MIDDLE EAST & AFRICA PIPELINE IN LIQUEFACTION MARKET, BY REGION, 2021-2030 (USD THOUSAND)
TABLE 4 MIDDLE EAST & AFRICA TRUCK IN LIQUEFACTION MARKET, BY REGION, 2021-2030 (USD THOUSAND)
TABLE 5 MIDDLE EAST & AFRICA RAIL IN LIQUEFACTION MARKET, BY REGION, 2021-2030 (USD THOUSAND)
TABLE 6 MIDDLE EAST & AFRICA LIQUEFACTION MARKET, BY APPLICATION, 2021-2030 (USD THOUSAND)
TABLE 7 MIDDLE EAST & AFRICA CHEMICALS AND PETROCHEMICALS IN LIQUEFACTION MARKET, BY REGION, 2021-2030 (USD THOUSAND)
TABLE 8 MIDDLE EAST & AFRICA POWER GENERATION IN LIQUEFACTION MARKET, BY REGION, 2021-2030 (USD THOUSAND)
TABLE 9 MIDDLE EAST & AFRICA INDUSTRIAL FEEDSTOCK IN LIQUEFACTION MARKET, BY REGION, 2021-2030 (USD THOUSAND)
TABLE 10 MIDDLE EAST & AFRICA OTHERS IN LIQUEFACTION MARKET, BY REGION, 2021-2030 (USD THOUSAND)
TABLE 11 MIDDLE EAST AND AFRICA LIQUEFACTION MARKET, BY COUNTRY, 2021-2030 (USD THOUSAND)
TABLE 12 MIDDLE EAST AND AFRICA LIQUEFACTION MARKET, BY MODE OF SUPPLY, 2021-2030 (USD THOUSAND)
TABLE 13 MIDDLE EAST AND AFRICA LIQUEFACTION MARKET, BY APPLICATION, 2021-2030 (USD THOUSAND)
TABLE 14 SAUDI ARABIA LIQUEFACTION MARKET, BY MODE OF SUPPLY, 2021-2030 (USD THOUSAND)
TABLE 15 SAUDI ARABIA LIQUEFACTION MARKET, BY APPLICATION, 2021-2030 (USD THOUSAND)
TABLE 16 SOUTH AFRICA LIQUEFACTION MARKET, BY MODE OF SUPPLY, 2021-2030 (USD THOUSAND)
TABLE 17 SOUTH AFRICA LIQUEFACTION MARKET, BY APPLICATION, 2021-2030 (USD THOUSAND)
TABLE 18 EGYPT LIQUEFACTION MARKET, BY MODE OF SUPPLY, 2021-2030 (USD THOUSAND)
TABLE 19 EGYPT LIQUEFACTION MARKET, BY APPLICATION, 2021-2030 (USD THOUSAND)
TABLE 20 ISRAEL LIQUEFACTION MARKET, BY MODE OF SUPPLY, 2021-2030 (USD THOUSAND)
TABLE 21 ISRAEL LIQUEFACTION MARKET, BY APPLICATION, 2021-2030 (USD THOUSAND)
TABLE 22 UNITED ARAB EMIRATES LIQUEFACTION MARKET, BY MODE OF SUPPLY, 2021-2030 (USD THOUSAND)
TABLE 23 UNITED ARAB EMIRATES LIQUEFACTION MARKET, BY APPLICATION, 2021-2030 (USD THOUSAND)
TABLE 24 REST OF MIDDLE EAST AND AFRICA LIQUEFACTION MARKET, BY MODE OF SUPPLY, 2021-2030 (USD THOUSAND)
List of Figure
FIGURE 1 MIDDLE EAST & AFRICA LIQUEFACTION MARKET: SEGMENTATION
FIGURE 2 MIDDLE EAST & AFRICA LIQUEFACTION MARKET: DATA TRIANGULATION
FIGURE 3 MIDDLE EAST & AFRICA LIQUEFACTION MARKET: DROC ANALYSIS
FIGURE 4 MIDDLE EAST & AFRICA LIQUEFACTION MARKET: MIDDLE EAST & AFRICA VS REGIONAL MARKET ANALYSIS
FIGURE 5 MIDDLE EAST & AFRICA LIQUEFACTION MARKET: COMPANY RESEARCH ANALYSIS
FIGURE 6 MIDDLE EAST & AFRICA LIQUEFACTION MARKET: THE MODE OF SUPPLY LIFE LINE CURVE
FIGURE 7 MIDDLE EAST & AFRICA LIQUEFACTION MARKET: MULTIVARIATE MODELLING
FIGURE 8 MIDDLE EAST & AFRICA LIQUEFACTION MARKET: INTERVIEW DEMOGRAPHICS
FIGURE 9 MIDDLE EAST & AFRICA LIQUEFACTION MARKET: DBMR MARKET POSITION GRID
FIGURE 10 MIDDLE EAST & AFRICA LIQUEFACTION MARKET: MARKET APPLICATION COVERAGE GRID
FIGURE 11 MIDDLE EAST & AFRICA LIQUEFACTION MARKET: THE MARKET CHALLENGE MATRIX
FIGURE 12 MIDDLE EAST & AFRICA LIQUEFACTION MARKET: VENDOR SHARE ANALYSIS
FIGURE 13 MIDDLE EAST & AFRICA LIQUEFACTION MARKET: SEGMENTATION
FIGURE 14 PEOPLE ARE BECOMING MORE ENVIRONMENTALLY CONSCIOUS ABOUT DIESEL AND GASOLINE, WHICH IS EXPECTED TO DRIVE THE GROWTH OF THE MIDDLE EAST & AFRICA LIQUEFACTION MARKET IN THE FORECAST PERIOD
FIGURE 15 THE BUNKERING/SHIP SEGMENT IS EXPECTED TO ACCOUNT FOR THE LARGEST MARKET SHARE OF THE MIDDLE EAST & AFRICA LIQUEFACTION MARKET IN 2023 AND 2030
FIGURE 16 DRIVERS, RESTRAINTS, OPPORTUNITIES, AND CHALLENGES OF THE MIDDLE EAST & AFRICA LIQUEFACTION MARKET
FIGURE 17 MIDDLE EAST & AFRICA LIQUEFACTION MARKET: BY MODE OF SUPPLY, 2022
FIGURE 18 MIDDLE EAST & AFRICA LIQUEFACTION MARKET: BY APPLICATION, 2022
FIGURE 19 MIDDLE EAST AND AFRICA LIQUEFACTION MARKET, BY SNAPSHOT (2022)
FIGURE 20 MIDDLE EAST AND AFRICA LIQUEFACTION MARKET, BY COUNTRY (2022)
FIGURE 21 MIDDLE EAST AND AFRICA LIQUEFACTION MARKET, BY COUNTRY (2023 & 2030)
FIGURE 22 MIDDLE EAST AND AFRICA LIQUEFACTION MARKET, BY COUNTRY (2022 & 2030)
FIGURE 23 MIDDLE EAST AND AFRICA LIQUEFACTION MARKET, BY MODE OF SUPPLY (2023 - 2030)
FIGURE 24 MIDDLE EAST & AFRICA LIQUEFACTION MARKET: COMPANY SHARE 2022 (%)

منهجية البحث
يتم جمع البيانات وتحليل سنة الأساس باستخدام وحدات جمع البيانات ذات أحجام العينات الكبيرة. تتضمن المرحلة الحصول على معلومات السوق أو البيانات ذات الصلة من خلال مصادر واستراتيجيات مختلفة. تتضمن فحص وتخطيط جميع البيانات المكتسبة من الماضي مسبقًا. كما تتضمن فحص التناقضات في المعلومات التي شوهدت عبر مصادر المعلومات المختلفة. يتم تحليل بيانات السوق وتقديرها باستخدام نماذج إحصائية ومتماسكة للسوق. كما أن تحليل حصة السوق وتحليل الاتجاهات الرئيسية هي عوامل النجاح الرئيسية في تقرير السوق. لمعرفة المزيد، يرجى طلب مكالمة محلل أو إرسال استفسارك.
منهجية البحث الرئيسية التي يستخدمها فريق بحث DBMR هي التثليث البيانات والتي تتضمن استخراج البيانات وتحليل تأثير متغيرات البيانات على السوق والتحقق الأولي (من قبل خبراء الصناعة). تتضمن نماذج البيانات شبكة تحديد موقف البائعين، وتحليل خط زمني للسوق، ونظرة عامة على السوق ودليل، وشبكة تحديد موقف الشركة، وتحليل براءات الاختراع، وتحليل التسعير، وتحليل حصة الشركة في السوق، ومعايير القياس، وتحليل حصة البائعين على المستوى العالمي مقابل الإقليمي. لمعرفة المزيد عن منهجية البحث، أرسل استفسارًا للتحدث إلى خبراء الصناعة لدينا.
التخصيص متاح
تعد Data Bridge Market Research رائدة في مجال البحوث التكوينية المتقدمة. ونحن نفخر بخدمة عملائنا الحاليين والجدد بالبيانات والتحليلات التي تتطابق مع هدفهم. ويمكن تخصيص التقرير ليشمل تحليل اتجاه الأسعار للعلامات التجارية المستهدفة وفهم السوق في بلدان إضافية (اطلب قائمة البلدان)، وبيانات نتائج التجارب السريرية، ومراجعة الأدبيات، وتحليل السوق المجدد وقاعدة المنتج. ويمكن تحليل تحليل السوق للمنافسين المستهدفين من التحليل القائم على التكنولوجيا إلى استراتيجيات محفظة السوق. ويمكننا إضافة عدد كبير من المنافسين الذين تحتاج إلى بيانات عنهم بالتنسيق وأسلوب البيانات الذي تبحث عنه. ويمكن لفريق المحللين لدينا أيضًا تزويدك بالبيانات في ملفات Excel الخام أو جداول البيانات المحورية (كتاب الحقائق) أو مساعدتك في إنشاء عروض تقديمية من مجموعات البيانات المتوفرة في التقرير.


