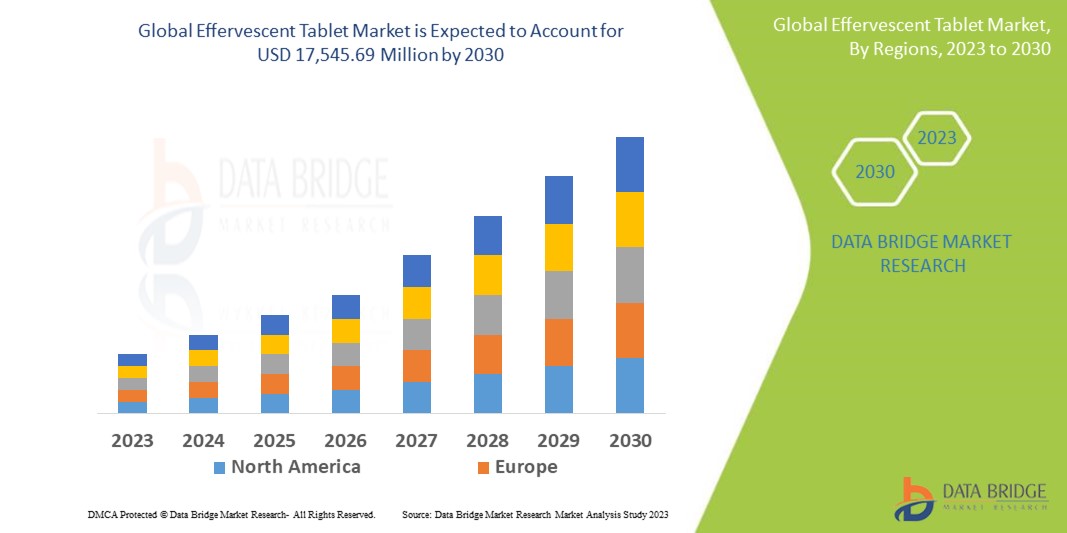
Global Effervescent Tablet Market
حجم السوق بالمليار دولار أمريكي
CAGR :
% 
 USD
9.78 Billion
USD
19.06 Billion
2023
2031
USD
9.78 Billion
USD
19.06 Billion
2023
2031
| 2024 –2031 | |
| USD 9.78 Billion | |
| USD 19.06 Billion | |
| % | |
السوق العالمية للأقراص الفوارة، حسب المنتجات (الأدوية والمكملات الغذائية)، الطرق (الطرق الجافة والتحبيب الرطب)، النوع (الوصفة الطبية وغير الطبية)، المؤشرات (مدرات البول، وإدارة الألم، واضطرابات المعدة، وأمراض الجهاز التنفسي، وغيرها)، نوع السكان (الأطفال والبالغين)، التطبيق (منتجات طب الأسنان، والمكملات الغذائية، والأدوية، وغيرها)، المستخدمون النهائيون (المستشفيات، والرعاية المنزلية، والعيادات المتخصصة، وغيرها)، قناة التوزيع (صيدلية المستشفى، والصيدلية عبر الإنترنت، والصيدلية بالتجزئة) - اتجاهات الصناعة والتوقعات حتى عام 2031.
تحليل حجم سوق الأقراص الفوارة
يشهد سوق الأقراص الفوارة نموًا كبيرًا، مدفوعًا بعدة عوامل رئيسية. أحد العوامل الرئيسية هو تفضيل المستهلك المتزايد لأشكال الجرعات المريحة، حيث توفر الأقراص الفوارة بديلاً محمولاً وسهل الاستخدام للأقراص أو الكبسولات التقليدية. المذاق اللطيف والطبيعة الفوارة للأقراص الفوارة تجعلها أكثر جاذبية للمستهلكين، وخاصة الأطفال وكبار السن. عامل آخر يدفع نمو السوق هو الطلب المتزايد على المكملات الغذائية والفيتامينات. تحظى الأقراص الفوارة بشعبية كبيرة لتقديم هذه العناصر الغذائية نظرًا لطبيعتها سريعة الذوبان والتوافر البيولوجي العالي. كما يساهم ارتفاع الوعي الصحي والتركيز على الرعاية الصحية الوقائية في زيادة الطلب على الأقراص الفوارة.
تم تقييم حجم سوق الأقراص الفوارة العالمية بنحو 9.78 مليار دولار أمريكي في عام 2023 ومن المتوقع أن يصل إلى 19.06 مليار دولار أمريكي بحلول عام 2031، مع معدل نمو سنوي مركب بنسبة 8.7٪ خلال الفترة المتوقعة من 2024 إلى 2031. بالإضافة إلى الرؤى حول سيناريوهات السوق مثل القيمة السوقية ومعدل النمو والتجزئة والتغطية الجغرافية واللاعبين الرئيسيين، فإن تقارير السوق التي أعدتها Data Bridge Market Research تتضمن أيضًا تحليلًا متعمقًا من الخبراء وعلم الأوبئة للمرضى وتحليل خطوط الأنابيب وتحليل الأسعار والإطار التنظيمي.
نطاق التقرير وتقسيم السوق
|
تقرير القياس |
تفاصيل |
|
فترة التنبؤ |
2024 إلى 2031 |
|
سنة الأساس |
2023 |
|
سنوات تاريخية |
2022 (قابلة للتخصيص حتى 2016 - 2021) |
|
وحدات كمية |
الإيرادات بالمليارات من الدولارات الأمريكية، الأحجام بالوحدات، التسعير بالدولار الأمريكي |
|
القطاعات المغطاة |
المنتجات (الأدوية والمكملات الغذائية)، الطرق (الطرق الجافة والتحبيب الرطب)، النوع (وصفة طبية وبدون وصفة طبية)، المؤشرات (مدرات البول، وإدارة الألم، واضطرابات المعدة، وأمراض الجهاز التنفسي، وغيرها)، نوع السكان (الأطفال والبالغين)، التطبيق (منتجات طب الأسنان، والمكملات الغذائية ، والمستحضرات الصيدلانية ، وغيرها)، المستخدمون النهائيون (المستشفيات، والرعاية المنزلية، والعيادات المتخصصة، وغيرها)، قناة التوزيع (صيدلية المستشفى، والصيدلية عبر الإنترنت، والصيدلية بالتجزئة) |
|
الدول المغطاة |
الولايات المتحدة الأمريكية، كندا، المكسيك، ألمانيا، فرنسا، المملكة المتحدة، هولندا، سويسرا، بلجيكا، روسيا، إيطاليا، إسبانيا، تركيا، بقية أوروبا، الصين، اليابان، الهند، كوريا الجنوبية، سنغافورة، ماليزيا، أستراليا، تايلاند، إندونيسيا، الفلبين، بقية دول آسيا والمحيط الهادئ، المملكة العربية السعودية، الإمارات العربية المتحدة، جنوب أفريقيا، مصر، إسرائيل، بقية دول الشرق الأوسط وأفريقيا، البرازيل، الأرجنتين، وبقية دول أمريكا الجنوبية |
|
الجهات الفاعلة في السوق المشمولة |
Pfizer Inc. (الولايات المتحدة)، GSK plc (المملكة المتحدة)، Novartis AG (سويسرا)، Bayer AG (ألمانيا)، Perrigo Company plc (أيرلندا)، Reckitt Benckiser Group PLC (المملكة المتحدة)، Bristol-Myers Squibb Company (الولايات المتحدة)، CHIESI SAS (فرنسا)، Hermes Pharma (النمسا)، SG Biopharm Pvt. Ltd (الهند)، Bliss GVS Pharma Limited (الهند)، SCITECH (الهند)، Alpex Solar (سويسرا)، Vovantis Laboratories (الهند)، Herbalife International of America, Inc. (الولايات المتحدة)، Swisse Wellness PTY LTD (أستراليا)، Nuun (الولايات المتحدة)، Natur Produkt Zdrovit Sp ZOO (بولندا)، Vitabiotics Ltd (المملكة المتحدة)، Amerilab Technologies Inc. (الولايات المتحدة)، وHERMES ARZNEIMITTEL (ألمانيا) |
|
فرص السوق |
|
تعريف السوق
تم تصميم الأقراص الفوارة لتذوب بسرعة في الماء، فتطلق غاز ثاني أكسيد الكربون. وهذا يخلق محلولًا فوارًا أو فوارًا، يستخدم غالبًا للأغراض الطبية أو كمكمل غذائي. تُستخدم الأقراص الفوارة عادةً لتوصيل الفيتامينات والمعادن والمكونات النشطة الأخرى وهي مشهورة بمذاقها اللطيف وسهولة تناولها.
ديناميكيات سوق الأقراص الفوارة
السائقين
- الطلب المتزايد على أشكال الجرعات المريحة
ويتزايد الطلب على أشكال الجرعات المريحة، مثل الأقراص الفوارة، مع سعي المستهلكين إلى خيارات سهلة الاستخدام وقابلة للحمل. وتوفر الأقراص الفوارة طريقة مريحة لتناول الأدوية والمكملات الغذائية، حيث يمكن إذابتها في الماء واستهلاكها كمشروب منعش. وتجعل سهولة الاستخدام هذه الأقراص الفوارة شائعة بشكل خاص بين الأفراد المشغولين الذين يبحثون عن حلول مريحة لتلبية احتياجاتهم الصحية. بالإضافة إلى ذلك، فإن قابلية حمل الأقراص الفوارة تجعلها مثالية للاستهلاك أثناء التنقل، مما يتيح للمستهلكين تناول أدويتهم أو مكملاتهم الغذائية بسهولة أثناء التنقل دون الحاجة إلى الماء أو المشروبات الأخرى. ونتيجة لذلك، من المتوقع أن يستمر نمو سوق الأقراص الفوارة.
- الوعي الصحي المتزايد
إن التركيز المتزايد على الصحة والعافية يدفع الطلب على المكملات الغذائية والفيتامينات، والتي يتم تقديمها عادة في أقراص فوارة. أصبح المستهلكون أكثر وعياً بأهمية الحفاظ على نمط حياة صحي ويبحثون بنشاط عن طرق لتحسين رفاهيتهم العامة. هذا الاتجاه واضح بشكل خاص بين كبار السن، الذين يبحثون عن طرق للحفاظ على صحتهم وحيويتهم مع تقدمهم في السن. توفر الأقراص الفوارة طريقة مريحة وفعالة لتوصيل العناصر الغذائية الأساسية، مما يجعلها شائعة بين المستهلكين المهتمين بالصحة. بالإضافة إلى ذلك، فإن المذاق اللطيف والطبيعة الفوارة للأقراص الفوارة تجعلها أكثر جاذبية للمستهلكين، مما يزيد من شعبيتها في السوق.
فرص
- التحضر المتزايد
إن التوسع الحضري يعمل على تحويل أنماط الحياة والاختيارات الغذائية. فمع انتقال الأفراد إلى المناطق الحضرية، يواجهون روتينًا أسرع وتيرة ومستويات مرتفعة من التوتر، مما يدفعهم إلى التركيز بشكل أكبر على الصحة والرفاهية. توفر الأقراص الفوارة طريقة سريعة وسهلة لتكملة العناصر الغذائية الأساسية، مما يجعلها خيارًا جذابًا لسكان المناطق الحضرية الذين يتطلعون إلى الحفاظ على صحتهم وسط جداول أعمال مزدحمة، وهو ما يخلق فرصًا لنمو السوق.
- تزايد عدد السكان المسنين
تعتبر الأقراص الفوارة مناسبة لكبار السن، حيث يسهل استخدامها وهضمها. مع تقدم العمر، يواجه العديد من الأفراد صعوبات في بلع الحبوب أو الكبسولات، مما يجعل الأقراص الفوارة خيارًا أكثر ملاءمة. علاوة على ذلك، يمكن صياغة الأقراص الفوارة لمعالجة المشكلات الصحية الشائعة التي يواجهها كبار السن، مثل صحة العظام وآلام المفاصل والوظائف الإدراكية. مع نمو عدد كبار السن، من المتوقع أن يرتفع الطلب على أشكال الجرعات سهلة الاستخدام والفعالة مثل الأقراص الفوارة.
القيود/التحديات
- المنافسة من أشكال الجرعات الأخرى
تقدم الأقراص الفوارة فوائد فريدة مثل سرعة الذوبان والطعم اللطيف. وتتمتع أشكال الجرعات التقليدية بسمعة طيبة في السوق ويفضلها المستهلكون غالبًا بسبب معرفتها وفعاليتها الملحوظة. بالإضافة إلى ذلك، قد تتمتع الأقراص والكبسولات التقليدية بعمر تخزين أطول وتكون أكثر فعالية من حيث التكلفة في الإنتاج، مما يجعلها خيارًا أكثر جاذبية للمصنعين. يجب على مصنعي الأقراص الفوارة الابتكار باستمرار لتمييز منتجاتهم وإقناع المستهلكين بفوائد شكل الجرعة الفريد الخاص بهم. تواجه هذه الأقراص منافسة شديدة من الأقراص والكبسولات وأشكال الجرعات التقليدية الأخرى، مما يعيق نمو السوق.
- المخاوف البيئية
The packaging and production of effervescent tablets can contribute to environmental issues, which may concern environmentally conscious consumers. The production of effervescent tablets often involves using plastics and other materials that are not easily recyclable, leading to waste generation. In addition, the packaging of effervescent tablets, such as individual foil packets or tubes, can result in excess packaging waste. As consumers become more aware of environmental issues, they may seek out products with minimal environmental impact, potentially leading to a shift away from effervescent tablets, which can be a challenge for the market.
This market report provides details of new recent developments, trade regulations, import-export analysis, production analysis, value chain optimization, market share, impact of domestic and localized market players, analyses opportunities in terms of emerging revenue pockets, changes in market regulations, strategic market growth analysis, market size, category market growths, application niches and dominance, product approvals, product launches, geographic expansions, technological innovations in the market. To gain more info on the effervescent tablet market contact Data Bridge Market Research for an Analyst Brief, our team will help you take an informed market decision to achieve market growth.
Recent Developments
- In July 2023, Bristol Myers Squibb (NYSE: BMY) announced that the European Medicines Agency's (EMA) Committee for Medicinal Products for Human Use (CHMP) has recommended the approval of Opdivo (nivolumab) as a monotherapy for the adjuvant treatment of adults and adolescents aged 12 years and older with completely resected stage IIB or IIC melanoma. If approved, Opdivo would be the only PD-1 inhibitor indicated as an adjuvant treatment for patients within stages IIB, IIC, III, and stage IV resected melanoma, among two approvals
- In July 2023, Bayer and the Swiss Tropical and Public Health Institute (Swiss TPH) announced a collaboration to clinically develop the compound emodepside for treating humans infected with soil-transmitted helminths. This collaboration follows the promising results of a Phase II study conducted by Swiss TPH and its partners in Tanzania. The study, published on May 18, 2023, in the New England Journal of Medicine, demonstrated the efficacy of emodepside in patients with whipworm (Trichuris trichiura) and hookworm (Ancylostoma duodenale and Necator americanus) infections
Effervescent Tablet Market Scope
The market is segmented on the basis of products, methods, type, indication, application, population type, end user, distribution channel. The growth amongst these segments will help you analyze meagre growth segments in the industries and provide the users with a valuable market overview and market insights to help them make strategic decisions for identifying core market applications.
Products
- Medication
- Supplements
Methods
- Dry Methods
- Wet Granulation
Type
- Prescription
- Over the Counter
Indication
- Diuretics
- Pain Management
- Gastric Disorders
- Respiratory Diseases
- Others
Population Type
- Children
- Adults
Application
- Dental Products
- Dietary Supplements
- Pharmaceutical
- Others
End User
- Hospitals
- Homecare
- Specialty Clinics
- Others
Distribution Channel
- Hospital Pharmacy
- Online Pharmacy
- Retail Pharmacy
Effervescent Tablet Market Regional Analysis/Insights
The market is analyzed and market size insights and trends are provided by country, products, methods, type, indication, application, population type, end user, and distribution channel as referenced above.
The countries covered in the market are U.S., Canada, Mexico, Germany, France, U.K., Netherlands, Switzerland, Belgium, Russia, Italy, Spain, Turkey, Rest of Europe, China, Japan, India, South Korea, Singapore, Malaysia, Australia, Thailand, Indonesia, Philippines, Rest of Asia-Pacific, Saudi Arabia, U.A.E., South Africa, Egypt, Israel, Rest of Middle East and Africa, Brazil, Argentina, and Rest of South America.
Europe is expected to dominate the market due to rising disposable incomes. In addition, the region's development of healthcare infrastructure and increased government initiatives are expected to accelerate market growth further.
North America is expected to witness significant growth during the forecast period due to increased research and development activities and a rise in healthcare spending, which will contribute to the market's growth. Furthermore, major market players in the region will further stimulate market expansion.
The country section of the report also provides individual market impacting factors and changes in regulation in the market domestically that impacts the current and future trends of the market. Data points like down-stream and upstream value chain analysis, technical trends and porter's five forces analysis, case studies are some of the pointers used to forecast the market scenario for individual countries. Also, the presence and availability of global brands and their challenges faced due to large or scarce competition from local and domestic brands, impact of domestic tariffs and trade routes are considered while providing forecast analysis of the country data.
Healthcare Infrastructure Growth Installed Base and New Technology Penetration
The effervescent tablet market also provides you with detailed market analysis for every country growth in healthcare expenditure for capital equipment, installed base of different kind of products for effervescent tablet market, impact of technology using life line curves and changes in healthcare regulatory scenarios and their impact on the effervescent tablet market. The data is available for historic period 2011-2021.
Competitive Landscape and Effervescent Tablet Market Share Analysis
يوفر المشهد التنافسي للسوق تفاصيل حسب المنافس. وتشمل التفاصيل نظرة عامة على الشركة، والبيانات المالية للشركة، والإيرادات المولدة، وإمكانات السوق، والاستثمار في البحث والتطوير، ومبادرات السوق الجديدة، والحضور العالمي، ومواقع الإنتاج والمرافق، والقدرات الإنتاجية، ونقاط القوة والضعف في الشركة، وإطلاق المنتج، وعرض المنتج ونطاقه، وهيمنة التطبيق. وتتعلق نقاط البيانات المذكورة أعلاه فقط بتركيز الشركات فيما يتعلق بالسوق.
بعض اللاعبين الرئيسيين العاملين في السوق هم:
- شركة فايزر (الولايات المتحدة)
- شركة جلاكسو سميث كلاين (المملكة المتحدة)
- نوفارتيس أيه جي (سويسرا)
- شركة باير ايه جي (ألمانيا)
- شركة بيريجو المحدودة (أيرلندا)
- مجموعة ريكيت بينكيزر بي إل سي (المملكة المتحدة)
- شركة بريستول مايرز سكويب (الولايات المتحدة)
- كييسي ساس (فرنسا)
- هيرميس فارما (النمسا)
- شركة إس جي بيوفارم المحدودة (الهند)
- شركة بليس جي في إس فارما المحدودة (الهند)
- سايتك (الهند)
- ألبكس سولار (سويسرا)
- مختبرات فوفانتيس (الهند)
- شركة هيربالايف العالمية الأمريكية (الولايات المتحدة)
- شركة سويس ويلنس بي تي واي المحدودة (أستراليا)
- نون (الولايات المتحدة)
- Natur Produkt Zdrovit Sp ZOO (بولندا)
- فيتابيوتيكس المحدودة (المملكة المتحدة)
- شركة أميريلاب للتكنولوجيا (الولايات المتحدة)
- هيرميس أرزنييميتل (ألمانيا)
SKU-
احصل على إمكانية الوصول عبر الإنترنت إلى التقرير الخاص بأول سحابة استخبارات سوقية في العالم
- لوحة معلومات تحليل البيانات التفاعلية
- لوحة معلومات تحليل الشركة للفرص ذات إمكانات النمو العالية
- إمكانية وصول محلل الأبحاث للتخصيص والاستعلامات
- تحليل المنافسين باستخدام لوحة معلومات تفاعلية
- آخر الأخبار والتحديثات وتحليل الاتجاهات
- استغل قوة تحليل المعايير لتتبع المنافسين بشكل شامل
Table of Content
- introduction
- OBJECTIVES OF THE STUDY
- MARKET DEFINITION
- OVERVIEW of Global Effervescent tablet market
- LIMITATIONs
- MARKETS COVERED
- MARKET SEGMENTATION
- MARKETS COVERED
- geographical scope
- years considered for the study
- currency and pricing
- DBMR TRIPOD DATA VALIDATION MODEL
- MULTIVARIATE MODELLING
- Products LIFELINE CURVE
- primary interviews with key opinion leaders
- DBMR MARKET POSITION GRID
- market application coverage grid
- vendor share analysis
- secondary sourcEs
- assumptions
- EXECUTIVE SUMMARY
- premium insights
- global Effervescent tablet market: regulationS
- REGULATIONS IN THE U.S.:
- REGULATIONS IN EUROPE
- REGULATIONS IN AUSTRALIA
- REGULATIONS IN JAPAN
- REGULATIONS IN CHINA
- CONSUMER BEHAVIOUR ANALYSIS- GLOBAL EFFERVESCENT TABLETS
- CONSUMER PREFERENCE OVER ANOTHER FORM OF MEDICATION
- REASON FOR CONSUMERS OPTING FOR EFFERVESCENT TABLET
- Market Overview
- drivers
- rise in chronic diseases
- Growth of R&D in the healthcare industry
- Advantages of effervescent products
- increase in geriatric population with chronic diseases
- RisE IN demand for maintaining a healthier lifestyle
- Restraints
- disadvantages of effervescent tablets
- IncreasE IN number of product recalls for effervescent tablets
- complex production process
- Expensive Product as compare to conventional tablets
- OPPORTUNITIES
- Rise in disposable incomes
- Strategic initiative by key market players
- risE IN demand for effervescent tablet
- CHALLENGES
- shortage of availability of the effervescent products in remote and underdeveloped regions
- Limitation associated with the presence of high sodium content
- IMPACT OF COVID-19 ON GLOBAL EFFERVESCENT TABLET MARKET
- IMPACT ON PRICE
- IMPACT ON DEMAND
- IMPACT ON SUPPLY CHAIN
- STRATEGIC DECISIONS BY MANUFACTURERS
- CONCLUSION
- GLOBAL EFFERVESCENT TABLET MARKET, BY PRODUCTS
- OVERVIEW
- Supplements
- vitamins
- minerals
- medication
- analgesics
- antacids
- GLOBAL EFFERVESCENT TABLET MARKET, BY METHOD
- OVERVIEW
- wet granulation
- fluid bed spray granulation
- organic solvents
- water
- dry method
- GLOBAL EFFERVESCENT TABLET MARKET, BY TYPE
- OVERVIEW
- over the counter
- prescription
- GLOBAL EFFERVESCENT TABLET MARKET, BY INDICATION
- OVERVIEW
- pain management
- gastric disorder
- respiratory diseases
- diuretics
- others
- GLOBAL EFFERVESCENT TABLET MARKET, BY POPULATION TYPE
- OVERVIEW
- adults
- children
- GLOBAL EFFERVESCENT TABLET MARKET, BY APPLICATION
- OVERVIEW
- pharmaceutical
- dietary supplements
- dental Products
- others
- GLOBAL EFFERVESCENT TABLET MARKET, BY END USER
- OVERVIEW
- HOSPITALS
- Specialty clinics
- home healthcare
- others
- GLOBAL EFFERVESCENT TABLET MARKET, BY DISTRIBUTION CHANNEL
- OVERVIEW
- retail pharmacies
- drug stores
- e-commerce
- Hypermarket & Supermarkets
- others
- GLOBAL Effervescent tablet market, by REGION
- overview
- North America
- U.S.
- Canada
- MEXICO
- South America
- Brazil
- Argentina
- PERU
- Rest of South America
- Middle East & Africa
- South Africa
- Saudi Arabia
- U.A.E.
- Egypt
- kuwait
- Israel
- Rest of Middle East and Africa
- ASIA-PACIFIC
- JAPAN
- CHINA
- INDIA
- South Korea
- AUSTRALIA
- Singapore
- Thailand
- Malaysia
- Indonesia
- Philippines
- Vietnam
- Rest of Asia-Pacific
- Europe
- Germany
- Italy
- France
- U.K.
- Spain
- Netherlands
- Russia
- Switzerland
- Turkey
- Austria
- Norway
- HUNGARY
- LITHUANIA
- IRELAND
- POLAND
- Rest of Europe
- Global effervescent tablet market: COMPANY landscape
- company share analysis: Global
- company share analysis: North America
- company share analysis: Europe
- company share analysis: Asia-Pacific
- swot
- company profile
- GLAXOSMITHKLINE PLC
- COMPANY SNAPSHOT
- REVENUE ANALYSIS
- PRODUCT PORTFOLIO
- RECENT DEVELOPMENTS
- BAYER AG
- COMPANY SNAPSHOT
- REVENUE ANALYSIS
- PRODUCT PORTFOLIO
- RECENT DEVELOPMENTS
- RECKITT BENCKISER GROUP PLC
- COMPANY SNAPSHOT
- REVENUE ANALYSIS
- PRODUCT PORTFOLIO
- RECENT DEVELOPMENTS
- PERRIGO COMPANY PLC
- COMPANY SNAPSHOT
- REVENUE ANALYSIS
- PRODUCT PORTFOLIO
- RECENT DEVELOPMENTS
- HERBALIFE INTERNATIONAL OF AMERICA INC
- COMPANY SNAPSHOT
- REVENUE ANALYSIS
- PRODUCT PORTFOLIO
- RECENT DEVELOPMENTS
- SWISSE WELLNESS PTY LTD
- COMPANY SNAPSHOT
- PRODUCT PORTFOLIO
- RECENT DEVELOPMENTS
- ALPEX
- COMPANY SNAPSHOT
- PRODUCT PORTFOLIO
- RECENT DEVELOPMENT
- BLISS GVS PHARMA LIMITED
- COMPANY SNAPSHOT
- REVENUE ANALYSIS
- PRODUCT PORTFOLIO
- RECENT DEVELOPMENTS
- CHIESI SAS
- COMPANY SNAPSHOT
- PRODUCT PORTFOLIO
- RECENT DEVELOPMENTS
- DIETFARM
- COMPANY SNAPSHOT
- PRODUCT PORTFOLIO
- RECENT DEVELOPMENTS
- HERMES ARZNEIMITTEL
- COMPANY SNAPSHOT
- PRODUCT PORTFOLIO
- RECENT DEVELOPMENTS
- NUUN
- COMPANY SNAPSHOT
- PRODUCT PORTFOLIO
- RECENT DEVELOPMENTS
- NATUR PRODUKT ZDROVIT SP. Z O.O.
- COMPANY SNAPSHOT
- PRODUCT PORTFOLIO
- RECENT DEVELOPMENT
- SCITECH
- COMPANY SNAPSHOT
- PRODUCT PORTFOLIO
- RECENT DEVELOPMENTS
- S. G. BIOPHARMA PVT LTD.
- COMPANY SNAPSHOT
- PRODUCT PORTFOLIO
- RECENT DEVELOPMENT
- VITABIOTICS LTD.
- COMPANY SNAPSHOT
- PRODUCT PORTFOLIO
- RECENT DEVELOPMENT
- Vovantis Laboratories
- COMPANY SNAPSHOT
- PRODUCT PORTFOLIO
- RECENT DEVELOPMENT
- questionnaire
- related reports
List of Table
TABLE 1 global effervescent tablet MARKET, By PRODUCTS, 2019-2028 (USD Million)
TABLE 2 global supplements in effervescent tablet Market, By Region, 2019-2028 (USD Million)
TABLE 3 global supplements in effervescent tablet MARKET, By PRODUCTS, 2019-2028 (USD Million)
TABLE 4 global medication in effervescent tablet Market, By Region, 2019-2028 (USD Million)
TABLE 5 global medication in effervescent tablet MARKET, By PRODUCTS, 2019-2028 (USD Million)
TABLE 6 global effervescent tablet MARKET, By METHOD, 2019-2028 (USD Million)
TABLE 7 global wet granulation in effervescent tablet Market, By Region, 2019-2028 (USD Million)
TABLE 8 global wet granulation in effervescent tablet Market, By method, 2019-2028 (USD Million)
TABLE 9 global dry method in effervescent tablet Market, By Region, 2019-2028 (USD Million)
TABLE 10 global effervescent tablet MARKET, By TYPE, 2019-2028 (USD Million)
TABLE 11 global over the counter in effervescent tablet Market, By Region, 2019-2028 (USD Million)
TABLE 12 global prescription in effervescent tablet Market, By Region, 2019-2028 (USD Million)
TABLE 13 global effervescent tablet MARKET, By INDICATION, 2019-2028 (USD Million)
TABLE 14 global pain management in effervescent tablet Market, By Region, 2019-2028 (USD Million)
TABLE 15 global gastric disorder in effervescent tablet Market, By Region, 2019-2028 (USD Million)
TABLE 16 global respiratory diseases in effervescent tablet Market, By Region, 2019-2028 (USD Million)
TABLE 17 global diuretics in effervescent tablet Market, By Region, 2019-2028 (USD Million)
TABLE 18 global others in effervescent tablet Market, By Region, 2019-2028 (USD Million)
TABLE 19 global effervescent tablet MARKET, By POPULATION TYPE, 2019-2028 (USD Million)
TABLE 20 global adults in effervescent tablet Market, By Region, 2019-2028 (USD Million)
TABLE 21 global children in effervescent tablet Market, By Region, 2019-2028 (USD Million)
TABLE 22 global effervescent tablet MARKET, By APPLICATION, 2019-2028 (USD Million)
TABLE 23 global pharmaceutical in effervescent tablet Market, By Region, 2019-2028 (USD Million)
TABLE 24 global dietary supplements in effervescent tablet Market, By Region, 2019-2028 (USD Million)
TABLE 25 global dental productsts in effervescent tablet Market, By Region, 2019-2028 (USD Million)
TABLE 26 global others in effervescent tablet Market, By Region, 2019-2028 (USD Million)
TABLE 27 global effervescent tablet MARKET, By END USER, 2019-2028 (USD Million)
TABLE 28 global HOSPITALS in effervescent tablet Market, By Region, 2019-2028 (USD Million)
TABLE 29 global specialty clinics in effervescent tablet Market, By Region, 2019-2028 (USD Million)
TABLE 30 global home healthcare in effervescent tablet Market, By Region, 2019-2028 (USD Million)
TABLE 31 global others in effervescent tablet Market, By Region, 2019-2028 (USD Million)
TABLE 32 global effervescent tablet MARKET, By DISTRIBUTION CHANNEL, 2019-2028 (USD Million)
TABLE 33 global retail pharmacies in effervescent tablet Market, By Region, 2019-2028 (USD Million)
TABLE 34 global drug store in effervescent tablet Market, By Region, 2019-2028 (USD Million)
TABLE 35 global e-commerce in effervescent tablet Market, By Region, 2019-2028 (USD Million)
TABLE 36 global hypermarket & supermarkets in effervescent tablet Market, By Region, 2019-2028 (USD Million)
TABLE 37 global others in effervescent tablet Market, By Region, 2019-2028 (USD Million)
TABLE 38 GLOBAL Effervescent tablet market, BY REGION, 2019-2028 (USD MILLION)
TABLE 39 North America effervescent tablet market, By country, 2019-2028 (USD Million)
TABLE 40 North America effervescent tablet market, By Products, 2019-2028 (USD Million)
TABLE 41 North America Supplements in effervescent tablet market, By Products, 2019-2028 (USD Million)
TABLE 42 North America Medication in effervescent tablet market, By Products, 2019-2028 (USD Million)
TABLE 43 North America effervescent tablet market, By Method, 2019-2028 (USD Million)
TABLE 44 North America Wet Granulation in effervescent tablet market, By Method, 2019-2028 (USD Million)
TABLE 45 North America effervescent tablet market, By Type, 2019-2028 (USD Million)
TABLE 46 North America effervescent tablet market, By Indication, 2019-2028 (USD Million)
TABLE 47 North America effervescent tablet market, By Population Type, 2019-2028 (USD Million)
TABLE 48 North America effervescent tablet market, By Application, 2019-2028 (USD Million)
TABLE 49 North America effervescent tablet market, By End User, 2019-2028 (USD Million)
TABLE 50 North America effervescent tablet market, By Distribution Channel, 2019-2028 (USD Million)
TABLE 51 U.S. effervescent tablet market, By Products, 2019-2028 (USD Million)
TABLE 52 U.S. Supplements in effervescent tablet market, By Products, 2019-2028 (USD Million)
TABLE 53 U.S. Medication in effervescent tablet market, By Products, 2019-2028 (USD Million)
TABLE 54 U.S. effervescent tablet market, By Method, 2019-2028 (USD Million)
TABLE 55 U.S. Wet Granulation in effervescent tablet market, By Method, 2019-2028 (USD Million)
TABLE 56 U.S. effervescent tablet market, By Type, 2019-2028 (USD Million)
TABLE 57 U.S. effervescent tablet market, By Indication, 2019-2028 (USD Million)
TABLE 58 U.S. effervescent tablet market, By Population Type, 2019-2028 (USD Million)
TABLE 59 U.S. effervescent tablet market, By Application, 2019-2028 (USD Million)
TABLE 60 U.S. effervescent tablet market, By End User, 2019-2028 (USD Million)
TABLE 61 U.S. effervescent tablet market, By Distribution Channel, 2019-2028 (USD Million)
TABLE 62 Canada effervescent tablet market, By Products, 2019-2028 (USD Million)
TABLE 63 Canada Supplements in effervescent tablet market, By Products, 2019-2028 (USD Million)
TABLE 64 Canada Medication in effervescent tablet market, By Products, 2019-2028 (USD Million)
TABLE 65 Canada effervescent tablet market, By Method, 2019-2028 (USD Million)
TABLE 66 Canada Wet Granulation in effervescent tablet market, By Method, 2019-2028 (USD Million)
TABLE 67 Canada effervescent tablet market, By Type, 2019-2028 (USD Million)
TABLE 68 Canada effervescent tablet market, By Indication, 2019-2028 (USD Million)
TABLE 69 Canada effervescent tablet market, By Population Type, 2019-2028 (USD Million)
TABLE 70 Canada effervescent tablet market, By Application, 2019-2028 (USD Million)
TABLE 71 Canada effervescent tablet market, By End User, 2019-2028 (USD Million)
TABLE 72 Canada effervescent tablet market, By Distribution Channel, 2019-2028 (USD Million)
TABLE 73 Mexico effervescent tablet market, By Products, 2019-2028 (USD Million)
TABLE 74 Mexico Supplements in effervescent tablet market, By Products, 2019-2028 (USD Million)
TABLE 75 Mexico Medication in effervescent tablet market, By Products, 2019-2028 (USD Million)
TABLE 76 Mexico effervescent tablet market, By Method, 2019-2028 (USD Million)
TABLE 77 Mexico Wet Granulation in effervescent tablet market, By Method, 2019-2028 (USD Million)
TABLE 78 Mexico effervescent tablet market, By Type, 2019-2028 (USD Million)
TABLE 79 Mexico effervescent tablet market, By Indication, 2019-2028 (USD Million)
TABLE 80 Mexico effervescent tablet market, By Population Type, 2019-2028 (USD Million)
TABLE 81 Mexico effervescent tablet market, By Application, 2019-2028 (USD Million)
TABLE 82 Mexico effervescent tablet market, By End User, 2019-2028 (USD Million)
TABLE 83 Mexico effervescent tablet market, By Distribution Channel, 2019-2028 (USD Million)
TABLE 84 South America effervescent tablet market, By country, 2019-2028 (USD Million)
TABLE 85 South America effervescent tablet market, By Products, 2019-2028 (USD Million)
TABLE 86 South America Supplements in effervescent tablet market, By Products, 2019-2028 (USD Million)
TABLE 87 South America Medication in effervescent tablet market, By Products, 2019-2028 (USD Million)
TABLE 88 South America effervescent tablet market, By Method, 2019-2028 (USD Million)
TABLE 89 South America Wet Granulation in effervescent tablet market, By Method, 2019-2028 (USD Million)
TABLE 90 South America effervescent tablet market, By Type, 2019-2028 (USD Million)
TABLE 91 South America effervescent tablet market, By Indication, 2019-2028 (USD Million)
TABLE 92 South America effervescent tablet market, By Population Type, 2019-2028 (USD Million)
TABLE 93 South America effervescent tablet market, By Application, 2019-2028 (USD Million)
TABLE 94 South America effervescent tablet market, By End User, 2019-2028 (USD Million)
TABLE 95 South America effervescent tablet market, By Distribution Channel, 2019-2028 (USD Million)
TABLE 96 Brazil effervescent tablet market, By Products, 2019-2028 (USD Million)
TABLE 97 Brazil Supplements in effervescent tablet market, By Products, 2019-2028 (USD Million)
TABLE 98 Brazil Medication in effervescent tablet market, By Products, 2019-2028 (USD Million)
TABLE 99 Brazil effervescent tablet market, By Method, 2019-2028 (USD Million)
TABLE 100 Brazil Wet Granulation in effervescent tablet market, By Method, 2019-2028 (USD Million)
TABLE 101 Brazil effervescent tablet market, By Type, 2019-2028 (USD Million)
TABLE 102 Brazil effervescent tablet market, By Indication, 2019-2028 (USD Million)
TABLE 103 Brazil effervescent tablet market, By Population Type, 2019-2028 (USD Million)
TABLE 104 Brazil effervescent tablet market, By Application, 2019-2028 (USD Million)
TABLE 105 Brazil effervescent tablet market, By End User, 2019-2028 (USD Million)
TABLE 106 Brazil effervescent tablet market, By Distribution Channel, 2019-2028 (USD Million)
TABLE 107 Argentina effervescent tablet market, By Products, 2019-2028 (USD Million)
TABLE 108 Argentina Supplements in effervescent tablet market, By Products, 2019-2028 (USD Million)
TABLE 109 Argentina Medication in effervescent tablet market, By Products, 2019-2028 (USD Million)
TABLE 110 Argentina effervescent tablet market, By Method, 2019-2028 (USD Million)
TABLE 111 Argentina Wet Granulation in effervescent tablet market, By Method, 2019-2028 (USD Million)
TABLE 112 Argentina effervescent tablet market, By Type, 2019-2028 (USD Million)
TABLE 113 Argentina effervescent tablet market, By Indication, 2019-2028 (USD Million)
TABLE 114 Argentina effervescent tablet market, By Population Type, 2019-2028 (USD Million)
TABLE 115 Argentina effervescent tablet market, By Application, 2019-2028 (USD Million)
TABLE 116 Argentina effervescent tablet market, By End User, 2019-2028 (USD Million)
TABLE 117 Argentina effervescent tablet market, By Distribution Channel, 2019-2028 (USD Million)
TABLE 118 Peru effervescent tablet market, By Products, 2019-2028 (USD Million)
TABLE 119 Peru Supplements in effervescent tablet market, By Products, 2019-2028 (USD Million)
TABLE 120 Peru Medication in effervescent tablet market, By Products, 2019-2028 (USD Million)
TABLE 121 Peru effervescent tablet market, By Method, 2019-2028 (USD Million)
TABLE 122 Peru Wet Granulation in effervescent tablet market, By Method, 2019-2028 (USD Million)
TABLE 123 Peru effervescent tablet market, By Type, 2019-2028 (USD Million)
TABLE 124 Peru effervescent tablet market, By Indication, 2019-2028 (USD Million)
TABLE 125 Peru effervescent tablet market, By Population Type, 2019-2028 (USD Million)
TABLE 126 Peru effervescent tablet market, By Application, 2019-2028 (USD Million)
TABLE 127 Peru effervescent tablet market, By End User, 2019-2028 (USD Million)
TABLE 128 Peru effervescent tablet market, By Distribution Channel, 2019-2028 (USD Million)
TABLE 129 Rest of South America effervescent tablet market, By Products, 2019-2028 (USD Million)
TABLE 130 Middle East & Africa Effervescent tablet market, By country, 2019-2028 (USD Million)
TABLE 131 Middle East & Africa Effervescent tablet market, By Products, 2019-2028 (USD Million)
TABLE 132 Middle East & Africa Supplements in Effervescent tablet market, By Products, 2019-2028 (USD Million)
TABLE 133 Middle East & Africa Medication in Effervescent tablet market, By Products, 2019-2028 (USD Million)
TABLE 134 Middle East & Africa Effervescent tablet market, By Method, 2019-2028 (USD Million)
TABLE 135 Middle East & Africa Wet Granulation in Effervescent tablet market, By Method, 2019-2028 (USD Million)
TABLE 136 Middle East & Africa Effervescent tablet market, By Type, 2019-2028 (USD Million)
TABLE 137 Middle East & Africa Effervescent tablet market, By Indication, 2019-2028 (USD Million)
TABLE 138 Middle East & Africa Effervescent tablet market, By Population Type, 2019-2028 (USD Million)
TABLE 139 Middle East & Africa Effervescent tablet market, By Application, 2019-2028 (USD Million)
TABLE 140 Middle East & Africa Effervescent tablet market, By End User, 2019-2028 (USD Million)
TABLE 141 Middle East & Africa Effervescent tablet market, By Distribution Channel, 2019-2028 (USD Million)
TABLE 142 South Africa Effervescent tablet market, By Products, 2019-2028 (USD Million)
TABLE 143 South Africa Supplements in Effervescent tablet market, By Products, 2019-2028 (USD Million)
TABLE 144 South Africa Medication in Effervescent tablet market, By Products, 2019-2028 (USD Million)
TABLE 145 South Africa Effervescent tablet market, By Method, 2019-2028 (USD Million)
TABLE 146 South Africa Wet Granulation in Effervescent tablet market, By Method, 2019-2028 (USD Million)
TABLE 147 South Africa Effervescent tablet market, By Type, 2019-2028 (USD Million)
TABLE 148 South Africa Effervescent tablet market, By Indication, 2019-2028 (USD Million)
TABLE 149 South Africa Effervescent tablet market, By Population Type, 2019-2028 (USD Million)
TABLE 150 South Africa Effervescent tablet market, By Application, 2019-2028 (USD Million)
TABLE 151 South Africa Effervescent tablet market, By End User, 2019-2028 (USD Million)
TABLE 152 South Africa Effervescent tablet market, By Distribution Channel, 2019-2028 (USD Million)
TABLE 153 Saudi Arabia Effervescent tablet market, By Products, 2019-2028 (USD Million)
TABLE 154 Saudi Arabia Supplements in Effervescent tablet market, By Products, 2019-2028 (USD Million)
TABLE 155 Saudi Arabia Medication in Effervescent tablet market, By Products, 2019-2028 (USD Million)
TABLE 156 Saudi Arabia Effervescent tablet market, By Method, 2019-2028 (USD Million)
TABLE 157 Saudi Arabia Wet Granulation in Effervescent tablet market, By Method, 2019-2028 (USD Million)
TABLE 158 Saudi Arabia Effervescent tablet market, By Type, 2019-2028 (USD Million)
TABLE 159 Saudi Arabia Effervescent tablet market, By Indication, 2019-2028 (USD Million)
TABLE 160 Saudi Arabia Effervescent tablet market, By Population Type, 2019-2028 (USD Million)
TABLE 161 Saudi Arabia Effervescent tablet market, By Application, 2019-2028 (USD Million)
TABLE 162 Saudi Arabia Effervescent tablet market, By End User, 2019-2028 (USD Million)
TABLE 163 Saudi Arabia Effervescent tablet market, By Distribution Channel, 2019-2028 (USD Million)
TABLE 164 U.A.E. Effervescent tablet market, By Products, 2019-2028 (USD Million)
TABLE 165 U.A.E. Supplements in Effervescent tablet market, By Products, 2019-2028 (USD Million)
TABLE 166 U.A.E. Medication in Effervescent tablet market, By Products, 2019-2028 (USD Million)
TABLE 167 U.A.E. Effervescent tablet market, By Method, 2019-2028 (USD Million)
TABLE 168 U.A.E. Wet Granulation in Effervescent tablet market, By Method, 2019-2028 (USD Million)
TABLE 169 U.A.E. Effervescent tablet market, By Type, 2019-2028 (USD Million)
TABLE 170 U.A.E. Effervescent tablet market, By Indication, 2019-2028 (USD Million)
TABLE 171 U.A.E. Effervescent tablet market, By Population Type, 2019-2028 (USD Million)
TABLE 172 U.A.E. Effervescent tablet market, By Application, 2019-2028 (USD Million)
TABLE 173 U.A.E. Effervescent tablet market, By End User, 2019-2028 (USD Million)
TABLE 174 U.A.E. Effervescent tablet market, By Distribution Channel, 2019-2028 (USD Million)
TABLE 175 EGYPT Effervescent tablet market, By Products, 2019-2028 (USD Million)
TABLE 176 EGYPT Supplements in Effervescent tablet market, By Products, 2019-2028 (USD Million)
TABLE 177 EGYPT Medication in Effervescent tablet market, By Products, 2019-2028 (USD Million)
TABLE 178 EGYPT Effervescent tablet market, By Method, 2019-2028 (USD Million)
TABLE 179 EGYPT Wet Granulation in Effervescent tablet market, By Method, 2019-2028 (USD Million)
TABLE 180 EGYPT Effervescent tablet market, By Type, 2019-2028 (USD Million)
TABLE 181 EGYPT Effervescent tablet market, By Indication, 2019-2028 (USD Million)
TABLE 182 EGYPT Effervescent tablet market, By Population Type, 2019-2028 (USD Million)
TABLE 183 EGYPT Effervescent tablet market, By Application, 2019-2028 (USD Million)
TABLE 184 EGYPT Effervescent tablet market, By End User, 2019-2028 (USD Million)
TABLE 185 EGYPT Effervescent tablet market, By Distribution Channel, 2019-2028 (USD Million)
TABLE 186 Kuwait Effervescent tablet market, By Products, 2019-2028 (USD Million)
TABLE 187 Kuwait Supplements in Effervescent tablet market, By Products, 2019-2028 (USD Million)
TABLE 188 Kuwait Medication in Effervescent tablet market, By Products, 2019-2028 (USD Million)
TABLE 189 Kuwait Effervescent tablet market, By Method, 2019-2028 (USD Million)
TABLE 190 Kuwait Wet Granulation in Effervescent tablet market, By Method, 2019-2028 (USD Million)
TABLE 191 Kuwait Effervescent tablet market, By Type, 2019-2028 (USD Million)
TABLE 192 Kuwait Effervescent tablet market, By Indication, 2019-2028 (USD Million)
TABLE 193 Kuwait Effervescent tablet market, By Population Type, 2019-2028 (USD Million)
TABLE 194 Kuwait Effervescent tablet market, By Application, 2019-2028 (USD Million)
TABLE 195 Kuwait Effervescent tablet market, By End User, 2019-2028 (USD Million)
TABLE 196 Kuwait Effervescent tablet market, By Distribution Channel, 2019-2028 (USD Million)
TABLE 197 Israel Effervescent tablet market, By Products, 2019-2028 (USD Million)
TABLE 198 Israel Supplements in Effervescent tablet market, By Products, 2019-2028 (USD Million)
TABLE 199 Israel Medication in Effervescent tablet market, By Products, 2019-2028 (USD Million)
TABLE 200 Israel Effervescent tablet market, By Method, 2019-2028 (USD Million)
TABLE 201 Israel Wet Granulation in Effervescent tablet market, By Method, 2019-2028 (USD Million)
TABLE 202 Israel Effervescent tablet market, By Type, 2019-2028 (USD Million)
TABLE 203 Israel Effervescent tablet market, By Indication, 2019-2028 (USD Million)
TABLE 204 Israel Effervescent tablet market, By Population Type, 2019-2028 (USD Million)
TABLE 205 Israel Effervescent tablet market, By Application, 2019-2028 (USD Million)
TABLE 206 Israel Effervescent tablet market, By End User, 2019-2028 (USD Million)
TABLE 207 Israel Effervescent tablet market, By Distribution Channel, 2019-2028 (USD Million)
TABLE 208 Rest of Middle East & Africa Effervescent tablet market, By Products, 2019-2028 (USD Million)
TABLE 209 Asia-Pacific Effervescent tablet market, By country, 2019-2028 (USD Million)
TABLE 210 Asia-Pacific Effervescent tablet market, By Products, 2019-2028 (USD Million)
TABLE 211 Asia-Pacific Supplements in Effervescent tablet market, By Products, 2019-2028 (USD Million)
TABLE 212 Asia-Pacific Medication in Effervescent tablet market, By Products, 2019-2028 (USD Million)
TABLE 213 Asia-Pacific Effervescent tablet market, By Method, 2019-2028 (USD Million)
TABLE 214 Asia-Pacific Wet Granulation in Effervescent tablet market, By Method, 2019-2028 (USD Million)
TABLE 215 Asia-Pacific Effervescent tablet market, By Type, 2019-2028 (USD Million)
TABLE 216 Asia-Pacific Effervescent tablet market, By Indication, 2019-2028 (USD Million)
TABLE 217 Asia-Pacific Effervescent tablet market, By Population Type, 2019-2028 (USD Million)
TABLE 218 Asia-Pacific Effervescent tablet market, By Application, 2019-2028 (USD Million)
TABLE 219 Asia-Pacific Effervescent tablet market, By End User, 2019-2028 (USD Million)
TABLE 220 Asia-Pacific Effervescent tablet market, By Distribution Channel, 2019-2028 (USD Million)
TABLE 221 Japan Effervescent tablet market, By Products, 2019-2028 (USD Million)
TABLE 222 Japan Supplements in Effervescent tablet market, By Products, 2019-2028 (USD Million)
TABLE 223 Japan Medication in Effervescent tablet market, By Products, 2019-2028 (USD Million)
TABLE 224 Japan Effervescent tablet market, By Method, 2019-2028 (USD Million)
TABLE 225 Japan Wet Granulation in Effervescent tablet market, By Method, 2019-2028 (USD Million)
TABLE 226 Japan Effervescent tablet market, By Type, 2019-2028 (USD Million)
TABLE 227 Japan Effervescent tablet market, By Indication, 2019-2028 (USD Million)
TABLE 228 Japan Effervescent tablet market, By Population Type, 2019-2028 (USD Million)
TABLE 229 Japan Effervescent tablet market, By Application, 2019-2028 (USD Million)
TABLE 230 Japan Effervescent tablet market, By End User, 2019-2028 (USD Million)
TABLE 231 Japan Effervescent tablet market, By Distribution Channel, 2019-2028 (USD Million)
TABLE 232 China Effervescent tablet market, By Products, 2019-2028 (USD Million)
TABLE 233 China Supplements in Effervescent tablet market, By Products, 2019-2028 (USD Million)
TABLE 234 China Medication in Effervescent tablet market, By Products, 2019-2028 (USD Million)
TABLE 235 China Effervescent tablet market, By Method, 2019-2028 (USD Million)
TABLE 236 China Wet Granulation in Effervescent tablet market, By Method, 2019-2028 (USD Million)
TABLE 237 China Effervescent tablet market, By Type, 2019-2028 (USD Million)
TABLE 238 China Effervescent tablet market, By Indication, 2019-2028 (USD Million)
TABLE 239 China Effervescent tablet market, By Population Type, 2019-2028 (USD Million)
TABLE 240 China Effervescent tablet market, By Application, 2019-2028 (USD Million)
TABLE 241 China Effervescent tablet market, By End User, 2019-2028 (USD Million)
TABLE 242 China Effervescent tablet market, By Distribution Channel, 2019-2028 (USD Million)
TABLE 243 India Effervescent tablet market, By Products, 2019-2028 (USD Million)
TABLE 244 India Supplements in Effervescent tablet market, By Products, 2019-2028 (USD Million)
TABLE 245 India Medication in Effervescent tablet market, By Products, 2019-2028 (USD Million)
TABLE 246 India Effervescent tablet market, By Method, 2019-2028 (USD Million)
TABLE 247 India Wet Granulation in Effervescent tablet market, By Method, 2019-2028 (USD Million)
TABLE 248 India Effervescent tablet market, By Type, 2019-2028 (USD Million)
TABLE 249 India Effervescent tablet market, By Indication, 2019-2028 (USD Million)
TABLE 250 India Effervescent tablet market, By Population Type, 2019-2028 (USD Million)
TABLE 251 India Effervescent tablet market, By Application, 2019-2028 (USD Million)
TABLE 252 India Effervescent tablet market, By End User, 2019-2028 (USD Million)
TABLE 253 India Effervescent tablet market, By Distribution Channel, 2019-2028 (USD Million)
TABLE 254 SOUTH KOREA Effervescent tablet market, By Products, 2019-2028 (USD Million)
TABLE 255 SOUTH KOREA Supplements in Effervescent tablet market, By Products, 2019-2028 (USD Million)
TABLE 256 SOUTH KOREA Medication in Effervescent tablet market, By Products, 2019-2028 (USD Million)
TABLE 257 SOUTH KOREA Effervescent tablet market, By Method, 2019-2028 (USD Million)
TABLE 258 SOUTH KOREA Wet Granulation in Effervescent tablet market, By Method, 2019-2028 (USD Million)
TABLE 259 SOUTH KOREA Effervescent tablet market, By Type, 2019-2028 (USD Million)
TABLE 260 SOUTH KOREA Effervescent tablet market, By Indication, 2019-2028 (USD Million)
TABLE 261 SOUTH KOREA Effervescent tablet market, By Population Type, 2019-2028 (USD Million)
TABLE 262 SOUTH KOREA Effervescent tablet market, By Application, 2019-2028 (USD Million)
TABLE 263 SOUTH KOREA Effervescent tablet market, By End User, 2019-2028 (USD Million)
TABLE 264 SOUTH KOREA Effervescent tablet market, By Distribution Channel, 2019-2028 (USD Million)
TABLE 265 Australia Effervescent tablet market, By Products, 2019-2028 (USD Million)
TABLE 266 Australia Supplements in Effervescent tablet market, By Products, 2019-2028 (USD Million)
TABLE 267 Australia Medication in Effervescent tablet market, By Products, 2019-2028 (USD Million)
TABLE 268 Australia Effervescent tablet market, By Method, 2019-2028 (USD Million)
TABLE 269 Australia Wet Granulation in Effervescent tablet market, By Method, 2019-2028 (USD Million)
TABLE 270 Australia Effervescent tablet market, By Type, 2019-2028 (USD Million)
TABLE 271 Australia Effervescent tablet market, By Indication, 2019-2028 (USD Million)
TABLE 272 Australia Effervescent tablet market, By Population Type, 2019-2028 (USD Million)
TABLE 273 Australia Effervescent tablet market, By Application, 2019-2028 (USD Million)
TABLE 274 Australia Effervescent tablet market, By End User, 2019-2028 (USD Million)
TABLE 275 Australia Effervescent tablet market, By Distribution Channel, 2019-2028 (USD Million)
TABLE 276 Singapore Effervescent tablet market, By Products, 2019-2028 (USD Million)
TABLE 277 Singapore Supplements in Effervescent tablet market, By Products, 2019-2028 (USD Million)
TABLE 278 Singapore Medication in Effervescent tablet market, By Products, 2019-2028 (USD Million)
TABLE 279 Singapore Effervescent tablet market, By Method, 2019-2028 (USD Million)
TABLE 280 Singapore Wet Granulation in Effervescent tablet market, By Method, 2019-2028 (USD Million)
TABLE 281 Singapore Effervescent tablet market, By Type, 2019-2028 (USD Million)
TABLE 282 Singapore Effervescent tablet market, By Indication, 2019-2028 (USD Million)
TABLE 283 Singapore Effervescent tablet market, By Population Type, 2019-2028 (USD Million)
TABLE 284 Singapore Effervescent tablet market, By Application, 2019-2028 (USD Million)
TABLE 285 Singapore Effervescent tablet market, By End User, 2019-2028 (USD Million)
TABLE 286 Singapore Effervescent tablet market, By Distribution Channel, 2019-2028 (USD Million)
TABLE 287 Thailand Effervescent tablet market, By Products, 2019-2028 (USD Million)
TABLE 288 Thailand Supplements in Effervescent tablet market, By Products, 2019-2028 (USD Million)
TABLE 289 Thailand Medication in Effervescent tablet market, By Products, 2019-2028 (USD Million)
TABLE 290 Thailand Effervescent tablet market, By Method, 2019-2028 (USD Million)
TABLE 291 Thailand Wet Granulation in Effervescent tablet market, By Method, 2019-2028 (USD Million)
TABLE 292 Thailand Effervescent tablet market, By Type, 2019-2028 (USD Million)
TABLE 293 Thailand Effervescent tablet market, By Indication, 2019-2028 (USD Million)
TABLE 294 Thailand Effervescent tablet market, By Population Type, 2019-2028 (USD Million)
TABLE 295 Thailand Effervescent tablet market, By Application, 2019-2028 (USD Million)
TABLE 296 Thailand Effervescent tablet market, By End User, 2019-2028 (USD Million)
TABLE 297 Thailand Effervescent tablet market, By Distribution Channel, 2019-2028 (USD Million)
TABLE 298 Malaysia Effervescent tablet market, By Products, 2019-2028 (USD Million)
TABLE 299 Malaysia Supplements in Effervescent tablet market, By Products, 2019-2028 (USD Million)
TABLE 300 Malaysia Medication in Effervescent tablet market, By Products, 2019-2028 (USD Million)
TABLE 301 Malaysia Effervescent tablet market, By Method, 2019-2028 (USD Million)
TABLE 302 Malaysia Wet Granulation in Effervescent tablet market, By Method, 2019-2028 (USD Million)
TABLE 303 Malaysia Effervescent tablet market, By Type, 2019-2028 (USD Million)
TABLE 304 Malaysia Effervescent tablet market, By Indication, 2019-2028 (USD Million)
TABLE 305 Malaysia Effervescent tablet market, By Population Type, 2019-2028 (USD Million)
TABLE 306 Malaysia Effervescent tablet market, By Application, 2019-2028 (USD Million)
TABLE 307 Malaysia Effervescent tablet market, By End User, 2019-2028 (USD Million)
TABLE 308 Malaysia Effervescent tablet market, By Distribution Channel, 2019-2028 (USD Million)
TABLE 309 Indonesia Effervescent tablet market, By Products, 2019-2028 (USD Million)
TABLE 310 Indonesia Supplements in Effervescent tablet market, By Products, 2019-2028 (USD Million)
TABLE 311 Indonesia Medication in Effervescent tablet market, By Products, 2019-2028 (USD Million)
TABLE 312 Indonesia Effervescent tablet market, By Method, 2019-2028 (USD Million)
TABLE 313 Indonesia Wet Granulation in Effervescent tablet market, By Method, 2019-2028 (USD Million)
TABLE 314 Indonesia Effervescent tablet market, By Type, 2019-2028 (USD Million)
TABLE 315 Indonesia Effervescent tablet market, By Indication, 2019-2028 (USD Million)
TABLE 316 Indonesia Effervescent tablet market, By Population Type, 2019-2028 (USD Million)
TABLE 317 Indonesia Effervescent tablet market, By Application, 2019-2028 (USD Million)
TABLE 318 Indonesia Effervescent tablet market, By End User, 2019-2028 (USD Million)
TABLE 319 Indonesia Effervescent tablet market, By Distribution Channel, 2019-2028 (USD Million)
TABLE 320 Philippines Effervescent tablet market, By Products, 2019-2028 (USD Million)
TABLE 321 Philippines Supplements in Effervescent tablet market, By Products, 2019-2028 (USD Million)
TABLE 322 Philippines Medication in Effervescent tablet market, By Products, 2019-2028 (USD Million)
TABLE 323 Philippines Effervescent tablet market, By Method, 2019-2028 (USD Million)
TABLE 324 Philippines Wet Granulation in Effervescent tablet market, By Method, 2019-2028 (USD Million)
TABLE 325 Philippines Effervescent tablet market, By Type, 2019-2028 (USD Million)
TABLE 326 Philippines Effervescent tablet market, By Indication, 2019-2028 (USD Million)
TABLE 327 Philippines Effervescent tablet market, By Population Type, 2019-2028 (USD Million)
TABLE 328 Philippines Effervescent tablet market, By Application, 2019-2028 (USD Million)
TABLE 329 Philippines Effervescent tablet market, By End User, 2019-2028 (USD Million)
TABLE 330 Philippines Effervescent tablet market, By Distribution Channel, 2019-2028 (USD Million)
TABLE 331 Vietnam Effervescent tablet market, By Products, 2019-2028 (USD Million)
TABLE 332 Vietnam Supplements in Effervescent tablet market, By Products, 2019-2028 (USD Million)
TABLE 333 Vietnam Medication in Effervescent tablet market, By Products, 2019-2028 (USD Million)
TABLE 334 Vietnam Effervescent tablet market, By Method, 2019-2028 (USD Million)
TABLE 335 Vietnam Wet Granulation in Effervescent tablet market, By Method, 2019-2028 (USD Million)
TABLE 336 Vietnam Effervescent tablet market, By Type, 2019-2028 (USD Million)
TABLE 337 Vietnam Effervescent tablet market, By Indication, 2019-2028 (USD Million)
TABLE 338 Vietnam Effervescent tablet market, By Population Type, 2019-2028 (USD Million)
TABLE 339 Vietnam Effervescent tablet market, By Application, 2019-2028 (USD Million)
TABLE 340 Vietnam Effervescent tablet market, By End User, 2019-2028 (USD Million)
TABLE 341 Vietnam Effervescent tablet market, By Distribution Channel, 2019-2028 (USD Million)
TABLE 342 Rest of Asia-Pacific Effervescent tablet market, By Products, 2019-2028 (USD Million)
TABLE 343 Europe effervescent tablet market, By country, 2019-2028 (USD Million)
TABLE 344 Europe effervescent tablet market, By Products, 2019-2028 (USD Million)
TABLE 345 Europe Supplements in effervescent tablet market, By Products, 2019-2028 (USD Million)
TABLE 346 Europe Medication in effervescent tablet market, By Products, 2019-2028 (USD Million)
TABLE 347 Europe effervescent tablet market, By Methods, 2019-2028 (USD Million)
TABLE 348 Europe Wet Granulation in effervescent tablet market, By Methods, 2019-2028 (USD Million)
TABLE 349 Europe effervescent tablet market, By Type, 2019-2028 (USD Million)
TABLE 350 Europe effervescent tablet market, By Indication, 2019-2028 (USD Million)
TABLE 351 Europe effervescent tablet market, By Population Type, 2019-2028 (USD Million)
TABLE 352 Europe effervescent tablet market, By Application, 2019-2028 (USD Million)
TABLE 353 Europe effervescent tablet market, By End User, 2019-2028 (USD Million)
TABLE 354 Europe effervescent tablet market, By Distribution Channel, 2019-2028 (USD Million)
TABLE 355 Germany effervescent tablet market, By Products, 2019-2028 (USD Million)
TABLE 356 Germany Supplements in effervescent tablet market, By Products, 2019-2028 (USD Million)
TABLE 357 Germany Medication in effervescent tablet market, By Products, 2019-2028 (USD Million)
TABLE 358 Germany effervescent tablet market, By Methods, 2019-2028 (USD Million)
TABLE 359 Germany Wet Granulation in effervescent tablet market, By Methods, 2019-2028 (USD Million)
TABLE 360 Germany effervescent tablet market, By Type, 2019-2028 (USD Million)
TABLE 361 Germany effervescent tablet market, By Indication, 2019-2028 (USD Million)
TABLE 362 Germany effervescent tablet market, By Population Type, 2019-2028 (USD Million)
TABLE 363 Germany effervescent tablet market, By Application, 2019-2028 (USD Million)
TABLE 364 Germany effervescent tablet market, By End User, 2019-2028 (USD Million)
TABLE 365 Germany effervescent tablet market, By Distribution Channel, 2019-2028 (USD Million)
TABLE 366 Italy effervescent tablet market, By Products, 2019-2028 (USD Million)
TABLE 367 Italy Supplements in effervescent tablet market, By Products, 2019-2028 (USD Million)
TABLE 368 Italy Medication in effervescent tablet market, By Products, 2019-2028 (USD Million)
TABLE 369 Italy effervescent tablet market, By Methods, 2019-2028 (USD Million)
TABLE 370 Italy Wet Granulation in effervescent tablet market, By Methods, 2019-2028 (USD Million)
TABLE 371 Italy effervescent tablet market, By Type, 2019-2028 (USD Million)
TABLE 372 Italy effervescent tablet market, By Indication, 2019-2028 (USD Million)
TABLE 373 Italy effervescent tablet market, By Population Type, 2019-2028 (USD Million)
TABLE 374 Italy effervescent tablet market, By Application, 2019-2028 (USD Million)
TABLE 375 Italy effervescent tablet market, By End User, 2019-2028 (USD Million)
TABLE 376 Italy effervescent tablet market, By Distribution Channel, 2019-2028 (USD Million)
TABLE 377 France effervescent tablet market, By Products, 2019-2028 (USD Million)
TABLE 378 France Supplements in effervescent tablet market, By Products, 2019-2028 (USD Million)
TABLE 379 France Medication in effervescent tablet market, By Products, 2019-2028 (USD Million)
TABLE 380 France effervescent tablet market, By Methods, 2019-2028 (USD Million)
TABLE 381 France Wet Granulation in effervescent tablet market, By Methods, 2019-2028 (USD Million)
TABLE 382 France effervescent tablet market, By Type, 2019-2028 (USD Million)
TABLE 383 France effervescent tablet market, By Indication, 2019-2028 (USD Million)
TABLE 384 France effervescent tablet market, By Population Type, 2019-2028 (USD Million)
TABLE 385 France effervescent tablet market, By Application, 2019-2028 (USD Million)
TABLE 386 France effervescent tablet market, By End User, 2019-2028 (USD Million)
TABLE 387 France effervescent tablet market, By Distribution Channel, 2019-2028 (USD Million)
TABLE 388 U.K. effervescent tablet market, By Products, 2019-2028 (USD Million)
TABLE 389 U.K. Supplements in effervescent tablet market, By Products, 2019-2028 (USD Million)
TABLE 390 U.K. Medication in effervescent tablet market, By Products, 2019-2028 (USD Million)
TABLE 391 U.K. effervescent tablet market, By Methods, 2019-2028 (USD Million)
TABLE 392 U.K. Wet Granulation in effervescent tablet market, By Methods, 2019-2028 (USD Million)
TABLE 393 U.K. effervescent tablet market, By Type, 2019-2028 (USD Million)
TABLE 394 U.K. effervescent tablet market, By Indication, 2019-2028 (USD Million)
TABLE 395 U.K. effervescent tablet market, By Population Type, 2019-2028 (USD Million)
TABLE 396 U.K. effervescent tablet market, By Application, 2019-2028 (USD Million)
TABLE 397 U.K. effervescent tablet market, By End User, 2019-2028 (USD Million)
TABLE 398 U.K. effervescent tablet market, By Distribution Channel, 2019-2028 (USD Million)
TABLE 399 Spain effervescent tablet market, By Products, 2019-2028 (USD Million)
TABLE 400 Spain Supplements in effervescent tablet market, By Products, 2019-2028 (USD Million)
TABLE 401 Spain Medication in effervescent tablet market, By Products, 2019-2028 (USD Million)
TABLE 402 Spain effervescent tablet market, By Methods, 2019-2028 (USD Million)
TABLE 403 Spain Wet Granulation in effervescent tablet market, By Methods, 2019-2028 (USD Million)
TABLE 404 Spain effervescent tablet market, By Type, 2019-2028 (USD Million)
TABLE 405 Spain effervescent tablet market, By Indication, 2019-2028 (USD Million)
TABLE 406 Spain effervescent tablet market, By Population Type, 2019-2028 (USD Million)
TABLE 407 Spain effervescent tablet market, By Application, 2019-2028 (USD Million)
TABLE 408 Spain effervescent tablet market, By End User, 2019-2028 (USD Million)
TABLE 409 Spain effervescent tablet market, By Distribution Channel, 2019-2028 (USD Million)
TABLE 410 Netherlands effervescent tablet market, By Products, 2019-2028 (USD Million)
TABLE 411 Netherlands Supplements in effervescent tablet market, By Products, 2019-2028 (USD Million)
TABLE 412 Netherlands Medication in effervescent tablet market, By Products, 2019-2028 (USD Million)
TABLE 413 Netherlands effervescent tablet market, By Methods, 2019-2028 (USD Million)
TABLE 414 Netherlands Wet Granulation in effervescent tablet market, By Methods, 2019-2028 (USD Million)
TABLE 415 Netherlands effervescent tablet market, By Type, 2019-2028 (USD Million)
TABLE 416 Netherlands effervescent tablet market, By Indication, 2019-2028 (USD Million)
TABLE 417 Netherlands effervescent tablet market, By Population Type, 2019-2028 (USD Million)
TABLE 418 Netherlands effervescent tablet market, By Application, 2019-2028 (USD Million)
TABLE 419 Netherlands effervescent tablet market, By End User, 2019-2028 (USD Million)
TABLE 420 Netherlands effervescent tablet market, By Distribution Channel, 2019-2028 (USD Million)
TABLE 421 Russia effervescent tablet market, By Products, 2019-2028 (USD Million)
TABLE 422 Russia Supplements in effervescent tablet market, By Products, 2019-2028 (USD Million)
TABLE 423 Russia Medication in effervescent tablet market, By Products, 2019-2028 (USD Million)
TABLE 424 Russia effervescent tablet market, By Methods, 2019-2028 (USD Million)
TABLE 425 Russia Wet Granulation in effervescent tablet market, By Methods, 2019-2028 (USD Million)
TABLE 426 Russia effervescent tablet market, By Type, 2019-2028 (USD Million)
TABLE 427 Russia effervescent tablet market, By Indication, 2019-2028 (USD Million)
TABLE 428 Russia effervescent tablet market, By Population Type, 2019-2028 (USD Million)
TABLE 429 Russia effervescent tablet market, By Application, 2019-2028 (USD Million)
TABLE 430 Russia effervescent tablet market, By End User, 2019-2028 (USD Million)
TABLE 431 Russia effervescent tablet market, By Distribution Channel, 2019-2028 (USD Million)
TABLE 432 Switzerland effervescent tablet market, By Products, 2019-2028 (USD Million)
TABLE 433 Switzerland Supplements in effervescent tablet market, By Products, 2019-2028 (USD Million)
TABLE 434 Switzerland Medication in effervescent tablet market, By Products, 2019-2028 (USD Million)
TABLE 435 Switzerland effervescent tablet market, By Methods, 2019-2028 (USD Million)
TABLE 436 Switzerland Wet Granulation in effervescent tablet market, By Methods, 2019-2028 (USD Million)
TABLE 437 Switzerland effervescent tablet market, By Type, 2019-2028 (USD Million)
TABLE 438 Switzerland effervescent tablet market, By Indication, 2019-2028 (USD Million)
TABLE 439 Switzerland effervescent tablet market, By Population Type, 2019-2028 (USD Million)
TABLE 440 Switzerland effervescent tablet market, By Application, 2019-2028 (USD Million)
TABLE 441 Switzerland effervescent tablet market, By End User, 2019-2028 (USD Million)
TABLE 442 Switzerland effervescent tablet market, By Distribution Channel, 2019-2028 (USD Million)
TABLE 443 Turkey effervescent tablet market, By Products, 2019-2028 (USD Million)
TABLE 444 Turkey Supplements in effervescent tablet market, By Products, 2019-2028 (USD Million)
TABLE 445 Turkey Medication in effervescent tablet market, By Products, 2019-2028 (USD Million)
TABLE 446 Turkey effervescent tablet market, By Methods, 2019-2028 (USD Million)
TABLE 447 Turkey Wet Granulation in effervescent tablet market, By Methods, 2019-2028 (USD Million)
TABLE 448 Turkey effervescent tablet market, By Type, 2019-2028 (USD Million)
TABLE 449 Turkey effervescent tablet market, By Indication, 2019-2028 (USD Million)
TABLE 450 Turkey effervescent tablet market, By Population Type, 2019-2028 (USD Million)
TABLE 451 Turkey effervescent tablet market, By Application, 2019-2028 (USD Million)
TABLE 452 Turkey effervescent tablet market, By End User, 2019-2028 (USD Million)
TABLE 453 Turkey effervescent tablet market, By Distribution Channel, 2019-2028 (USD Million)
TABLE 454 Austria effervescent tablet market, By Products, 2019-2028 (USD Million)
TABLE 455 Austria Supplements in effervescent tablet market, By Products, 2019-2028 (USD Million)
TABLE 456 Austria Medication in effervescent tablet market, By Products, 2019-2028 (USD Million)
TABLE 457 Austria effervescent tablet market, By Methods, 2019-2028 (USD Million)
TABLE 458 Austria Wet Granulation in effervescent tablet market, By Methods, 2019-2028 (USD Million)
TABLE 459 Austria effervescent tablet market, By Type, 2019-2028 (USD Million)
TABLE 460 Austria effervescent tablet market, By Indication, 2019-2028 (USD Million)
TABLE 461 Austria effervescent tablet market, By Population Type, 2019-2028 (USD Million)
TABLE 462 Austria effervescent tablet market, By Application, 2019-2028 (USD Million)
TABLE 463 Austria effervescent tablet market, By End User, 2019-2028 (USD Million)
TABLE 464 Austria effervescent tablet market, By Distribution Channel, 2019-2028 (USD Million)
TABLE 465 Norway effervescent tablet market, By Products, 2019-2028 (USD Million)
TABLE 466 Norway Supplements in effervescent tablet market, By Products, 2019-2028 (USD Million)
TABLE 467 Norway Medication in effervescent tablet market, By Products, 2019-2028 (USD Million)
TABLE 468 Norway effervescent tablet market, By Methods, 2019-2028 (USD Million)
TABLE 469 Norway Wet Granulation in effervescent tablet market, By Methods, 2019-2028 (USD Million)
TABLE 470 Norway effervescent tablet market, By Type, 2019-2028 (USD Million)
TABLE 471 Norway effervescent tablet market, By Indication, 2019-2028 (USD Million)
TABLE 472 Norway effervescent tablet market, By Population Type, 2019-2028 (USD Million)
TABLE 473 Norway effervescent tablet market, By Application, 2019-2028 (USD Million)
TABLE 474 Norway effervescent tablet market, By End User, 2019-2028 (USD Million)
TABLE 475 Norway effervescent tablet market, By Distribution Channel, 2019-2028 (USD Million)
TABLE 476 Hungary effervescent tablet market, By Products, 2019-2028 (USD Million)
TABLE 477 Hungary Supplements in effervescent tablet market, By Products, 2019-2028 (USD Million)
TABLE 478 Hungary Medication in effervescent tablet market, By Products, 2019-2028 (USD Million)
TABLE 479 Hungary effervescent tablet market, By Methods, 2019-2028 (USD Million)
TABLE 480 Hungary Wet Granulation in effervescent tablet market, By Methods, 2019-2028 (USD Million)
TABLE 481 Hungary effervescent tablet market, By Type, 2019-2028 (USD Million)
TABLE 482 Hungary effervescent tablet market, By Indication, 2019-2028 (USD Million)
TABLE 483 Hungary effervescent tablet market, By Population Type, 2019-2028 (USD Million)
TABLE 484 Hungary effervescent tablet market, By Application, 2019-2028 (USD Million)
TABLE 485 Hungary effervescent tablet market, By End User, 2019-2028 (USD Million)
TABLE 486 Hungary effervescent tablet market, By Distribution Channel, 2019-2028 (USD Million)
TABLE 487 Lithuania effervescent tablet market, By Products, 2019-2028 (USD Million)
TABLE 488 Lithuania Supplements in effervescent tablet market, By Products, 2019-2028 (USD Million)
TABLE 489 Lithuania Medication in effervescent tablet market, By Products, 2019-2028 (USD Million)
TABLE 490 Lithuania effervescent tablet market, By Methods, 2019-2028 (USD Million)
TABLE 491 Lithuania Wet Granulation in effervescent tablet market, By Methods, 2019-2028 (USD Million)
TABLE 492 Lithuania effervescent tablet market, By Type, 2019-2028 (USD Million)
TABLE 493 Lithuania effervescent tablet market, By Indication, 2019-2028 (USD Million)
TABLE 494 Lithuania effervescent tablet market, By Population Type, 2019-2028 (USD Million)
TABLE 495 Lithuania effervescent tablet market, By Application, 2019-2028 (USD Million)
TABLE 496 Lithuania effervescent tablet market, By End User, 2019-2028 (USD Million)
TABLE 497 Lithuania effervescent tablet market, By Distribution Channel, 2019-2028 (USD Million)
TABLE 498 Ireland effervescent tablet market, By Products, 2019-2028 (USD Million)
TABLE 499 Ireland Supplements in effervescent tablet market, By Products, 2019-2028 (USD Million)
TABLE 500 Ireland Medication in effervescent tablet market, By Products, 2019-2028 (USD Million)
TABLE 501 Ireland effervescent tablet market, By Methods, 2019-2028 (USD Million)
TABLE 502 Ireland Wet Granulation in effervescent tablet market, By Methods, 2019-2028 (USD Million)
TABLE 503 Ireland effervescent tablet market, By Type, 2019-2028 (USD Million)
TABLE 504 Ireland effervescent tablet market, By Indication, 2019-2028 (USD Million)
TABLE 505 Ireland effervescent tablet market, By Population Type, 2019-2028 (USD Million)
TABLE 506 Ireland effervescent tablet market, By Application, 2019-2028 (USD Million)
TABLE 507 Ireland effervescent tablet market, By End User, 2019-2028 (USD Million)
TABLE 508 Ireland effervescent tablet market, By Distribution Channel, 2019-2028 (USD Million)
TABLE 509 Poland effervescent tablet market, By Products, 2019-2028 (USD Million)
TABLE 510 Poland Supplements in effervescent tablet market, By Products, 2019-2028 (USD Million)
TABLE 511 Poland Medication in effervescent tablet market, By Products, 2019-2028 (USD Million)
TABLE 512 Poland effervescent tablet market, By Methods, 2019-2028 (USD Million)
TABLE 513 Poland Wet Granulation in effervescent tablet market, By Methods, 2019-2028 (USD Million)
TABLE 514 Poland effervescent tablet market, By Type, 2019-2028 (USD Million)
TABLE 515 Poland effervescent tablet market, By Indication, 2019-2028 (USD Million)
TABLE 516 Poland effervescent tablet market, By Population Type, 2019-2028 (USD Million)
TABLE 517 Poland effervescent tablet market, By Application, 2019-2028 (USD Million)
TABLE 518 Poland effervescent tablet market, By End User, 2019-2028 (USD Million)
TABLE 519 Poland effervescent tablet market, By Distribution Channel, 2019-2028 (USD Million)
TABLE 520 REST OF Europe effervescent tablet market, By Products, 2019-2028 (USD Million)
List of Figure
FIGURE 1 Global Effervescent tablet market: segmentation
FIGURE 2 Global Effervescent tablet market: data triangulation
FIGURE 3 Global Effervescent tablet market: DROC ANALYSIS
FIGURE 4 Global Effervescent tablet market: global vs REGIONAL MARKET ANALYSIS
FIGURE 5 Global Effervescent tablet market : COMPANY RESEARCH ANALYSIS
FIGURE 6 Global Effervescent tablet market: INTERVIEW DEMOGRAPHICS
FIGURE 7 Global Effervescent tablet market: DBMR MARKET POSITION GRID
FIGURE 8 GLOBAL Effervescent tablet MARKET: MARKET APPLICATION COVERAGE GRID
FIGURE 9 Global Effervescent tablet market: vendor share analysis
FIGURE 10 Global Effervescent tablet market: SEGMENTATION
FIGURE 11 Increase in chronic diseases and R&D activities are expected to drive THE Global Effervescent tablet market IN THE FORECAST PERIOD of 2021 to 2028
FIGURE 12 DIAGNOSIS segment is expected to account for the largest share of the Global Effervescent tablet market in 2021 & 2028
FIGURE 13 NORTH AMERICA is expected to DOMINATE the gLOBAL Effervescent tablet market and ASIA-PACIFIC IS EXPECTED TO GROW WITH THE HIGHEST CAGR IN THE FORECAST PERIOD OF 2021 TO 2028
FIGURE 14 asia-pacific is the fastest growing market for Effervescent tablet manufacturers in the forecast period of 2021 to 2028
FIGURE 15 DRIVERS, RESTRAINTS, OPPORTUNITIES AND CHALLENGEs OF Global EFFERVESCENT TABLET MARKET
FIGURE 16 global effervescent tablet market: BY PRODUCTS, 2020
FIGURE 17 global effervescent tablet market: BY PRODUCTS, 2020-2028 (USD Million)
FIGURE 18 global effervescent tablet market: BY PRODUCTS, CAGR (2021-2028)
FIGURE 19 global effervescent tablet market: BY PRODUCTS, LIFELINE CURVE
FIGURE 20 global effervescent tablet market: BY METHOD, 2020
FIGURE 21 global effervescent tablet market: BY METHOD, 2020-2028 (USD Million)
FIGURE 22 global effervescent tablet market: BY METHOD, CAGR (2021-2028)
FIGURE 23 global effervescent tablet market: BY METHOD, LIFELINE CURVE
FIGURE 24 global effervescent tablet market: BY TYPE, 2020
FIGURE 25 global effervescent tablet market: BY TYPE, 2020-2028 (USD Million)
FIGURE 26 global effervescent tablet market: BY TYPE, CAGR (2021-2028)
FIGURE 27 global effervescent tablet market: BY TYPE, LIFELINE CURVE
FIGURE 28 global effervescent tablet market: BY INDICATION, 2020
FIGURE 29 global effervescent tablet market: BY INDICATION, 2020-2028 (USD Million)
FIGURE 30 global effervescent tablet market: BY INDICATION, CAGR (2021-2028)
FIGURE 31 global effervescent tablet market: BY INDICATION, LIFELINE CURVE
FIGURE 32 global effervescent tablet market: BY POPULATION TYPE, 2020
FIGURE 33 global effervescent tablet market: BY POPULATION TYPE, 2020-2028 (USD Million)
FIGURE 34 global effervescent tablet market: BY POPULATION TYPE, CAGR (2021-2028)
FIGURE 35 global effervescent tablet market: BY POPULATION TYPE, LIFELINE CURVE
FIGURE 36 global effervescent tablet market: BY APPLICATION, 2020
FIGURE 37 global effervescent tablet market: BY APPLICATION, 2020-2028 (USD Million)
FIGURE 38 global effervescent tablet market: BY APPLICATION, CAGR (2021-2028)
FIGURE 39 global effervescent tablet market: BY APPLICATION, LIFELINE CURVE
FIGURE 40 global effervescent tablet market: BY END USER, 2020
FIGURE 41 global effervescent tablet market: BY END USER, 2020-2028 (USD Million)
FIGURE 42 global effervescent tablet market: BY END USER, CAGR (2021-2028)
FIGURE 43 global effervescent tablet market: BY END USER, LIFELINE CURVE
FIGURE 44 global effervescent tablet market: BY DISTRIBUTION CHANNEL, 2020
FIGURE 45 global effervescent tablet market: BY DISTRIBUTION CHANNEL, 2020-2028 (USD Million)
FIGURE 46 global effervescent tablet market: BY DISTRIBUTION CHANNEL, CAGR (2021-2028)
FIGURE 47 global effervescent tablet market: BY DISTRIBUTION CHANNEL, LIFELINE CURVE
FIGURE 48 GLOBAL Effervescent tablet market: SNAPSHOT (2020)
FIGURE 49 GLOBAL Effervescent tablet market: BY REGION (2020)
FIGURE 50 GLOBAL Effervescent tablet market: BY REGION (2021 & 2028)
FIGURE 51 GLOBAL Effervescent tablet market: BY REGION (2020 & 2028)
FIGURE 52 GLOBAL Effervescent tablet market: BY products (2021-2028)
FIGURE 53 NORTH AMERICA effervescent tablet market: SNAPSHOT (2020)
FIGURE 54 NORTH AMERICA EFFERVESCENT TABLET Market: BY COUNTRY (2020)
FIGURE 55 NORTH AMERICA EFFERVESCENT TABLET Market: BY COUNTRY (2021 & 2028)
FIGURE 56 NORTH AMERICA EFFERVESCENT TABLET Market: BY COUNTRY (2020 & 2028)
FIGURE 57 NORTH AMERICA EFFERVESCENT TABLET Market: BY Products (2021-2028)
FIGURE 58 SOUTH AMERICA effervescent tablet market: SNAPSHOT (2020)
FIGURE 59 SOUTH AMERICA EFFERVESCENT TABLET Market: BY COUNTRY (2020)
FIGURE 60 SOUTH AMERICA EFFERVESCENT TABLET Market: BY COUNTRY (2021 & 2028)
FIGURE 61 SOUTH AMERICA EFFERVESCENT TABLET Market: BY COUNTRY (2020 & 2028)
FIGURE 62 SOUTH AMERICA EFFERVESCENT TABLET Market: BY Products (2021-2028)
FIGURE 63 MIDDLE EAST & AFRICA Effervescent tablet market: SNAPSHOT (2020)
FIGURE 64 MIDDLE EAST & AFRICA Effervescent tablet market: BY COUNTRY (2020)
FIGURE 65 MIDDLE EAST & AFRICA Effervescent tablet market: BY COUNTRY (2021 & 2028)
FIGURE 66 MIDDLE EAST & AFRICA Effervescent tablet market: BY COUNTRY (2020 & 2028)
FIGURE 67 MIDDLE EAST & AFRICA Effervescent tablet market: BY Products (2021-2028)
FIGURE 68 ASIA-PACIFIC Effervescent tablet market: SNAPSHOT (2020)
FIGURE 69 ASIA-PACIFIC Effervescent tablet market: BY COUNTRY (2020)
FIGURE 70 ASIA-PACIFIC Effervescent tablet market: BY COUNTRY (2021 & 2028)
FIGURE 71 ASIA-PACIFIC Effervescent tablet market: BY COUNTRY (2020 & 2028)
FIGURE 72 ASIA-PACIFIC Effervescent tablet market: BY Products (2021-2028)
FIGURE 73 EUROPE effervescent tablet market: SNAPSHOT (2020)
FIGURE 74 EUROPE EFFERVESCENT TABLET Market: BY COUNTRY (2020)
FIGURE 75 EUROPE EFFERVESCENT TABLET Market: BY COUNTRY (2021 & 2028)
FIGURE 76 EUROPE EFFERVESCENT TABLET Market: BY COUNTRY (2020 & 2028)
FIGURE 77 EUROPE EFFERVESCENT TABLET Market: BY Products (2021-2028)
FIGURE 78 Global effervescent tablet Market: company share 2020 (%)
FIGURE 79 North America effervescent tablet Market: company share 2020 (%)
FIGURE 80 Europe effervescent tablet Market: company share 2020 (%)
FIGURE 81 Asia-Pacific effervescent tablet Market: company share 2020 (%)
منهجية البحث
يتم جمع البيانات وتحليل سنة الأساس باستخدام وحدات جمع البيانات ذات أحجام العينات الكبيرة. تتضمن المرحلة الحصول على معلومات السوق أو البيانات ذات الصلة من خلال مصادر واستراتيجيات مختلفة. تتضمن فحص وتخطيط جميع البيانات المكتسبة من الماضي مسبقًا. كما تتضمن فحص التناقضات في المعلومات التي شوهدت عبر مصادر المعلومات المختلفة. يتم تحليل بيانات السوق وتقديرها باستخدام نماذج إحصائية ومتماسكة للسوق. كما أن تحليل حصة السوق وتحليل الاتجاهات الرئيسية هي عوامل النجاح الرئيسية في تقرير السوق. لمعرفة المزيد، يرجى طلب مكالمة محلل أو إرسال استفسارك.
منهجية البحث الرئيسية التي يستخدمها فريق بحث DBMR هي التثليث البيانات والتي تتضمن استخراج البيانات وتحليل تأثير متغيرات البيانات على السوق والتحقق الأولي (من قبل خبراء الصناعة). تتضمن نماذج البيانات شبكة تحديد موقف البائعين، وتحليل خط زمني للسوق، ونظرة عامة على السوق ودليل، وشبكة تحديد موقف الشركة، وتحليل براءات الاختراع، وتحليل التسعير، وتحليل حصة الشركة في السوق، ومعايير القياس، وتحليل حصة البائعين على المستوى العالمي مقابل الإقليمي. لمعرفة المزيد عن منهجية البحث، أرسل استفسارًا للتحدث إلى خبراء الصناعة لدينا.
التخصيص متاح
تعد Data Bridge Market Research رائدة في مجال البحوث التكوينية المتقدمة. ونحن نفخر بخدمة عملائنا الحاليين والجدد بالبيانات والتحليلات التي تتطابق مع هدفهم. ويمكن تخصيص التقرير ليشمل تحليل اتجاه الأسعار للعلامات التجارية المستهدفة وفهم السوق في بلدان إضافية (اطلب قائمة البلدان)، وبيانات نتائج التجارب السريرية، ومراجعة الأدبيات، وتحليل السوق المجدد وقاعدة المنتج. ويمكن تحليل تحليل السوق للمنافسين المستهدفين من التحليل القائم على التكنولوجيا إلى استراتيجيات محفظة السوق. ويمكننا إضافة عدد كبير من المنافسين الذين تحتاج إلى بيانات عنهم بالتنسيق وأسلوب البيانات الذي تبحث عنه. ويمكن لفريق المحللين لدينا أيضًا تزويدك بالبيانات في ملفات Excel الخام أو جداول البيانات المحورية (كتاب الحقائق) أو مساعدتك في إنشاء عروض تقديمية من مجموعات البيانات المتوفرة في التقرير.