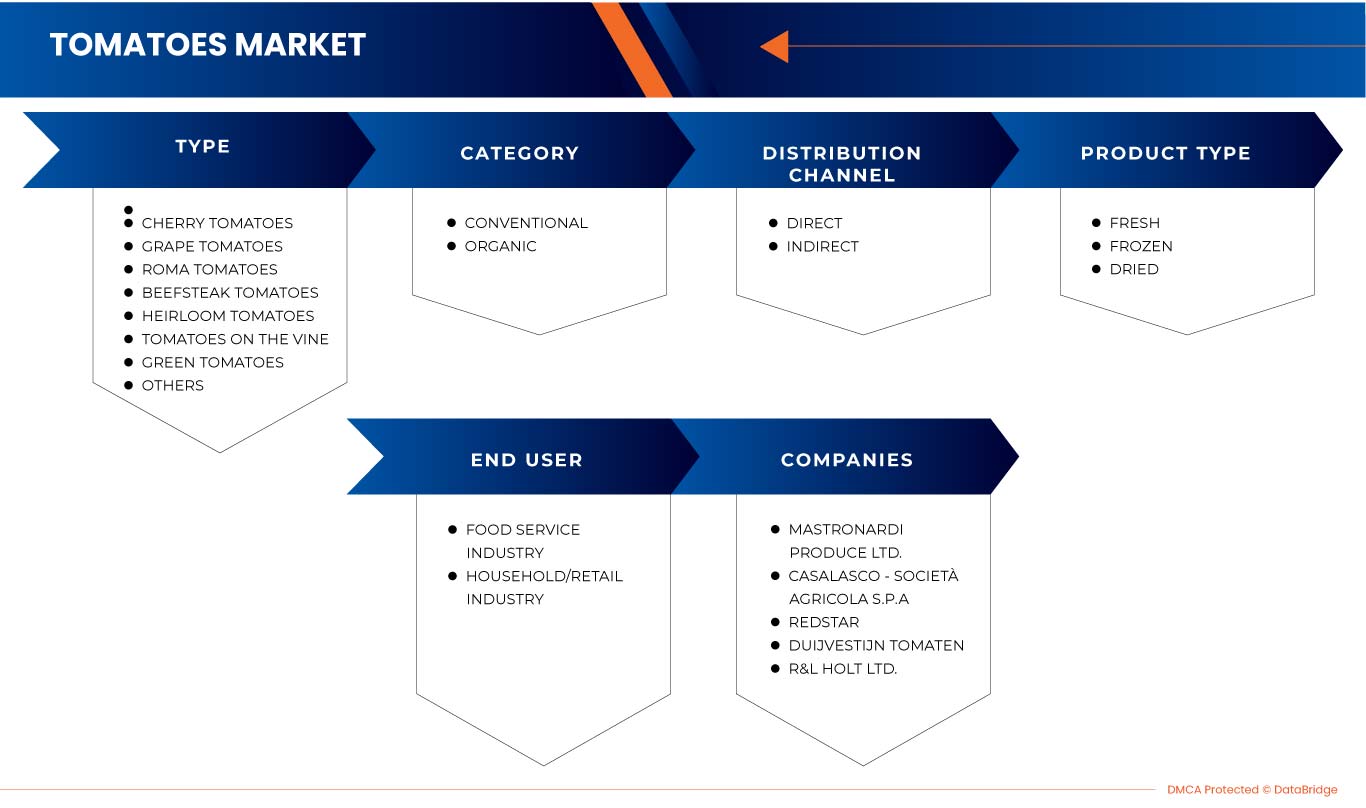
سوق الطماطم في أوروبا، حسب النوع (طماطم الكرز، طماطم العنب، طماطم روما، طماطم على الكرمة، طماطم لحم البقر، طماطم موروثة، طماطم خضراء، وغيرها)، نوع المنتج (طازج ومجمد ومجفف)، الفئة (تقليدي وعضوي)، المستخدم النهائي (صناعة خدمات الأغذية وصناعة الأسر / التجزئة)، قناة التوزيع (مباشرة وغير مباشرة) - اتجاهات الصناعة وتوقعاتها حتى عام 2030.
تحليل وحجم سوق الطماطم في أوروبا
إن سوق الطماطم في أوروبا مدفوع بالعديد من الفوائد التي تقدمها لكل من الشركات والموظفين. كما أن سوق الطماطم مدفوع أيضًا بزيادة الطلب على الطماطم في صناعة تجهيز الأغذية. يحتاج سوق B2B إلى الطماطم حيث يتم استخدامها كمادة خام لصنع منتجات الطماطم المصنعة الأخرى. تُستخدم الطماطم في أشكال مختلفة، بما في ذلك العصير والمعجون والهريس والطماطم المقطعة/المقشرة وصلصة الطماطم والمخللات والصلصات والكاري الجاهز للأكل، والتي تعمل في النهاية كمحرك لنمو السوق. زاد العدد المتزايد من مجموعات العمل وطلب جيل الألفية على الطماطم وأشكالها المختلفة بشكل كبير. إن التقدم التكنولوجي المتزايد في إنتاج الطماطم يمثل فرصة لدخول هذه السوق المتوسعة. ومع ذلك، فإن التقلبات في أسعار الطماطم هي أحد العوامل الرئيسية المقيدة التي تحد من نمو السوق.
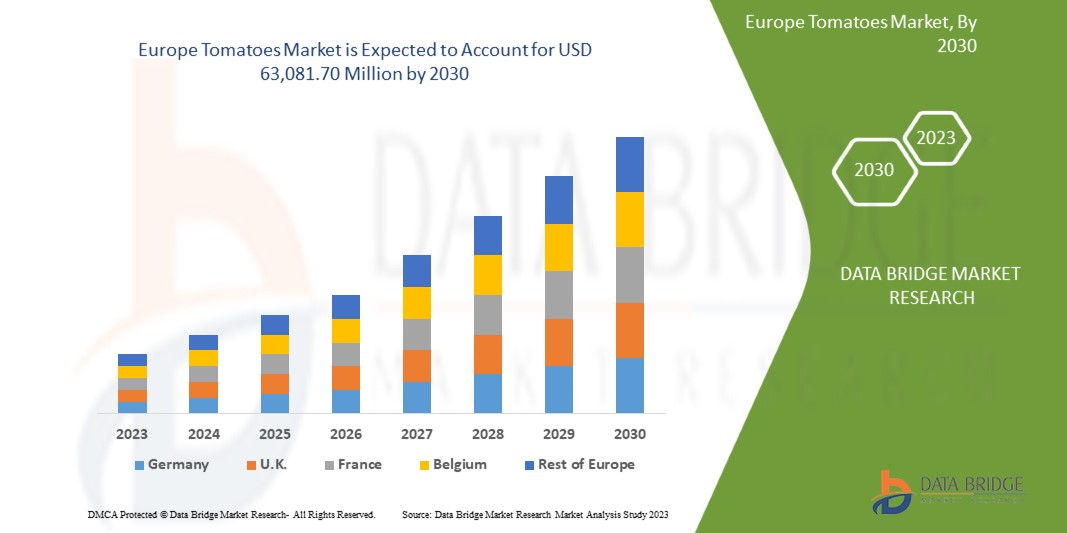
تحلل شركة Data Bridge Market Research أن سوق الطماطم في أوروبا من المتوقع أن تصل قيمتها إلى 63،081.70 مليون دولار أمريكي بحلول عام 2030، بمعدل نمو سنوي مركب قدره 3.4٪ خلال الفترة المتوقعة من 2023 إلى 2030.
|
تقرير القياس |
تفاصيل |
|
فترة التنبؤ |
2023 إلى 2030 |
|
سنة الأساس |
2022 |
|
سنة تاريخية |
2021 (قابلة للتخصيص حتى 2015-2020) |
|
وحدات كمية |
الإيرادات بالملايين، التسعير بالدولار الأمريكي، الحجم بالوحدات |
|
القطاعات المغطاة |
النوع (طماطم كرزية، طماطم عنبية، طماطم روما، طماطم على الكرمة، طماطم لحم البقر، طماطم موروثة، طماطم خضراء، وغيرها)، نوع المنتج (طازج، مجمد، ومجفف)، الفئة (تقليدي وعضوي ) ، المستخدم النهائي ( صناعة خدمات الأغذية وصناعة السلع المنزلية/التجزئة)، قناة التوزيع (مباشرة وغير مباشرة) |
|
الدول المغطاة |
تركيا، روسيا، إسبانيا، إيطاليا، فرنسا، ألمانيا، بولندا، المملكة المتحدة، بلجيكا، هولندا، السويد، سويسرا، فنلندا، الدنمارك، النرويج، وبقية أوروبا |
|
الجهات الفاعلة في السوق المشمولة |
CASALASCO - SOCIETÀ AGRICOLA SpA (كريمونا، إيطاليا)، وDuijvestijn Tomatoes (بيناكر، هولندا)، وR&L Holt Ltd. (إفيشام، أوروبا)، وREDSTAR Sales BV (دي ليير، هولندا)، وMASTRONARDI PRODUCE LTD (أونتاريو، كندا) وغيرها |
تعريف السوق
الطماطم هي في الأساس خضروات مستديرة الشكل يمكن تناولها مطبوخة أو غير مطبوخة. وهي عبارة عن ثمار صالحة للأكل من عشبة Solanum lycoperscium. وهي تأتي بألوان عديدة مثل الأحمر والأصفر والبرتقالي وغيرها الكثير. وهي من أنواع عديدة ذات مذاق واستخدامات مختلفة.
تستخدم الطماطم على نطاق واسع في صناعة الأغذية والمشروبات، حيث تستخدم في إنتاج الحساء والصلصات والمهروسات والعصائر والكاتشب وغيرها. كما تستخدم أيضًا كخضروات نيئة في البرجر والسندويشات والسلطات والبيتزا وغير ذلك الكثير.
تعد الطماطم مصدرًا أساسيًا في صناعات تجهيز الأغذية ولها تطبيقات واسعة، كما تحتوي أيضًا على مكونات أساسية مفيدة لجسم الإنسان. فهي تساعد في الحفاظ على ضغط الدم وصحة الجلد ولها أيضًا تأثير مضاد للالتهابات.
ديناميكيات سوق الطماطم في أوروبا
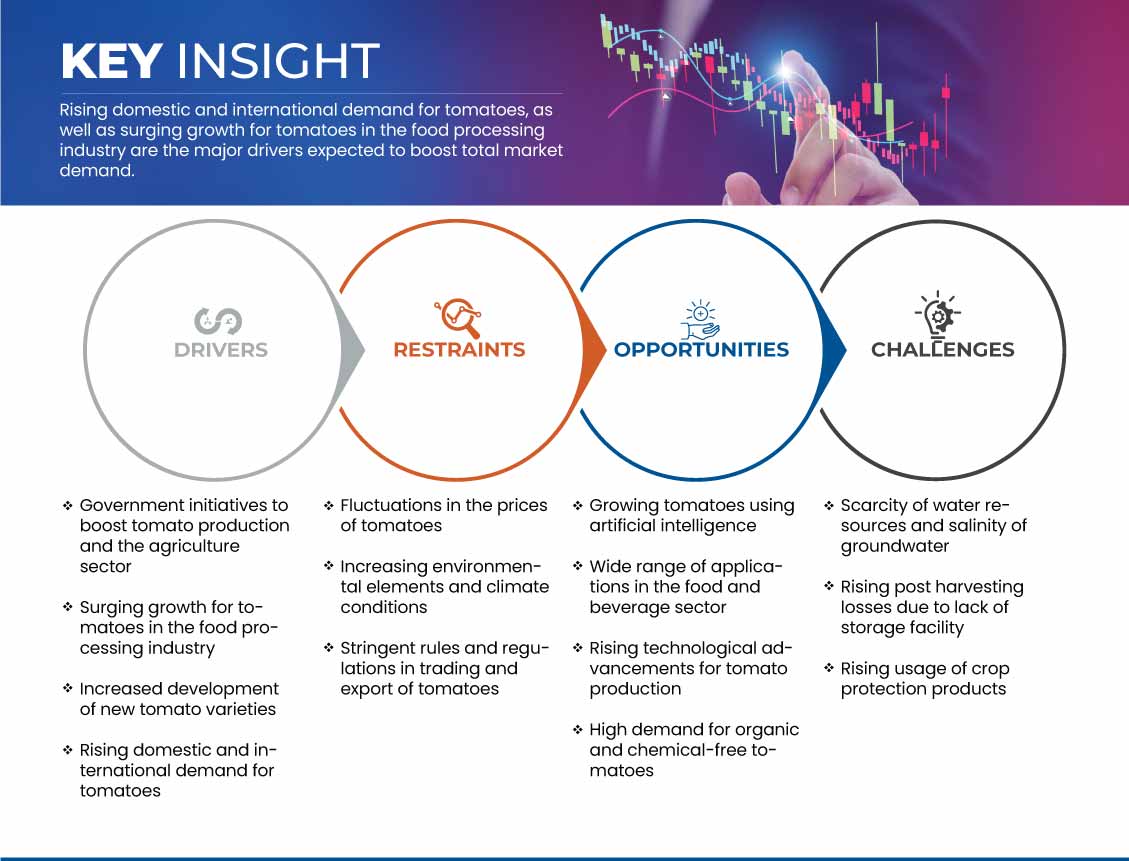
يتناول هذا القسم فهم محركات السوق والمزايا والفرص والقيود والتحديات. وسيتم مناقشة كل هذا بالتفصيل أدناه:
السائقين
- مبادرات حكومية لتعزيز إنتاج الطماطم والقطاع الزراعي
مع زيادة عدد السكان وارتفاع الطلب على الفواكه والخضروات الطازجة، بذلت الحكومة العديد من الجهود لزيادة إنتاج المحاصيل ومعالجتها. ومن خلال الكثير من البحث والتطوير في مجال العلوم والتكنولوجيا، توصلت الحكومة إلى العديد من المبادرات لزيادة إنتاج الطماطم لتلبية الطلب على الطماطم وغيرها من المنتجات الزراعية. تمول الحكومة مؤسسات بحثية مثل معهد أبحاث الطماطم في كاليفورنيا، وخدمة أبحاث الزراعة (ARS)، وICAR-IIHR في الهند لتطوير أصناف جديدة مثل Pusa Ruby وPusa Gaurav وChhuhara. هذه الأصناف عالية الغلة تعطي غلة أكبر وهي أيضًا أكثر مقاومة للأمراض والآفات، وهو أمر مهم جدًا لزيادة الإنتاج ويجعلها أقل عرضة للكوارث الطبيعية.
كما تعمل الحكومة على صياغة سياسات التصدير والاستيراد التي تركز على استيراد وتصدير المنتجات الزراعية، الأمر الذي سيساعد المزارعين والموردين على مواكبة الطلب العالمي على الطماطم وغيرها من المنتجات المتوقع أن تدفع نمو السوق. وبالتالي، فإن المبادرات المختلفة التي اتخذتها الهيئات الحكومية لتعزيز إنتاج ومعالجة الطماطم من شأنها أن تعمل على تسريع نمو السوق.
- نمو متزايد للطماطم في صناعة تجهيز الأغذية
تحتاج سوق B2B إلى الطماطم لأنها تُستخدم كمادة خام لصنع منتجات الطماطم المعالجة الأخرى. تُستخدم الطماطم بأشكال مختلفة، بما في ذلك العصير والمعجون والهريس والطماطم المقطعة/المقشرة والكاتشب والمخللات والصلصات والكاري الجاهز للأكل. هناك العديد من الاستخدامات لمنتجات الطماطم المعالجة في قطاع الأغذية، مثل الوجبات الخفيفة والمأكولات والفنادق والمطاعم وسلاسل بيع الوجبات السريعة. يمكن تناولها مطبوخة وغير مطبوخة ولها طلب مرتفع في سوق أوروبا. بسبب التحضر السريع، ينجذب المستهلكون في البلدان الناشئة والمتقدمة إلى تناول الأطعمة الجاهزة ومنتجات الطماطم المعالجة. لتلبية الطلب المتزايد، يركز مصنعو الأطعمة المعالجة ومعالجو معجون الطماطم على المنتجات الجاهزة للأكل.
بالإضافة إلى ذلك، يتوسع نطاق الأطعمة المصنعة بالطماطم مع طرح منتجات الطماطم المتنوعة، بما في ذلك المنتجات القائمة على المسحوق. معجون الطماطم وهريس الطماطم هما المنتجان الرئيسيان للطماطم المصنعة. ويمكن تصنيع المنتجات المصنعة الثانوية للطماطم من خلال معالجة المنتجات الأولية. والسوق الرئيسية لمعجون الطماطم وهريسها هي قطاع الكاتشب والصلصة. وتعد صناعة المشروبات والأغذية ثاني أكبر مستخدم لمعجون الطماطم وهريسها.
مع العدد المتزايد من مجموعات العمل والسكان من جيل الألفية، زاد الطلب على الطماطم وأشكالها المختلفة بشكل كبير في قطاع الوجبات السريعة، مما أدى إلى صناعة المقاهي وقاعات الطعام الجامعية والفنادق والنزل والمطاعم وتجهيز الأغذية، مما يساهم في نهاية المطاف في نمو السوق.
ضبط النفس
- تقلبات أسعار الطماطم
إن الأسواق الأوروبية المتقلبة وغير المتوقعة لها عواقب بعيدة المدى على الشركات الصناعية. فالحواجز غير المتوقعة مثل ارتفاع تكاليف الطاقة والاختلافات غير المتوقعة في أسعار المواد الخام تعمل على تعطيل سلاسل التوريد وتجعل من الصعب على الشركات الحفاظ على الربحية. كما أن الاختلافات في أسعار المواد الخام المستخدمة في صنع الصلصات والتوابل والتوابل في عبوات التعبئة الساخنة تزيد من التكاليف الإضافية على سعر المنتج النهائي. ويمكن أن يؤدي الحصاد الوفير أو كارثة المحاصيل في منطقة إنتاج رئيسية إلى تغيير أسعار الطماطم بسرعة.
أسعار الطماطم متقلبة لأنها تعتمد على عوامل مختلفة مثل موسمية الإنتاج والأمطار غير الموسمية والجفاف المطول. كما تعتمد أيضًا على الموقع والتفضيلات وعمر المستهلكين والقدرة الشرائية للمستهلك. وبسبب موسميتها، ترتفع الأسعار عندما يكون المنتج خارج الموسم وتنخفض عندما يكون في الموسم.
في الهند، يتم إنتاج وحصاد حوالي 70% من الطماطم بين شهري ديسمبر ويونيو، أي عندما تنخفض الأسعار ويزداد العرض. بين شهري يوليو ونوفمبر، يتم حصاد 30% فقط من إجمالي الإنتاج، حيث ترتفع الأسعار بسبب العرض المحدود.
يجد المزارعون والموردون والشركات التي تتعامل في سوق الطماطم صعوبة في الحكم بشكل صحيح على مخاطر التقلبات الكبيرة في تكاليف الطماطم. يمكن أن تؤدي التكاليف المتقلبة للغاية وإدارة الأسعار غير الفعّالة إلى تعريض نجاح الشركات للخطر بشكل خطير. يستخدم المزارعون العديد من مرافق الدفيئات لزراعة الطماطم لتقليل تأثير الطقس على زراعة الطماطم وزيادة الغلة لكل فدان. تتطلب الطماطم المزروعة في الدفيئات بذورًا مختلفة عن تلك المزروعة في بيئتها الطبيعية. ونتيجة لذلك، تكون تكلفة البذور المستخدمة لزراعة الطماطم في الدفيئات أعلى من تلك المستخدمة لزراعة الطماطم في الظروف الطبيعية.
على سبيل المثال،
- في يوليو 2022، وفقًا لمقال نُشر في صحيفة The Economic Times، تميل العوامل الموسمية كل عام من يوليو إلى نوفمبر إلى دفع أسعار الطماطم إلى الارتفاع، حيث يكون الضغط أعلى في يوليو. ومع ذلك، في مارس، يمارس العنصر الموسمي أكبر ضغط هبوطي على الأسعار. نظرًا لأن حوالي 70٪ من الطماطم يتم إنتاجها خلال موسم الربيع. تنجم هذه الموسمية في الأسعار عن النمط الموسمي لإنتاج الطماطم
علاوة على ذلك، فإن زيادة التجارة الأوروبية، والتوسع الحضري، واحتياجات النقل، والطلب على الطاقة، تفرض ضغوطًا إضافية على تكلفة الوسطاء المطلوبين لسوق الطماطم. وبالتالي، فإن التغيرات في تكاليف الطماطم تؤثر على الطلب على المنتج، ومن المتوقع أن تعيق نمو السوق.
تحدي
- ارتفاع خسائر ما بعد الحصاد بسبب نقص مرافق التخزين
وعلى الرغم من العوامل المحركة والفرص المتاحة في سوق الطلب على الطماطم في أوروبا، إلا أن هناك تحديًا معينًا يواجهه المزارع والمورد من شأنه أن يؤثر على إمدادات الطماطم. ويتمثل التحدي في الخسائر بعد الحصاد بسبب طبيعة الطماطم القابلة للتلف ونقص مرافق التخزين بعد الحصاد وأثناء النقل. وتنجم الخسائر بعد الحصاد في المقام الأول عن التعفن والأضرار الميكانيكية وسوء المناولة ودرجة الحرارة غير المناسبة وإدارة الرطوبة النسبية وقضايا النظافة أثناء المناولة. وتتسبب الخسائر بعد الحصاد في انخفاض جودة المنتج، مما يؤدي في النهاية إلى خفض سعره والتأثير سلبًا على توسع السوق.
ومع ذلك، فإن الخسائر التي تحدث بعد الحصاد وغيرها من القضايا تمثل تحديًا خطيرًا لتوسيع السوق. ففي معظم الدول، تتفكك تجارة الطماطم بشكل مطرد بسبب مشاكل ما بعد الحصاد، سواء داخل المزرعة أو خارجها. ولا تستطيع معظم الدول الناشئة إنتاج ما يكفي من الطماطم بمفردها، كما يتضح من استيراد منتجات الطماطم المكتملة. وحتى في حين يوجد دائمًا فائض في السوق، فإن هذا مؤقت فقط لأن الطماطم غير المعالجة يصعب حفظها وقابلة للتلف بسرعة. وبسبب عدم الكفاءة في معالجة الطماطم بعد الحصاد، هناك فجوة في الطلب يتم توفيرها من خلال السلع المصنعة المستوردة. وتؤدي خسائر ما بعد الحصاد هذه إلى خفض القيمة السوقية للمنتج وتعمل كحاجز أمام توسيع السوق.
تشمل خسائر ما بعد الحصاد الأغذية المفقودة على طول سلسلة توريد الغذاء بأكملها، منذ حصاد المحصول حتى استهلاكه. وتنقسم الخسائر إلى عدة فئات: فقدان الوزن بسبب التعفن، وفقدان الجودة، والخسارة الغذائية، وفقدان صلاحية البذور، والخسارة التجارية. ويتسبب نقص مرافق التخزين في الغالب في حدوث هذه الخسائر بعد الحصاد داخل المزارع وخارجها، وهو ما سيشكل تحديًا رئيسيًا لتوسيع السوق.
فرص
- زراعة الطماطم باستخدام الذكاء الاصطناعي
الذكاء الاصطناعي هو فرع واسع النطاق من علوم الكمبيوتر يعمل على بناء آلات ذكية قادرة على أداء المهام التي تتطلب عادةً الذكاء البشري. الذكاء الاصطناعي هو جزء متزايد من الحياة اليومية ويُستخدم في القطاع الزراعي. تركز تقنية الذكاء الاصطناعي على حل العديد من المشكلات لزيادة وتحسين عمليات الإنتاج والتشغيل.
تُستخدم الأساليب الحسابية المتقدمة في الذكاء الاصطناعي لحل العديد من المشكلات الواقعية. ويمكن استخدام هذه الأساليب في الصناعة الزراعية لإجراء أبحاث أصلية من شأنها تعزيز النوع والسرعة والتنوع الجديد والحماية. ويمكن للذكاء الاصطناعي التحقق تلقائيًا من جودة المحصول والعائد وقيمة الرقم الهيدروجيني ونسبة المغذيات وكمية الماء والرطوبة ومكونات الأكسجين اللازمة. وتستخدم العديد من الدول الروبوتات الصغيرة لتقييم جودة المحاصيل ونضجها في الصناعة الزراعية. وتقوم الروبوتات الصغيرة بحصاد الفاكهة والخضروات الناضجة دون إتلاف الجلد الرقيق للطماطم.
تساعد الحلول التي تعمل بالذكاء الاصطناعي المزارعين على تحسين الكفاءة والكمية والجودة وضمان سرعة طرح المحاصيل في السوق. يتم استخدام الذكاء الاصطناعي للتنبؤ بغلة المحاصيل وتوقع الأسعار لتحقيق أقصى قدر من الأرباح. يمكن أن تساعد أجهزة استشعار الذكاء الاصطناعي في تقنيات الرش الذكية من خلال اكتشاف المناطق المصابة بالأعشاب الضارة ورش مبيدات الأعشاب. يمكن أن تساعد الرؤى التنبؤية في تحديد الوقت المناسب لزرع البذور لتحقيق أقصى إنتاجية في ظروف الطقس المختلفة. تساعد الروبوتات الزراعية في حصاد كميات هائلة من المحاصيل بوتيرة أسرع. بمساعدة الذكاء الاصطناعي/التعلم الآلي، يمكن مراقبة صحة المحاصيل، ويمكن اكتشاف عيوب التربة. يمكن تشخيص أمراض النبات من خلال استراتيجيات مناسبة لمساعدة المزارعين.
ومن المتوقع أن توفر زراعة الطماطم باستخدام الذكاء الاصطناعي فرصًا لنمو سوق الطماطم الأوروبية بسبب الحصول على جودة عالية وكمية كبيرة من الغلة لكل وحدة مساحة.
التطورات الأخيرة
- في أبريل 2022، أعلنت شركة CASALASCO - SOCIETÀ AGRICOLA SpA عن شراكتها مع العلامة التجارية rosella الأسترالية. وقد أدت هذه الشراكة إلى تطوير أنواع مختلفة من المنتجات الجديدة، مثل حساء الطماطم والفلفل الحلو المشوي، وحساء الجزر والبطاطس اللذيذ، وحساء اليقطين الكريمي، مما سيساعد بالتأكيد في نمو السوق والشركة.
- في ديسمبر 2021، حصلت شركة CASALASCO - SOCIETÀ AGRICOLA SpA على شهادة GRASP التي تركز على معايير النشاط الزراعي وممارسات الزراعة الخاصة بالشركة. وقد ساعد هذا في توفير الثقة لدى المستهلكين للشركة لتوفير منتجات آمنة وصحية وساعد في نمو الشركة.
نطاق سوق الطماطم في أوروبا
يتم تقسيم سوق الطماطم في أوروبا إلى خمسة قطاعات بارزة بناءً على النوع ونوع المنتج والفئة والمستخدم النهائي وقناة التوزيع. سيساعدك النمو بين هذه القطاعات على تحليل قطاعات النمو الرئيسية في الصناعات وتزويد المستخدمين بنظرة عامة قيمة على السوق ورؤى السوق لاتخاذ قرارات استراتيجية لتحديد تطبيقات السوق الأساسية.
يكتب
- طماطم الكرز
- طماطم العنب
- طماطم روما
- الطماطم على الكرمة
- طماطم لحم البقر
- طماطم موروثة
- الطماطم الخضراء
- آحرون
اعتمادًا على النوع، يتم تقسيم السوق إلى طماطم الكرز، وطماطم العنب، وطماطم روما، وطماطم على الكرمة، وطماطم لحم البقر، وطماطم موروثة، وطماطم خضراء، وغيرها.
نوع المنتج
- طازج
- مجمدة
- مجففة
اعتمادًا على نوع المنتج، يتم تقسيم السوق إلى طازج ومجمد ومجفف.
فئة
- عادي
- عضوي
اعتمادًا على الفئة، يتم تقسيم السوق إلى تقليدي وعضوي.
المستخدم النهائي
- صناعة خدمات الأغذية
- صناعة الأدوات المنزلية/التجزئة
بناءً على المستخدم النهائي، يتم تقسيم السوق إلى صناعة خدمات الأغذية وصناعة المنازل/التجزئة.
قناة التوزيع
- مباشر
- غير مباشر
بناءً على قناة التوزيع، يتم تقسيم السوق إلى مباشر وغير مباشر.
تحليل/رؤى إقليمية لسوق الطماطم في أوروبا
يتم تحليل سوق الطماطم في أوروبا، ويتم توفير رؤى حجم السوق والاتجاهات حسب البلد والنوع ونوع المنتج والفئة والمستخدم النهائي وقناة التوزيع، كما هو مذكور أعلاه.
الدول التي يغطيها هذا التقرير هي تركيا، روسيا، إسبانيا، إيطاليا، فرنسا، ألمانيا، بولندا، المملكة المتحدة، بلجيكا، هولندا، السويد، سويسرا، فنلندا، الدنمارك، النرويج وبقية دول أوروبا.
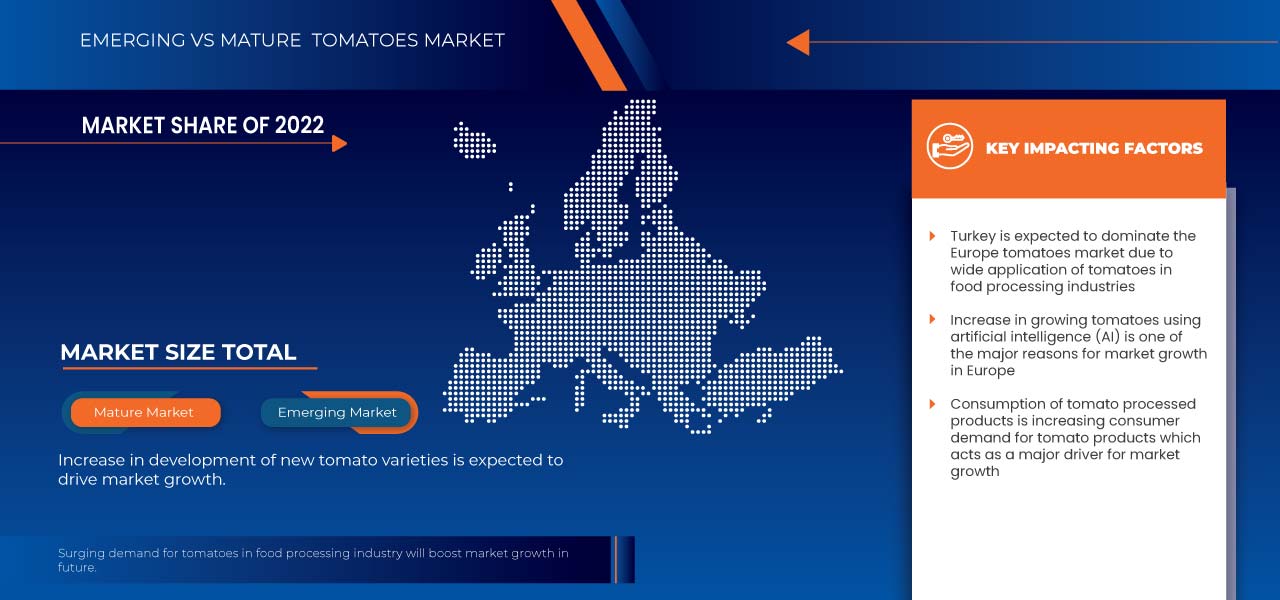
تسيطر تركيا على سوق الطماطم في أوروبا. ويُعد الطلب المتزايد من صناعة المعالجة على منتجات الطماطم المصنعة في جميع أنحاء العالم السبب الرئيسي وراء نمو السوق في تركيا. ومع ذلك، من المرجح أن تحد التكلفة المرتفعة للمواد الخام الممتازة من نمو السوق.
يقدم قسم الدولة في التقرير أيضًا عوامل التأثير الفردية على السوق والتغيرات في تنظيم السوق التي تؤثر على الاتجاهات الحالية والمستقبلية للسوق. تعد نقاط البيانات مثل تحليل سلسلة القيمة المصب والمصب، والاتجاهات الفنية، وتحليل قوى بورتر الخمس، ودراسات الحالة بعض المؤشرات المستخدمة للتنبؤ بسيناريو السوق للدول الفردية. كما يتم النظر في وجود وتوافر العلامات التجارية الأوروبية والتحديات التي تواجهها بسبب المنافسة الكبيرة أو النادرة من العلامات التجارية المحلية والمحلية، وتأثير التعريفات الجمركية المحلية، وطرق التجارة أثناء تقديم تحليل توقعات لبيانات الدولة.
تحليل المشهد التنافسي وحصة سوق الطماطم في أوروبا
يوفر المشهد التنافسي لسوق الطماطم في أوروبا تفاصيل حسب المنافس. وتشمل التفاصيل نظرة عامة على الشركة، والبيانات المالية للشركة، والإيرادات المولدة، وإمكانات السوق، والاستثمار في البحث والتطوير، والمبادرات الجديدة في السوق، والحضور في أوروبا، ومواقع الإنتاج والمرافق، والقدرات الإنتاجية، ونقاط القوة والضعف في الشركة، وإطلاق المنتج، وعرض المنتج ونطاقه، وهيمنة التطبيق. تتعلق نقاط البيانات المذكورة أعلاه فقط بتركيز الشركات على السوق.
بعض اللاعبين الرئيسيين العاملين في سوق الطماطم في أوروبا هم CASALASCO - SOCIETÀ AGRICOLA SpA، وDuijvestijn Tomatoes، وR&L Holt Ltd.، وREDSTAR Sales BV، وMASTRONARDI PRODUCE LTD وغيرها.
SKU-
احصل على إمكانية الوصول عبر الإنترنت إلى التقرير الخاص بأول سحابة استخبارات سوقية في العالم
- لوحة معلومات تحليل البيانات التفاعلية
- لوحة معلومات تحليل الشركة للفرص ذات إمكانات النمو العالية
- إمكانية وصول محلل الأبحاث للتخصيص والاستعلامات
- تحليل المنافسين باستخدام لوحة معلومات تفاعلية
- آخر الأخبار والتحديثات وتحليل الاتجاهات
- استغل قوة تحليل المعايير لتتبع المنافسين بشكل شامل
Table of Content
1 INTRODUCTION
1.1 OBJECTIVES OF THE STUDY
1.2 MARKET DEFINITION
1.3 OVERVIEW OF THE EUROPE TOMATOES MARKET
1.4 LIMITATIONS
1.5 MARKETS COVERED
2 MARKET SEGMENTATION
2.1 MARKETS COVERED
2.2 GEOGRAPHICAL SCOPE
2.3 YEARS CONSIDERED FOR THE STUDY
2.4 CURRENCY AND PRICING
2.5 DBMR TRIPOD DATA VALIDATION MODEL
2.6 MULTIVARIATE MODELLING
2.7 TYPE LIFELINE CURVE
2.8 MARKET END USER COVERAGE GRID
2.9 PRIMARY INTERVIEWS WITH KEY OPINION LEADERS
2.1 DBMR MARKET POSITION GRID
2.11 SECONDARY SOURCES
2.12 ASSUMPTIONS
3 EXECUTIVE SUMMARY
4 PREMIUM INSIGHTS
4.1 TOP 5 EXPORTER OF EUROPE TOMATOES MARKET
4.2 TOP 5 IMPORTER OF EUROPE TOMATOES MARKET
4.3 NEW PRODUCT LAUNCH STRATEGIES
4.3.1 PROMOTING LAUNCH BY PACKAGING STRATEGIES
4.3.2 LAUNCHING ORGANIC PRODUCTS
4.3.3 CONCLUSION
5 REGULATION COVERAGES
6 SUPPLY CHAIN OF THE EUROPE TOMATOES MARKET
6.1 RAW MATERIAL PROCUREMENT
6.2 PROCESSING
6.3 MARKETING AND DISTRIBUTION
6.4 END USERS
7 MARKET OVERVIEW
7.1 DRIVERS
7.1.1 GOVERNMENT INITIATIVES TO BOOST TOMATO PRODUCTION AND THE AGRICULTURAL SECTOR
7.1.2 SURGING GROWTH FOR TOMATOES IN THE FOOD PROCESSING INDUSTRY
7.1.3 INCREASED DEVELOPMENT OF NEW TOMATO VARIETIES
7.1.4 RISING DOMESTIC AND INTERNATIONAL DEMAND FOR TOMATOES
7.2 RESTRAINTS
7.2.1 FLUCTUATIONS IN THE PRICES OF TOMATOES
7.2.2 INCREASING ENVIRONMENTAL ELEMENTS AND CLIMATE CONDITIONS
7.2.3 STRINGENT RULES AND REGULATIONS IN TRADING AND EXPORT OF TOMATOES
7.3 OPPORTUNITY
7.3.1 GROWING TOMATOES USING ARTIFICIAL INTELLIGENCE
7.3.2 WIDE RANGE OF APPLICATIONS IN THE FOOD AND BEVERAGE SECTOR
7.3.3 RISING TECHNOLOGICAL ADVANCEMENTS FOR TOMATO PRODUCTION
7.3.4 HIGH DEMAND FOR ORGANIC AND CHEMICAL-FREE TOMATOES
7.4 CHALLENGES
7.4.1 SCARCITY OF WATER RESOURCES AND SALINITY OF GROUNDWATER
7.4.2 RISING POST HARVESTING LOSSES DUE TO LACK OF STORAGE FACILITY
7.4.3 RISING USAGE OF CROP PROTECTION PRODUCTS
8 EUROPE TOMATOES MARKET, BY TYPE
8.1 OVERVIEW
8.2 CHERRY TOMATOES
8.3 GRAPE TOMATOES
8.4 ROMA TOMATOES
8.5 TOMATOES ON THE VINE
8.6 BEEFSTEAK TOMATOES
8.7 HEIRLOOM TOMATOES
8.8 GREEN TOMATOES
8.9 OTHERS
9 EUROPE TOMATOES MARKET, BY PRODUCT TYPE
9.1 OVERVIEW
9.2 FRESH
9.3 FROZEN
9.4 DRIED
10 EUROPE TOMATOES MARKET, BY CATEGORY
10.1 OVERVIEW
10.2 CONVENTIONAL
10.3 ORGANIC
11 EUROPE TOMATOES MARKET, BY END USER
11.1 OVERVIEW
11.2 FOOD SERVICE INDUSTRY
11.2.1 FOOD SERVICE INDUSTRY, BY TYPE
11.2.1.1 HOTELS
11.2.1.2 RESTAURANTS
11.2.1.3 CAFES
11.2.1.4 OTHERS
11.3 HOUSEHOLD/RETAIL INDUSTRY
12 EUROPE TOMATOES MARKET, BY DISTRIBUTION CHANNEL
12.1 OVERVIEW
12.2 DIRECT
12.3 INDIRECT
13 EUROPE TOMATOES MARKET : BY COUNTRIES
13.1 TURKEY
13.2 RUSSIA
13.3 SPAIN
13.4 ITALY
13.5 FRANCE
13.6 GERMANY
13.7 POLAND
13.8 U.K.
13.9 BELGIUM
13.1 NETHERLANDS
13.11 SWEDEN
13.12 SWITZERLAND
13.13 FINLAND
13.14 DENMARK
13.15 NORWAY
13.16 REST OF EUROPE
14 EUROPE TOMATOES MARKET, COMPANY LANDSCAPE
14.1 COMPANY SHARE ANALYSIS: EUROPE
15 SWOT ANALYSIS
16 COMPANY PROFILE
16.1 CASALASCO - SOCIETÀ AGRICOLA S.P.A.
16.1.1 COMPANY SNAPSHOT
16.1.2 PRODUCT PORTFOLIO
16.1.3 RECENT DEVELOPMENTS
16.2 MASTRONARDI PRODUCE LTD.
16.2.1 COMPANY SNAPSHOT
16.2.2 PRODUCT PORTFOLIO
16.2.3 RECENT DEVELOPMENTS
16.3 REDSTAR SALES BV
16.3.1 COMPANY SNAPSHOT
16.3.2 PRODUCT PORTFOLIO
16.3.3 RECENT DEVELOPMENT
16.4 DUIJVESTIJN TOMATEN
16.4.1 COMPANY SNAPSHOT
16.4.2 PRODUCT PORTFOLIO
16.4.3 RECENT DEVELOPMENT
16.5 R&L HOLT LTD.
16.5.1 COMPANY SNAPSHOT
16.5.2 PRODUCT PORTFOLIO
16.5.3 RECENT DEVELOPMENT
17 QUESTIONNAIRE
18 RELATED REPORTS
List of Table
TABLE 1 TOP 5 EXPORTER OF FRESH AND CHILLED TOMATOES, HS CODE: 0702 2017-2021, VOLUME IN TONS
TABLE 2 TOP 5 IMPORTER OF FRESH AND CHILLED TOMATOES, HS CODE: 0702 2017-2021, VOLUME IN TONS
TABLE 3 IN CASE SIZE CODES ARE APPLIED, THE CODES AND RANGES IN THE FOLLOWING TABLE HAVE TO BE RESPECTED:
TABLE 4 EUROPE TOMATOES MARKET, BY TYPE, 2021-2030 (USD MILLION)
TABLE 5 EUROPE TOMATOES MARKET, BY PRODUCT TYPE, 2021-2030 (USD MILLION)
TABLE 6 EUROPE TOMATOES MARKET, BY CATEGORY, 2021-2030 (USD MILLION)
TABLE 7 EUROPE TOMATOES MARKET, BY END USER, 2021-2030 (USD MILLION)
TABLE 8 EUROPE FOOD SERVICE INDUSTRY IN TOMATOES MARKET, BY TYPE, 2021-2030 (USD MILLION)
TABLE 9 EUROPE TOMATOES MARKET, BY DISTRIBUTION CHANNEL, 2021-2030 (USD MILLION)
TABLE 10 EUROPE TOMATOES MARKET, BY COUNTRY, 2021-2030 (USD MILLION)
TABLE 11 TURKEY TOMATOES MARKET, BY TYPE 2021-2030 (USD MILLION)
TABLE 12 TURKEY TOMATOES MARKET, BY PRODUCT TYPE, 2021-2030 (USD MILLION)
TABLE 13 TURKEY TOMATOES MARKET, BY CATEGORY, 2021-2030 (USD MILLION)
TABLE 14 TURKEY TOMATOES MARKET, BY END USER, 2021-2030 (USD MILLION)
TABLE 15 TURKEY FOOD SERVICE INDUSTRY IN TOMATOES MARKET, BY TYPE, 2021-2030 (USD MILLION)
TABLE 16 TURKEY TOMATOES MARKET, BY DISTRIBUTION CHANNEL, 2021-2030 (USD MILLION)
TABLE 17 RUSSIA TOMATOES MARKET, BY TYPE 2021-2030 (USD MILLION)
TABLE 18 RUSSIA TOMATOES MARKET, BY PRODUCT TYPE, 2021-2030 (USD MILLION)
TABLE 19 RUSSIA TOMATOES MARKET, BY CATEGORY, 2021-2030 (USD MILLION)
TABLE 20 RUSSIA TOMATOES MARKET, BY END USER, 2021-2030 (USD MILLION)
TABLE 21 RUSSIA FOOD SERVICE INDUSTRY IN TOMATOES MARKET, BY TYPE, 2021-2030 (USD MILLION)
TABLE 22 RUSSIA TOMATOES MARKET, BY DISTRIBUTION CHANNEL, 2021-2030 (USD MILLION)
TABLE 23 SPAIN TOMATOES MARKET, BY TYPE 2021-2030 (USD MILLION)
TABLE 24 SPAIN TOMATOES MARKET, BY PRODUCT TYPE, 2021-2030 (USD MILLION)
TABLE 25 SPAIN TOMATOES MARKET, BY CATEGORY, 2021-2030 (USD MILLION)
TABLE 26 SPAIN TOMATOES MARKET, BY END USER, 2021-2030 (USD MILLION)
TABLE 27 SPAIN FOOD SERVICE INDUSTRY IN TOMATOES MARKET, BY TYPE, 2021-2030 (USD MILLION)
TABLE 28 SPAIN TOMATOES MARKET, BY DISTRIBUTION CHANNEL, 2021-2030 (USD MILLION)
TABLE 29 ITALY TOMATOES MARKET, BY TYPE 2021-2030 (USD MILLION)
TABLE 30 ITALY TOMATOES MARKET, BY PRODUCT TYPE, 2021-2030 (USD MILLION)
TABLE 31 ITALY TOMATOES MARKET, BY CATEGORY, 2021-2030 (USD MILLION)
TABLE 32 ITALY TOMATOES MARKET, BY END USER, 2021-2030 (USD MILLION)
TABLE 33 ITALY FOOD SERVICE INDUSTRY IN TOMATOES MARKET, BY TYPE, 2021-2030 (USD MILLION)
TABLE 34 ITALY TOMATOES MARKET, BY DISTRIBUTION CHANNEL, 2021-2030 (USD MILLION)
TABLE 35 FRANCE TOMATOES MARKET, BY TYPE 2021-2030 (USD MILLION)
TABLE 36 FRANCE TOMATOES MARKET, BY PRODUCT TYPE, 2021-2030 (USD MILLION)
TABLE 37 FRANCE TOMATOES MARKET, BY CATEGORY, 2021-2030 (USD MILLION)
TABLE 38 FRANCE TOMATOES MARKET, BY END USER, 2021-2030 (USD MILLION)
TABLE 39 FRANCE FOOD SERVICE INDUSTRY IN TOMATOES MARKET, BY TYPE, 2021-2030 (USD MILLION)
TABLE 40 FRANCE TOMATOES MARKET, BY DISTRIBUTION CHANNEL, 2021-2030 (USD MILLION)
TABLE 41 GERMANY TOMATOES MARKET, BY TYPE 2021-2030 (USD MILLION)
TABLE 42 GERMANY TOMATOES MARKET, BY PRODUCT TYPE, 2021-2030 (USD MILLION)
TABLE 43 GERMANY TOMATOES MARKET, BY CATEGORY, 2021-2030 (USD MILLION)
TABLE 44 GERMANY TOMATOES MARKET, BY END USER, 2021-2030 (USD MILLION)
TABLE 45 GERMANY FOOD SERVICE INDUSTRY IN TOMATOES MARKET, BY TYPE, 2021-2030 (USD MILLION)
TABLE 46 GERMANY TOMATOES MARKET, BY DISTRIBUTION CHANNEL, 2021-2030 (USD MILLION)
TABLE 47 POLAND TOMATOES MARKET, BY TYPE 2021-2030 (USD MILLION)
TABLE 48 POLAND TOMATOES MARKET, BY PRODUCT TYPE, 2021-2030 (USD MILLION)
TABLE 49 POLAND TOMATOES MARKET, BY CATEGORY, 2021-2030 (USD MILLION)
TABLE 50 POLAND TOMATOES MARKET, BY END USER, 2021-2030 (USD MILLION)
TABLE 51 POLAND FOOD SERVICE INDUSTRY IN TOMATOES MARKET, BY TYPE, 2021-2030 (USD MILLION)
TABLE 52 POLAND TOMATOES MARKET, BY DISTRIBUTION CHANNEL, 2021-2030 (USD MILLION)
TABLE 53 U.K. TOMATOES MARKET, BY TYPE 2021-2030 (USD MILLION)
TABLE 54 U.K. TOMATOES MARKET, BY PRODUCT TYPE, 2021-2030 (USD MILLION)
TABLE 55 U.K. TOMATOES MARKET, BY CATEGORY, 2021-2030 (USD MILLION)
TABLE 56 U.K. TOMATOES MARKET, BY END USER, 2021-2030 (USD MILLION)
TABLE 57 U.K. FOOD SERVICE INDUSTRY IN TOMATOES MARKET, BY TYPE, 2021-2030 (USD MILLION)
TABLE 58 U.K. TOMATOES MARKET, BY DISTRIBUTION CHANNEL, 2021-2030 (USD MILLION)
TABLE 59 BELGIUM TOMATOES MARKET, BY TYPE 2021-2030 (USD MILLION)
TABLE 60 BELGIUM TOMATOES MARKET, BY PRODUCT TYPE, 2021-2030 (USD MILLION)
TABLE 61 BELGIUM TOMATOES MARKET, BY CATEGORY, 2021-2030 (USD MILLION)
TABLE 62 BELGIUM TOMATOES MARKET, BY END USER, 2021-2030 (USD MILLION)
TABLE 63 BELGIUM FOOD SERVICE INDUSTRY IN TOMATOES MARKET, BY TYPE, 2021-2030 (USD MILLION)
TABLE 64 BELGIUM TOMATOES MARKET, BY DISTRIBUTION CHANNEL, 2021-2030 (USD MILLION)
TABLE 65 NETHERLANDS TOMATOES MARKET, BY TYPE 2021-2030 (USD MILLION)
TABLE 66 NETHERLANDS TOMATOES MARKET, BY PRODUCT TYPE, 2021-2030 (USD MILLION)
TABLE 67 NETHERLANDS TOMATOES MARKET, BY CATEGORY, 2021-2030 (USD MILLION)
TABLE 68 NETHERLANDS TOMATOES MARKET, BY END USER, 2021-2030 (USD MILLION)
TABLE 69 NETHERLANDS FOOD SERVICE INDUSTRY IN TOMATOES MARKET, BY TYPE, 2021-2030 (USD MILLION)
TABLE 70 NETHERLANDS TOMATOES MARKET, BY DISTRIBUTION CHANNEL, 2021-2030 (USD MILLION)
TABLE 71 SWEDEN TOMATOES MARKET, BY TYPE 2021-2030 (USD MILLION)
TABLE 72 SWEDEN TOMATOES MARKET, BY PRODUCT TYPE, 2021-2030 (USD MILLION)
TABLE 73 SWEDEN TOMATOES MARKET, BY CATEGORY, 2021-2030 (USD MILLION)
TABLE 74 SWEDEN TOMATOES MARKET, BY END USER, 2021-2030 (USD MILLION)
TABLE 75 SWEDEN FOOD SERVICE INDUSTRY IN TOMATOES MARKET, BY TYPE, 2021-2030 (USD MILLION)
TABLE 76 SWEDEN TOMATOES MARKET, BY DISTRIBUTION CHANNEL, 2021-2030 (USD MILLION)
TABLE 77 SWITZERLAND TOMATOES MARKET, BY TYPE 2021-2030 (USD MILLION)
TABLE 78 SWITZERLAND TOMATOES MARKET, BY PRODUCT TYPE, 2021-2030 (USD MILLION)
TABLE 79 SWITZERLAND TOMATOES MARKET, BY CATEGORY, 2021-2030 (USD MILLION)
TABLE 80 SWITZERLAND TOMATOES MARKET, BY END USER, 2021-2030 (USD MILLION)
TABLE 81 SWITZERLAND FOOD SERVICE INDUSTRY IN TOMATOES MARKET, BY TYPE, 2021-2030 (USD MILLION)
TABLE 82 SWITZERLAND TOMATOES MARKET, BY DISTRIBUTION CHANNEL, 2021-2030 (USD MILLION)
TABLE 83 FINLAND TOMATOES MARKET, BY TYPE 2021-2030 (USD MILLION)
TABLE 84 FINLAND TOMATOES MARKET, BY PRODUCT TYPE, 2021-2030 (USD MILLION)
TABLE 85 FINLAND TOMATOES MARKET, BY CATEGORY, 2021-2030 (USD MILLION)
TABLE 86 FINLAND TOMATOES MARKET, BY END USER, 2021-2030 (USD MILLION)
TABLE 87 FINLAND FOOD SERVICE INDUSTRY IN TOMATOES MARKET, BY TYPE, 2021-2030 (USD MILLION)
TABLE 88 FINLAND TOMATOES MARKET, BY DISTRIBUTION CHANNEL, 2021-2030 (USD MILLION)
TABLE 89 DENMARK TOMATOES MARKET, BY TYPE 2021-2030 (USD MILLION)
TABLE 90 DENMARK TOMATOES MARKET, BY PRODUCT TYPE, 2021-2030 (USD MILLION)
TABLE 91 DENMARK TOMATOES MARKET, BY CATEGORY, 2021-2030 (USD MILLION)
TABLE 92 DENMARK TOMATOES MARKET, BY END USER, 2021-2030 (USD MILLION)
TABLE 93 DENMARK FOOD SERVICE INDUSTRY IN TOMATOES MARKET, BY TYPE, 2021-2030 (USD MILLION)
TABLE 94 DENMARK TOMATOES MARKET, BY DISTRIBUTION CHANNEL, 2021-2030 (USD MILLION)
TABLE 95 NORWAY TOMATOES MARKET, BY TYPE 2021-2030 (USD MILLION)
TABLE 96 NORWAY TOMATOES MARKET, BY PRODUCT TYPE, 2021-2030 (USD MILLION)
TABLE 97 NORWAY TOMATOES MARKET, BY CATEGORY, 2021-2030 (USD MILLION)
TABLE 98 NORWAY TOMATOES MARKET, BY END USER, 2021-2030 (USD MILLION)
TABLE 99 NORWAY FOOD SERVICE INDUSTRY IN TOMATOES MARKET, BY TYPE, 2021-2030 (USD MILLION)
TABLE 100 NORWAY TOMATOES MARKET, BY DISTRIBUTION CHANNEL, 2021-2030 (USD MILLION)
TABLE 101 REST OF EUROPE TOMATOES MARKET, BY TYPE 2021-2030 (USD MILLION)
List of Figure
FIGURE 1 EUROPE TOMATOES MARKET: SEGMENTATION
FIGURE 2 EUROPE TOMATOES MARKET: DATA TRIANGULATION
FIGURE 3 EUROPE TOMATOES MARKET: DROC ANALYSIS
FIGURE 4 EUROPE TOMATOES MARKET: GLOBAL VS REGIONAL ANALYSIS
FIGURE 5 EUROPE TOMATOES MARKET: COMPANY RESEARCH ANALYSIS
FIGURE 6 THE EUROPE TOMATOES MARKET: MARKET END USER COVERAGE GRID
FIGURE 7 EUROPE TOMATOES MARKET: INTERVIEW DEMOGRAPHICS
FIGURE 8 EUROPE TOMATOES MARKET: DBMR POSITION GRID
FIGURE 9 EUROPE TOMATOES MARKET: SEGMENTATION
FIGURE 10 SURGING GROWTH FOR TOMATOES IN THE FOOD PROCESSING INDUSTRY IS EXPECTED TO DRIVE THE EUROPE TOMATOES MARKET IN THE FORECAST PERIOD OF 2023 TO 2030
FIGURE 11 THE CHERRY TOMATO SEGMENT IS EXPECTED TO ACCOUNT FOR THE LARGEST SHARE OF THE EUROPE TOMATOES MARKET IN THE FORECAST PERIOD OF 2023 TO 2030
FIGURE 12 SUPPLY CHAIN OF THE EUROPE TOMATOES MARKET
FIGURE 13 DRIVERS, RESTRAINTS, OPPORTUNITIES, AND CHALLENGES OF THE EUROPE TOMATOES MARKET
FIGURE 14 EUROPE TOMATOES MARKET: BY TYPE, 2022
FIGURE 15 EUROPE TOMATOES MARKET: BY PRODUCT TYPE, 2022
FIGURE 16 EUROPE TOMATOES MARKET: BY CATEGORY, 2022
FIGURE 17 EUROPE TOMATOES MARKET: BY END USER, 2022
FIGURE 18 EUROPE TOMATOES MARKET: BY DISTRIBUTION CHANNEL, 2022
FIGURE 19 EUROPE TOMATOES MARKET: SNAPSHOT (2022)
FIGURE 20 EUROPE TOMATOES MARKET: BY COUNTRY (2022)
FIGURE 21 EUROPE TOMATOES MARKET: BY COUNTRY (2023 & 2030)
FIGURE 22 EUROPE TOMATOES MARKET: BY COUNTRY (2022 & 2030)
FIGURE 23 EUROPE TOMATOES MARKET: BY TYPE (2023 - 2030)
FIGURE 24 EUROPE TOMATOES MARKET: COMPANY SHARE 2022 (%)

منهجية البحث
يتم جمع البيانات وتحليل سنة الأساس باستخدام وحدات جمع البيانات ذات أحجام العينات الكبيرة. تتضمن المرحلة الحصول على معلومات السوق أو البيانات ذات الصلة من خلال مصادر واستراتيجيات مختلفة. تتضمن فحص وتخطيط جميع البيانات المكتسبة من الماضي مسبقًا. كما تتضمن فحص التناقضات في المعلومات التي شوهدت عبر مصادر المعلومات المختلفة. يتم تحليل بيانات السوق وتقديرها باستخدام نماذج إحصائية ومتماسكة للسوق. كما أن تحليل حصة السوق وتحليل الاتجاهات الرئيسية هي عوامل النجاح الرئيسية في تقرير السوق. لمعرفة المزيد، يرجى طلب مكالمة محلل أو إرسال استفسارك.
منهجية البحث الرئيسية التي يستخدمها فريق بحث DBMR هي التثليث البيانات والتي تتضمن استخراج البيانات وتحليل تأثير متغيرات البيانات على السوق والتحقق الأولي (من قبل خبراء الصناعة). تتضمن نماذج البيانات شبكة تحديد موقف البائعين، وتحليل خط زمني للسوق، ونظرة عامة على السوق ودليل، وشبكة تحديد موقف الشركة، وتحليل براءات الاختراع، وتحليل التسعير، وتحليل حصة الشركة في السوق، ومعايير القياس، وتحليل حصة البائعين على المستوى العالمي مقابل الإقليمي. لمعرفة المزيد عن منهجية البحث، أرسل استفسارًا للتحدث إلى خبراء الصناعة لدينا.
التخصيص متاح
تعد Data Bridge Market Research رائدة في مجال البحوث التكوينية المتقدمة. ونحن نفخر بخدمة عملائنا الحاليين والجدد بالبيانات والتحليلات التي تتطابق مع هدفهم. ويمكن تخصيص التقرير ليشمل تحليل اتجاه الأسعار للعلامات التجارية المستهدفة وفهم السوق في بلدان إضافية (اطلب قائمة البلدان)، وبيانات نتائج التجارب السريرية، ومراجعة الأدبيات، وتحليل السوق المجدد وقاعدة المنتج. ويمكن تحليل تحليل السوق للمنافسين المستهدفين من التحليل القائم على التكنولوجيا إلى استراتيجيات محفظة السوق. ويمكننا إضافة عدد كبير من المنافسين الذين تحتاج إلى بيانات عنهم بالتنسيق وأسلوب البيانات الذي تبحث عنه. ويمكن لفريق المحللين لدينا أيضًا تزويدك بالبيانات في ملفات Excel الخام أو جداول البيانات المحورية (كتاب الحقائق) أو مساعدتك في إنشاء عروض تقديمية من مجموعات البيانات المتوفرة في التقرير.


