
North America Swir Market
Market Size in USD Million
 USD
645.43 Million
USD
1,557.43 Million
2024
2032
USD
645.43 Million
USD
1,557.43 Million
2024
2032
| 2025 - 2032 | |
| USD 645.43 Million | |
| USD 1,557.43 Million | |
| % | |
|
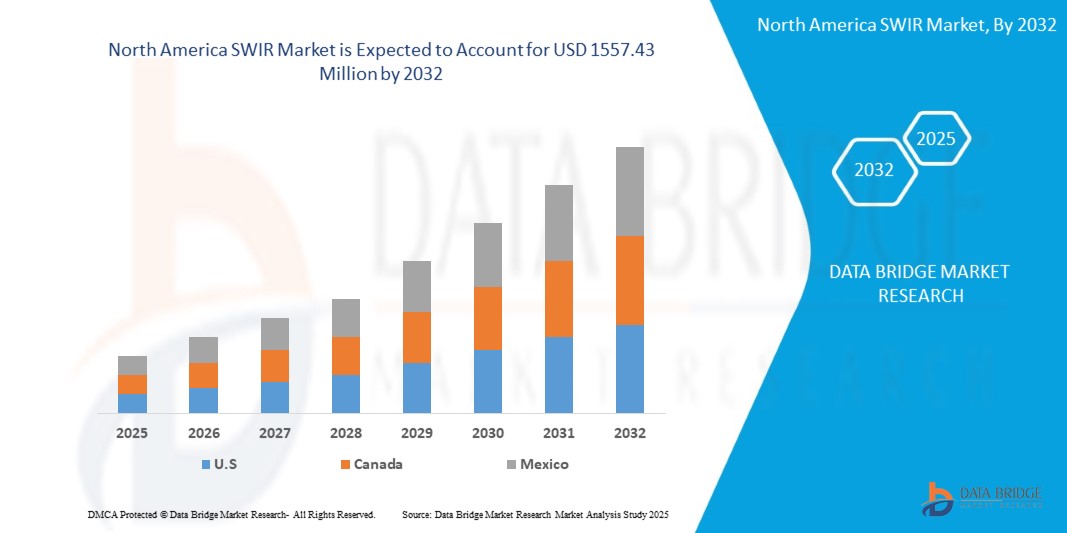
SWIR Market Size
- The North America SWIR Market size was valued at USD 645.43 Million in 2024 and is expected to reach USD 1557.43 Million by 2032, at a CAGR of 11.6% during the forecast period
- This growth is driven by rising demand for shortwave infrared cameras in machine vision applications and growing adoption of night vision technologies.
SWIR Market Analysis
- Short-wave infrared (SWIR) is typically defined as light in the 0.9–1.7μm wavelength range, or can also be in range of 0.7–2.5μm. Short-wave Infrared imaging (SWIR) refers to an advanced technique which is used for producing images based on radiation in the region of the electromagnetic spectrum invisible to the naked eye. SWIR imaging requires unique optical and electronic components capable of performing in the specific SWIR range. A large number of applications that are difficult or impossible to perform using visible light are possible using SWIR. When imaging in SWIR, water vapor, fog, other environment constraints and certain materials such as silicon are transparent.
- SWIR imagers are used in a large number of applications such as silicon inspection, laser beam profiling, hyperspectral imaging, chemical and plastics sensing, machine vision imaging, agricultural sensing, surveillance systems, and medical imaging. They are also intended for use in mobile phone facial recognition sensors, and autonomous vehicle imaging though obscured environments.
- The United States dominates the North America Short-Wave Infrared (SWIR) market, primarily due to a combination of advanced technological capabilities and a strong ecosystem of industry players. The country is home to several leading thermal imaging and SWIR technology providers, which contribute significantly to research, innovation, and product development in this segment. Companies in the U.S. are at the forefront of integrating SWIR into applications such as defense, surveillance, industrial inspection, and scientific research.
- The hardware segment is anticipated to lead the North America SWIR market with the largest market share of 49.57% in 2025, driven by the strong presence of SWIR camera and sensor manufacturers across the region. The demand for high-performance, compact, and cost-effective imaging systems has surged in industries such as industrial inspection, defense, and medical diagnostics. Continuous innovation in sensor technology and hardware miniaturization is also contributing to this segment’s dominance.
Report Scope and SWIR Market Segmentation
|
Attributes |
SWIR Key Market Insights |
|
Segments Covered |
|
|
Countries Covered |
North America
|
|
Key Market Players |
|
|
Market Opportunities |
|
|
Value Added Data Infosets |
In addition to the insights on market scenarios such as market value, growth rate, segmentation, geographical coverage, and major players, the market reports curated by the Data Bridge Market Research also include import export analysis, production capacity overview, production consumption analysis, price trend analysis, climate change scenario, supply chain analysis, value chain analysis, raw material/consumables overview, vendor selection criteria, PESTLE Analysis, Porter Analysis, and regulatory framework. |
SWIR Market Trends
“Increased Integration of SWIR Cameras in Industrial Machine Vision Systems”
- One of the primary forces driving the growth of the North America SWIR market is the rising deployment of short-wave infrared (SWIR) cameras in machine vision applications across manufacturing and inspection processes.
- SWIR imaging systems are highly effective in detecting material defects, analyzing surface properties, and inspecting sub-surface features that are invisible under visible light. These capabilities are especially critical in industries like semiconductor manufacturing, electronics, and food processing.
For instance,
- In October 2021, FLIR Systems launched its Boson+ SWIR camera module targeting precision industrial inspection, offering enhanced sensitivity and compact form factor—addressing increasing demand in wafer inspection and quality control.
- This trend of automation and optical inspection using SWIR is contributing to improved manufacturing accuracy, reduced production defects, and better operational efficiency, making it a key driver of market expansion.
SWIR Market Dynamics
Driver
“Growing Use of SWIR Imaging in Night Vision and Surveillance Applications”
- Another crucial driver is the expanding utilization of SWIR imaging technology in night vision systems for defense and public safety. Unlike conventional infrared systems, SWIR cameras can penetrate fog, haze, and smoke—making them ideal for environments with poor visibility.
- With rising geopolitical tensions and increasing investments in border and homeland security, defense organizations across North America are adopting advanced SWIR-enabled surveillance systems to enhance night-time situational awareness.
For instance,
- In January 2022, the U.S. Department of Defense awarded contracts to multiple vendors for deploying SWIR systems in perimeter surveillance and tactical operations—highlighting the military’s shift toward higher-resolution, low-light imaging capabilities.
- This growing emphasis on security infrastructure modernization continues to drive demand for SWIR technologies across defense and law enforcement sectors.
Opportunity
“Accelerating Development of Miniaturized SWIR Sensors for Emerging Applications”
- A promising opportunity within the North American SWIR market lies in the increasing trend toward the miniaturization of SWIR components. As demand grows for compact and lightweight imaging solutions, especially in consumer electronics, healthcare diagnostics, and autonomous systems, manufacturers are focusing on developing smaller, more energy-efficient SWIR modules.
- These miniaturized sensors are enabling new applications such as facial recognition in smartphones, portable medical diagnostics, drone-based agricultural imaging, and wearable sensors.
For instance,
- In March 2023, SWIR Vision Systems announced the commercial availability of its NanoCam™—a compact SWIR camera module designed for mobile device and embedded systems integration. The device’s reduced footprint and high performance make it suitable for consumer-grade electronics and robotics.
- This trend represents a significant opportunity for vendors to tap into high-growth markets beyond traditional industrial domains.
Restraint/Challenge
“High Cost and Performance Constraints of InGaAs Sensor Technology”
- A major challenge hindering the growth of the SWIR market is the high production and acquisition cost associated with InGaAs-based sensors, which are the most widely used technology in SWIR imaging.
- These sensors require complex manufacturing processes and expensive materials, which translate into higher system costs—limiting their accessibility to cost-sensitive industries. Additionally, InGaAs sensors face limitations in terms of their spectral range and temperature performance, restricting their use in broader environmental conditions.
For instance,
- As highlighted in a November 2022 report by the Infrared Imaging Technology Council, average pricing for industrial-grade InGaAs SWIR sensors remained 30–50% higher than traditional IR solutions, leading to adoption barriers among small and mid-sized enterprises.
- Reducing the cost and enhancing the thermal stability of InGaAs sensors will be essential to expanding SWIR adoption across new market segments such as consumer devices and automotive systems.
SWIR Market Scope
North America SWIR market is segmented on the basis of the scanning type, detector type, chemical composition, application, component and industry.
|
Segmentation |
Sub-Segmentation |
|
By Scanning Type |
|
|
By Detector Type |
|
|
By Chemical Composition |
|
|
By Application |
|
|
By Component |
|
|
By Industry |
|
In 2025, the security & surveillance segment is projected to dominate the market with the largest share in the application segment
The security & surveillance segment is expected to dominate the North America SWIR market with the largest market share of 35.15% in 2025, primarily due to the growing emphasis on advanced monitoring technologies across military and defense sectors. The increasing demand for real-time threat detection, low-light imaging, and long-range vision capabilities is accelerating the integration of SWIR cameras in security systems. Rising government investments and cross-border surveillance initiatives are further driving the adoption of SWIR technologies in this segment.
In 2025, the hardware segment is expected to dominate the market with the largest share in the component segment
The hardware segment is anticipated to lead the North America SWIR market with the largest market share of 49.57% in 2025, driven by the strong presence of SWIR camera and sensor manufacturers across the region. The demand for high-performance, compact, and cost-effective imaging systems has surged in industries such as industrial inspection, defense, and medical diagnostics. Continuous innovation in sensor technology and hardware miniaturization is also contributing to this segment’s dominance.
SWIR Market Regional Analysis
“U.S. Holds the Largest Share and fastest growing in the SWIR Market”
- The United States dominates the North America Short-Wave Infrared (SWIR) market, primarily due to a combination of advanced technological capabilities and a strong ecosystem of industry players. The country is home to several leading thermal imaging and SWIR technology providers, which contribute significantly to research, innovation, and product development in this segment. Companies in the U.S. are at the forefront of integrating SWIR into applications such as defense, surveillance, industrial inspection, and scientific research.
- Moreover, the growing adoption of cutting-edge technologies, such as artificial intelligence and machine learning for image processing and data analytics, further accelerates the use of SWIR cameras and sensors across various industries. Government investments in defense and security infrastructure, along with increasing demand from the semiconductor inspection and medical diagnostics sectors, also contribute to the market's expansion. As a result, the United States maintains a leading position in the North American SWIR market landscape.
SWIR Market Share
The market competitive landscape provides details by competitor. Details included are company overview, company financials, revenue generated, market potential, investment in research and development, new market initiatives, North America presence, production sites and facilities, production capacities, company strengths and weaknesses, product launch, product width and breadth, application dominance. The above data points provided are only related to the companies' focus related to market.
The Major Market Leaders Operating in the Market Are:
- Sensors Unlimited (Collins Aerospace) (United States)
- Teledyne Technologies Incorporated(United States)
- Xenics nv(Belgium)
- Allied Vision Technologies Gmb(Germany)
- Hamamatsu Photonics K.K.(Japan)
- NIT (New Imaging Technologies)(France)
- Photon Etc. Inc.(Canada)
- Princeton Infrared Technologies, Inc.(United States)
- Raptor Photonics(United Kingdom)
- IRCameras LLC (United States)
- Intevac, Inc(United States)
- Opgal Optronic Industries Ltd. (Israel)
- InfraTec GmbH (Germany)
- TTP plc. (United Kingdom)
- Photonic Science and Engineering Limited(United Kingdom)
- SWIR Vision Systems(United States)
- Edmund Optics Inc.(United States)
- Atik Cameras Limited (SDI Group)(United Kingdom)
- Silent Sentinel (United Kingdom)
Latest Developments in North America SWIR Market
- January 2025: onsemi (Semiconductor Components Industries, LLC) has completed the acquisition of SWIR Vision Systems, a company recognized for its innovative use of colloidal quantum dots (CQD) in SWIR imaging. This acquisition aims to strengthen onsemi’s portfolio of SWIR sensors, enhancing their capabilities for automotive, industrial, and healthcare applications, with a focus on machine vision and surveillance solutions.
- In April 2024: New Imaging Technologies (NIT) introduced its latest high-resolution InGaAs sensor, the NSC2101, featuring a pixel pitch of 8µm and a resolution of 2 megapixels (1920x1080). This sensor is optimized for high-precision applications, offering exceptional image quality even in challenging lighting conditions, making it ideal for industrial and surveillance uses.
- In October 2023: Omron Corporation unveiled a new line of SWIR cameras designed to meet the growing demand for precision inspection in manufacturing. These cameras offer superior visibility for inspecting materials such as glass, silicon, and plastics, aiding in defect detection and quality control in production processes.
- In September 2024: TriEye launched its TES200 Raven SWIR sensor, capable of capturing images in the 700 to 1650 nm wavelength range. The sensor provides high-speed imaging with a frame rate of up to 180 fps and a resolution of 1.3 megapixels, making it particularly suited for applications in automotive and industrial sectors requiring reliable performance in low-visibility conditions.
- In August 2024: Teledyne Technologies introduced the Forge 1GigE SWIR camera, powered by the new Sony SenSWIR IMX990 InGaAs sensor. This camera offers high sensitivity and wide wavelength coverage, which is ideal for industrial applications such as material analysis and quality inspection under extreme environmental conditions.
- In September 2024: Quantum Solutions collaborated with Topodrone to release the Q.Fly, a drone-mounted camera equipped with SWIR imaging technology. This system is designed for real-time video streaming and integrates seamlessly with DJI drones, making it perfect for applications in remote sensing, environmental monitoring, and agricultural analysis.
- In January 2024: Emberion presented its enhanced VS20 vis-SWIR camera series at Photonics West 2024. The updated cameras now support frame rates of up to 400 fps at VGA resolution, providing greater speed and flexibility for industrial and surveillance applications. A new compact version weighing just 450g was also introduced, making it more portable and suitable for integration with UAVs and other mobile platforms.
SKU-

- Interactive Data Analysis Dashboard
- Company Analysis Dashboard for high growth potential opportunities
- Research Analyst Access for customization & queries
- Competitor Analysis with Interactive dashboard
- Latest News, Updates & Trend analysis
- Harness the Power of Benchmark Analysis for Comprehensive Competitor Tracking
North America Swir Market, Supply Chain Analysis and Ecosystem Framework
To support market growth and help clients navigate the impact of geopolitical shifts, DBMR has integrated in-depth supply chain analysis into its North America Swir Market research reports. This addition empowers clients to respond effectively to global changes affecting their industries. The supply chain analysis section includes detailed insights such as North America Swir Market consumption and production by country, price trend analysis, the impact of tariffs and geopolitical developments, and import and export trends by country and HSN code. It also highlights major suppliers with data on production capacity and company profiles, as well as key importers and exporters. In addition to research, DBMR offers specialized supply chain consulting services backed by over a decade of experience, providing solutions like supplier discovery, supplier risk assessment, price trend analysis, impact evaluation of inflation and trade route changes, and comprehensive market trend analysis.
Data collection and base year analysis are done using data collection modules with large sample sizes. The stage includes obtaining market information or related data through various sources and strategies. It includes examining and planning all the data acquired from the past in advance. It likewise envelops the examination of information inconsistencies seen across different information sources. The market data is analysed and estimated using market statistical and coherent models. Also, market share analysis and key trend analysis are the major success factors in the market report. To know more, please request an analyst call or drop down your inquiry.
The key research methodology used by DBMR research team is data triangulation which involves data mining, analysis of the impact of data variables on the market and primary (industry expert) validation. Data models include Vendor Positioning Grid, Market Time Line Analysis, Market Overview and Guide, Company Positioning Grid, Patent Analysis, Pricing Analysis, Company Market Share Analysis, Standards of Measurement, Global versus Regional and Vendor Share Analysis. To know more about the research methodology, drop in an inquiry to speak to our industry experts.
Data Bridge Market Research is a leader in advanced formative research. We take pride in servicing our existing and new customers with data and analysis that match and suits their goal. The report can be customized to include price trend analysis of target brands understanding the market for additional countries (ask for the list of countries), clinical trial results data, literature review, refurbished market and product base analysis. Market analysis of target competitors can be analyzed from technology-based analysis to market portfolio strategies. We can add as many competitors that you require data about in the format and data style you are looking for. Our team of analysts can also provide you data in crude raw excel files pivot tables (Fact book) or can assist you in creating presentations from the data sets available in the report.


