North America Shipping Container Liner Market Analysis and Insights
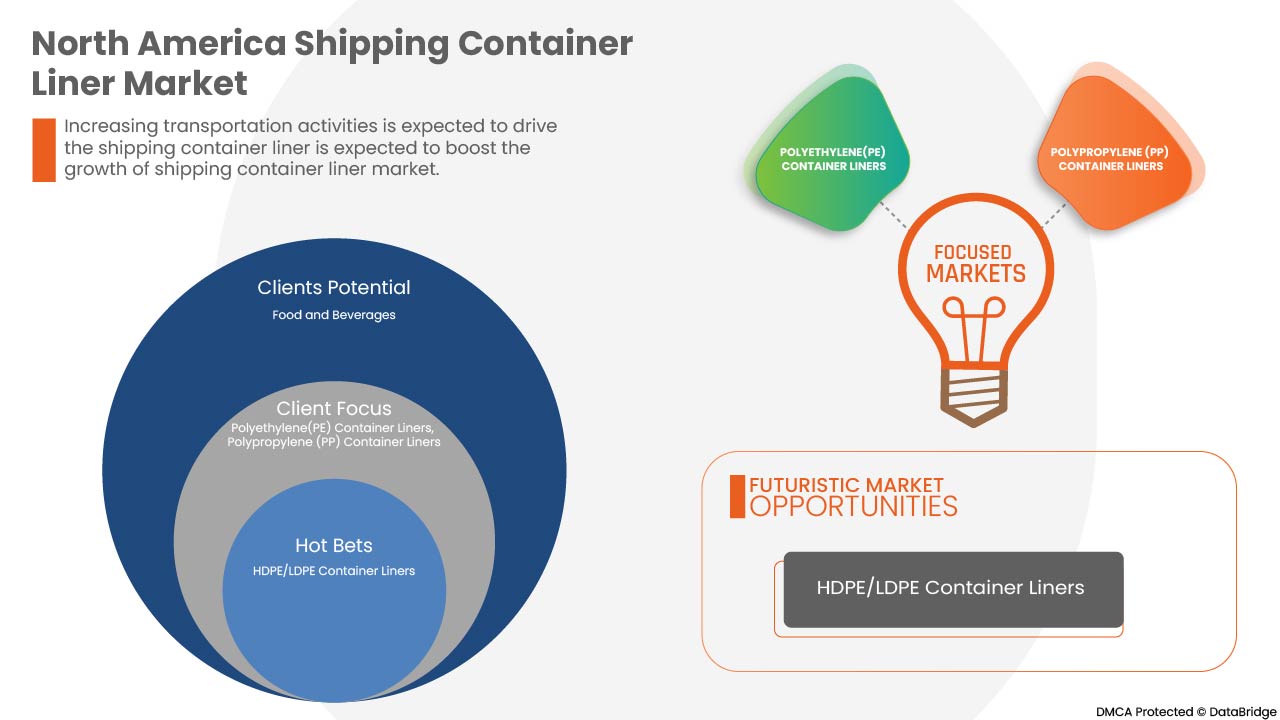
Container liners can be used to pack all kinds of dry food such as wheat, rice, coffee, legumes, sugar and other foods. For safe, contamination-free packaging, container liners offer a cost-effective, protective and valuable packaging solution. Rising prevalence of container liners in food and agriculture industry and increased transportation activities are expected to drive the North America shipping container liner market Moreover, reusability and cost effectiveness of shipping container liners will propel the growth of the North America shipping container liner market. However, high transportation costs and increasing freight rates may hamper the growth of the market.


North America shipping container liner market report provides details of market share, new developments, and the impact of domestic and localized market players, analyses opportunities in terms of emerging revenue pockets, changes in market regulations, products approvals, strategic decisions, product launches, geographic expansions, and technological innovations in the market. To understand the analysis and the market scenario, contact us for an Analyst Brief. Our team will help you create a revenue impact solution to achieve your desired goal.
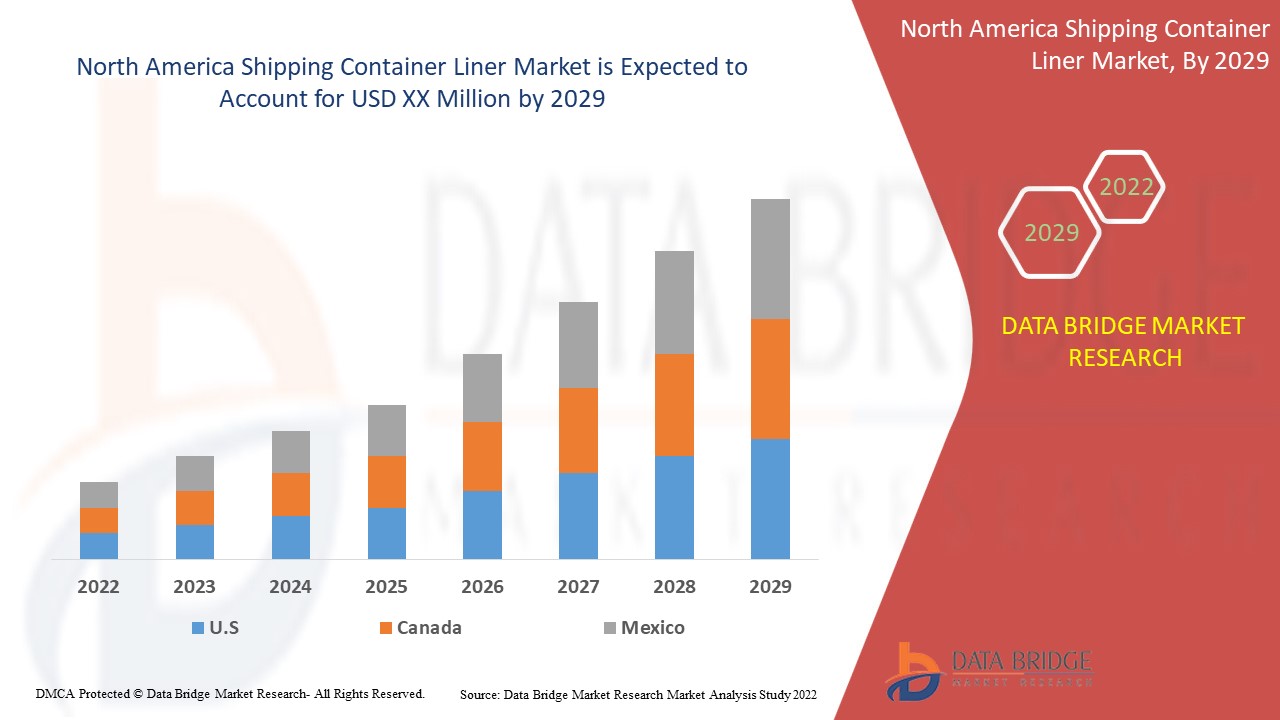
Data Bridge Market Research analyses that the North America shipping container liner market will grow at a CAGR of 3.7% during the forecast period of 2022 to 2029.
|
Report Metric |
Details |
|
Forecast Period |
2022 to 2029 |
|
Base Year |
2021 |
|
Historic Years |
2020 (Customizable to 2019 - 2014) |
|
Quantitative Units |
Revenue in USD Million |
|
Segments Covered |
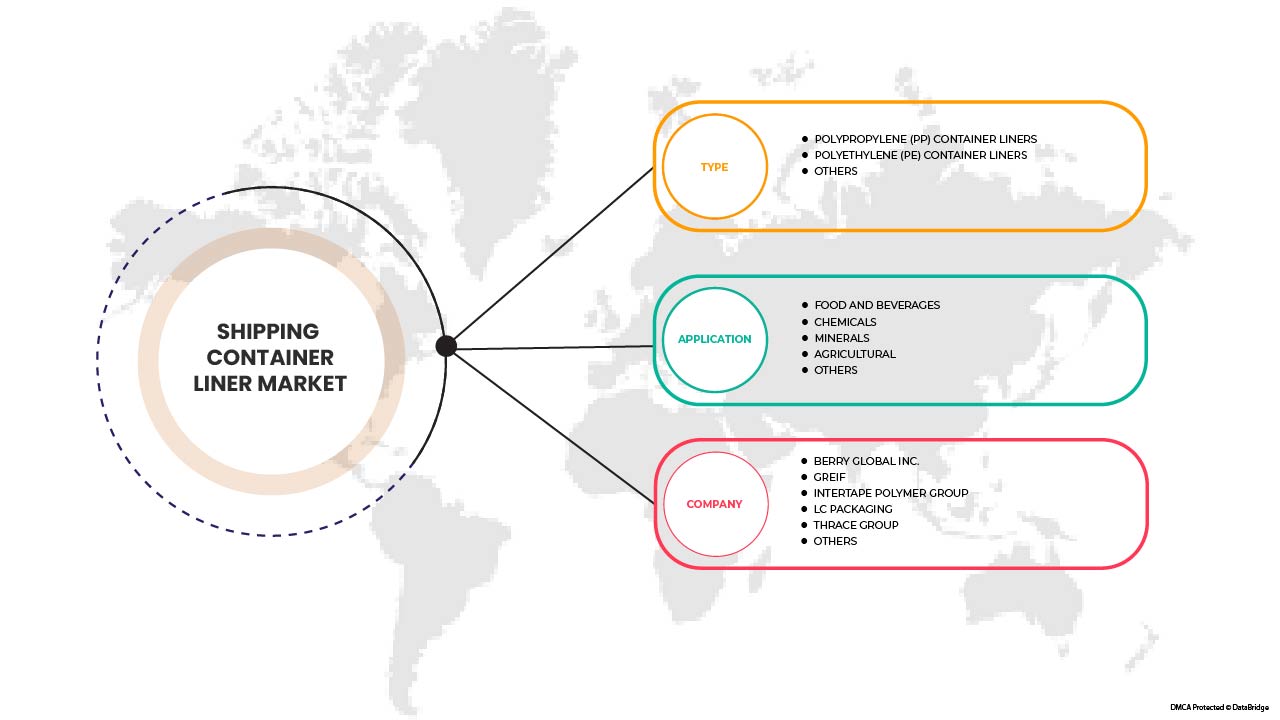
By Type (Polypropylene (PP) Container Liners, Polyethylene (PE) Container Liners, And Others), Application (Food And Beverages, Chemicals, Minerals, Agricultural And Others) |
|
Countries Covered |
U.S., Canada, and Mexico |
|
Market Players Covered |
BERRY GLOBAL INC, Eceplast, Greif, LC Packaging, Thrace Group, United Bags Inc. |
Market Definition
Container liners are the most economical means of packaging and transporting bulk dry, free-flowing products. They are of primary importance regarding packaging requirements for bulk deliveries of goods and other materials. When goods are moved from one geographical location to another, they naturally come into contact with natural elements such as oil, dust, air and soil, all of which can ruin or degrade the quality of the goods. There is a possibility that Excessive contamination often renders goods unsuitable. To avoid the transported goods being rejected by the authorities, it is very important that the goods meet the quality standards set by the relevant government of the destination country. To prevent all these situations, bulk container liners are used as a protective layer. By using bulk container liners for transportation, goods are kept safe and contamination is completely avoided.
North America Shipping Container Liner Market Dynamics
Drivers
-
Rising Prevalence of Container Liners in the Food and Agriculture Industry
Shipping container liners have become increasingly popular in the shipping industry, especially in food and agriculture. Food products and items must be transported with well-maintained chains and precautions to maintain their quality and food security. Similarly, in the agriculture industry, transportation of seeds, fertilizers, and various chemicals must be transported with proper care and handled cautiously. Container liners prevent moisture, temperature, and other contamination in the commodity. Various manufacturers are providing such container liners as per the need of end users for varying applications. The wide applicability of container liners in food and agriculture leads to higher demands and is expected to drive market growth
-
Increased Transportation Activities Requiring Shipping Container Liners
The upsurge in the transportation of goods across the globe has led to the industry's higher demand for shipping container liners. The liners provide safety to the commodities and are highly efficient in loading and unloading. With this increasing transportation, the demand for container liners is also increasing and is expected to drive the market's growth.
Opportunities
-
Strategic Initiatives by Leading Organizations
The acceptance and high usage of shipping container liners in the market have increased the demand for the product. To fulfil such demands as per the need of end users related to various applications, it is used for; manufacturers are taking strategic decisions and provide new and innovative products in the market.
-
Increasing Demands for Large Packaging for Bulk Cargo Commodities
Container liners prevent the contamination of cargo and other products transported after packaging. It shields the bulk cargo from moisture and ensures that the cargo is shipped securely and hygienically. With container liners, very little handling is required in shipping, making all the operations easy. Manufacturers provide container liners in different designs and sizes to transport bulk cargo while ensuring product safety. Hence, the increasing demand for large packaging for bulk cargo commodities might create opportunities for the North America shipping container liner market.
Restraints/Challenges
- High Costs for Transportation
Due to this increased pricing in the transportation of goods, the shipping industry gets affected overall. Empirical evidence underlines that raising transport costs by 10% reduces trade volumes by more than 20%. High transportation costs impact the structure of economic activities and international trade, ultimately affecting the demand for shipping container liners
- Shortage in Shipping Containers for Transportation
To mitigate these losses, new shipping containers are to be made to resume the efficient supply chain worldwide, but still, the number of containers present is much smaller than the actual number required. This difference in the number and shortage of shipping containers significantly affects the demand for container liners
Hence, this shortfall in shipping containers will negatively affect the container liner market and is expected to hamper the market's growth.
Post-COVID-19 Impact on North America Shipping Container Liner Market
COVID-19 has affected the market to some extent. Due to the lockdown, the manufacturing and production of many small and large companies were halted as well as the demand for shipping container liner decreased as shipping and transportation activities were severely affected due to quarantine measures, which influenced the market. Due to the change in many mandates and regulations, manufacturers can design and launch new products in the market, which will help the market's growth.
Recent Developments
- United Bags Inc. has partnered with a recycling company which sets up baling machines, and periodically picks up the used FIBCs at no cost from the customers. Participants in this initiative receive certification stating that all their FIBCs have been recycled, causing no harm to the environment
North America Shipping Container Liner Market Scope
North America shipping container liner market is categorized based on type, and application. The growth amongst these segments will help you analyze major growth segments in the industries and provide the users with a valuable market overview and market insights to make strategic decisions to identify core market applications.
Type
- Polypropylene (PP) Container Liners
- polyethylene (PE) Container Liners
- Others
Based on type, the North America shipping container liner market is classified into two segments polypropylene (PP) container liners, polyethylene (PE) container liners, and others
Application
- Food and Beverages
- Chemicals
- Minerals
- Agricultural
- Others

Based on application, the North America shipping container liner market is classified into five segments food and beverages, chemicals, minerals, agricultural and others
North America Shipping Container Liner Market Regional Analysis/Insights
North America shipping container liner market is analyzed, and market size insights and trends are provided based on as referenced above.
The countries covered in the North America shipping container liner market report are U.S., Canada and Mexico.
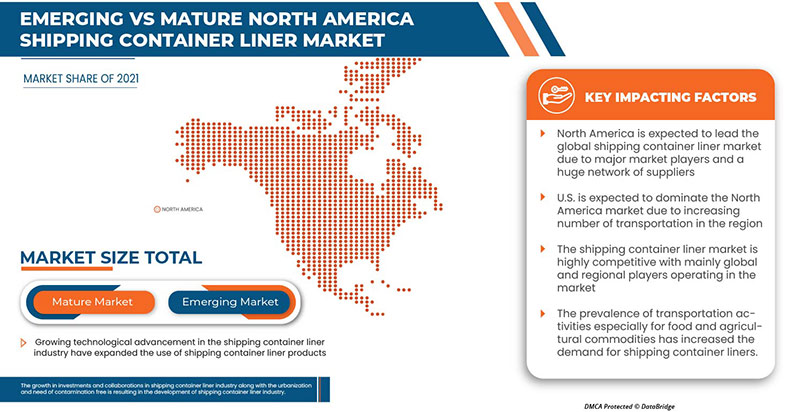
U.S. is expected to dominate the North America shipping container liner market in terms of market share and market revenue. It is estimated to maintain its dominance during the forecast period due to the growing surge for container liners in various industries and growing consumer demand from end users.
The region section of the report also provides individual market-impacting factors and changes in regulations in the market that impact the current and future trends of the market. Data points, such as new and replacement sales, country demographics, disease epidemiology, and import-export tariffs, are some of the major pointers used to forecast the market scenario for individual countries. In addition, the presence and availability of North America brands and their challenges faced due to high competition from local and domestic brands and the impact of sales channels are considered while providing forecast analysis of the country data.
Competitive Landscape and North America Shipping Container Liner Market Share Analysis
North America shipping container liner market competitive landscape provides details about the competitors. Details include company overview, company financials, revenue generated, market potential, investment in research and development, new market initiatives, North America presence, production sites and facilities, production capacities, company strengths and weaknesses, product launch, product width and breadth, and application dominance. The above data points provided are only related to the companies' focus on North America shipping container liner market.
Some of the major players operating in the North America shipping container liner market are BERRY GLOBAL INC., Eceplast, Greif, LC Packaging, Thrace Group, and United Bags Inc. among others.
Research Methodology
Data collection and base year analysis are done using data collection modules with large sample sizes. The market data is analyzed and estimated using market statistical and coherent models. In addition, market share analysis and key trend analysis are the major success factors in the market report. The key research methodology used by the DBMR research team is data triangulation which involves data mining, analysis of the impact of data variables on the market, and primary (industry expert) validation. Apart from this, data models include the Vendor Positioning Grid, Market Time Line Analysis, Market Overview and Guide, Company Positioning Grid, Company Market Share Analysis, Standards of Measurement, North America Vs Regional, and Vendor Share Analysis. Please request an analyst call in case of further inquiry.
SKU-
Get online access to the report on the World's First Market Intelligence Cloud
- Interactive Data Analysis Dashboard
- Company Analysis Dashboard for high growth potential opportunities
- Research Analyst Access for customization & queries
- Competitor Analysis with Interactive dashboard
- Latest News, Updates & Trend analysis
- Harness the Power of Benchmark Analysis for Comprehensive Competitor Tracking
Table of Content
1 INTRODUCTION
1.1 OBJECTIVES OF THE STUDY
1.2 MARKET DEFINITION
1.3 OVERVIEW OF NORTH AMERICA SHIPPING CONTAINER LINER MARKET
1.4 LIMITATIONS
1.5 MARKETS COVERED
2 MARKET SEGMENTATION
2.1 MARKETS COVERED
2.2 GEOGRAPHICAL SCOPE
2.3 YEARS CONSIDERED FOR THE STUDY
2.4 CURRENCY AND PRICING
2.5 DBMR TRIPOD DATA VALIDATION MODEL
2.6 MULTIVARIATE MODELLING
2.7 TESTING TYPE LIFELINE CURVE
2.8 PRIMARY INTERVIEWS WITH KEY OPINION LEADERS
2.9 DBMR MARKET POSITION GRID
2.1 APPLICATION COVERAGE GRID
2.11 SECONDARY SOURCES
2.12 ASSUMPTIONS
3 EXECUTIVE SUMMARY
4 PREMIUM INSIGHTS
4.1 CONSUMER BUYING BEHAVIOR
4.1.1 OVERVIEW
4.1.1.1 COMPLEX BUYING BEHAVIOR
4.1.1.2 DISSONANCE-REDUCING BUYING BEHAVIOR
4.1.1.3 HABITUAL BUYING BEHAVIOR
4.1.1.4 VARIETY-SEEKING BEHAVIOR
4.1.1.5 CONCLUSION
4.2 FACTORS INFLUENCING BUYING DECISION
4.3 PORTER'S FIVE ANALYSIS FOR THE NORTH AMERICA SHIPPING CONTAINER LINER MARKET
4.3.1 BARGAINING POWER OF BUYERS/CONSUMERS
4.3.2 BARGAINING POWER OF SUPPLIERS
4.3.3 THE THREAT OF NEW ENTRANTS
4.3.4 THREAT OF SUBSTITUTES
4.3.5 RIVALRY AMONG EXISTING COMPETITORS
4.4 PRICING INDEX
4.4.1 FOB & B2B PRICES –NORTH AMERICA SHIPPING CONTAINER LINER MARKET
4.4.2 B2B PRICES – NORTH AMERICA SHIPPING CONTAINER LINER MARKET
4.5 NORTH AMERICA SHIPPING CONTAINER LINER MARKET: RAW MATERIAL SOURCING ANALYSIS
4.5.1 POLYETHYLENE (PE)
4.5.2 POLYPROPYLENE (PP)
4.5.3 HIGH DENSITY POLYETHYLENE(HDPE) AND LOW DENSITY POLYETHYLENE (LDPE)
4.6 TRADE ANALYSIS
4.6.1 NORTH AMERICA EXPORTERS OF SHIPPING CONTAINER LINERS, HS CODE OF PRODUCT: 392321
4.6.2 NORTH AMERICA IMPORTERS OF SHIPPING CONTAINER LINER, HS CODE OF PRODUCT: 392321
4.6.3 IMPORTS BY RUSSIAN FEDERATION, HS CODE OF PRODUCT: 392321
4.6.4 EXPORTS BY RUSSIAN FEDERATION, HS CODE OF PRODUCT: 392321
4.7 PRODUCT ADOPTION SCENARIO
4.7.1 OVERVIEW
4.7.2 PRODUCT AWARENESS
4.7.3 PRODUCT INTEREST
4.7.4 PRODUCT EVALUATION
4.7.5 PRODUCT TRIAL
4.7.6 PRODUCT ADOPTION
4.7.7 CONCLUSION
5 SUPPLY CHAIN ANALYSIS
5.1 OVERVIEW
5.2 LOGISTIC COST SCENARIO
5.3 IMPORTANCE OF LOGISTICS SERVICE PROVIDERS
6 REGULATION COVERAGE
7 MARKET OVERVIEW
7.1 DRIVERS
7.1.1 RISING PREVALENCE OF CONTAINER LINERS IN THE FOOD AND AGRICULTURE INDUSTRY
7.1.2 INCREASED TRANSPORTATION ACTIVITIES REQUIRING SHIPPING CONTAINER LINERS
7.1.3 HIGHER DEMANDS DUE TO THE COST-EFFECTIVE AND REUSABILITY OF SHIPPING CONTAINER LINERS
7.1.4 WIDE APPLICABILITY OF CONTAINER LINERS IN CHEMICAL AND MINERAL TRANSPORTATION
7.2 RESTRAINTS
7.2.1 HIGH COSTS FOR TRANSPORTATION
7.2.2 SHORTAGE IN SHIPPING CONTAINERS FOR TRANSPORTATION
7.3 OPPORTUNITIES
7.3.1 STRATEGIC INITIATIVES BY LEADING ORGANIZATIONS
7.3.2 INCREASING DEMANDS FOR LARGE PACKAGING FOR BULK CARGO COMMODITIES
7.4 CHALLENGES
7.4.1 LACK OF EMPLOYEES ON PORTS
7.4.2 STRINGENT ENVIRONMENTAL REGULATIONS
8 NORTH AMERICA SHIPPING CONTAINER LINER MARKET, BY TYPE
8.1 OVERVIEW
8.2 POLYETHYLENE
8.3 POLYPROPYLENE
8.4 OTHERS
9 NORTH AMERICA SHIPPING CONTAINER LINER MARKET, BY APPLICATION
9.1 OVERVIEW
9.2 FOOD AND BEVERAGE
9.2.1 POLYPROPYLENE
9.2.2 POLYETHYLENE
9.2.3 OTHERS
9.3 CHEMICAL
9.3.1 POLYPROPYLENE
9.3.2 POLYETHYLENE
9.3.3 OTHERS
9.4 AGRICULTURAL
9.4.1 POLYPROPYLENE
9.4.2 POLYETHYLENE
9.4.3 OTHERS
9.5 MINERAL
9.5.1 POLYPROPYLENE
9.5.2 POLYETHYLENE
9.5.3 OTHERS
9.6 OTHERS
9.6.1 POLYPROPYLENE
9.6.2 POLYETHYLENE
9.6.3 OTHERS
10 NORTH AMERICA SHIPPING CONTAINER LINER MARKET, BY REGION
10.1 NORTH AMERICA
10.1.1 U.S.
10.1.2 CANADA
10.1.3 MEXICO
11 COMPANY LANDSCAPE, NORTH AMERICA SHIPPING CONTAINER LINER MARKET
11.1 COMPANY SHARE ANALYSIS: NORTH AMERICA
12 COMPANY PROFILES
12.1 BERRY NORTH AMERICA INC.
12.1.1 COMPANY SNAPSHOT
12.1.2 REVENUE ANALYSIS
12.1.3 COMPANY SHARE ANALYSIS
12.1.4 SWOT
12.1.5 PRODUCT PORTFOLIO
12.1.6 RECENT UPDATES
12.2 GREIF
12.2.1 COMPANY SNAPSHOT
12.2.2 REVENUE ANALYSIS
12.2.3 COMPANY SHARE ANALYSIS
12.2.4 SWOT
12.2.5 PRODUCT PORTFOLIO
12.2.6 RECENT UPDATE
12.3 INTERTAPE POLYMER GROUP
12.3.1 COMPANY SNAPSHOT
12.3.2 COMPANY SHARE ANALYSIS
12.3.3 PRODUCT PORTFOLIO
12.3.4 SWOT
12.3.5 RECENT UPDATE
12.4 LC PACKAGING
12.4.1 COMPANY SNAPSHOT
12.4.2 COMPANY SHARE ANALYSIS
12.4.3 PRODUCT PORTFOLIO
12.4.4 SWOT
12.4.5 RECENT UPDATES
12.5 BULK HANDLING AUSTRALIA
12.5.1 COMPANY SNAPSHOT
12.5.2 COMPANY SHARE ANALYSIS
12.5.3 PRODUCT PORTFOLIO
12.5.4 SWOT
12.5.5 RECENT UPDATE
12.6 BULK CORP INTERNATIONAL
12.6.1 COMPANY SNAPSHOT
12.6.2 PRODUCT PORTFOLIO
12.6.3 SWOT
12.6.4 RECENT UPDATES
12.7 BULK FLOW
12.7.1 COMPANY SNAPSHOT
12.7.2 PRODUCT PORTFOLIO
12.7.3 SWOT
12.7.4 RECENT UPDATES
12.8 COMPOSITE CONTAINERS, LLC
12.8.1 COMPANY SNAPSHOT
12.8.2 PRODUCT PORTFOLIO
12.8.3 SWOT
12.8.4 RECENT UPDATE
12.9 CDF CORPORATION
12.9.1 COMPANY SNAPSHOT
12.9.2 PRODUCT PORTFOLIO
12.9.3 SWOT
12.9.4 RECENT UPDATE
12.1 DEV VENTURES INDIA PVT. LTD.
12.10.1 COMPANY SNAPSHOT
12.10.2 PRODUCT PORTFOLIO
12.10.3 SWOT
12.10.4 RECENT DEVELOPMENT
12.11 ECEPLAST
12.11.1 COMPANY SNAPSHOT
12.11.2 PRODUCT PORTFOLIO
12.11.3 SWOT
12.11.4 RECENT UPDATES
12.12 NIER SYSTEMS INC.
12.12.1 COMPANY SNAPSHOT
12.12.2 PRODUCT PORTFOLIO
12.12.3 SWOT
12.12.4 RECENT UPDATES
12.13 RISHI FIBC SOLUTIONS PVT. LTD.
12.13.1 COMPANY SNAPSHOT
12.13.2 PRODUCT PORTFOLIO
12.13.3 SWOT
12.13.4 RECENT UPDATE
12.14 THRACE GROUP
12.14.1 COMPANY SNAPSHOT
12.14.2 REVENUE ANALYSIS
12.14.3 SWOT
12.14.4 PRODUCT PORTFOLIO
12.14.5 RECENT UPDATE
12.15 UNITED BAGS, INC
12.15.1 COMPANY SNAPSHOT
12.15.2 PRODUCT PORTFOLIO
12.15.3 SWOT
12.15.4 RECENT UPDATE
12.16 VEN PACK
12.16.1 COMPANY SNAPSHOT
12.16.2 PRODUCT PORTFOLIO
12.16.3 SWOT
12.16.4 RECENT UPDATES
13 SWOT ANALYSIS AND DATABRIDGE MARKET RESEARCH ANALYSIS
14 QUESTIONNAIRE
15 RELATED REPORTS
List of Table
TABLE 1 FREE ON BOARD (FOB) OF SCREEN PRINTING MESH
TABLE 2 EXPORTERS OF SHIPPING CONTAINER LINERS UNIT: USD THOUSAND
TABLE 3 IMPORTERS OF SHIPPING CONTAINER LINER , UNIT: USD THOUSAND
TABLE 4 IMPORTS BY RUSSIAN FEDERATION , UNIT: USD THOUSAND
TABLE 5 EXPORTS BY RUSSIAN FEDERATION UNIT: USD THOUSAND
TABLE 6 NORTH AMERICA SHIPPING CONTAINER LINER MARKET: BY TYPE, 2020-2029 (USD MILLION)
TABLE 7 NORTH AMERICA POLYETHYLENE IN SHIPPING CONTAINER LINER MARKET, BY REGION, 2020-2029 (USD MILLION)
TABLE 8 NORTH AMERICA POLYPROPYLENE IN SHIPPING CONTAINER LINER MARKET, BY REGION, 2020-2029 (USD MILLION)
TABLE 9 NORTH AMERICA OTHERS IN SHIPPING CONTAINER LINER MARKET, BY REGION, 2020-2029 (USD MILLION)
TABLE 10 NORTH AMERICA SHIPPING CONTAINER LINER MARKET: BY APPLICATION, 2020-2029 (USD MILLION)
TABLE 11 NORTH AMERICA FOOD AND BEVERAGE IN SHIPPING CONTAINER LINER MARKET, BY REGION, 2020-2029 (USD MILLION)
TABLE 12 NORTH AMERICA FOOD AND BEVERAGE IN SHIPPING CONTAINER LINER MARKET, BY TYPE, 2020-2029 (USD MILLION)
TABLE 13 NORTH AMERICA CHEMICAL IN SHIPPING CONTAINER LINER MARKET, BY REGION, 2020-2029 (USD MILLION)
TABLE 14 NORTH AMERICA CHEMICAL IN SHIPPING CONTAINER LINER MARKET, BY TYPE, 2020-2029 (USD MILLION)
TABLE 15 NORTH AMERICA AGRICULTURAL IN SHIPPING CONTAINER LINER MARKET, BY REGION, 2020-2029 (USD MILLION)
TABLE 16 NORTH AMERICA AGRICULTURAL IN SHIPPING CONTAINER LINER MARKET, BY TYPE, 2020-2029 (USD MILLION)
TABLE 17 NORTH AMERICA MINERAL IN SHIPPING CONTAINER LINER MARKET, BY REGION, 2020-2029 (USD MILLION)
TABLE 18 NORTH AMERICA MINERAL IN SHIPPING CONTAINER LINER MARKET, BY TYPE, 2020-2029 (USD MILLION)
TABLE 19 NORTH AMERICA OTHERS IN SHIPPING CONTAINER LINER MARKET, BY REGION, 2020-2029 (USD MILLION)
TABLE 20 NORTH AMERICA OTHERS IN SHIPPING CONTAINER LINER MARKET, BY TYPE, 2020-2029 (USD MILLION)
TABLE 21 NORTH AMERICA SHIPPING CONTAINER LINER MARKET, BY COUNTRY, 2020-2029 (USD MILLION)
TABLE 22 NORTH AMERICA SHIPPING CONTAINER LINER MARKET, BY TYPE, 2020-2029 (USD MILLION)
TABLE 23 NORTH AMERICA SHIPPING CONTAINER LINER MARKET, BY APPLICATION, 2020-2029 (USD MILLION)
TABLE 24 NORTH AMERICA FOOD & BEVERAGES IN SHIPPING CONTAINER LINER MARKET, BY TYPE, 2020-2029 (USD MILLION)
TABLE 25 NORTH AMERICA CHEMICAL IN SHIPPING CONTAINER LINER MARKET, BY TYPE, 2020-2029 (USD MILLION)
TABLE 26 NORTH AMERICA AGRICULTURAL IN SHIPPING CONTAINER LINER MARKET, BY TYPE, 2020-2029 (USD MILLION)
TABLE 27 NORTH AMERICA MINERAL IN SHIPPING CONTAINER LINER MARKET, BY TYPE, 2020-2029 (USD MILLION)
TABLE 28 NORTH AMERICA OTHERS IN SHIPPING CONTAINER LINER MARKET, BY TYPE, 2020-2029 (USD MILLION)
TABLE 29 U.S. SHIPPING CONTAINER LINER MARKET, BY TYPE, 2020-2029 (USD MILLION)
TABLE 30 U.S. SHIPPING CONTAINER LINER MARKET, BY APPLICATION, 2020-2029 (USD MILLION)
TABLE 31 U.S. FOOD & BEVERAGES IN SHIPPING CONTAINER LINER MARKET, BY TYPE, 2020-2029 (USD MILLION)
TABLE 32 U.S. CHEMICAL IN SHIPPING CONTAINER LINER MARKET, BY TYPE, 2020-2029 (USD MILLION)
TABLE 33 U.S. AGRICULTURAL IN SHIPPING CONTAINER LINER MARKET, BY TYPE, 2020-2029 (USD MILLION)
TABLE 34 U.S. MINERAL IN SHIPPING CONTAINER LINER MARKET, BY TYPE, 2020-2029 (USD MILLION)
TABLE 35 U.S. OTHERS IN SHIPPING CONTAINER LINER MARKET, BY TYPE, 2020-2029 (USD MILLION)
TABLE 36 CANADA SHIPPING CONTAINER LINER MARKET, BY TYPE, 2020-2029 (USD MILLION)
TABLE 37 CANADA SHIPPING CONTAINER LINER MARKET, BY APPLICATION, 2020-2029 (USD MILLION)
TABLE 38 CANADA FOOD & BEVERAGES IN SHIPPING CONTAINER LINER MARKET, BY TYPE, 2020-2029 (USD MILLION)
TABLE 39 CANADA CHEMICAL IN SHIPPING CONTAINER LINER MARKET, BY TYPE, 2020-2029 (USD MILLION)
TABLE 40 CANADA AGRICULTURAL IN SHIPPING CONTAINER LINER MARKET, BY TYPE, 2020-2029 (USD MILLION)
TABLE 41 CANADA MINERAL IN SHIPPING CONTAINER LINER MARKET, BY TYPE, 2020-2029 (USD MILLION)
TABLE 42 CANADA OTHERS IN SHIPPING CONTAINER LINER MARKET, BY TYPE, 2020-2029 (USD MILLION)
TABLE 43 MEXICO SHIPPING CONTAINER LINER MARKET, BY TYPE, 2020-2029 (USD MILLION)
TABLE 44 MEXICO SHIPPING CONTAINER LINER MARKET, BY APPLICATION, 2020-2029 (USD MILLION)
TABLE 45 MEXICO FOOD & BEVERAGES IN SHIPPING CONTAINER LINER MARKET, BY TYPE, 2020-2029 (USD MILLION)
TABLE 46 MEXICO CHEMICAL IN SHIPPING CONTAINER LINER MARKET, BY TYPE, 2020-2029 (USD MILLION)
TABLE 47 MEXICO AGRICULTURAL IN SHIPPING CONTAINER LINER MARKET, BY TYPE, 2020-2029 (USD MILLION)
TABLE 48 MEXICO MINERAL IN SHIPPING CONTAINER LINER MARKET, BY TYPE, 2020-2029 (USD MILLION)
TABLE 49 MEXICO OTHERS IN SHIPPING CONTAINER LINER MARKET, BY TYPE, 2020-2029 (USD MILLION)
List of Figure
FIGURE 1 NORTH AMERICA SHIPPING CONTAINER LINER MARKET: SEGMENTATION
FIGURE 2 NORTH AMERICA SHIPPING CONTAINER LINER MARKET: DATA TRIANGULATION
FIGURE 3 NORTH AMERICA SHIPPING CONTAINER LINER MARKET: DROC ANALYSIS
FIGURE 4 NORTH AMERICA SHIPPING CONTAINER LINER MARKET: NORTH AMERICA VS REGIONAL MARKET ANALYSIS
FIGURE 5 NORTH AMERICA SHIPPING CONTAINER LINER MARKET: COMPANY RESEARCH ANALYSIS
FIGURE 6 NORTH AMERICA SHIPPING CONTAINER LINER MARKET: INTERVIEW DEMOGRAPHICS
FIGURE 7 NORTH AMERICA SHIPPING CONTAINER LINER MARKET: DBMR SAFETY MARKET POSITION GRID
FIGURE 8 NORTH AMERICA SHIPPING CONTAINER LINER MARKET: APPLICATION COVERAGE GRID
FIGURE 9 NORTH AMERICA SHIPPING CONTAINER LINER MARKET: SEGMENTATION
FIGURE 10 RISING PREVALANCE OF SHIPPING CONTAINER LINER IN FOOD AND AGRICULTURE INSUTRY IS DRIVING THE NORTH AMERICA SHIPPING CONTAINER LINER MARKET IN THE FORECAST PERIOD
FIGURE 11 XXX SEGMENT IS EXPECTED TO ACCOUNT FOR THE LARGEST SHARE OF THE NORTH AMERICA SHIPPING CONTAINER LINER MARKET IN 2022 & 2029
FIGURE 12 NORTH AMERICA SHIPPING CONTAINER LINER MARKET: TYPES OF CONSUMER BUYING BEHAVIOR
FIGURE 13 PORTER'S 5 ANALYSIS
FIGURE 14 NORTH AMERICA SHIPPING CONTAINER LINER MARKET: PRODUCT ADOPTION SCENARIO
FIGURE 15 DRIVERS, RESTRAINTS, OPPORTUNITIES, AND CHALLENGES OF THE NORTH AMERICA SHIPPING CONTAINER LINER MARKET
FIGURE 16 NORTH AMERICA SHIPPING CONTAINER LINER MARKET: BY TYPE, 2021
FIGURE 17 NORTH AMERICA SHIPPING CONTAINER LINER MARKET: BY APPLICATION, 2021
FIGURE 18 NORTH AMERICA SHIPPING CONTAINER LINER MARKET: SNAPSHOT (2021)
FIGURE 19 NORTH AMERICA SHIPPING CONTAINER LINER MARKET: BY COUNTRY (2021)
FIGURE 20 NORTH AMERICA SHIPPING CONTAINER LINER MARKET: BY COUNTRY (2022 & 2029)
FIGURE 21 NORTH AMERICA SHIPPING CONTAINER LINER MARKET: BY COUNTRY (2021 & 2029)
FIGURE 22 NORTH AMERICA SHIPPING CONTAINER LINER MARKET: BY TYPE (2022 & 2029)
FIGURE 23 NORTH AMERICA SHIPPING CONTAINER LINER MARKET: COMPANY SHARE 2021 (%)

North America Shipping Container Liner Market, Supply Chain Analysis and Ecosystem Framework
To support market growth and help clients navigate the impact of geopolitical shifts, DBMR has integrated in-depth supply chain analysis into its North America Shipping Container Liner Market research reports. This addition empowers clients to respond effectively to global changes affecting their industries. The supply chain analysis section includes detailed insights such as North America Shipping Container Liner Market consumption and production by country, price trend analysis, the impact of tariffs and geopolitical developments, and import and export trends by country and HSN code. It also highlights major suppliers with data on production capacity and company profiles, as well as key importers and exporters. In addition to research, DBMR offers specialized supply chain consulting services backed by over a decade of experience, providing solutions like supplier discovery, supplier risk assessment, price trend analysis, impact evaluation of inflation and trade route changes, and comprehensive market trend analysis.
Research Methodology
Data collection and base year analysis are done using data collection modules with large sample sizes. The stage includes obtaining market information or related data through various sources and strategies. It includes examining and planning all the data acquired from the past in advance. It likewise envelops the examination of information inconsistencies seen across different information sources. The market data is analysed and estimated using market statistical and coherent models. Also, market share analysis and key trend analysis are the major success factors in the market report. To know more, please request an analyst call or drop down your inquiry.
The key research methodology used by DBMR research team is data triangulation which involves data mining, analysis of the impact of data variables on the market and primary (industry expert) validation. Data models include Vendor Positioning Grid, Market Time Line Analysis, Market Overview and Guide, Company Positioning Grid, Patent Analysis, Pricing Analysis, Company Market Share Analysis, Standards of Measurement, Global versus Regional and Vendor Share Analysis. To know more about the research methodology, drop in an inquiry to speak to our industry experts.
Customization Available
Data Bridge Market Research is a leader in advanced formative research. We take pride in servicing our existing and new customers with data and analysis that match and suits their goal. The report can be customized to include price trend analysis of target brands understanding the market for additional countries (ask for the list of countries), clinical trial results data, literature review, refurbished market and product base analysis. Market analysis of target competitors can be analyzed from technology-based analysis to market portfolio strategies. We can add as many competitors that you require data about in the format and data style you are looking for. Our team of analysts can also provide you data in crude raw excel files pivot tables (Fact book) or can assist you in creating presentations from the data sets available in the report.


