
North America Epigenetics Diagnostic Market
Market Size in USD Billion
CAGR :
% 
 USD
3.29 Billion
USD
10.82 Billion
2024
2032
USD
3.29 Billion
USD
10.82 Billion
2024
2032
| 2025 –2032 | |
| USD 3.29 Billion | |
| USD 10.82 Billion | |
| % | |
|
North America Epigenetics Diagnostic Market Size
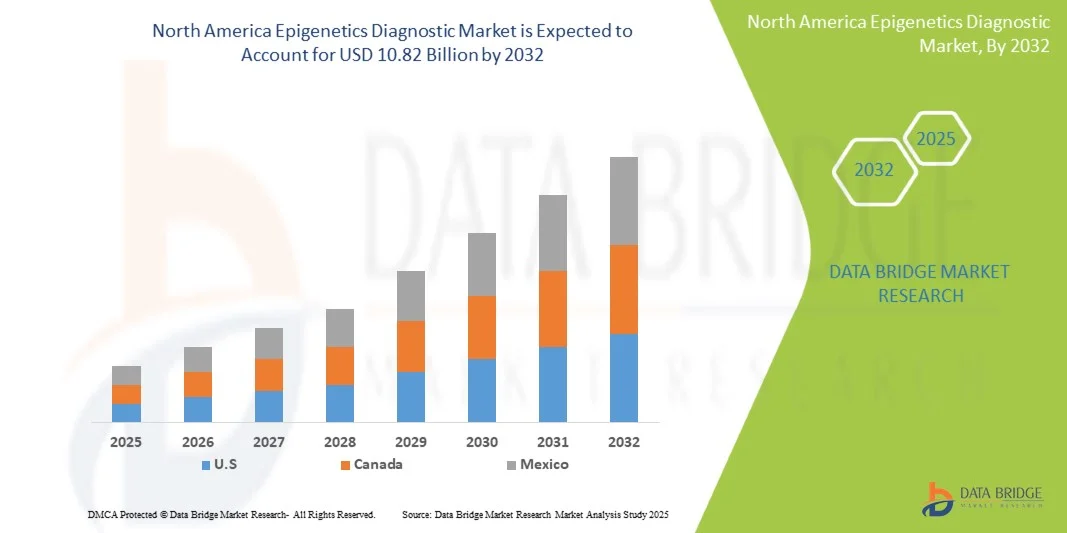
- The North America Epigenetics Diagnostic Market size was valued at USD 3.29 billion in 2024 and is expected to reach USD 10.82 billion by 2032, at a CAGR of 16.00% during the forecast period
- The market growth is largely fueled by the increasing adoption of advanced molecular biology techniques and the integration of next-generation sequencing (NGS) technologies, which are enhancing the accuracy and efficiency of epigenetic diagnostics in research and clinical applications
- Furthermore, rising demand for early disease detection, personalized medicine, and biomarker-based diagnostics is driving the adoption of Epigenetics Diagnostic solutions. These converging factors are accelerating the uptake of Epigenetics Diagnostic solutions, thereby significantly boosting the industry's growth
North America Epigenetics Diagnostic Market Analysis
- The North America Epigenetics Diagnostic Market involves the use of epigenetic markers and assays to detect, monitor, and manage diseases such as cancer, cardiovascular disorders, and neurological conditions, offering minimally invasive, precise, and personalized diagnostic solutions
- The escalating demand for epigenetics diagnostic solutions is primarily fueled by the rising prevalence of chronic diseases, growing adoption of precision medicine, and increasing awareness of early disease detection among healthcare providers and patients
- U.S. dominated the North America Epigenetics Diagnostic Market with the largest revenue share of 87.3% in 2024, supported by advanced healthcare infrastructure, high adoption of molecular diagnostic technologies, and substantial investments in clinical research and diagnostic facilities. The country experienced notable growth due to rising prevalence of cancer and chronic diseases, increasing demand for early detection, and innovations in high-throughput epigenetic testing platforms
- Canada is expected to be the fastest-growing country in the North America Epigenetics Diagnostic Market during the forecast period, attributed to increasing healthcare infrastructure investments, growing awareness of precision medicine, rising prevalence of lifestyle-related diseases, and expanding medical research initiatives
- The oncology segment dominated the North America Epigenetics Diagnostic Market with 46.3% revenue share in 2024. Rising cancer prevalence, increased early detection initiatives, and adoption of epigenetic biomarkers fuel this dominance
Report Scope and North America Epigenetics Diagnostic Market Segmentation
|
Attributes |
North America Epigenetics Diagnostic Key Market Insights |
|
Segments Covered |
|
|
Countries Covered |
North America
|
|
Key Market Players |
|
|
Market Opportunities |
|
|
Value Added Data Infosets |
In addition to the insights on market scenarios such as market value, growth rate, segmentation, geographical coverage, and major players, the market reports curated by the Data Bridge Market Research also include in-depth expert analysis, pricing analysis, brand share analysis, consumer survey, demography analysis, supply chain analysis, value chain analysis, raw material/consumables overview, vendor selection criteria, PESTLE Analysis, Porter Analysis, and regulatory framework. |
North America Epigenetics Diagnostic Market Trends
“AI-Driven Advancements and Enhanced Diagnostic Precision in Epigenetics”
- A significant and accelerating trend in the North America Epigenetics Diagnostic Market is the integration of artificial intelligence (AI) and machine learning algorithms to enhance biomarker identification and predictive analytics. This integration is improving diagnostic accuracy, disease monitoring, and personalized treatment planning
- Leading companies are leveraging AI to analyze DNA methylation patterns, histone modifications, and chromatin accessibility, enabling the early detection of complex diseases such as cancer and cardiovascular disorders
- AI-based platforms facilitate rapid interpretation of large genomic datasets, reducing analysis time and providing more actionable insights for clinicians
- Integration with cloud-based systems allows centralized management of patient epigenetic data, enabling remote consultation, collaborative research, and real-time reporting across healthcare institutions
- AI algorithms can continuously learn from new data, improving predictive accuracy over time and supporting longitudinal patient monitoring for disease progression and therapeutic response
- In addition, AI helps prioritize high-risk patient populations, suggesting optimized testing strategies, reducing unnecessary tests, and increasing overall workflow efficiency
- Companies such as Guardant Health, EpigenDx, and Exact Sciences are actively developing AI-enabled epigenetic assays for both clinical and research applications, focusing on early detection and personalized medicine
- The trend toward more data-driven, precise, and predictive diagnostics is reshaping expectations among healthcare providers, research institutes, and payers
- Increasing collaboration between AI developers and healthcare providers is accelerating the adoption of AI-based epigenetic diagnostics in clinical practice
- The integration of AI also enables seamless reporting and visualization tools, assisting physicians in interpreting complex epigenetic data efficiently
North America Epigenetics Diagnostic Market Dynamics
Driver
“Rising Demand for Early Detection, Precision Medicine, and Personalized Healthcare”
- The growing incidence of cancer, metabolic disorders, neurological diseases, and cardiovascular conditions is driving the demand for accurate epigenetic diagnostics
- Early disease detection through epigenetic biomarkers allows timely intervention, significantly improving patient outcomes and survival rates
- Personalized medicine initiatives are encouraging healthcare providers to adopt epigenetic testing to tailor therapies based on individual epigenetic profiles
- Government funding and private investments in genomics and precision medicine research are supporting the development of novel epigenetic assays
- Hospitals, specialty clinics, and research institutions are increasingly incorporating epigenetic diagnostics into standard clinical workflows for disease risk assessment and monitoring
- Advancements in non-invasive testing methods, such as liquid biopsies, are expanding the application of epigenetic diagnostics in routine patient care
- Awareness campaigns and education among clinicians regarding the clinical utility of epigenetic biomarkers are boosting market adoption
- The ability to predict patient response to therapies and monitor disease recurrence enhances the attractiveness of epigenetic diagnostics
- Integration with AI and machine learning platforms provides improved diagnostic accuracy, which is increasingly valued by healthcare provider
- Expansion of collaborative research programs between academic institutions and biotech companies is further accelerating technological innovations and market growth
Restraint/Challenge
“High Cost, Regulatory Barriers, and Data Privacy Concerns”
- The high cost of advanced epigenetic diagnostic tests remains a major barrier, particularly in developing regions or smaller healthcare facilities
- Complex laboratory requirements and the need for highly trained personnel restrict widespread adoption
- Regulatory approval processes for novel epigenetic assays can be time-consuming, delaying product launch and market availability
- Variability in reimbursement policies across countries creates uncertainties for healthcare providers and patients
- Ethical and privacy concerns regarding genomic and epigenetic data handling may limit patient willingness to undergo testing
- Integration of AI-based platforms requires significant IT infrastructure and data security measures, posing additional investment challenges
- Lack of standardization in epigenetic testing procedures and reference databases may affect result reliability
- Market growth may be hindered by limited awareness among clinicians regarding the clinical utility and interpretation of complex epigenetic data
- The need for continuous software updates and validation of AI algorithms increases operational costs for laboratories
- Overcoming these challenges requires collaboration between regulatory authorities, healthcare providers, and industry players to ensure standardized, cost-effective, and secure diagnostic solutions
North America Epigenetics Diagnostic Market Scope
The North America Epigenetics Diagnostic Market is segmented on the basis of product, technology, type of therapy, application, end user, and distribution channel.
• By Product
On the basis of product, the North America Epigenetics Diagnostic Market is segmented into reagents, kits, instruments & consumables, and bioinformatics tools & enzymes. The reagents segment dominated the largest market revenue share of 42.8% in 2024. This is driven by their essential role in sample preparation, detection, and analysis across epigenetic studies. Reagents are highly reliable, compatible with multiple assay platforms, and provide reproducible results, making them indispensable in both research and clinical diagnostics. The growing adoption of precision medicine and biomarker-based diagnostics further propels demand. Academic research and pharmaceutical companies rely heavily on high-quality reagents to achieve consistent outcomes. Moreover, specialized reagents for DNA methylation, histone modifications, and RNA analysis strengthen their market position. The segment benefits from continuous innovation in reagent formulation and improved shelf life. Rising investment in epigenetic research globally supports market growth. Reagents also facilitate automation in high-throughput laboratories. The COVID-19 pandemic highlighted the importance of rapid and accurate diagnostic reagents, boosting awareness and adoption. Strategic collaborations among reagent manufacturers and research institutes continue to expand availability. Overall, reagents remain a backbone of epigenetics diagnostic workflows.
The instruments & consumables segment is anticipated to witness the fastest CAGR of 20.3% from 2025 to 2032. This growth is fueled by increasing demand for high-throughput, automated, and precise epigenetic diagnostic platforms. Instruments such as next-generation sequencers and real-time PCR machines enhance assay accuracy and reproducibility. The segment benefits from trends toward miniaturized and portable devices suitable for decentralized labs. Consumables like tips, plates, and tubes are critical for assay reliability and efficiency. Rising adoption in hospitals, research institutes, and biotech companies drives volume demand. Advanced automation reduces human error and processing time. Increasing investments in personalized medicine and targeted therapies further boost adoption. New instrument launches with integrated software solutions attract end users seeking streamlined workflows. Continuous development in assay-specific consumables enhances performance. Growing collaborations between instrument manufacturers and bioinformatics providers also expand market penetration. Emerging applications in oncology, cardiovascular, and metabolic research propel growth further.
• By Technology
On the basis of technology, the North America Epigenetics Diagnostic Market is segmented into DNA methylation, histone methylation, chromatin structures, histone acetylation, and large non-coding RNA & microRNA modification. The DNA methylation segment dominated with a revenue share of 44.5% in 2024, as it is a key biomarker in cancer, cardiovascular, and metabolic diseases. Its widespread adoption stems from cost-effective, reproducible assays and validated clinical utility. DNA methylation is crucial for early disease detection and prognosis, supporting clinical decision-making. Both research labs and diagnostic companies extensively use DNA methylation profiling. Its applications in precision medicine and epigenetic therapy monitoring enhance demand. Established assay kits and platforms provide reliability and ease of use. Regulatory approvals for diagnostic tests based on DNA methylation biomarkers further strengthen market position. Academic and pharma research continuously invests in methylation studies, sustaining demand. DNA methylation detection methods are compatible with high-throughput systems. Integration with bioinformatics tools allows deeper insights into epigenetic regulation. The segment’s growth is backed by increasing public and private funding in epigenetics research.
The histone methylation segment is expected to witness the fastest CAGR of 19.6% from 2025 to 2032. The growth is driven by its role in understanding disease progression and identifying therapeutic targets. Histone methylation profiling is increasingly adopted in oncology and inflammatory disease research. Advanced detection techniques, including ChIP-seq, enhance sensitivity and precision. Demand is rising in both academic and pharmaceutical sectors. New assay kits and instruments targeting histone modifications are being launched. Research in chromatin remodeling and epigenetic therapy development fuels adoption. High throughput and automated platforms improve scalability and efficiency. Global initiatives for epigenetic research support expansion. Contract research organizations are increasingly outsourcing histone methylation studies. Integration with computational biology and bioinformatics strengthens analytical capabilities. Histone methylation is becoming essential in personalized medicine applications.
• By Type of Therapy
On the basis of type of therapy, the North America Epigenetics Diagnostic Market is segmented into histone deacetylase (HDAC) inhibitors, DNA methyltransferase (DNMT) inhibitors, and others. The HDAC inhibitors segment dominated the market with a 40.2% revenue share in 2024. They are widely used in cancer treatment and clinical research due to their ability to modulate gene expression epigenetically. HDAC inhibitors have well-established clinical pipelines, making them highly adopted in hospitals and pharmaceutical studies. Their therapeutic relevance in hematologic and solid tumors drives demand. The segment benefits from ongoing R&D in combination therapies. Regulatory approvals for multiple HDAC inhibitors provide market credibility. Academic research exploring HDAC pathways sustains consistent use. Pharma companies invest in HDAC inhibitor-based drug discovery. HDAC inhibitors are applied in inflammatory and metabolic disease research. Established manufacturing processes and reproducibility of compounds strengthen adoption. Clinical trial activity globally supports steady market growth. Continuous innovation in HDAC formulations ensures segment dominance.
The DNMT inhibitors segment is projected to register the fastest CAGR of 18.9% from 2025 to 2032. Growth is driven by increased research in epigenetic therapy and personalized medicine. DNMT inhibitors target DNA methylation patterns linked to cancer and other chronic diseases. Rising clinical trials exploring DNMT inhibitors expand adoption. Academic and pharmaceutical labs increasingly implement DNMT inhibitor studies. Combination therapy research enhances their application scope. Emerging markets are investing in DNMT inhibitor accessibility. Technological advances in formulation and delivery improve efficacy. Awareness of epigenetic targets in cardiovascular and metabolic diseases further boosts growth. Continuous pipeline expansion by pharma companies supports market momentum. DNMT inhibitors are increasingly incorporated into precision medicine initiatives. Adoption is further reinforced by growing government and private funding.
• By Application
On the basis of application, the North America Epigenetics Diagnostic Market is segmented into oncology, cardiovascular diseases, metabolic diseases, immunology, inflammatory diseases, infectious diseases, and others. The oncology segment dominated the market with 46.3% revenue share in 2024. Rising cancer prevalence, increased early detection initiatives, and adoption of epigenetic biomarkers fuel this dominance. Oncology applications rely heavily on DNA methylation, histone modifications, and non-coding RNA profiling. Clinical utility in prognosis, therapy selection, and treatment monitoring drives demand. Both hospitals and research institutes extensively adopt oncology-focused epigenetic diagnostics. Commercial companies develop oncology-specific kits and instruments. Funding for cancer research supports continual growth. Integration with high-throughput platforms allows efficient screening of large patient cohorts. Advanced bioinformatics tools enhance actionable insights. Government initiatives promoting cancer screening further boost adoption. Collaborations between diagnostic firms and oncology centers strengthen market presence.
The cardiovascular diseases segment is expected to witness the fastest CAGR of 19.2% from 2025 to 2032. Growth is fueled by emerging research linking epigenetic mechanisms to heart disease. Adoption of epigenetic diagnostic tools for early detection and risk stratification is increasing. Hospitals and research labs are investing in biomarker profiling. DNA methylation and histone modification assays are applied in cardiovascular research. Technological advancements in detection platforms enhance accuracy and throughput. Increasing prevalence of cardiovascular disorders worldwide drives market potential. Academic studies and pharmaceutical R&D contribute to rising adoption. Integration with personalized medicine programs accelerates growth. Investment in diagnostic infrastructure supports accessibility. Awareness campaigns and clinical guidelines incorporating epigenetics further propel demand.
• By End User
On the basis of end user, the North America Epigenetics Diagnostic Market is segmented into academic and research institutes, pharmaceutical and biotechnology companies, contract research organizations (CROs), and others. The academic and research institutes segment accounted for the largest market revenue share of 43.7% in 2024. Institutions conduct extensive epigenetics research, focusing on biomarker discovery, disease mechanisms, and therapeutic development. Availability of research grants and funding strengthens adoption. High investment in molecular biology infrastructure supports sophisticated assays. Collaboration with pharmaceutical companies ensures access to reagents, kits, and instruments. Research output drives innovation in epigenetic diagnostics. Integration with bioinformatics platforms improves analysis and reproducibility. Training of skilled personnel ensures optimal utilization of tools. Global research initiatives in oncology, cardiovascular, and metabolic diseases support segment dominance. Peer-reviewed publications and patent activities sustain long-term demand. Continuous expansion of research programs fuels reagent and instrument consumption.
The pharmaceutical and biotechnology companies segment is expected to witness the fastest CAGR of 18.5% from 2025 to 2032. Companies focus on drug discovery, epigenetic therapy development, and clinical trials. Rising investment in precision medicine accelerates adoption. CRO partnerships enhance scalability and expertise. Demand for high-quality reagents, instruments, and bioinformatics tools is increasing. Advanced technologies enable better compound screening and efficacy evaluation. Pharma R&D pipelines in oncology and metabolic disorders drive market growth. Emerging applications in immunology and infectious diseases support expansion. Strategic collaborations with academic institutes facilitate knowledge transfer. Regulatory approvals of novel diagnostics bolster adoption. Global competition encourages continuous innovation.
• By Distribution Channel
On the basis of distribution channel, the North America Epigenetics Diagnostic Market is segmented into Direct Tender and Retail Sales. The direct tender segment dominated the market in 2024, accounting for the largest revenue share of approximately 48.5%. This dominance is primarily due to the preference of hospitals, academic institutions, and large research organizations to procure high-value diagnostic instruments and reagents directly from manufacturers or authorized distributors. Direct tender ensures reliability, bulk purchasing benefits, and better after-sales support, which is crucial for sophisticated epigenetic diagnostic tools. Large-scale end users often prefer this channel as it allows them to negotiate customized contracts, receive technical training, and ensure uninterrupted supply for critical research and clinical applications. Moreover, direct tender offers the advantage of access to premium products, advanced technologies, and comprehensive maintenance services, which are essential for precise diagnostics. The segment benefits from long-term agreements with leading manufacturers, ensuring consistent product quality and regulatory compliance. In addition, direct tender facilitates better integration of instruments, reagents, and bioinformatics tools, which is crucial for streamlined workflows in research and clinical laboratories. The high-value nature of products, including instruments, kits, and bioinformatics software, makes direct tender the preferred channel among institutional buyers. Furthermore, manufacturers often provide tailored solutions and post-installation technical support through this channel, enhancing customer loyalty and repeat purchases.
The retail sales segment is expected to witness the fastest CAGR of 18.3% from 2025 to 2032. This growth is driven by the increasing accessibility of epigenetic diagnostic kits, reagents, and consumables for smaller laboratories, specialty clinics, and individual researchers. Retail channels offer convenience and faster procurement cycles, enabling smaller end users to adopt cutting-edge technologies without engaging in complex tender processes. The expansion of e-commerce platforms and online marketplaces has further accelerated the adoption of retail sales, allowing researchers and clinical labs to purchase instruments, consumables, and bioinformatics tools directly with minimal lead time. In addition, the growing trend of personalized medicine and demand for at-home or decentralized testing kits contribute to the rising adoption of retail sales channels. Retail channels also facilitate broader market penetration in semi-urban and regional markets, where direct tender may be less accessible. Manufacturers are increasingly offering bundled solutions and promotional packages through retail, enhancing affordability and adoption. Marketing strategies, such as discounts for first-time buyers and flexible payment options, are boosting retail adoption. The segment also benefits from increased awareness and training initiatives for retail customers, encouraging the usage of advanced epigenetics diagnostics. Moreover, retail sales channels help in creating brand visibility, expanding reach to new end users, and enabling faster feedback collection for product improvement.
North America Epigenetics Diagnostic Market Regional Analysis
- U.S. dominated the North America Epigenetics Diagnostic Market with the largest revenue share of 87.3% in 2024, supported by advanced healthcare infrastructure, high adoption of molecular diagnostic technologies, and substantial investments in clinical research and diagnostic facilities. The country experienced notable growth due to rising prevalence of cancer and chronic diseases, increasing demand for early detection, and innovations in high-throughput epigenetic testing platforms
- Canada is expected to be the fastest-growing country in the North America Epigenetics Diagnostic Market during the forecast period, attributed to increasing healthcare infrastructure investments, growing awareness of precision medicine, rising prevalence of lifestyle-related diseases, and expanding medical research initiatives
- Strong investments in clinical research, diagnostic facilities, and precision medicine are supporting the growth of the market
U.S. North America Epigenetics Diagnostic Market Insight
The U.S. North America Epigenetics Diagnostic Market captured the largest revenue share of 87.3% in 2024 within North America, fueled by rising prevalence of cancer and other chronic diseases, increasing demand for early detection, and innovations in high-throughput epigenetic testing platforms. Expansion of diagnostic laboratories, growing awareness of personalized medicine among healthcare professionals, and government initiatives to support advanced diagnostic tools are further propelling market growth.
Canada North America Epigenetics Diagnostic Market Insight
The Canada North America Epigenetics Diagnostic Market is expected to be the fastest-growing country in the North America Epigenetics Diagnostic Market during the forecast period, attributed to increasing healthcare infrastructure investments, rising awareness of precision medicine, and expanding medical research initiatives. The country’s focus on improving access to advanced diagnostic services, combined with government and private sector collaborations, is driving the adoption of epigenetic diagnostic technologies.
North America Epigenetics Diagnostic Market Share
The Epigenetics Diagnostic industry is primarily led by well-established companies, including:
- PerkinElmer (U.S.)
- Diagenode (Belgium)
- F. Hoffman-La Roche Ltd (Switzerland)
- EpiCypher (U.S.)
- Promega Corporation (U.S.)
- QIAGEN (Germany)
- PacBio (U.S.)
- Epigenomics AG (Germany)
- Reaction Biology (U.S.)
- Bio-Rad Laboratories, Inc. (U.S.)
- Agilent Technologies, Inc. (U.S.)
- Merck KGaA (Germany)
- Illumina, Inc. (U.S.)
- ACTIVEMOTIF (U.S.)
- Thermo Fisher Scientific, Inc. (U.S.)
- EpiGentek Group Inc. (U.S.)
- Enzo Life Sciences, Inc. (U.S.)
- Epizyme, Inc. (U.S.)
Latest Developments in North America Epigenetics Diagnostic Market
- In May 2025, a collaborative research team from leading U.S. academic institutions published a groundbreaking study introducing a DNA methylation classification model capable of predicting organ and disease site origins from cell-free DNA (cfDNA). This model, utilizing machine learning and harmonized methylation datasets, demonstrated high accuracy in distinguishing tissue-specific methylation profiles, offering significant potential for non-invasive diagnostics in oncology and inflammatory diseases
- In July 2024, the U.S. Food and Drug Administration (FDA) approved a novel epigenetic biomarker test for early detection of colorectal cancer. Developed by a biotechnology firm based in California, this test analyzes DNA methylation patterns in blood samples, providing a minimally invasive screening option that enhances early diagnosis and treatment outcomes
- In March 2023, a U.S.-based pharmaceutical company announced the initiation of a Phase II clinical trial for an epigenetic drug targeting DNA methyltransferase enzymes. The trial aims to assess the efficacy of this novel therapeutic approach in treating patients with advanced solid tumors, marking a significant step toward integrating epigenetic therapies into cancer treatment regimens
SKU-
Get online access to the report on the World's First Market Intelligence Cloud

- Interactive Data Analysis Dashboard
- Company Analysis Dashboard for high growth potential opportunities
- Research Analyst Access for customization & queries
- Competitor Analysis with Interactive dashboard
- Latest News, Updates & Trend analysis
- Harness the Power of Benchmark Analysis for Comprehensive Competitor Tracking
Research Methodology
Data collection and base year analysis are done using data collection modules with large sample sizes. The stage includes obtaining market information or related data through various sources and strategies. It includes examining and planning all the data acquired from the past in advance. It likewise envelops the examination of information inconsistencies seen across different information sources. The market data is analysed and estimated using market statistical and coherent models. Also, market share analysis and key trend analysis are the major success factors in the market report. To know more, please request an analyst call or drop down your inquiry.
The key research methodology used by DBMR research team is data triangulation which involves data mining, analysis of the impact of data variables on the market and primary (industry expert) validation. Data models include Vendor Positioning Grid, Market Time Line Analysis, Market Overview and Guide, Company Positioning Grid, Patent Analysis, Pricing Analysis, Company Market Share Analysis, Standards of Measurement, Global versus Regional and Vendor Share Analysis. To know more about the research methodology, drop in an inquiry to speak to our industry experts.
Customization Available
Data Bridge Market Research is a leader in advanced formative research. We take pride in servicing our existing and new customers with data and analysis that match and suits their goal. The report can be customized to include price trend analysis of target brands understanding the market for additional countries (ask for the list of countries), clinical trial results data, literature review, refurbished market and product base analysis. Market analysis of target competitors can be analyzed from technology-based analysis to market portfolio strategies. We can add as many competitors that you require data about in the format and data style you are looking for. Our team of analysts can also provide you data in crude raw excel files pivot tables (Fact book) or can assist you in creating presentations from the data sets available in the report.

