Market Analysis and Insights: Middle East and Africa Semiconductor IP Market
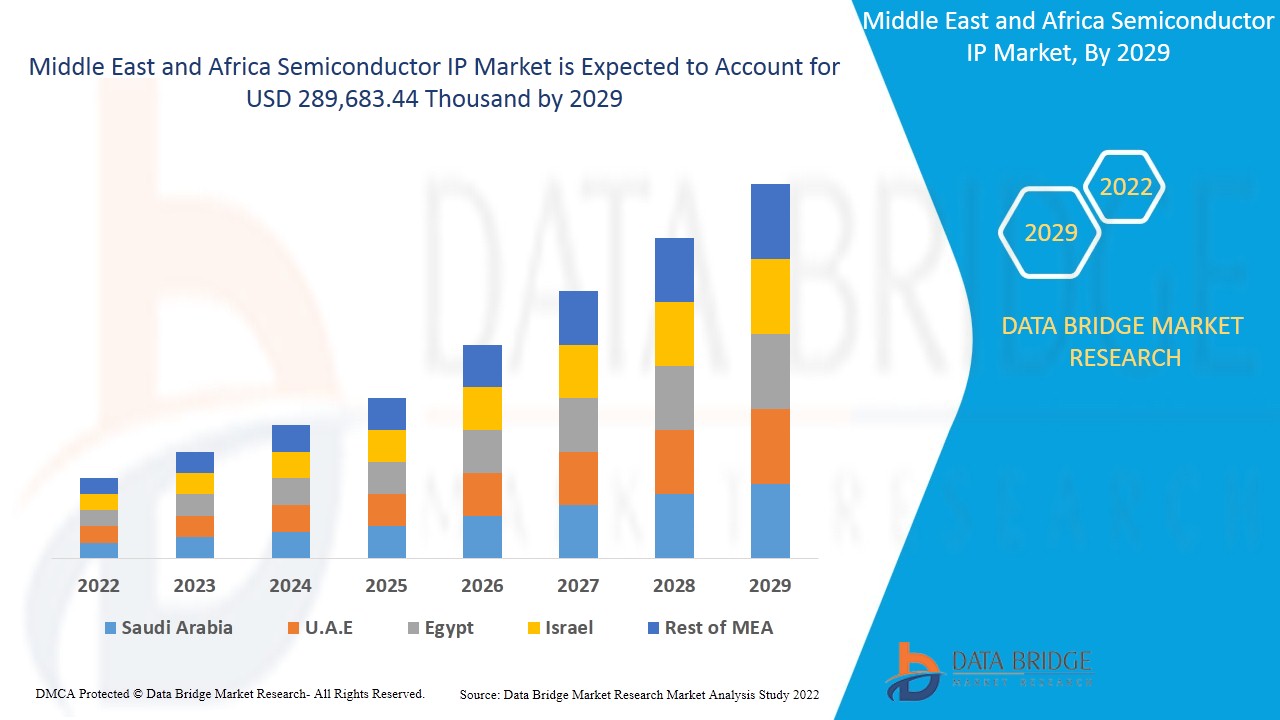
Middle East and Africa semiconductor IP market is expected to gain significant growth in the forecast period of 2022 to 2029. Data Bridge Market Research analyzes that the market is growing with the CAGR of 4.8% in the forecast period of 2022 to 2029 and expected to reach USD 289,683.44 thousand by 2029. Increase in the requirement of semiconductor IP in mining and construction industries is expected to drive the growth of the market.
Semiconductors IP (intellectual property) is a reusable unit of cell or functionality or design layout or logic, which is developed for the licensing of semiconductors to multiple vendors for utilizing it as a building block for different chip designs. Nowadays, IC designs are getting more and more complicated including system on Chip/SOC designs into a single chip. Thus, the pre-designed IP has become more important for standardization of chip manufacturing process.
Increasing demand for connected devices is the major driving factor of the market growth. Inadequate supply of silicon material can prove to be a challenge, however increasing use of semiconductors in the defense sector can prove to be an opportunity for the market growth. The restraint is the fraud cases like theft, burglary involving semiconductor IP chips and products.
The Middle East and Africa semiconductor IP market report provides details of market share, new developments, and product pipeline analysis, impact of domestic and localized market players, analyses opportunities in terms of emerging revenue pockets, changes in market regulations, product approvals, strategic decisions, product launches, geographic expansions, and technological innovations in the market. To understand the analysis and the semiconductor IP market scenario contact Data Bridge Market Research for an Analyst Brief, our team will help you create a revenue impact solution to achieve your desired goal.
Semiconductor IP Market Scope and Market Size
The Middle East and Africa semiconductor IP market is segmented into five notable segments namely, type, form, IP Source, channel, and end user.
- On the basis of type, the Middle East and Africa semiconductor IP market is segmented into CPU SIP, Wired SIP, GPU SIP, Memory SIP, DSP SIP, Library SIP, Infrastructure SIP, Digital SIP, Analog SIP, Wireless SIP, and others. In 2022, the CPU SIP segment is expected to dominate the market as CPU SIP comes with exclusive designs attracting more consumers.
- On the basis of form, the Middle East and Africa semiconductor IP market is categorized into soft form and hard form. In 2022, the soft form segment is expected to hold the highest segment as this type of semiconductor IP form is very pure in nature resulting in a better performance of the semiconductor IP operations.
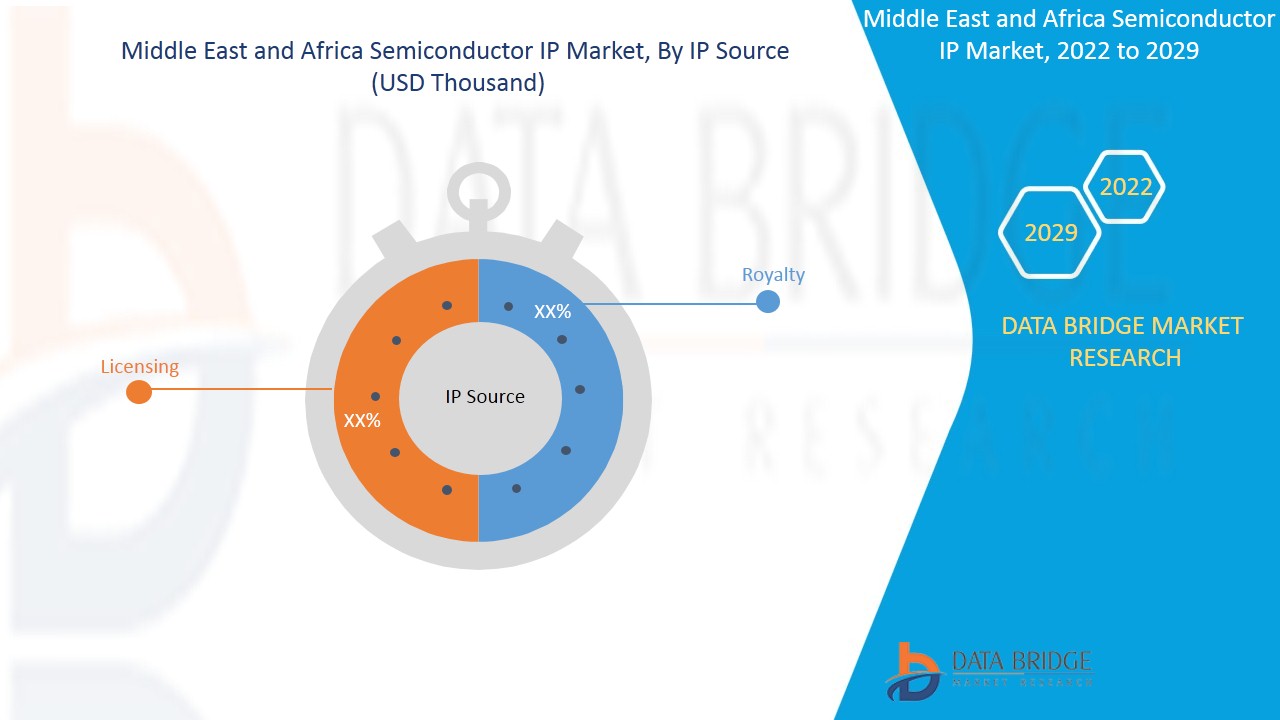
- On the basis of IP source, the Middle East and Africa semiconductor IP market is categorized into licensing and royalty. In 2022, the licensing segment is expected to hold the highest segment as it reduces additional cost on semiconductor cores.
- On the basis of channel, the Middle East and Africa semiconductor IP market is categorized into direct sources and internet catalogue. In 2022, the direct sources segment is expected to hold the highest segment due to its authenticity among the consumers.
- On the basis of end user, the Middle East and Africa semiconductor IP market is categorized into automotive, telecom, consumer electronics, industrial, defense, commercial, medical, and others. In 2022, the automotive segment is expected to dominate the market owing to growing development of automotive industries globally.
Semiconductor IP Market Country Level Analysis
The Middle East and Africa semiconductor IP market is analyzed and market size information is provided based on country, type, form, IP Source, channel, and end user as referenced above.
The countries covered in the Middle East and Africa Semiconductor IP market report are Israel, South Africa, Egypt, Saudi Arabia, UAE, and Rest of Middle East and Africa. Israel dominates the Middle East and Africa region as the semiconductor and automotive industry is growing on a huge margin out there.
The region section of the report also provides individual market impacting factors and changes in regulation in the market domestically that impacts the current and future trends of the market. Data points such as new sales, replacement sales, country demographics, regulatory acts and import-export tariffs are some of the major pointers used to forecast the market scenario for individual countries. Also, presence and availability of Middle East and Africa brands and their challenges faced due to large or scarce competition from local and domestic brands, impact of sales channels are considered while providing forecast analysis of the country data. .
The Middle East and Africa semiconductor IP market also provides you with detailed market analysis for every country growth in particular market. Additionally, it provides the detail information regarding the market players’ strategy and their geographical presence. The data is available for historic period 2011 to 2020.
Competitive Landscape and Semiconductor IP Market Share Analysis
Middle East and Africa semiconductor IP market competitive landscape provides details by competitor. Details included are company overview, company financials, revenue generated, market potential, investment in research and development, new market initiatives, production sites and facilities, company strengths and weaknesses, product launch, product trials pipelines, product approvals, patents, product width and breadth, application dominance, and technology lifeline curve. The above data points provided are only related to the companies’ focus related to the Middle East and Africa semiconductor IP market.
Some of the major players operating in the Middle East and Africa semiconductor IP market are Xilinx, Arm Limited (a subsidiary of softbank group corp.), VeriSilicon, Faraday Technology Corporation, Synopsys, Inc., and CEVA, Inc. among others.
Various new product developments, business expansions, contracts, and agreements are also initiated by companies worldwide, which are further accelerating the semiconductor IP market growth.
For instance,
- In January 2021, CEVA, Inc. established a commercial partnership with DARPA Toolbox for technology innovation. This will help the company to strengthen its technological knowledge to improve the product quality and increase the efficiency of the product performance which can attract new customers.
- In January 2021, Faraday Technology Corporation completed the development of imaging and display high-speed interface IP set. This will help the company to offer better products to the customers which will attract new customers and accelerate the growth of revenue for the company.
- In May 2019, Arm Limited has launched a new set of IP chip, Cortex-A77 with a new core design and a GPU based on Valhall architecture along with a new ML processor, Mali-G77 GPU. This new machine learning IP improved the memory compression technology up to three times as compared to earlier generation of IPs. This launch has been improving the product portfolio along with good customer base.
- In May 2021, Siemens acquired Fractal Technologies for IP validation solutions. This will help the company to improve the quality of the products and solutions offered to the customers which helps in attracting new customers and accelerates the sales growth.
SKU-
Get online access to the report on the World's First Market Intelligence Cloud

- Interactive Data Analysis Dashboard
- Company Analysis Dashboard for high growth potential opportunities
- Research Analyst Access for customization & queries
- Competitor Analysis with Interactive dashboard
- Latest News, Updates & Trend analysis
- Harness the Power of Benchmark Analysis for Comprehensive Competitor Tracking
Table of Content
1 INTRODUCTION
1.1 OBJECTIVES OF THE STUDY
1.2 MARKET DEFINITION
1.3 OVERVIEW OF MIDDLE EAST & AFRICA SEMICONDUCTOR IP MARKET
1.4 CURRENCY AND PRICING
1.5 LIMITATIONS
1.6 MARKETS COVERED
2 MARKET SEGMENTATION
2.1 MARKETS COVERED
2.2 GEOGRAPHICAL SCOPE
2.3 YEARS CONSIDERED FOR THE STUDY
2.4 DBMR TRIPOD DATA VALIDATION MODEL
2.5 PRIMARY INTERVIEWS WITH KEY OPINION LEADERS
2.6 DBMR MARKET POSITION GRID
2.7 VENDOR SHARE ANALYSIS
2.8 MULTIVARIATE MODELING
2.9 COMPONENT TYPE TIMELINE CURVE
2.1 MARKET APPLICATION GRID
2.11 SECONDARY SOURCES
2.12 ASSUMPTIONS
3 EXECUTIVE SUMMARY
4 PREMIUM INSIGHTS
5 MARKET OVERVIEW
5.1 DRIVERS
5.1.1 INCREASING DEMAND FOR CONNECTED DEVICES
5.1.2 RISING DEMAND FOR SEMICONDUCTORS IN AUTOMOBILE INDUSTRY
5.1.3 GROWING ACCEPTANCE OF THIRD PARTY IP
5.1.4 INCRESING POPULARITY OF MODERN SOC DESIGNS
5.1.5 INCREASE IN DEMAND FOR MULTI-CORE TECHNOLOGIES AND EMBEDDED GRAPHICS
5.2 RESTRAINT
5.2.1 SEMICONDUCTOR IP THEFT
5.3 OPPORTUNITIES
5.3.1 ADVANCEMENTS IN SEMICONDUCTOR IP MARKET
5.3.2 INCREASING USE OF SEMICONDUCTORS IN DEFENSE SECTOR
5.3.3 RISE IN GROWTH OF AUTOMATION IN MANUFACTURING INDUSTRIES
5.3.4 INCREASING INVESTMENTS BY GOVERNMENTS AND INVESTORS
5.4 CHALLENGES
5.4.1 INTEGRATION OF IP INTO SEMICONDUCTOR
5.4.2 INADEQUATE SUPPLY OF SILICONE MATERIAL
6 IMPACT ANALYSIS OF COVID-19 ON MIDDLE EAST & AFRICA SEMICONDUCTOR IP MARKET
6.1 ANALYSIS ON IMPACT OF COVID -19 ON THE MARKET
6.2 AFTERMATH OF COVID-19 AND GOVERNMENT INITIATIVES TO BOOST THE MARKET
6.3 STRATEGIC DECISIONS BY MANUFACTURERS AFTER COVID-19 TO GAIN COMPETITIVE MARKET SHARE
6.4 IMPACT ON DEMAND
6.5 IMPACT ON PRICE
6.6 IMPACT ON SUPPLY CHAIN
6.7 CONCLUSION
7 MIDDLE EAST & AFRICA SEMICONDUCTOR IP MARKET, BY TYPE
7.1 OVERVIEW
7.2 CPU SIP
7.3 WIRED SIP
7.4 GPU SIP
7.5 MEMORY SIP
7.6 DSP SIP
7.7 LIBRARY SIP
7.8 INFRASTRUCTURE SIP
7.9 DIGITAL SIP
7.1 ANALOG SIP
7.11 WIRELESS SIP
7.12 OTHERS
8 MIDDLE EAST & AFRICA SEMICONDUCTOR IP MARKET, BY FORM
8.1 OVERVIEW
8.2 SOFT FORM
8.3 HARD FORM
9 MIDDLE EAST & AFRICA SEMICONDUCTOR IP MARKET, BY IP SOURCE
9.1 OVERVIEW
9.2 LICENSING
9.2.1 SOFT IP CORES
9.2.2 HARD IP CORES
9.3 ROYALTY
10 MIDDLE EAST & AFRICA SEMICONDUCTOR IP MARKET, BY CHANNEL
10.1 OVERVIEW
10.2 DIRECT SOURCES
10.2.1 EDA VENDORS
10.2.2 FOUNDRIES
10.3 INTERNET CATALOGUE
10.3.1 SILICON IP
10.3.2 SOFTWARE IP
10.3.3 VERIFICATION IP
11 MIDDLE EAST & AFRICA SEMICONDUCTOR IP MARKET, BY END USER
11.1 OVERVIEW
11.2 AUTOMOTIVE
11.2.1 CPU SIP
11.2.2 WIRED SIP
11.2.3 GPU SIP
11.2.4 MEMORY SIP
11.2.5 DSP SIP
11.2.6 LIBRARY SIP
11.2.7 INFRASTRUCTURE SIP
11.2.8 DIGITAL SIP
11.2.9 ANALOG SIP
11.2.10 WIRELESS SIP
11.2.11 OTHERS
11.3 TELECOM
11.3.1 CPU SIP
11.3.2 WIRED SIP
11.3.3 GPU SIP
11.3.4 MEMORY SIP
11.3.5 DSP SIP
11.3.6 LIBRARY SIP
11.3.7 INFRASTRUCTURE SIP
11.3.8 DIGITAL SIP
11.3.9 `ANALOG SIP
11.3.10 WIRELESS SIP
11.3.11 OTHERS
11.4 CONSUMER ELECTRONICS
11.4.1 CPU SIP
11.4.2 WIRED SIP
11.4.3 GPU SIP
11.4.4 MEMORY SIP
11.4.5 DSP SIP
11.4.6 LIBRARY SIP
11.4.7 INFRASTRUCTURE SIP
11.4.8 DIGITAL SIP
11.4.9 ANALOG SIP
11.4.10 WIRELESS SIP
11.4.11 OTHERS
11.5 INDUSTRIAL
11.5.1 CPU SIP
11.5.2 WIRED SIP
11.5.3 GPU SIP
11.5.4 MEMORY SIP
11.5.5 DSP SIP
11.5.6 LIBRARY SIP
11.5.7 INFRASTRUCTURE SIP
11.5.8 DIGITAL SIP
11.5.9 ANALOG SIP
11.5.10 WIRELESS SIP
11.5.11 OTHERS
11.6 DEFENSE
11.6.1 CPU SIP
11.6.2 WIRED SIP
11.6.3 GPU SIP
11.6.4 MEMORY SIP
11.6.5 DSP SIP
11.6.6 LIBRARY SIP
11.6.7 INFRASTRUCTURE SIP
11.6.8 DIGITAL SIP
11.6.9 ANALOG SIP
11.6.10 WIRELESS SIP
11.6.11 OTHERS
11.7 COMMERCIAL
11.7.1 CPU SIP
11.7.2 WIRED SIP
11.7.3 GPU SIP
11.7.4 MEMORY SIP
11.7.5 DSP SIP
11.7.6 LIBRARY SIP
11.7.7 INFRASTRUCTURE SIP
11.7.8 DIGITAL SIP
11.7.9 ANALOG SIP
11.7.10 WIRELESS SIP
11.7.11 OTHERS
11.8 MEDICAL
11.8.1 CPU SIP
11.8.2 WIRED SIP
11.8.3 GPU SIP
11.8.4 MEMORY SIP
11.8.5 DSP SIP
11.8.6 LIBRARY SIP
11.8.7 INFRASTRUCTURE SIP
11.8.8 DIGITAL SIP
11.8.9 ANALOG SIP
11.8.10 WIRELESS SIP
11.8.11 OTHERS
11.9 OTHERS
12 MIDDLE EAST & AFRICA SEMICONDUCTOR IP MARKET, BY REGION
12.1 MIDDLE EAST & AFRICA
12.1.1 ISRAEL
12.1.2 SOUTH AFRICA
12.1.3 EGYPT
12.1.4 SAUDI ARABIA
12.1.5 U.A.E
12.1.6 REST OF MIDDLE EAST & AFRICA
13 MIDDLE EAST & AFRICA SEMICONDUCTOR IP MARKET, COMPANY LANDSCAPE
13.1 COMPANY SHARE ANALYSIS: MIDDLE EAST & AFRICA
14 SWOT ANALYSIS
15 COMPANY PROFILE
15.1 ARM LIMITED
15.1.1 COMPANY SNAPSHOT
15.1.2 REVENUE ANALYSIS
15.1.3 COMPANY SHARE ANALYSIS
15.1.4 PRODUCT PORTFOLIO
15.1.5 RECENT DEVELOPMENTS
15.2 SYNOPSIS, INC.
15.2.1 COMPANY SNAPSHOT
15.2.2 REVENUE ANALYSIS
15.2.1 COMPANY SHARE ANALYSIS
15.2.2 PRODUCT PORTFOLIO
15.2.3 RECENT DEVELOPMENTS
15.3 CADENCE DESIGN SYSTEMS, INC.
15.3.1 COMPANY SNAPSHOT
15.3.2 REVENUE ANALYSIS
15.3.1 COMPANY SHARE ANALYSIS
15.3.2 PRODUCT PORTFOLIO
15.3.3 RECENT DEVELOPMENTS
15.4 XILINX
15.4.1 COMPANY SNAPSHOT
15.4.2 REVENUE ANALYSIS
15.4.1 COMPANY SHARE ANALYSIS
15.4.2 PRODUCT PORTFOLIO
15.4.3 RECENT DEVELOPMENTS
15.5 VERISILICON
15.5.1 COMPANY SNAPSHOT
15.5.1 COMPANY SHARE ANALYSIS
15.5.2 PRODUCT PORTFOLIO
15.5.3 RECENT DEVELOPMENTS
15.6 ACHRONIX SEMICONDUCTOR CORPORATION
15.6.1 COMPANY SNAPSHOT
15.6.2 PRODUCT PORTFOLIO
15.6.3 RECENT DEVELOPMENTS
15.7 CEVA, INC.
15.7.1 COMPANY SNAPSHOT
15.7.2 REVENUE ANALYSIS
15.7.3 PRODUCT PORTFOLIO
15.7.4 RECENT DEVELOPMENTS
15.8 DOLPHIN DESIGN SAS
15.8.1 COMPANY SNAPSHOT
15.8.2 PRODUCT PORTFOLIO
15.8.3 RECENT DEVELOPMENTS
15.9 DIGITAL CORE DESIGN
15.9.1 COMPANY SNAPSHOT
15.9.2 PRODUCT PORTFOLIO
15.9.3 RECENT DEVELOPMENT
15.1 DREAM CHIP TECHNOLOGIES GMBH
15.10.1 COMPANY SNAPSHOT
15.10.2 PRODUCT PORTFOLIO
15.10.3 RECENT DEVELOPMENTS
15.11 EMEMORY TECHNOLOGY INC.
15.11.1 COMPANY SNAPSHOT
15.11.2 REVENUE ANALYSIS
15.11.3 PRODUCT PORTFOLIO
15.11.4 RECENT DEVELOPMENTS
15.12 FARADAY TECHNOLOGY CORPORATION
15.12.1 COMPANY SNAPSHOT
15.12.2 REVENUE ANALYSIS
15.12.3 PRODUCT PORTFOLIO
15.12.4 RECENT DEVELOPMENTS
15.13 IMAGINATION TECHNOLOGIES LIMITED
15.13.1 COMPANY SNAPSHOT
15.13.2 PRODUCT PORTFOLIO
15.13.3 RECENT DEVELOPMENTS
15.14 LATTICE SEMICONDUCTOR
15.14.1 COMPANY SNAPSHOT
15.14.2 REVENUE ANALYSIS
15.14.3 PRODUCT PORTFOLIO
15.14.4 RECENT DEVELOPMENTS
15.15 RAMBUS.COM
15.15.1 COMPANY SNAPSHOT
15.15.2 REVENUE ANALYSIS
15.15.3 PRODUCT PORTFOLIO
15.15.4 RECENT DEVELOPMENTS
15.16 SIEMENS
15.16.1 COMPANY SNAPSHOT
15.16.2 REVENUE ANALYSIS
15.16.3 PRODUCT PORTFOLIO
15.16.4 RECENT DEVELOPMENTS
15.17 WAVY COMPUTING, INC.
15.17.1 COMPANY SNAPSHOT
15.17.2 PRODUCT PORTFOLIO
15.17.3 RECENT DEVELOPMENTS
16 QUESTIONNAIRE
17 RELATED REPORTS
List of Table
TABLE 1 MIDDLE EAST & AFRICA SEMICONDUCTOR IP MARKET, BY TYPE, 2020-2029 (USD THOUSAND)
TABLE 2 MIDDLE EAST & AFRICA CPU SIP IN SEMICONDUCTOR IP MARKET, BY REGION, 2020-2029 (USD THOUSAND)
TABLE 3 MIDDLE EAST & AFRICA WIRED SIP IN SEMICONDUCTOR IP MARKET, BY REGION, 2020-2029 (USD THOUSAND)
TABLE 4 MIDDLE EAST & AFRICA GPU SIP IN SEMICONDUCTOR IP MARKET, BY REGION, 2020-2029 (USD THOUSAND)
TABLE 5 MIDDLE EAST & AFRICA MEMORY SIP IN SEMICONDUCTOR IP MARKET, BY REGION, 2020-2029 (USD THOUSAND)
TABLE 6 MIDDLE EAST & AFRICA DSP SIP IN SEMICONDUCTOR IP MARKET, BY REGION, 2020-2029 (USD THOUSAND)
TABLE 7 MIDDLE EAST & AFRICA LIBRARY SIP IN SEMICONDUCTOR IP MARKET, BY REGION, 2020-2029 (USD THOUSAND)
TABLE 8 MIDDLE EAST & AFRICA INFRASTRUCTURE SIP IN SEMICONDUCTOR IP MARKET, BY REGION, 2020-2029 (USD THOUSAND)
TABLE 9 MIDDLE EAST & AFRICA DIGITAL SIP IN SEMICONDUCTOR IP MARKET, BY REGION, 2020-2029 (USD THOUSAND)
TABLE 10 MIDDLE EAST & AFRICA ANALOG SIP IN SEMICONDUCTOR IP MARKET, BY REGION, 2020-2029 (USD THOUSAND)
TABLE 11 MIDDLE EAST & AFRICA WIRELES SIP IN SEMICONDUCTOR IP MARKET, BY REGION, 2020-2029 (USD THOUSAND)
TABLE 12 MIDDLE EAST & AFRICA OTHERS IN SEMICONDUCTOR IP MARKET, BY REGION, 2020-2029 (USD THOUSAND)
TABLE 13 MIDDLE EAST & AFRICA SEMICONDUCTOR IP MARKET, BY FORM, 2020-2029 (USD THOUSAND)
TABLE 14 MIDDLE EAST & AFRICA SOFT FORM IN SEMICONDUCTOR IP MARKET, BY REGION, 2020-2029 (USD THOUSAND)
TABLE 15 MIDDLE EAST & AFRICA HARD FORM IN SEMICONDUCTOR IP MARKET, BY REGION, 2020-2029 (USD THOUSAND)
TABLE 16 MIDDLE EAST & AFRICA SEMICONDUCTOR IP MARKET, BY IP SOURCE, 2020-2029 (USD THOUSAND)
TABLE 17 MIDDLE EAST & AFRICA LICENSING IN SEMICONDUCTOR IP MARKET, BY REGION, 2020-2029 (USD THOUSAND)
TABLE 18 MIDDLE EAST & AFRICA LICENSING IN SEMICONDUCTOR IP MARKET, BY IP SOURCE, 2020-2029 (USD THOUSAND)
TABLE 19 MIDDLE EAST & AFRICA ROYALTY IN SEMICONDUCTOR IP MARKET, BY REGION, 2020-2029 (USD THOUSAND)
TABLE 20 MIDDLE EAST & AFRICA SEMICONDUCTOR IP MARKET, BY CHANNEL, 2020-2029 (USD THOUSAND)
TABLE 21 MIDDLE EAST & AFRICA DIRECT SOURCES IN SEMICONDUCTOR IP MARKET, BY REGION, 2020-2029 (USD THOUSAND)
TABLE 22 MIDDLE EAST & AFRICA DIRECT SOURCES IN SEMICONDUCTOR IP MARKET, BY CHANNEL, 2020-2029 (USD THOUSAND)
TABLE 23 MIDDLE EAST & AFRICA INTERNET CATALOGUE IN SEMICONDUCTOR IP MARKET, BY REGION, 2020-2029 (USD THOUSAND)
TABLE 24 MIDDLE EAST & AFRICA INTERNET CATALOGUE IN SEMICONDUCTOR IP MARKET, BY LISTING, 2020-2029 (USD THOUSAND)
TABLE 25 MIDDLE EAST & AFRICA SEMICONDUCTOR IP MARKET, BY END USER, 2020-2029 (USD THOUSAND)
TABLE 26 MIDDLE EAST & AFRICA AUTOMOTIVE IN SEMICONDUCTOR IP MARKET, BY REGION, 2020-2029 (USD THOUSAND)
TABLE 27 MIDDLE EAST & AFRICA AUTOMOTIVE IN SEMICONDUCTOR IP MARKET, BY TYPE, 2020-2029 (USD THOUSAND)
TABLE 28 MIDDLE EAST & AFRICA TELECOM IN SEMICONDUCTOR IP MARKET, BY REGION, 2020-2029 (USD THOUSAND)
TABLE 29 MIDDLE EAST & AFRICA TELECOM IN SEMICONDUCTOR IP MARKET, BY TYPE, 2020-2029 (USD THOUSAND)
TABLE 30 MIDDLE EAST & AFRICA CONSUMER ELECTRONICS IN SEMICONDUCTOR IP MARKET, BY REGION, 2020-2029 (USD THOUSAND)
TABLE 31 MIDDLE EAST & AFRICA CONSUMER ELECTRONICS IN SEMICONDUCTOR IP MARKET, BY TYPE, 2020-2029 (USD THOUSAND)
TABLE 32 MIDDLE EAST & AFRICA INDUSTRIAL IN SEMICONDUCTOR IP MARKET, BY REGION, 2020-2029 (USD THOUSAND)
TABLE 33 MIDDLE EAST & AFRICA INDUSTRIAL IN SEMICONDUCTOR IP MARKET, BY TYPE, 2020-2029 (USD THOUSAND)
TABLE 34 MIDDLE EAST & AFRICA DEFENSE IN SEMICONDUCTOR IP MARKET, BY REGION, 2020-2029 (USD THOUSAND)
TABLE 35 MIDDLE EAST & AFRICA DEFENSE IN SEMICONDUCTOR IP MARKET, BY TYPE, 2020-2029 (USD THOUSAND)
TABLE 36 MIDDLE EAST & AFRICA COMMERCIAL IN SEMICONDUCTOR IP MARKET, BY REGION, 2020-2029 (USD THOUSAND)
TABLE 37 MIDDLE EAST & AFRICA COMMERCIAL IN SEMICONDUCTOR IP MARKET, BY TYPE, 2020-2029 (USD THOUSAND)
TABLE 38 MIDDLE EAST & AFRICA MEDICAL IN SEMICONDUCTOR IP MARKET, BY REGION, 2020-2029 (USD THOUSAND)
TABLE 39 MIDDLE EAST & AFRICA MEDICAL IN SEMICONDUCTOR IP MARKET, BY TYPE, 2020-2029 (USD THOUSAND)
TABLE 40 MIDDLE EAST & AFRICA OTHERS IN SEMICONDUCTOR IP MARKET, BY REGION, 2020-2029 (USD THOUSAND)
TABLE 41 MIDDLE EAST & AFRICA SEMICONDUCTOR IP MARKET, BY COUNTRY, 2020-2029 (USD THOUSAND)
TABLE 42 MIDDLE EAST & AFRICA SEMICONDUCTOR IP MARKET, BY TYPE, 2020-2029 (USD THOUSAND)
TABLE 43 MIDDLE EAST & AFRICA SEMICONDUCTOR IP MARKET, BY FORM, 2020-2029 (USD THOUSAND)
TABLE 44 MIDDLE EAST & AFRICA SEMICONDUCTOR IP MARKET, BY IP SOURCE, 2020-2029 (USD THOUSAND)
TABLE 45 MIDDLE EAST & AFRICA LICENSING IN SEMICONDUCTOR IP MARKET, BY IP SOURCE, 2020-2029 (USD THOUSAND)
TABLE 46 MIDDLE EAST & AFRICA SEMICONDUCTOR IP MARKET, BY CHANNEL, 2020-2029 (USD THOUSAND)
TABLE 47 MIDDLE EAST & AFRICA DIRECT SOURCES IN SEMICONDUCTOR IP MARKET, BY CHANNEL, 2020-2029 (USD THOUSAND)
TABLE 48 MIDDLE EAST & AFRICA INTERNET CATALOGUE IN SEMICONDUCTOR IP MARKET, BY LISTING, 2020-2029 (USD THOUSAND)
TABLE 49 MIDDLE EAST & AFRICA SEMICONDUCTOR IP MARKET, BY END USER, 2020-2029 (USD THOUSAND)
TABLE 50 MIDDLE EAST & AFRICA AUTOMOTIVE IN SEMICONDUCTOR IP MARKET, BY TYPE, 2020-2029 (USD THOUSAND)
TABLE 51 MIDDLE EAST & AFRICA TELECOM IN SEMICONDUCTOR IP MARKET, BY TYPE, 2020-2029 (USD THOUSAND)
TABLE 52 MIDDLE EAST & AFRICA CONSUMER ELECTRONICS IN SEMICONDUCTOR IP MARKET, BY TYPE, 2020-2029 (USD THOUSAND)
TABLE 53 MIDDLE EAST & AFRICA INDUSTRIAL IN SEMICONDUCTOR IP MARKET, BY TYPE, 2020-2029 (USD THOUSAND)
TABLE 54 MIDDLE EAST & AFRICA DEFENSE IN SEMICONDUCTOR IP MARKET, BY TYPE, 2020-2029 (USD THOUSAND)
TABLE 55 MIDDLE EAST & AFRICA COMMERCIAL IN SEMICONDUCTOR IP MARKET, BY TYPE, 2020-2029 (USD THOUSAND)
TABLE 56 MIDDLE EAST & AFRICA MEDICAL IN SEMICONDUCTOR IP MARKET, BY TYPE, 2020-2029 (USD THOUSAND)
TABLE 57 ISRAEL SEMICONDUCTOR IP MARKET, BY TYPE, 2020-2029 (USD THOUSAND)
TABLE 58 ISRAEL SEMICONDUCTOR IP MARKET, BY FORM, 2020-2029 (USD THOUSAND)
TABLE 59 ISRAEL SEMICONDUCTOR IP MARKET, BY IP SOURCE, 2020-2029 (USD THOUSAND)
TABLE 60 ISRAEL LICENSING IN SEMICONDUCTOR IP MARKET, BY IP SOURCE, 2020-2029 (USD THOUSAND)
TABLE 61 ISRAEL SEMICONDUCTOR IP MARKET, BY CHANNEL, 2020-2029 (USD THOUSAND)
TABLE 62 ISRAEL DIRECT SOURCES IN SEMICONDUCTOR IP MARKET, BY CHANNEL, 2020-2029 (USD THOUSAND)
TABLE 63 ISRAEL INTERNET CATALOGUE IN SEMICONDUCTOR IP MARKET, BY LISTING, 2020-2029 (USD THOUSAND)
TABLE 64 ISRAEL SEMICONDUCTOR IP MARKET, BY END USER, 2020-2029 (USD THOUSAND)
TABLE 65 ISRAEL AUTOMOTIVE IN SEMICONDUCTOR IP MARKET, BY TYPE, 2020-2029 (USD THOUSAND)
TABLE 66 ISRAEL TELECOM IN SEMICONDUCTOR IP MARKET, BY TYPE, 2020-2029 (USD THOUSAND)
TABLE 67 ISRAEL CONSUMER ELECTRONICS IN SEMICONDUCTOR IP MARKET, BY TYPE, 2020-2029 (USD THOUSAND)
TABLE 68 ISRAEL INDUSTRIAL IN SEMICONDUCTOR IP MARKET, BY TYPE, 2020-2029 (USD THOUSAND)
TABLE 69 ISRAEL DEFENSE IN SEMICONDUCTOR IP MARKET, BY TYPE, 2020-2029 (USD THOUSAND)
TABLE 70 ISRAEL COMMERCIAL IN SEMICONDUCTOR IP MARKET, BY TYPE, 2020-2029 (USD THOUSAND)
TABLE 71 ISRAEL MEDICAL IN SEMICONDUCTOR IP MARKET, BY TYPE, 2020-2029 (USD THOUSAND)
TABLE 72 SOUTH AFRICA SEMICONDUCTOR IP MARKET, BY TYPE, 2020-2029 (USD THOUSAND)
TABLE 73 SOUTH AFRICA SEMICONDUCTOR IP MARKET, BY FORM, 2020-2029 (USD THOUSAND)
TABLE 74 SOUTH AFRICA SEMICONDUCTOR IP MARKET, BY IP SOURCE, 2020-2029 (USD THOUSAND)
TABLE 75 SOUTH AFRICA LICENSING IN SEMICONDUCTOR IP MARKET, BY IP SOURCE, 2020-2029 (USD THOUSAND)
TABLE 76 SOUTH AFRICA SEMICONDUCTOR IP MARKET, BY CHANNEL, 2020-2029 (USD THOUSAND)
TABLE 77 SOUTH AFRICA DIRECT SOURCES IN SEMICONDUCTOR IP MARKET, BY CHANNEL, 2020-2029 (USD THOUSAND)
TABLE 78 SOUTH AFRICA INTERNET CATALOGUE IN SEMICONDUCTOR IP MARKET, BY LISTING, 2020-2029 (USD THOUSAND)
TABLE 79 SOUTH AFRICA SEMICONDUCTOR IP MARKET, BY END USER, 2020-2029 (USD THOUSAND)
TABLE 80 SOUTH AFRICA AUTOMOTIVE IN SEMICONDUCTOR IP MARKET, BY TYPE, 2020-2029 (USD THOUSAND)
TABLE 81 SOUTH AFRICA TELECOM IN SEMICONDUCTOR IP MARKET, BY TYPE, 2020-2029 (USD THOUSAND)
TABLE 82 SOUTH AFRICA CONSUMER ELECTRONICS IN SEMICONDUCTOR IP MARKET, BY TYPE, 2020-2029 (USD THOUSAND)
TABLE 83 SOUTH AFRICA INDUSTRIAL IN SEMICONDUCTOR IP MARKET, BY TYPE, 2020-2029 (USD THOUSAND)
TABLE 84 SOUTH AFRICA DEFENSE IN SEMICONDUCTOR IP MARKET, BY TYPE, 2020-2029 (USD THOUSAND)
TABLE 85 SOUTH AFRICA COMMERCIAL IN SEMICONDUCTOR IP MARKET, BY TYPE, 2020-2029 (USD THOUSAND)
TABLE 86 SOUTH AFRICA MEDICAL IN SEMICONDUCTOR IP MARKET, BY TYPE, 2020-2029 (USD THOUSAND)
TABLE 87 EGYPT SEMICONDUCTOR IP MARKET, BY TYPE, 2020-2029 (USD THOUSAND)
TABLE 88 EGYPT SEMICONDUCTOR IP MARKET, BY FORM, 2020-2029 (USD THOUSAND)
TABLE 89 EGYPT SEMICONDUCTOR IP MARKET, BY IP SOURCE, 2020-2029 (USD THOUSAND)
TABLE 90 EGYPT LICENSING IN SEMICONDUCTOR IP MARKET, BY IP SOURCE, 2020-2029 (USD THOUSAND)
TABLE 91 EGYPT SEMICONDUCTOR IP MARKET, BY CHANNEL, 2020-2029 (USD THOUSAND)
TABLE 92 EGYPT DIRECT SOURCES IN SEMICONDUCTOR IP MARKET, BY CHANNEL, 2020-2029 (USD THOUSAND)
TABLE 93 EGYPT INTERNET CATALOGUE IN SEMICONDUCTOR IP MARKET, BY LISTING, 2020-2029 (USD THOUSAND)
TABLE 94 EGYPT SEMICONDUCTOR IP MARKET, BY END USER, 2020-2029 (USD THOUSAND)
TABLE 95 EGYPT AUTOMOTIVE IN SEMICONDUCTOR IP MARKET, BY TYPE, 2020-2029 (USD THOUSAND)
TABLE 96 EGYPT TELECOM IN SEMICONDUCTOR IP MARKET, BY TYPE, 2020-2029 (USD THOUSAND)
TABLE 97 EGYPT CONSUMER ELECTRONICS IN SEMICONDUCTOR IP MARKET, BY TYPE, 2020-2029 (USD THOUSAND)
TABLE 98 EGYPT INDUSTRIAL IN SEMICONDUCTOR IP MARKET, BY TYPE, 2020-2029 (USD THOUSAND)
TABLE 99 EGYPT DEFENSE IN SEMICONDUCTOR IP MARKET, BY TYPE, 2020-2029 (USD THOUSAND)
TABLE 100 EGYPT COMMERCIAL IN SEMICONDUCTOR IP MARKET, BY TYPE, 2020-2029 (USD THOUSAND)
TABLE 101 EGYPT MEDICAL IN SEMICONDUCTOR IP MARKET, BY TYPE, 2020-2029 (USD THOUSAND)
TABLE 102 SAUDI ARABIA SEMICONDUCTOR IP MARKET, BY TYPE, 2020-2029 (USD THOUSAND)
TABLE 103 SAUDI ARABIA SEMICONDUCTOR IP MARKET, BY FORM, 2020-2029 (USD THOUSAND)
TABLE 104 SAUDI ARABIA SEMICONDUCTOR IP MARKET, BY IP SOURCE, 2020-2029 (USD THOUSAND)
TABLE 105 SAUDI ARABIA LICENSING IN SEMICONDUCTOR IP MARKET, BY IP SOURCE, 2020-2029 (USD THOUSAND)
TABLE 106 SAUDI ARABIA SEMICONDUCTOR IP MARKET, BY CHANNEL, 2020-2029 (USD THOUSAND)
TABLE 107 SAUDI ARABIA DIRECT SOURCES IN SEMICONDUCTOR IP MARKET, BY CHANNEL, 2020-2029 (USD THOUSAND)
TABLE 108 SAUDI ARABIA INTERNET CATALOGUE IN SEMICONDUCTOR IP MARKET, BY LISTING, 2020-2029 (USD THOUSAND)
TABLE 109 SAUDI ARABIA SEMICONDUCTOR IP MARKET, BY END USER, 2020-2029 (USD THOUSAND)
TABLE 110 SAUDI ARABIA AUTOMOTIVE IN SEMICONDUCTOR IP MARKET, BY TYPE, 2020-2029 (USD THOUSAND)
TABLE 111 SAUDI ARABIA TELECOM IN SEMICONDUCTOR IP MARKET, BY TYPE, 2020-2029 (USD THOUSAND)
TABLE 112 SAUDI ARABIA CONSUMER ELECTRONICS IN SEMICONDUCTOR IP MARKET, BY TYPE, 2020-2029 (USD THOUSAND)
TABLE 113 SAUDI ARABIA INDUSTRIAL IN SEMICONDUCTOR IP MARKET, BY TYPE, 2020-2029 (USD THOUSAND)
TABLE 114 SAUDI ARABIA DEFENSE IN SEMICONDUCTOR IP MARKET, BY TYPE, 2020-2029 (USD THOUSAND)
TABLE 115 SAUDI ARABIA COMMERCIAL IN SEMICONDUCTOR IP MARKET, BY TYPE, 2020-2029 (USD THOUSAND)
TABLE 116 SAUDI ARABIA MEDICAL IN SEMICONDUCTOR IP MARKET, BY TYPE, 2020-2029 (USD THOUSAND)
TABLE 117 U.A.E SEMICONDUCTOR IP MARKET, BY TYPE, 2020-2029 (USD THOUSAND)
TABLE 118 U.A.E SEMICONDUCTOR IP MARKET, BY FORM, 2020-2029 (USD THOUSAND)
TABLE 119 U.A.E SEMICONDUCTOR IP MARKET, BY IP SOURCE, 2020-2029 (USD THOUSAND)
TABLE 120 U.A.E LICENSING IN SEMICONDUCTOR IP MARKET, BY IP SOURCE, 2020-2029 (USD THOUSAND)
TABLE 121 U.A.E SEMICONDUCTOR IP MARKET, BY CHANNEL, 2020-2029 (USD THOUSAND)
TABLE 122 U.A.E DIRECT SOURCES IN SEMICONDUCTOR IP MARKET, BY CHANNEL, 2020-2029 (USD THOUSAND)
TABLE 123 U.A.E INTERNET CATALOGUE IN SEMICONDUCTOR IP MARKET, BY LISTING, 2020-2029 (USD THOUSAND)
TABLE 124 U.A.E SEMICONDUCTOR IP MARKET, BY END USER, 2020-2029 (USD THOUSAND)
TABLE 125 U.A.E AUTOMOTIVE IN SEMICONDUCTOR IP MARKET, BY TYPE, 2020-2029 (USD THOUSAND)
TABLE 126 U.A.E TELECOM IN SEMICONDUCTOR IP MARKET, BY TYPE, 2020-2029 (USD THOUSAND)
TABLE 127 U.A.E CONSUMER ELECTRONICS IN SEMICONDUCTOR IP MARKET, BY TYPE, 2020-2029 (USD THOUSAND)
TABLE 128 U.A.E INDUSTRIAL IN SEMICONDUCTOR IP MARKET, BY TYPE, 2020-2029 (USD THOUSAND)
TABLE 129 U.A.E DEFENSE IN SEMICONDUCTOR IP MARKET, BY TYPE, 2020-2029 (USD THOUSAND)
TABLE 130 U.A.E COMMERCIAL IN SEMICONDUCTOR IP MARKET, BY TYPE, 2020-2029 (USD THOUSAND)
TABLE 131 U.A.E MEDICAL IN SEMICONDUCTOR IP MARKET, BY TYPE, 2020-2029 (USD THOUSAND)
TABLE 132 REST OF MIDDLE EAST & AFRICA SEMICONDUCTOR IP MARKET, BY TYPE, 2020-2029 (USD THOUSAND)
List of Figure
FIGURE 1 MIDDLE EAST & AFRICA SEMICONDUCTOR IP MARKET: SEGMENTATION
FIGURE 2 MIDDLE EAST & AFRICA SEMICONDUCTOR IP MARKET: DATA TRIANGULATION
FIGURE 3 MIDDLE EAST & AFRICA SEMICONDUCTOR IP MARKET: DROC ANALYSIS
FIGURE 4 MIDDLE EAST & AFRICA SEMICONDUCTOR IP MARKET: MIDDLE EAST & AFRICA VS REGIONAL MARKET ANALYSIS
FIGURE 5 MIDDLE EAST & AFRICA SEMICONDUCTOR IP MARKET: COMPANY RESEARCH ANALYSIS
FIGURE 6 MIDDLE EAST & AFRICA SEMICONDUCTOR IP MARKET: INTERVIEW DEMOGRAPHICS
FIGURE 7 MIDDLE EAST & AFRICA SEMICONDUCTOR IP MARKET: DBMR MARKET POSITION GRID
FIGURE 8 MIDDLE EAST & AFRICA SEMICONDUCTOR IP MARKET: VENDOR SHARE ANALYSIS
FIGURE 9 MIDDLE EAST & AFRICA SEMICONDUCTOR IP MARKET: MARKET APPLICATION COVERAGE GRID
FIGURE 10 MIDDLE EAST & AFRICA SEMICONDUCTOR IP MARKET: SEGMENTATION
FIGURE 11 GROWING USE OF SEMICONDUCTOR IN AUTOMOBILE INDUSTRY IS BOOSTING THE GROWTH OF SEMICONDUCTOR IP MARKET IN THE FORECAST PERIOD OF 2022 -2029
FIGURE 12 CPU SIP TYPE SEGMENT IS EXPECTED TO ACCOUNT FOR THE LARGEST SHARE OF MIDDLE EAST & AFRICA SEMICONDUCTOR IP MARKET IN 2022 - 2029
FIGURE 13 ASIA-PACIFIC IS EXPECTED TO DOMINATE AND IS THE FASTEST-GROWING REGION IN THE MIDDLE EAST & AFRICA SEMICONDUCTOR IP MARKET IN THE FORECAST PERIOD OF 2022 TO 2029
FIGURE 14 DRIVERS, RESTRAINTS, OPPORTUNITIES AND CHALLENGE OF MIDDLE EAST & AFRICA SEMICONDUCTOR IP MARKET
FIGURE 15 NUMBER OF CONNECTED DEVICES (IN BILLIONS)
FIGURE 16 WORLDWIDE ELECTRONIC SYSTEM CAGR (IN %)
FIGURE 17 MIDDLE EAST & AFRICA REVENUE OF VIDEO GAMES MARKET (2012 TO 2021)
FIGURE 18 MIDDLE EAST & AFRICA SEMICONDUCTOR IP MARKET: BY TYPE, 2021
FIGURE 19 MIDDLE EAST & AFRICA SEMICONDUCTOR IP MARKET: BY FORM, 2021
FIGURE 20 MIDDLE EAST & AFRICA SEMICONDUCTOR IP MARKET: BY IP SOURCE, 2021
FIGURE 21 MIDDLE EAST & AFRICA SEMICONDUCTOR IP MARKET: BY CHANNEL, 2021
FIGURE 22 MIDDLE EAST & AFRICA SEMICONDUCTOR IP MARKET: BY END USER, 2021
FIGURE 23 MIDDLE EAST & AFRICA SEMICONDUCTOR IP MARKET: SNAPSHOT (2021)
FIGURE 24 MIDDLE EAST & AFRICA SEMICONDUCTOR IP MARKET: BY COUNTRY (2021)
FIGURE 25 MIDDLE EAST & AFRICA SEMICONDUCTOR IP MARKET: BY COUNTRY (2022 & 2029)
FIGURE 26 MIDDLE EAST & AFRICA SEMICONDUCTOR IP MARKET: BY COUNTRY (2021 & 2029)
FIGURE 27 MIDDLE EAST & AFRICA SEMICONDUCTOR IP MARKET: BY TYPE (2022-2029)
FIGURE 28 MIDDLE EAST & AFRICA SEMICONDUCTOR IP MARKET: COMPANY SHARE 2021 (%)
Middle East And Africa Semiconductor Ip Market, Supply Chain Analysis and Ecosystem Framework
To support market growth and help clients navigate the impact of geopolitical shifts, DBMR has integrated in-depth supply chain analysis into its Middle East And Africa Semiconductor Ip Market research reports. This addition empowers clients to respond effectively to global changes affecting their industries. The supply chain analysis section includes detailed insights such as Middle East And Africa Semiconductor Ip Market consumption and production by country, price trend analysis, the impact of tariffs and geopolitical developments, and import and export trends by country and HSN code. It also highlights major suppliers with data on production capacity and company profiles, as well as key importers and exporters. In addition to research, DBMR offers specialized supply chain consulting services backed by over a decade of experience, providing solutions like supplier discovery, supplier risk assessment, price trend analysis, impact evaluation of inflation and trade route changes, and comprehensive market trend analysis.
Research Methodology
Data collection and base year analysis are done using data collection modules with large sample sizes. The stage includes obtaining market information or related data through various sources and strategies. It includes examining and planning all the data acquired from the past in advance. It likewise envelops the examination of information inconsistencies seen across different information sources. The market data is analysed and estimated using market statistical and coherent models. Also, market share analysis and key trend analysis are the major success factors in the market report. To know more, please request an analyst call or drop down your inquiry.
The key research methodology used by DBMR research team is data triangulation which involves data mining, analysis of the impact of data variables on the market and primary (industry expert) validation. Data models include Vendor Positioning Grid, Market Time Line Analysis, Market Overview and Guide, Company Positioning Grid, Patent Analysis, Pricing Analysis, Company Market Share Analysis, Standards of Measurement, Global versus Regional and Vendor Share Analysis. To know more about the research methodology, drop in an inquiry to speak to our industry experts.
Customization Available
Data Bridge Market Research is a leader in advanced formative research. We take pride in servicing our existing and new customers with data and analysis that match and suits their goal. The report can be customized to include price trend analysis of target brands understanding the market for additional countries (ask for the list of countries), clinical trial results data, literature review, refurbished market and product base analysis. Market analysis of target competitors can be analyzed from technology-based analysis to market portfolio strategies. We can add as many competitors that you require data about in the format and data style you are looking for. Our team of analysts can also provide you data in crude raw excel files pivot tables (Fact book) or can assist you in creating presentations from the data sets available in the report.

