
Middle East and Africa Polyethylene Glycol Market Analysis and Size
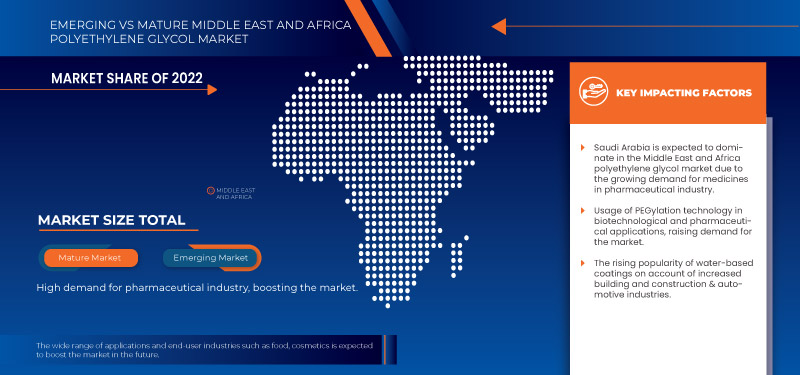
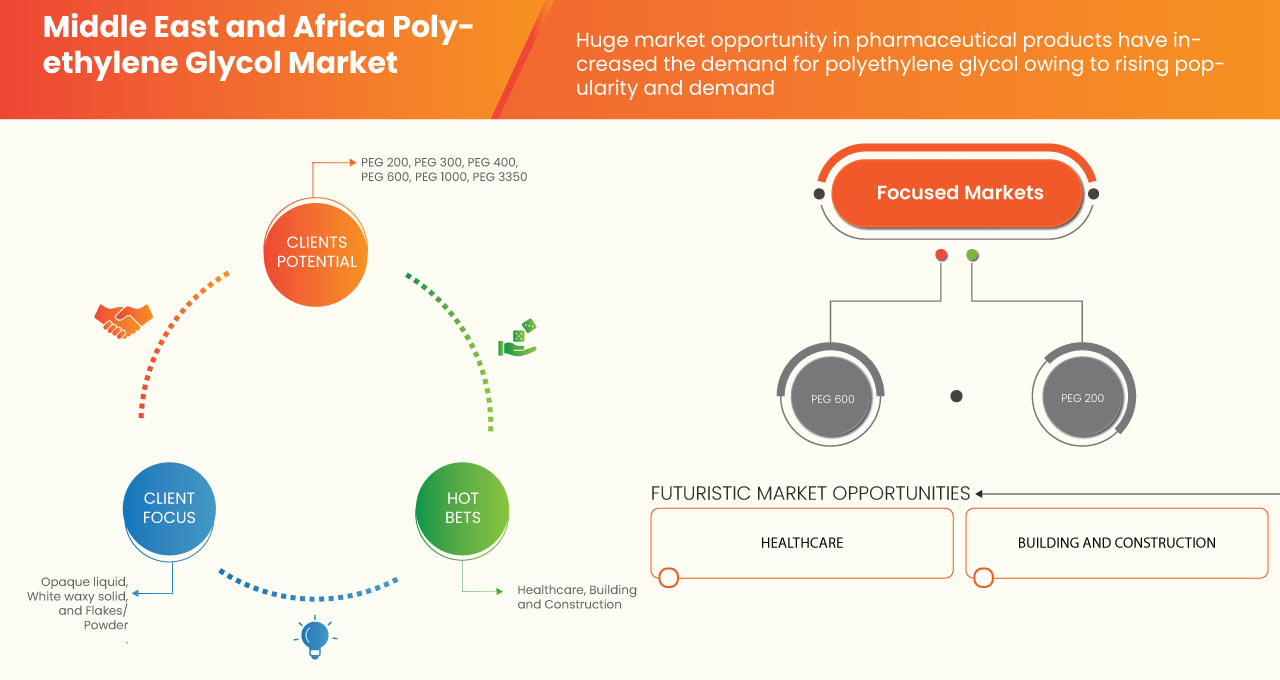
The Middle East and Africa polyethylene glycol market is being driven by the pharmaceutical industry is a key driver driving market expansion. Polyethylene glycols are crucial components of pharmaceutical formulations used to create topical, oral, ophthalmic, and rectal treatments. In a number of medicinal applications, they serve as lubricants and film-coating agents. Additionally, the use of polyethylene glycol in paint and coating products will open up more business potential for polyethylene glycol markets. However, stringent government regulations may restrain market growth.
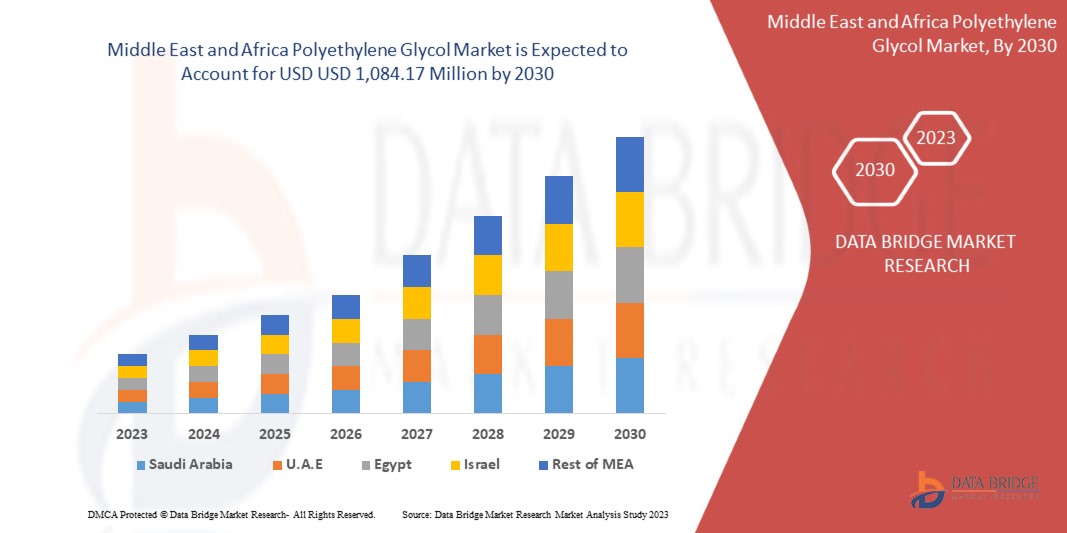
Data Bridge Market Research analyses that the Middle East and Africa polyethylene glycol market is expected to reach the value of USD 1,084.17 million by 2030, at a CAGR of 6.0% during the forecast period.
|
Report Metric |
Details |
|
Forecast Period |
2023 to 2030 |
|
Base Year |
2022 |
|
Historic Year |
2021 (Customizable to 2020-2016) |
|
Quantitative Units |
Revenue in USD Million, Volumes in Tons, Pricing in USD |
|
Segments Covered |
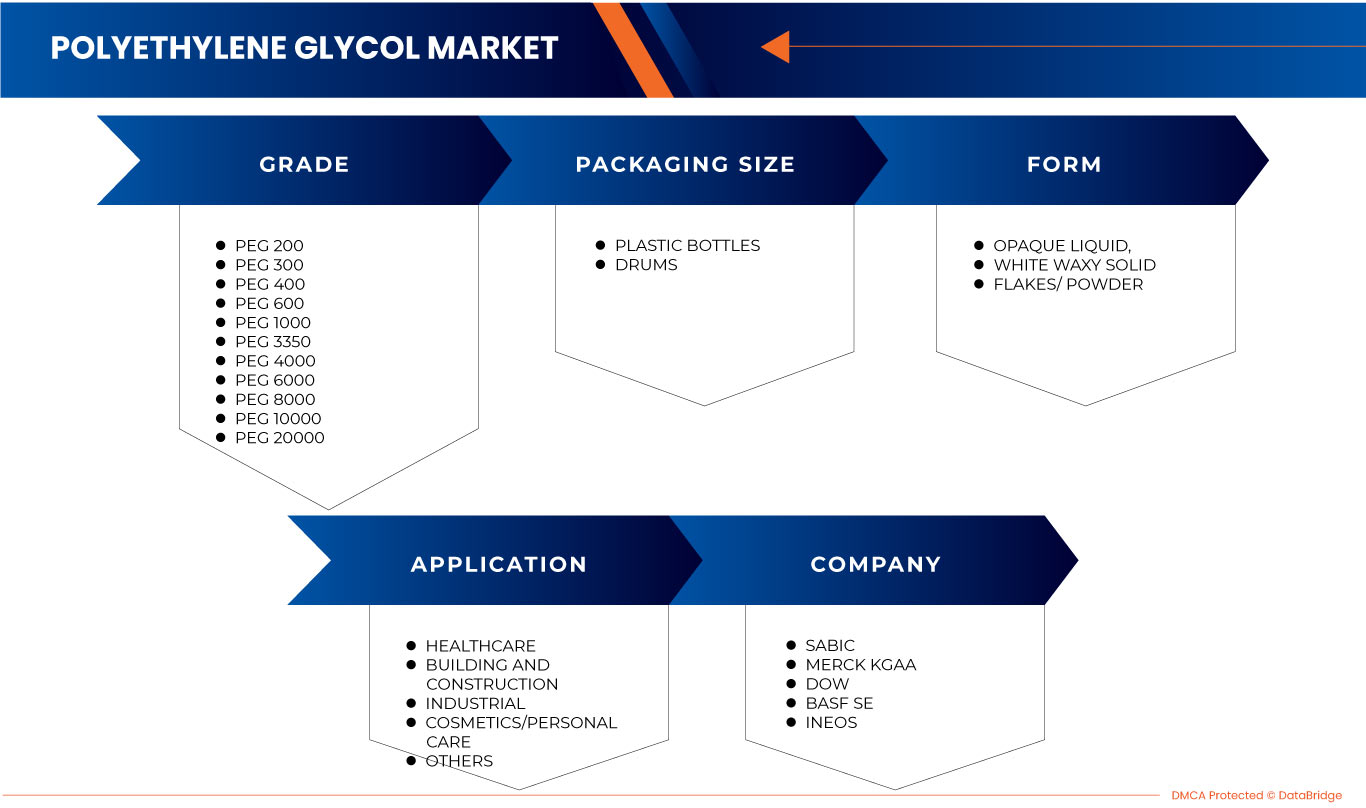
By Grade (PEG 200, PEG 300, PEG 400, PEG 600, PEG 1000, PEG 3350, PEG 4000, PEG 6000, PEG 8000, PEG 10000, and PEG 20000), Form (Opaque Liquid, White Waxy Solid, and Flakes/ Powder), Packaging Size (Plastic Bottles and Drums), Application (Healthcare, Building and Construction, Industrial, Cosmetics/Personal Care, and Others). |
|
Countries Covered |
South Africa, United Arab Emirates, Saudi Arabia, Egypt, Qatar, Oman, Kuwait, Bahrain, Rest of the Middle East and Africa. |
|
Market Players Covered |
SABIC, Dow, BASF SE, Merck KGaA, INEOS, Croda International Plc, Clariant, India Glycols Limited, Pro Chem, Inc., GFS Chemicals, Inc, Liaoning Oxiranchem Inc., Liaoning Kelong Fine Chemical Co., Ltd., LOTTE Chemical Corporation, Hefei TNJ Chemical Industry Co., Ltd., Noah Chemicals, and Mil-Spec Industries Corporation among others |
Market Definition
PEG or polyethylene glycol is a polymeric material composed of ethylene oxide and water as monomers which are not only hydrophilic but also biocompatible. However, it is a synthetic molecule synthesized by polymerizing ethylene oxide where a ring-opening takes place. As it is composed of water and ethylene oxide, it finds innumerable applications in industries ranging from pharmaceuticals to construction.
Polyethylene glycols are made reactive by the replacement of the terminal hydroxyl group with several reactive functional groups such as thiols, carboxyl groups, N-hydroxysuccinimide esters azides, or reactive alkyne groups, which initiate the formation of crosslinks. It is conjugation chemistry, which plays a major role in their synthesis and depending on the attached functional group, different conditions and methods are chosen. For instance, acrylate-terminated polyethylene glycols could undergo rapid reaction under mild reaction conditions. It is colorless, low-toxic, non-irritating in nature, and has very high biocompatibility. It is widely used as an anti-foaming agent, lubricant, dispersive agent, and laxative. It is applicable to a variety of industries, such as pharmaceuticals, healthcare, building and construction, personal care, and cosmetics.
Middle East and Africa Polyethylene Glycol Market Dynamics
This section deals with understanding the market drivers, advantages, opportunities, restraints and challenges. All of this is discussed in detail as below:
Drivers:
- Growing demand for medicines
Drug discovery is a tedious process that takes many years. Research and development towards creating new innovative pharmaceuticals are becoming important due to the increased number of chronic diseases, the aging population, and the entry of generic competitors in the future market.
The pharmaceutical industry is growing Middle East and Africa at an increased rate, with 'Pfizer medicine having the highest sales rate in the market. Pfizer's research and development department also predicted that the main research is attributed towards oncologic and pain killer drugs, lipid regulators, antidiabetics, respiratory agents, and others, with the United States showing the highest revenue growth.
In the evaluation of the pharmacodynamics of candidate compounds, the metabolism of drugs plays a direct role. Polyethylene glycol acts as an inactive ingredient in the pharmaceutical industry, usually as a wetting and thickening agent in ointment and creams, and is used to add protective coatings tablets. Moreover, its use as an electrolyte solution for the examination of disorders and dysfunctionality in the colon of humans is well known.
- Usage of PEGlycation technology in biotechnological and pharmaceutical applications
PEGylation is the technique of modification of biopharmaceuticals containing polyethylene glycol to enhance the pharmacological properties of the proteins and other large molecules in bio-therapeutic drugs. The technique elongates the period of the half-life of the parental drugs and enhances the aqueous solubility of drug substances.
The PEGylation of protein molecules involves the addition of PEG molecules to the protein structure, which changes its pharmacokinetic properties and reduces the immunogenicity of molecules that help prevent infections, specifically in cancer therapy. The technique involves the conjugation of protein molecules that prolongs the blood circulation of proteins with the reduction of immunogenicity. This is because certain groups of antibody, called Anti-PEG, in the immune system recognizes and binds to the molecules of polyethylene glycols. Anti-PEG antibodies are non-toxic in nature and cause no harm to human tissues.
Opportunities
- Production of polyethylene glycol- 400 for eye drop applications
Polyethylene glycol-400 is a clear and colorless liquid mainly derived from petroleum possessing the characteristic of a standard petroleum polyethylene glycol. The shelf life of these eye drops is one year when stored in a cool and well-ventilated space.
Polyethylene glycol-400 is a low molecular weight compound with less toxicity. It is very hydrophilic, which makes it useful in drug formulations. Its major application lies as an ophthalmic solution, which is generally used for the treatment of burning, discomfort, or dryness of eyes. There are various names, such as blink gel tears, blink tears, or vision true tear liquids, for eye drop solutions that contain the same compound.
RESTRAINTS/ CHALLENGES
- Viscosity stability issues in PEG
Polyethylene glycol is a compound widely used in pharmaceutical formulations, including every variety of parental, topical, oral, rectal, and ophthalmic disorder preparations. Solid grades of Polyethylene glycol with the addition of liquid grade polyethylene glycol can be used in topical ointments and as ointment bases. Moreover, these Liquid polyethylene glycols are used as water-soluble solvents in soft gelatin capsules.
However, the adsorption of moisture by polyethylene glycol from the gelatin can sometimes lead to the hardening of the capsule shell, which alternately can affect the health of the patient consuming it.
Post-COVID-19 Impact on the Middle East and Africa Polyethylene glycol Market
Post the pandemic, the demand for polyethylene glycol products has increased as there won't be any more restrictions on movement, so the supply of products would be easy. In addition, companies developed their processing units to manufacture polyethylene glycol-based products, and the demand for polyethylene glycol in the beauty and healthcare industries has also increased, which may propel the market's growth.
The increased demand in building and construction enables manufacturers to produce more new products, which ultimately increases the demand for Polyethylene glycol and has helped the market grow.
Moreover, the high demand in healthcare industries for will drive the market's growth. Furthermore, the demand for polyethylene glycol in healthcare industries after the COVID-19 pandemic has increased as there is rising awareness about the health benefits and high demand from the healthcare service sector resulted in market growth. Additionally, consumers' interest in new polyethylene glycol and research development is expected to fuel the growth of the Middle East and Africa polyethylene glycol market.
Recent Developments
- In May 2022, EA Pharma Co., Ltd. announced the launch of MOVICOL® HD, A new dosage form added to polyethylene glycol chronic constipation treatment for the first time in Japan. The MOVICOL® HD is a high dose formulation of existing "MOVICOL® LD", the first polyethylene glycol indicated for the treatment of chronic constipation.
- In October 2021, Camber consumer care introduced 4 new over-the-counter items, including Polyethylene Glycol Powder. The company now provides generic OTC medications in a range of strengths and dosages for allergy, pain, and gastrointestinal relief, benefiting a wide range of patients.
Middle East and Africa Polyethylene Glycol Market Scope
The Middle East and Africa polyethylene glycol market is categorized into four notable segments, which are grade, form, packaging size and application. The growth amongst these segments will help you analyze major growth segments in the industries and provide the users with a valuable market overview and market insights to help them make strategic decisions for identifying core market applications.
Grade
- PEG 200
- PEG 300
- PEG 400
- PEG 600
- PEG 1000
- PEG 3350
- PEG 4000
- PEG 6000
- PEG 8000
- PEG 10000
- PEG 20000
On the basis of grade, the market is segmented into PEG 200, PEG 300, PEG 400, PEG 600, PEG 1000, PEG 3350, PEG 4000, PEG 6000, PEG 8000, PEG 10000, and PEG 20000.
Form
- Opaque Liquid,
- White Waxy Solid
- Flakes/ Powder
On the basis of form, the market is segmented into opaque liquid, white waxy solid, and flakes/ powder.
Packaging Size
- Plastic Bottles
- Drums Bags
On the basis of packaging size, the market is segmented into plastic bottles and drums.
Application
- Healthcare
- Building and Construction
- Industrial
- Cosmetics/Personal Care
- Others
On the basis of application, the market is segmented into healthcare, building and construction, industrial, cosmetics/personal care, and others.
Middle East and Africa Polyethylene Glycol Market Regional Analysis/Insights
The polyethylene glycol market is analyzed and market size insights and trends are provided by country on grade, form, packaging size, application and market size insights and trends are provided based on as referenced above.
The countries covered in the Middle East and Africa polyethylene glycol market report are South Africa, United Arab Emirates, Saudi Arabia, Egypt, Qatar, Oman, Kuwait, Bahrain, Rest of the Middle East and Africa.
Saudi Arabia is dominating the Middle East and Africa polyethylene glycol market. Polyethylene glycol and its derivatives find a wide range of applications in drugs, diagnostics, and medical devices is the major reason for the growth of Polyethylene Glycol Market in Saudi Arabia However, Viscosity Stability Issues in PEG is expected to restrict the growth of market.
The country section of the report also provides individual market impacting factors and changes in market regulation that impact the current and future trends of the market. Data points like down-stream and upstream value chain analysis, technical trends and porter's five forces analysis, case studies are some of the pointers used to forecast the market scenario for individual countries. Also, the presence and availability of Middle East and Africa brands and their challenges faced due to large or scarce competition from local and domestic brands, impact of domestic tariffs and trade routes are considered while providing forecast analysis of the country data.
Competitive Landscape and Middle East and Africa Polyethylene Glycol Market Share Analysis
The Middle East and Africa polyethylene glycol market competitive landscape provides details by competitor. Details included are company overview, company financials, revenue generated, market potential, investment in research and development, new market initiatives, Middle East and Africa presence, production sites and facilities, production capacities, company strengths and weaknesses, product launch, product width and breadth, application dominance. The above data points provided are only related to the companies' focus on the polyethylene glycol market.
Some of the major players operating in the Middle East and Africa polyethylene glycol market are SABIC, Dow, BASF SE, Merck KGaA, INEOS, Croda International Plc, Clariant, India Glycols Limited, Pro Chem, Inc., GFS Chemicals, Inc, Liaoning Oxiranchem Inc., Liaoning Kelong Fine Chemical Co., Ltd., LOTTE Chemical Corporation, Hefei TNJ Chemical Industry Co., Ltd., Noah Chemicals, and Mil-Spec Industries Corporation among others.
SKU-
Get online access to the report on the World's First Market Intelligence Cloud

- Interactive Data Analysis Dashboard
- Company Analysis Dashboard for high growth potential opportunities
- Research Analyst Access for customization & queries
- Competitor Analysis with Interactive dashboard
- Latest News, Updates & Trend analysis
- Harness the Power of Benchmark Analysis for Comprehensive Competitor Tracking
Table of Content
1 INTRODUCTION
1.1 OBJECTIVES OF THE STUDY
1.2 MARKET DEFINITION
1.3 OVERVIEW OF THE MIDDLE EAST & AFRICA POLYETHYLENE GLYCOL MARKET
1.4 LIMITATIONS
1.5 MARKETS COVERED
2 MARKET SEGMENTATION
2.1 MARKETS COVERED
2.2 GEOGRAPHICAL SCOPE
2.3 YEARS CONSIDERED FOR THE STUDY
2.4 CURRENCY AND PRICING
2.5 DBMR TRIPOD DATA VALIDATION MODEL
2.6 MULTIVARIATE MODELLING
2.7 TREATMENT LIFELINE CURVE
2.8 PRIMARY INTERVIEWS WITH KEY OPINION LEADERS
2.9 DBMR MARKET POSITION GRID
2.1 MARKET APPLICATION COVERAGE GRID
2.11 SECONDARY SOURCES
2.12 ASSUMPTIONS
3 EXECUTIVE SUMMARY
4 PREMIUM INSIGHTS
4.1 PESTEL ANALYSIS
4.2 PORTER'S FIVE FORCES:
4.3 REGULATORY FRAMEWORK
4.4 IMPORT EXPORT SCENARIO
4.5 PRODUCTION CONSUMPTION ANALYSIS
4.6 RAW MATERIAL COVERAGE – MIDDLE EAST & AFRICA POLYETHYLENE GLYCOL MARKET
4.7 TECHNOLOGICAL ADVANCEMENT BY MANUFACTURERS
4.8 VENDOR SELECTION CRITERIA
5 MIDDLE EAST & AFRICA POLYETHYLENE GLYCOL MARKET: PRICE INDEX
6 PRODUCTION CAPACITY
7 SUPPLY CHAIN ANALYSIS
7.1 OVERVIEW
7.2 LOGISTIC COST SCENARIO
7.3 IMPORTANCE OF LOGISTICS SERVICE PROVIDERS
8 MARKET OVERVIEW
8.1 DRIVERS
8.1.1 GROWING DEMAND FOR MEDICINES
8.1.2 HIGH DEMAND OF ICE-CREAMS
8.1.3 USAGE OF PEGLYCATION TECHNOLOGY IN BIOTECHNOLOGICAL AND PHARMACEUTICAL APPLICATIONS
8.1.4 HIGH DEMAND FOR WATER-BASED PAINTS
8.2 RESTRAINTS
8.2.1 VISCOSITY STABILITY ISSUES IN PEG
8.2.2 STRICT REGULATIONS IN THE PHARMACEUTICAL INDUSTRY
8.2.3 ENVIRONMENTAL REGULATIONS
8.2.4 HIGH DEMAND FOR SUBSTITUTES
8.3 OPPORTUNITIES
8.3.1 PRODUCTION OF POLYETHYLENE GLYCOL- 400 FOR EYE DROP APPLICATIONS
8.3.2 PRODUCTION OF PEG FOR SKIN THERAPY AND OINTMENT APPLICATIONS
8.3.3 USE OF POLYETHYLENE GLYCOL AS AN ADDITIVES TO IMPROVE THE PROPERTIES OF PAINT AND COATINGS
8.4 CHALLENGES
8.4.1 FLUCTUATING RAW MATERIAL PRICES
8.4.2 HIGH IMPORT TARIFFS AND REGULATIONS
8.4.3 IMMEDIATE ALLERGIC REACTIONS OF PEG
9 MIDDLE EAST & AFRICA POLYETHYLENE GLYCOL MARKET, BY GRADE
9.1 OVERVIEW
9.2 PEG 400
9.3 PEG 600
9.4 PEG 200
9.5 PEG 300
9.6 PEG 1000
9.7 PEG 3350
9.8 PEG 4000
9.9 PEG 8000
9.1 PEG 6000
9.11 PEG 10000
9.12 PEG 20000
10 MIDDLE EAST & AFRICA POLYETHYLENE GLYCOL MARKET, BY FORM
10.1 OVERVIEW
10.2 OPAQUE LIQUID
10.3 FLAKES/POWDER
10.4 WHITE WAXY SOLID
11 MIDDLE EAST & AFRICA POLYETHYLENE GLYCOL MARKET, BY PACKAGING SIZE
11.1 OVERVIEW
11.2 DRUMS
11.3 PLASTIC BOTTLES
12 MIDDLE EAST & AFRICA POLYETHYLENE GLYCOL MARKET, BY APPLICATION
12.1 OVERVIEW
12.2 HEALTHCARE
12.2.1 PHARMACEUTICALS
12.2.1.1 TABLETS
12.2.1.2 OINTMENTS
12.2.2 COLONOSCOPY
12.2.3 BARIUM ENEMA PREPARATION
12.3 INDUSTRIAL
12.4 COSMETICS/PERSONAL CARE
12.4.1 SKIN CREAM
12.4.2 TOOTHPASTE
12.4.3 PERSONAL LUBRICANTS
12.4.4 OTHERS
12.5 BUILDING AND CONSTRUCTION
12.5.1 PAINTS AND COATINGS
12.5.2 CERAMIC TILES
12.5.3 OTHERS
12.6 OTHERS
13 MIDDLE EAST & AFRICA POLYETHYLENE GLYCOL MARKET, BY REGION
13.1 MIDDLE EAST AND AFRICA
13.1.1 SAUDI ARABIA
13.1.2 EGYPT
13.1.3 SOUTH AFRICA
13.1.4 QATAR
13.1.5 UNITED ARAB EMIRATES
13.1.6 OMAN
13.1.7 KUWAIT
13.1.8 BAHRAIN
13.1.9 REST OF MIDDLE EAST AND AFRICA
14 COMPANY LANDSCAPE
14.1 COMPANY SHARE ANALYSIS: MIDDLE EAST & AFRICA
15 SWOT ANALYSIS
16 COMPANY PROFILE
16.1 SABIC
16.1.1 COMPANY SNAPSHOT
16.1.2 REVENUE ANALYSIS
16.1.3 COMPANY SHARE ANALYSIS
16.1.4 PRODUCT PORTFOLIO
16.1.5 RECENT DEVELOPMENTS
16.2 MERCK KGAA
16.2.1 COMPANY SNAPSHOT
16.2.2 REVENUE ANALYSIS
16.2.3 COMPANY SHARE ANALYSIS
16.2.4 PRODUCT PORTFOLIO
16.2.5 RECENT DEVELOPMENTS
16.3 DOW
16.3.1 COMPANY SNAPSHOT
16.3.2 REVENUE ANALYSIS
16.3.3 COMPANY SHARE ANALYSIS
16.3.4 PRODUCT PORTFOLIO
16.3.5 RECENT DEVELOPMENTS
16.4 BASF SE
16.4.1 COMPANY SNAPSHOT
16.4.2 REVENUE ANALYSIS
16.4.3 COMPANY SHARE ANALYSIS
16.4.4 PRODUCT PORTFOLIO
16.4.5 RECENT DEVELOPMENTS
16.5 INEOS
16.5.1 COMPANY SNAPSHOT
16.5.2 REVENUE ANALYSIS
16.5.3 COMPANY SHARE ANALYSIS
16.5.4 PRODUCT PORTFOLIO
16.5.5 RECENT DEVELOPMENTS
16.6 LOTTE CHEMICAL CORPORATION
16.6.1 COMPANY SNAPSHOT
16.6.2 REVENUE ANALYSIS
16.6.3 COMPANY SHARE ANALYSIS
16.6.4 PRODUCT PORTFOLIO
16.6.5 RECENT DEVELOPMENTS
16.7 HEFEI TNJ CHEMICAL INDUSTRY CO., LTD.
16.7.1 COMPANY SNAPSHOT
16.7.2 PRODUCT PORTFOLIO
16.7.3 RECENT DEVELOPMENTS
16.8 CLARIANT
16.8.1 COMPANY SNAPSHOT
16.8.2 REVENUE ANALYSIS
16.8.3 PRODUCT PORTFOLIO
16.8.4 RECENT DEVELOPMENT
16.9 CRODA INTERNATIONAL PLC
16.9.1 COMPANY SNAPSHOT
16.9.2 REVENUE ANALYSIS
16.9.3 PRODUCT PORTFOLIO
16.9.4 RECENT DEVELOPMENTS
16.1 GFS CHEMICALS, INC.
16.10.1 COMPANY SNAPSHOT
16.10.2 PRODUCT PORTFOLIO
16.10.3 RECENT DEVELOPMENT
16.11 INDIA GLYCOLS LIMITED
16.11.1 COMPANY SNAPSHOT
16.11.2 REVENUE ANALYSIS
16.11.3 PRODUCT PORTFOLIO
16.11.4 RECENT DEVELOPMENTS
16.12 LIAONING KELONG FINE CHEMICAL CO., LTD.
16.12.1 COMPANY SNAPSHOT
16.12.2 PRODUCT PORTFOLIO
16.12.3 RECENT DEVELOPMENTS
16.13 LIAONING OXIRANCHEM INC.
16.13.1 COMPANY SNAPSHOT
16.13.2 PRODUCT PORTFOLIO
16.13.3 RECENT DEVELOPMENTS
16.14 MIL-SPEC INDUSTRIES CORPORATION
16.14.1 COMPANY SNAPSHOT
16.14.2 PRODUCT PORTFOLIO
16.14.3 RECENT DEVELOPMENT
16.15 NOAH CHEMICALS
16.15.1 COMPANY SNAPSHOT
16.15.2 PRODUCT PORTFOLIO
16.15.3 RECENT DEVELOPMENT
16.16 PROCHEM, INC
16.16.1 COMPANY SNAPSHOT
16.16.2 PRODUCT PORTFOLIO
16.16.3 RECENT DEVELOPMENT
17 QUESTIONNAIRE
18 RELATED REPORTS
List of Table
TABLE 1 MIDDLE EAST & AFRICA POLYETHYLENE GLYCOL MARKET, BY GRADE, 2021-2030 (USD MILLION)
TABLE 2 MIDDLE EAST & AFRICA POLYETHYLENE GLYCOL MARKET, BY GRADE, 2021-2030 (TONS)
TABLE 3 MIDDLE EAST & AFRICA PEG 400 IN POLYETHYLENE GLYCOL MARKET, BY REGION, 2021-2030 (USD MILLION)
TABLE 4 MIDDLE EAST & AFRICA PEG 400 IN POLYETHYLENE GLYCOL MARKET, BY REGION, 2021-2030 (TONS)
TABLE 5 MIDDLE EAST & AFRICA PEG 600 IN POLYETHYLENE GLYCOL MARKET, BY REGION, 2021-2030 (USD MILLION)
TABLE 6 MIDDLE EAST & AFRICA PEG 600 IN POLYETHYLENE GLYCOL MARKET, BY REGION, 2021-2030 (TONS)
TABLE 7 MIDDLE EAST & AFRICA PEG 200 IN POLYETHYLENE GLYCOL MARKET, BY REGION, 2021-2030 (USD MILLION)
TABLE 8 MIDDLE EAST & AFRICA PEG 200 IN POLYETHYLENE GLYCOL MARKET, BY REGION, 2021-2030 (TONS)
TABLE 9 MIDDLE EAST & AFRICA PEG 300 IN POLYETHYLENE GLYCOL MARKET, BY REGION, 2021-2030 (USD MILLION
TABLE 10 MIDDLE EAST & AFRICA PEG 300 IN POLYETHYLENE GLYCOL MARKET, BY REGION, 2021-2030 (TONS)
TABLE 11 MIDDLE EAST & AFRICA PEG 1000 IN POLYETHYLENE GLYCOL MARKET, BY REGION, 2021-2030 (USD MILLION)
TABLE 12 MIDDLE EAST & AFRICA PEG 1000 IN POLYETHYLENE GLYCOL MARKET, BY REGION, 2021-2030 (TONS)
TABLE 13 MIDDLE EAST & AFRICA PEG 3350 IN POLYETHYLENE GLYCOL MARKET, BY REGION, 2021-2030 (USD MILLION)
TABLE 14 MIDDLE EAST & AFRICA PEG 3350 IN POLYETHYLENE GLYCOL MARKET, BY REGION, 2021-2030 (TONS)
TABLE 15 MIDDLE EAST & AFRICA PEG 4000 IN POLYETHYLENE GLYCOL MARKET, BY REGION, 2021-2030 (USD MILLION)
TABLE 16 MIDDLE EAST & AFRICA PEG 4000 IN POLYETHYLENE GLYCOL MARKET, BY REGION, 2021-2030 (TONS)
TABLE 17 MIDDLE EAST & AFRICA PEG 8000 IN POLYETHYLENE GLYCOL MARKET, BY REGION, 2021-2030 (USD MILLION)
TABLE 18 MIDDLE EAST & AFRICA PEG 8000 IN POLYETHYLENE GLYCOL MARKET, BY REGION, 2021-2030 (TONS)
TABLE 19 MIDDLE EAST & AFRICA PEG 6000 IN POLYETHYLENE GLYCOL MARKET, BY REGION, 2021-2030 (USD MILLION)
TABLE 20 MIDDLE EAST & AFRICA PEG 6000 IN POLYETHYLENE GLYCOL MARKET, BY REGION, 2021-2030 (TONS)
TABLE 21 MIDDLE EAST & AFRICA PEG 10000 IN POLYETHYLENE GLYCOL MARKET, BY REGION, 2021-2030 (USD MILLION)
TABLE 22 MIDDLE EAST & AFRICA PEG 10000 IN POLYETHYLENE GLYCOL MARKET, BY REGION, 2021-2030 (TONS)
TABLE 23 MIDDLE EAST & AFRICA PEG 20000 IN POLYETHYLENE GLYCOL MARKET, BY REGION, 2021-2030 (USD MILLION)
TABLE 24 MIDDLE EAST & AFRICA PEG 20000 IN POLYETHYLENE GLYCOL MARKET, BY REGION, 2021-2030 (TONS)
TABLE 25 MIDDLE EAST & AFRICA POLYETHYLENE GLYCOL MARKET, BY FORM, 2021-2030 (USD MILLION)
TABLE 26 MIDDLE EAST & AFRICA POLYETHYLENE GLYCOL MARKET, BY FORM, 2021-2030 (TONS)
TABLE 27 MIDDLE EAST & AFRICA OPAQUE LIQUID IN POLYETHYLENE GLYCOL MARKET, BY REGION, 2021-2030 (USD MILLION)
TABLE 28 MIDDLE EAST & AFRICA OPAQUE LIQUID IN POLYETHYLENE GLYCOL MARKET, BY REGION, 2021-2030 (TONS)
TABLE 29 MIDDLE EAST & AFRICA FLAKES/POWDER IN POLYETHYLENE GLYCOL MARKET, BY REGION, 2021-2030 (USD MILLION)
TABLE 30 MIDDLE EAST & AFRICA FLAKES/POWDER IN POLYETHYLENE GLYCOL MARKET, BY REGION, 2021-2030 (TONS)
TABLE 31 MIDDLE EAST & AFRICA WHITE WAXY SOLID IN POLYETHYLENE GLYCOL MARKET, BY REGION, 2021-2030 (USD MILLION)
TABLE 32 MIDDLE EAST & AFRICA WHITE WAXY SOLID IN POLYETHYLENE GLYCOL MARKET, BY REGION, 2021-2030 (TONS)
TABLE 33 MIDDLE EAST & AFRICA POLYETHYLENE GLYCOL MARKET, BY PACKAGING SIZE, 2021-2030 (USD MILLION)
TABLE 34 MIDDLE EAST & AFRICA POLYETHYLENE GLYCOL MARKET, BY PACKAGING SIZE, 2021-2030 (TONS)
TABLE 35 MIDDLE EAST & AFRICA DRUMS IN POLYETHYLENE GLYCOL MARKET, BY REGION, 2021-2030 (USD MILLION)
TABLE 36 MIDDLE EAST & AFRICA DRUMS IN POLYETHYLENE GLYCOL MARKET, BY REGION, 2021-2030 (TONS)
TABLE 37 MIDDLE EAST & AFRICA PLASTIC BOTTLES IN POLYETHYLENE GLYCOL MARKET, BY REGION, 2021-2030 (USD MILLION)
TABLE 38 MIDDLE EAST & AFRICA PLASTIC BOTTLES IN POLYETHYLENE GLYCOL MARKET, BY REGION, 2021-2030 (TONS)
TABLE 39 MIDDLE EAST & AFRICA POLYETHYLENE GLYCOL MARKET, BY APPLICATION, 2021-2030 (USD MILLION)
TABLE 40 MIDDLE EAST & AFRICA POLYETHYLENE GLYCOL MARKET, BY APPLICATION, 2021-2030 (TONS)
TABLE 41 MIDDLE EAST & AFRICA HEALTHCARE IN POLYETHYLENE GLYCOL MARKET, BY REGION, 2021-2030 (USD MILLION)
TABLE 42 MIDDLE EAST & AFRICA HEALTHCARE IN POLYETHYLENE GLYCOL MARKET, BY REGION, 2021-2030 (TONS)
TABLE 43 MIDDLE EAST & AFRICA HEALTHCARE IN POLYETHYLENE GLYCOL MARKET, BY APPLICATION, 2021-2030 (USD MILLION)
TABLE 44 MIDDLE EAST & AFRICA HEALTHCARE IN POLYETHYLENE GLYCOL MARKET, BY APPLICATION, 2021-2030 (TONS)
TABLE 45 MIDDLE EAST & AFRICA PHARMACEUTICALS IN POLYETHYLENE GLYCOL MARKET, BY CATEGORY, 2021-2030 (USD MILLION)
TABLE 46 MIDDLE EAST & AFRICA PHARMACEUTICALS IN POLYETHYLENE GLYCOL MARKET, BY CATEGORY, 2021-2030 (TONS)
TABLE 47 MIDDLE EAST & AFRICA INDUSTRIAL IN POLYETHYLENE GLYCOL MARKET, BY REGION, 2021-2030 (USD MILLION)
TABLE 48 MIDDLE EAST & AFRICA INDUSTRIAL IN POLYETHYLENE GLYCOL MARKET, BY REGION, 2021-2030 (TONS)
TABLE 49 MIDDLE EAST & AFRICA COSMETIC/PERSONAL CARE IN POLYETHYLENE GLYCOL MARKET, BY REGION, 2021-2030 (USD MILLION)
TABLE 50 MIDDLE EAST & AFRICA COSMETIC/PERSONAL CARE IN POLYETHYLENE GLYCOL MARKET, BY REGION, 2021-2030 (TONS)
TABLE 51 MIDDLE EAST & AFRICA COSMETICS/PERSONAL CARE IN POLYETHYLENE GLYCOL MARKET, BY APPLICATION, 2021-2030 (USD MILLION)
TABLE 52 MIDDLE EAST & AFRICA COSMETICS/PERSONAL CARE IN POLYETHYLENE GLYCOL MARKET, BY APPLICATION, 2021-2030 (TONS)
TABLE 53 MIDDLE EAST & AFRICA BUILDING AND CONSTRUCTION IN POLYETHYLENE GLYCOL MARKET, BY REGION, 2021-2030 (USD MILLION)
TABLE 54 MIDDLE EAST & AFRICA BUILDING AND CONSTRUCTION IN POLYETHYLENE GLYCOL MARKET, BY REGION, 2021-2030 (TONS)
TABLE 55 MIDDLE EAST & AFRICA BUILDING AND CONSTRUCTION IN POLYETHYLENE GLYCOL MARKET, BY APPLICATION, 2021-2030 (USD MILLION)
TABLE 56 MIDDLE EAST & AFRICA BUILDING AND CONSTRUCTION IN POLYETHYLENE GLYCOL MARKET, BY APPLICATION, 2021-2030 (TONS)
TABLE 57 MIDDLE EAST & AFRICA OTHERS IN POLYETHYLENE GLYCOL MARKET, BY REGION, 2021-2030 (USD MILLION)
TABLE 58 MIDDLE EAST & AFRICA OTHERS IN POLYETHYLENE GLYCOL MARKET, BY REGION, 2021-2030 (TONS)
TABLE 59 MIDDLE EAST AND AFRICA POLYETHYLENE GLYCOL MARKET, BY COUNTRY, 2021-2030 (USD MILLION)
TABLE 60 MIDDLE EAST AND AFRICA POLYETHYLENE GLYCOL MARKET, BY COUNTRY, 2021-2030 (TONS)
TABLE 61 MIDDLE EAST AND AFRICA POLYETHYLENE GLYCOL MARKET, BY GRADE, 2021-2030 (USD MILLION)
TABLE 62 MIDDLE EAST AND AFRICA POLYETHYLENE GLYCOL MARKET, BY GRADE, 2021-2030 (TONS)
TABLE 63 MIDDLE EAST AND AFRICA POLYETHYLENE GLYCOL MARKET, BY GRADE ASP, 2021-2030 (USD/TON)
TABLE 64 MIDDLE EAST AND AFRICA POLYETHYLENE GLYCOL MARKET, BY FORM, 2021-2030 (USD MILLION)
TABLE 65 MIDDLE EAST AND AFRICA POLYETHYLENE GLYCOL MARKET, BY FORM, 2021-2030 (TONS)
TABLE 66 MIDDLE EAST AND AFRICA POLYETHYLENE GLYCOL MARKET, BY FORM ASP, 2021-2030 (USD/TON)
TABLE 67 MIDDLE EAST AND AFRICA POLYETHYLENE GLYCOL MARKET, BY PACKAGING SIZE, 2021-2030 (USD MILLION)
TABLE 68 MIDDLE EAST AND AFRICA POLYETHYLENE GLYCOL MARKET, BY PACKAGING SIZE, 2021-2030 (TONS)
TABLE 69 MIDDLE EAST AND AFRICA POLYETHYLENE GLYCOL MARKET, BY PACKAGING SIZE ASP, 2021-2030 (USD/ TON)
TABLE 70 MIDDLE EAST AND AFRICA POLYETHYLENE GLYCOL MARKET, BY APPLICATION, 2021-2030 (USD MILLION)
TABLE 71 MIDDLE EAST AND AFRICA POLYETHYLENE GLYCOL MARKET, BY APPLICATION, 2021-2030 (TONS)
TABLE 72 MIDDLE EAST AND AFRICA POLYETHYLENE GLYCOL MARKET, BY APPLICATION ASP, 2021-2030 (USD/TON)
TABLE 73 MIDDLE EAST AND AFRICA HEALTHCARE IN POLYETHYLENE GLYCOL MARKET, BY APPLICATION, 2021-2030 (USD MILLION)
TABLE 74 MIDDLE EAST AND AFRICA HEALTHCARE IN POLYETHYLENE GLYCOL MARKET, BY APPLICATION, 2021-2030 (TONS)
TABLE 75 MIDDLE EAST AND AFRICA PHARMACEUTICALS IN POLYETHYLENE GLYCOL MARKET, BY CATEGORY, 2021-2030 (USD MILLION)
TABLE 76 MIDDLE EAST AND AFRICA PHARMACEUTICALS IN POLYETHYLENE GLYCOL MARKET, BY CATEGORY, 2021-2030 (TONS)
TABLE 77 MIDDLE EAST AND AFRICA COSMETICS/PERSONAL CARE IN POLYETHYLENE GLYCOL MARKET, BY APPLICATION, 2021-2030 (USD MILLION)
TABLE 78 MIDDLE EAST AND AFRICA COSMETICS/PERSONAL CARE IN POLYETHYLENE GLYCOL MARKET, BY APPLICATION, 2021-2030 (TONS)
TABLE 79 MIDDLE EAST AND AFRICA BUILDING AND CONSTRUCTION IN POLYETHYLENE GLYCOL MARKET, BY APPLICATION, 2021-2030 (USD MILLION)
TABLE 80 MIDDLE EAST AND AFRICA BUILDING AND CONSTRUCTION IN POLYETHYLENE GLYCOL MARKET, BY APPLICATION, 2021-2030 (TONS)
TABLE 81 SAUDI ARABIA POLYETHYLENE GLYCOL MARKET, BY GRADE, 2021-2030 (USD MILLION)
TABLE 82 SAUDI ARABIA POLYETHYLENE GLYCOL MARKET, BY GRADE, 2021-2030 (TONS)
TABLE 83 SAUDI ARABIA POLYETHYLENE GLYCOL MARKET, BY GRADE ASP, 2021-2030 (USD/TON)
TABLE 84 SAUDI ARABIA POLYETHYLENE GLYCOL MARKET, BY FORM, 2021-2030 (USD MILLION)
TABLE 85 SAUDI ARABIA POLYETHYLENE GLYCOL MARKET, BY FORM, 2021-2030 (TONS)
TABLE 86 SAUDI ARABIA POLYETHYLENE GLYCOL MARKET, BY FORM ASP, 2021-2030 (USD/TON)
TABLE 87 SAUDI ARABIA POLYETHYLENE GLYCOL MARKET, BY PACKAGING SIZE, 2021-2030 (USD MILLION)
TABLE 88 SAUDI ARABIA POLYETHYLENE GLYCOL MARKET, BY PACKAGING SIZE, 2021-2030 (TONS)
TABLE 89 SAUDI ARABIA POLYETHYLENE GLYCOL MARKET, BY PACKAGING SIZE ASP, 2021-2030 (USD/ TON)
TABLE 90 SAUDI ARABIA POLYETHYLENE GLYCOL MARKET, BY APPLICATION, 2021-2030 (USD MILLION)
TABLE 91 SAUDI ARABIA POLYETHYLENE GLYCOL MARKET, BY APPLICATION, 2021-2030 (TONS)
TABLE 92 SAUDI ARABIA POLYETHYLENE GLYCOL MARKET, BY APPLICATION ASP, 2021-2030 (USD/TON)
TABLE 93 SAUDI ARABIA HEALTHCARE IN POLYETHYLENE GLYCOL MARKET, BY APPLICATION, 2021-2030 (USD MILLION)
TABLE 94 SAUDI ARABIA HEALTHCARE IN POLYETHYLENE GLYCOL MARKET, BY APPLICATION, 2021-2030 (TONS)
TABLE 95 SAUDI ARABIA PHARMACEUTICALS IN POLYETHYLENE GLYCOL MARKET, BY CATEGORY, 2021-2030 (USD MILLION)
TABLE 96 SAUDI ARABIA PHARMACEUTICALS IN POLYETHYLENE GLYCOL MARKET, BY CATEGORY, 2021-2030 (TONS)
TABLE 97 SAUDI ARABIA COSMETICS/PERSONAL CARE IN POLYETHYLENE GLYCOL MARKET, BY APPLICATION, 2021-2030 (USD MILLION)
TABLE 98 SAUDI ARABIA COSMETICS/PERSONAL CARE IN POLYETHYLENE GLYCOL MARKET, BY APPLICATION, 2021-2030 (TONS)
TABLE 99 SAUDI ARABIA BUILDING AND CONSTRUCTION IN POLYETHYLENE GLYCOL MARKET, BY APPLICATION, 2021-2030 (USD MILLION)
TABLE 100 SAUDI ARABIA BUILDING AND CONSTRUCTION IN POLYETHYLENE GLYCOL MARKET, BY APPLICATION, 2021-2030 (TONS)
TABLE 101 EGYPT POLYETHYLENE GLYCOL MARKET, BY GRADE, 2021-2030 (USD MILLION)
TABLE 102 EGYPT POLYETHYLENE GLYCOL MARKET, BY GRADE, 2021-2030 (TONS)
TABLE 103 EGYPT POLYETHYLENE GLYCOL MARKET, BY GRADE ASP, 2021-2030 (USD/TON)
TABLE 104 EGYPT POLYETHYLENE GLYCOL MARKET, BY FORM, 2021-2030 (USD MILLION)
TABLE 105 EGYPT POLYETHYLENE GLYCOL MARKET, BY FORM, 2021-2030 (TONS)
TABLE 106 EGYPT POLYETHYLENE GLYCOL MARKET, BY FORM ASP, 2021-2030 (USD/TON)
TABLE 107 EGYPT POLYETHYLENE GLYCOL MARKET, BY PACKAGING SIZE, 2021-2030 (USD MILLION)
TABLE 108 EGYPT POLYETHYLENE GLYCOL MARKET, BY PACKAGING SIZE, 2021-2030 (TONS)
TABLE 109 EGYPT POLYETHYLENE GLYCOL MARKET, BY PACKAGING SIZE ASP, 2021-2030 (USD/ TON)
TABLE 110 EGYPT POLYETHYLENE GLYCOL MARKET, BY APPLICATION, 2021-2030 (USD MILLION)
TABLE 111 EGYPT POLYETHYLENE GLYCOL MARKET, BY APPLICATION, 2021-2030 (TONS)
TABLE 112 EGYPT POLYETHYLENE GLYCOL MARKET, BY APPLICATION ASP, 2021-2030 (USD/TON)
TABLE 113 EGYPT HEALTHCARE IN POLYETHYLENE GLYCOL MARKET, BY APPLICATION, 2021-2030 (USD MILLION)
TABLE 114 EGYPT HEALTHCARE IN POLYETHYLENE GLYCOL MARKET, BY APPLICATION, 2021-2030 (TONS)
TABLE 115 EGYPT PHARMACEUTICALS IN POLYETHYLENE GLYCOL MARKET, BY CATEGORY, 2021-2030 (USD MILLION)
TABLE 116 EGYPT PHARMACEUTICALS IN POLYETHYLENE GLYCOL MARKET, BY CATEGORY, 2021-2030 (TONS)
TABLE 117 EGYPT COSMETICS/PERSONAL CARE IN POLYETHYLENE GLYCOL MARKET, BY APPLICATION, 2021-2030 (USD MILLION)
TABLE 118 EGYPT COSMETICS/PERSONAL CARE IN POLYETHYLENE GLYCOL MARKET, BY APPLICATION, 2021-2030 (TONS)
TABLE 119 EGYPT BUILDING AND CONSTRUCTION IN POLYETHYLENE GLYCOL MARKET, BY APPLICATION, 2021-2030 (USD MILLION)
TABLE 120 EGYPT BUILDING AND CONSTRUCTION IN POLYETHYLENE GLYCOL MARKET, BY APPLICATION, 2021-2030 (TONS)
TABLE 121 SOUTH AFRICA POLYETHYLENE GLYCOL MARKET, BY GRADE, 2021-2030 (USD MILLION)
TABLE 122 SOUTH AFRICA POLYETHYLENE GLYCOL MARKET, BY GRADE, 2021-2030 (TONS)
TABLE 123 SOUTH AFRICA POLYETHYLENE GLYCOL MARKET, BY GRADE ASP, 2021-2030 (USD/TON)
TABLE 124 SOUTH AFRICA POLYETHYLENE GLYCOL MARKET, BY FORM, 2021-2030 (USD MILLION)
TABLE 125 SOUTH AFRICA POLYETHYLENE GLYCOL MARKET, BY FORM, 2021-2030 (TONS)
TABLE 126 SOUTH AFRICA POLYETHYLENE GLYCOL MARKET, BY FORM ASP, 2021-2030 (USD/TON)
TABLE 127 SOUTH AFRICA POLYETHYLENE GLYCOL MARKET, BY PACKAGING SIZE, 2021-2030 (USD MILLION)
TABLE 128 SOUTH AFRICA POLYETHYLENE GLYCOL MARKET, BY PACKAGING SIZE, 2021-2030 (TONS)
TABLE 129 SOUTH AFRICA POLYETHYLENE GLYCOL MARKET, BY PACKAGING SIZE ASP, 2021-2030 (USD/ TON)
TABLE 130 SOUTH AFRICA POLYETHYLENE GLYCOL MARKET, BY APPLICATION, 2021-2030 (USD MILLION)
TABLE 131 SOUTH AFRICA POLYETHYLENE GLYCOL MARKET, BY APPLICATION, 2021-2030 (TONS)
TABLE 132 SOUTH AFRICA POLYETHYLENE GLYCOL MARKET, BY APPLICATION ASP, 2021-2030 (USD/TON)
TABLE 133 SOUTH AFRICA HEALTHCARE IN POLYETHYLENE GLYCOL MARKET, BY APPLICATION, 2021-2030 (USD MILLION)
TABLE 134 SOUTH AFRICA HEALTHCARE IN POLYETHYLENE GLYCOL MARKET, BY APPLICATION, 2021-2030 (TONS)
TABLE 135 SOUTH AFRICA PHARMACEUTICALS IN POLYETHYLENE GLYCOL MARKET, BY CATEGORY, 2021-2030 (USD MILLION)
TABLE 136 SOUTH AFRICA PHARMACEUTICALS IN POLYETHYLENE GLYCOL MARKET, BY CATEGORY, 2021-2030 (TONS)
TABLE 137 SOUTH AFRICA COSMETICS/PERSONAL CARE IN POLYETHYLENE GLYCOL MARKET, BY APPLICATION, 2021-2030 (USD MILLION)
TABLE 138 SOUTH AFRICA COSMETICS/PERSONAL CARE IN POLYETHYLENE GLYCOL MARKET, BY APPLICATION, 2021-2030 (TONS)
TABLE 139 SOUTH AFRICA BUILDING AND CONSTRUCTION IN POLYETHYLENE GLYCOL MARKET, BY APPLICATION, 2021-2030 (USD MILLION)
TABLE 140 SOUTH AFRICA BUILDING AND CONSTRUCTION IN POLYETHYLENE GLYCOL MARKET, BY APPLICATION, 2021-2030 (TONS)
TABLE 141 QATAR POLYETHYLENE GLYCOL MARKET, BY GRADE, 2021-2030 (USD MILLION)
TABLE 142 QATAR POLYETHYLENE GLYCOL MARKET, BY GRADE, 2021-2030 (TONS)
TABLE 143 QATAR POLYETHYLENE GLYCOL MARKET, BY GRADE ASP, 2021-2030 (USD/TON)
TABLE 144 QATAR POLYETHYLENE GLYCOL MARKET, BY FORM, 2021-2030 (USD MILLION)
TABLE 145 QATAR POLYETHYLENE GLYCOL MARKET, BY FORM, 2021-2030 (TONS)
TABLE 146 QATAR POLYETHYLENE GLYCOL MARKET, BY FORM ASP, 2021-2030 (USD/TON)
TABLE 147 QATAR POLYETHYLENE GLYCOL MARKET, BY PACKAGING SIZE, 2021-2030 (USD MILLION)
TABLE 148 QATAR POLYETHYLENE GLYCOL MARKET, BY PACKAGING SIZE, 2021-2030 (TONS)
TABLE 149 QATAR POLYETHYLENE GLYCOL MARKET, BY PACKAGING SIZE ASP, 2021-2030 (USD/ TON)
TABLE 150 QATAR POLYETHYLENE GLYCOL MARKET, BY APPLICATION, 2021-2030 (USD MILLION)
TABLE 151 QATAR POLYETHYLENE GLYCOL MARKET, BY APPLICATION, 2021-2030 (TONS)
TABLE 152 QATAR POLYETHYLENE GLYCOL MARKET, BY APPLICATION ASP, 2021-2030 (USD/TON)
TABLE 153 QATAR HEALTHCARE IN POLYETHYLENE GLYCOL MARKET, BY APPLICATION, 2021-2030 (USD MILLION)
TABLE 154 QATAR HEALTHCARE IN POLYETHYLENE GLYCOL MARKET, BY APPLICATION, 2021-2030 (TONS)
TABLE 155 QATAR PHARMACEUTICALS IN POLYETHYLENE GLYCOL MARKET, BY CATEGORY, 2021-2030 (USD MILLION)
TABLE 156 QATAR PHARMACEUTICALS IN POLYETHYLENE GLYCOL MARKET, BY CATEGORY, 2021-2030 (TONS)
TABLE 157 QATAR COSMETICS/PERSONAL CARE IN POLYETHYLENE GLYCOL MARKET, BY APPLICATION, 2021-2030 (USD MILLION)
TABLE 158 QATAR COSMETICS/PERSONAL CARE IN POLYETHYLENE GLYCOL MARKET, BY APPLICATION, 2021-2030 (TONS)
TABLE 159 QATAR BUILDING AND CONSTRUCTION IN POLYETHYLENE GLYCOL MARKET, BY APPLICATION, 2021-2030 (USD MILLION)
TABLE 160 QATAR BUILDING AND CONSTRUCTION IN POLYETHYLENE GLYCOL MARKET, BY APPLICATION, 2021-2030 (TONS)
TABLE 161 UNITED ARAB EMIRATES POLYETHYLENE GLYCOL MARKET, BY GRADE, 2021-2030 (USD MILLION)
TABLE 162 UNITED ARAB EMIRATES POLYETHYLENE GLYCOL MARKET, BY GRADE, 2021-2030 (TONS)
TABLE 163 UNITED ARAB EMIRATES POLYETHYLENE GLYCOL MARKET, BY GRADE ASP, 2021-2030 (USD/TON)
TABLE 164 UNITED ARAB EMIRATES POLYETHYLENE GLYCOL MARKET, BY FORM, 2021-2030 (USD MILLION)
TABLE 165 UNITED ARAB EMIRATES POLYETHYLENE GLYCOL MARKET, BY FORM, 2021-2030 (TONS)
TABLE 166 UNITED ARAB EMIRATES POLYETHYLENE GLYCOL MARKET, BY FORM ASP, 2021-2030 (USD/TON)
TABLE 167 UNITED ARAB EMIRATES POLYETHYLENE GLYCOL MARKET, BY PACKAGING SIZE, 2021-2030 (USD MILLION)
TABLE 168 UNITED ARAB EMIRATES POLYETHYLENE GLYCOL MARKET, BY PACKAGING SIZE, 2021-2030 (TONS)
TABLE 169 UNITED ARAB EMIRATES POLYETHYLENE GLYCOL MARKET, BY PACKAGING SIZE ASP, 2021-2030 (USD/ TON)
TABLE 170 UNITED ARAB EMIRATES POLYETHYLENE GLYCOL MARKET, BY APPLICATION, 2021-2030 (USD MILLION)
TABLE 171 UNITED ARAB EMIRATES POLYETHYLENE GLYCOL MARKET, BY APPLICATION, 2021-2030 (TONS)
TABLE 172 UNITED ARAB EMIRATES POLYETHYLENE GLYCOL MARKET, BY APPLICATION ASP, 2021-2030 (USD/TON)
TABLE 173 UNITED ARAB EMIRATES HEALTHCARE IN POLYETHYLENE GLYCOL MARKET, BY APPLICATION, 2021-2030 (USD MILLION)
TABLE 174 UNITED ARAB EMIRATES HEALTHCARE IN POLYETHYLENE GLYCOL MARKET, BY APPLICATION, 2021-2030 (TONS)
TABLE 175 UNITED ARAB EMIRATES PHARMACEUTICALS IN POLYETHYLENE GLYCOL MARKET, BY CATEGORY, 2021-2030 (USD MILLION)
TABLE 176 UNITED ARAB EMIRATES PHARMACEUTICALS IN POLYETHYLENE GLYCOL MARKET, BY CATEGORY, 2021-2030 (TONS)
TABLE 177 UNITED ARAB EMIRATES COSMETICS/PERSONAL CARE IN POLYETHYLENE GLYCOL MARKET, BY APPLICATION, 2021-2030 (USD MILLION)
TABLE 178 UNITED ARAB EMIRATES COSMETICS/PERSONAL CARE IN POLYETHYLENE GLYCOL MARKET, BY APPLICATION, 2021-2030 (TONS)
TABLE 179 UNITED ARAB EMIRATES BUILDING AND CONSTRUCTION IN POLYETHYLENE GLYCOL MARKET, BY APPLICATION, 2021-2030 (USD MILLION)
TABLE 180 UNITED ARAB EMIRATES BUILDING AND CONSTRUCTION IN POLYETHYLENE GLYCOL MARKET, BY APPLICATION, 2021-2030 (TONS)
TABLE 181 OMAN POLYETHYLENE GLYCOL MARKET, BY GRADE, 2021-2030 (USD MILLION)
TABLE 182 OMAN POLYETHYLENE GLYCOL MARKET, BY GRADE, 2021-2030 (TONS)
TABLE 183 OMAN POLYETHYLENE GLYCOL MARKET, BY GRADE ASP, 2021-2030 (USD/TON)
TABLE 184 OMAN POLYETHYLENE GLYCOL MARKET, BY FORM, 2021-2030 (USD MILLION)
TABLE 185 OMAN POLYETHYLENE GLYCOL MARKET, BY FORM, 2021-2030 (TONS)
TABLE 186 OMAN POLYETHYLENE GLYCOL MARKET, BY FORM ASP, 2021-2030 (USD/TON)
TABLE 187 OMAN POLYETHYLENE GLYCOL MARKET, BY PACKAGING SIZE, 2021-2030 (USD MILLION)
TABLE 188 OMAN POLYETHYLENE GLYCOL MARKET, BY PACKAGING SIZE, 2021-2030 (TONS)
TABLE 189 OMAN POLYETHYLENE GLYCOL MARKET, BY PACKAGING SIZE ASP, 2021-2030 (USD/ TON)
TABLE 190 OMAN POLYETHYLENE GLYCOL MARKET, BY APPLICATION, 2021-2030 (USD MILLION)
TABLE 191 OMAN POLYETHYLENE GLYCOL MARKET, BY APPLICATION, 2021-2030 (TONS)
TABLE 192 OMAN POLYETHYLENE GLYCOL MARKET, BY APPLICATION ASP, 2021-2030 (USD/TON)
TABLE 193 OMAN HEALTHCARE IN POLYETHYLENE GLYCOL MARKET, BY APPLICATION, 2021-2030 (USD MILLION)
TABLE 194 OMAN HEALTHCARE IN POLYETHYLENE GLYCOL MARKET, BY APPLICATION, 2021-2030 (TONS)
TABLE 195 OMAN PHARMACEUTICALS IN POLYETHYLENE GLYCOL MARKET, BY CATEGORY, 2021-2030 (USD MILLION)
TABLE 196 OMAN PHARMACEUTICALS IN POLYETHYLENE GLYCOL MARKET, BY CATEGORY, 2021-2030 (TONS)
TABLE 197 OMAN COSMETICS/PERSONAL CARE IN POLYETHYLENE GLYCOL MARKET, BY APPLICATION, 2021-2030 (USD MILLION)
TABLE 198 OMAN COSMETICS/PERSONAL CARE IN POLYETHYLENE GLYCOL MARKET, BY APPLICATION, 2021-2030 (TONS)
TABLE 199 OMAN BUILDING AND CONSTRUCTION IN POLYETHYLENE GLYCOL MARKET, BY APPLICATION, 2021-2030 (USD MILLION)
TABLE 200 OMAN BUILDING AND CONSTRUCTION IN POLYETHYLENE GLYCOL MARKET, BY APPLICATION, 2021-2030 (TONS)
TABLE 201 KUWAIT POLYETHYLENE GLYCOL MARKET, BY GRADE, 2021-2030 (USD MILLION)
TABLE 202 KUWAIT POLYETHYLENE GLYCOL MARKET, BY GRADE, 2021-2030 (TONS)
TABLE 203 KUWAIT POLYETHYLENE GLYCOL MARKET, BY GRADE ASP, 2021-2030 (USD/TON)
TABLE 204 KUWAIT POLYETHYLENE GLYCOL MARKET, BY FORM, 2021-2030 (USD MILLION)
TABLE 205 KUWAIT POLYETHYLENE GLYCOL MARKET, BY FORM, 2021-2030 (TONS)
TABLE 206 KUWAIT POLYETHYLENE GLYCOL MARKET, BY FORM ASP, 2021-2030 (USD/TON)
TABLE 207 KUWAIT POLYETHYLENE GLYCOL MARKET, BY PACKAGING SIZE, 2021-2030 (USD MILLION)
TABLE 208 KUWAIT POLYETHYLENE GLYCOL MARKET, BY PACKAGING SIZE, 2021-2030 (TONS)
TABLE 209 KUWAIT POLYETHYLENE GLYCOL MARKET, BY PACKAGING SIZE ASP, 2021-2030 (USD/ TON)
TABLE 210 KUWAIT POLYETHYLENE GLYCOL MARKET, BY APPLICATION, 2021-2030 (USD MILLION)
TABLE 211 KUWAIT POLYETHYLENE GLYCOL MARKET, BY APPLICATION, 2021-2030 (TONS)
TABLE 212 KUWAIT POLYETHYLENE GLYCOL MARKET, BY APPLICATION ASP, 2021-2030 (USD/TON)
TABLE 213 KUWAIT HEALTHCARE IN POLYETHYLENE GLYCOL MARKET, BY APPLICATION, 2021-2030 (USD MILLION)
TABLE 214 KUWAIT HEALTHCARE IN POLYETHYLENE GLYCOL MARKET, BY APPLICATION, 2021-2030 (TONS)
TABLE 215 KUWAIT PHARMACEUTICALS IN POLYETHYLENE GLYCOL MARKET, BY CATEGORY, 2021-2030 (USD MILLION)
TABLE 216 KUWAIT PHARMACEUTICALS IN POLYETHYLENE GLYCOL MARKET, BY CATEGORY, 2021-2030 (TONS)
TABLE 217 KUWAIT COSMETICS/PERSONAL CARE IN POLYETHYLENE GLYCOL MARKET, BY APPLICATION, 2021-2030 (USD MILLION)
TABLE 218 KUWAIT COSMETICS/PERSONAL CARE IN POLYETHYLENE GLYCOL MARKET, BY APPLICATION, 2021-2030 (TONS)
TABLE 219 KUWAIT BUILDING AND CONSTRUCTION IN POLYETHYLENE GLYCOL MARKET, BY APPLICATION, 2021-2030 (USD MILLION)
TABLE 220 KUWAIT BUILDING AND CONSTRUCTION IN POLYETHYLENE GLYCOL MARKET, BY APPLICATION, 2021-2030 (TONS)
TABLE 221 BAHRAIN POLYETHYLENE GLYCOL MARKET, BY GRADE, 2021-2030 (USD MILLION)
TABLE 222 BAHRAIN POLYETHYLENE GLYCOL MARKET, BY GRADE, 2021-2030 (TONS)
TABLE 223 BAHRAIN POLYETHYLENE GLYCOL MARKET, BY GRADE ASP, 2021-2030 (USD/TON)
TABLE 224 BAHRAIN POLYETHYLENE GLYCOL MARKET, BY FORM, 2021-2030 (USD MILLION)
TABLE 225 BAHRAIN POLYETHYLENE GLYCOL MARKET, BY FORM, 2021-2030 (TONS)
TABLE 226 BAHRAIN POLYETHYLENE GLYCOL MARKET, BY FORM ASP, 2021-2030 (USD/TON)
TABLE 227 BAHRAIN POLYETHYLENE GLYCOL MARKET, BY PACKAGING SIZE, 2021-2030 (USD MILLION)
TABLE 228 BAHRAIN POLYETHYLENE GLYCOL MARKET, BY PACKAGING SIZE, 2021-2030 (TONS)
TABLE 229 BAHRAIN POLYETHYLENE GLYCOL MARKET, BY PACKAGING SIZE ASP, 2021-2030 (USD/ TON)
TABLE 230 BAHRAIN POLYETHYLENE GLYCOL MARKET, BY APPLICATION, 2021-2030 (USD MILLION)
TABLE 231 BAHRAIN POLYETHYLENE GLYCOL MARKET, BY APPLICATION, 2021-2030 (TONS)
TABLE 232 BAHRAIN POLYETHYLENE GLYCOL MARKET, BY APPLICATION ASP, 2021-2030 (USD/TON)
TABLE 233 BAHRAIN HEALTHCARE IN POLYETHYLENE GLYCOL MARKET, BY APPLICATION, 2021-2030 (USD MILLION)
TABLE 234 BAHRAIN HEALTHCARE IN POLYETHYLENE GLYCOL MARKET, BY APPLICATION, 2021-2030 (TONS)
TABLE 235 BAHRAIN PHARMACEUTICALS IN POLYETHYLENE GLYCOL MARKET, BY CATEGORY, 2021-2030 (USD MILLION)
TABLE 236 BAHRAIN PHARMACEUTICALS IN POLYETHYLENE GLYCOL MARKET, BY CATEGORY, 2021-2030 (TONS)
TABLE 237 BAHRAIN COSMETICS/PERSONAL CARE IN POLYETHYLENE GLYCOL MARKET, BY APPLICATION, 2021-2030 (USD MILLION)
TABLE 238 BAHRAIN COSMETICS/PERSONAL CARE IN POLYETHYLENE GLYCOL MARKET, BY APPLICATION, 2021-2030 (TONS)
TABLE 239 BAHRAIN BUILDING AND CONSTRUCTION IN POLYETHYLENE GLYCOL MARKET, BY APPLICATION, 2021-2030 (USD MILLION)
TABLE 240 BAHRAIN BUILDING AND CONSTRUCTION IN POLYETHYLENE GLYCOL MARKET, BY APPLICATION, 2021-2030 (TONS)
TABLE 241 REST OF MIDDLE EAST AND AFRICA POLYETHYLENE GLYCOL MARKET, BY GRADE, 2021-2030 (USD MILLION)
TABLE 242 REST OF MIDDLE EAST AND AFRICA POLYETHYLENE GLYCOL MARKET, BY GRADE, 2021-2030 (TONS)
TABLE 243 REST OF MIDDLE EAST AND AFRICA POLYETHYLENE GLYCOL MARKET, BY GRADE ASP, 2021-2030 (USD/TON)
List of Figure
FIGURE 1 MIDDLE EAST & AFRICA POLYETHYLENE GLYCOL MARKET: SEGMENTATION
FIGURE 2 MIDDLE EAST & AFRICA POLYETHYLENE GLYCOL MARKET: DATA TRIANGULATION
FIGURE 3 MIDDLE EAST & AFRICA POLYETHYLENE GLYCOL MARKET: DROC ANALYSIS
FIGURE 4 MIDDLE EAST & AFRICA POLYETHYLENE GLYCOL MARKET: MIDDLE EAST & AFRICA VS REGIONAL MARKET ANALYSIS
FIGURE 5 MIDDLE EAST & AFRICA POLYETHYLENE GLYCOL MARKET: COMPANY RESEARCH ANALYSIS
FIGURE 6 MIDDLE EAST & AFRICA POLYETHYLENE GLYCOL MARKET: INTERVIEW DEMOGRAPHICS
FIGURE 7 MIDDLE EAST & AFRICA POLYETHYLENE GLYCOL MARKET: DBMR MARKET POSITION GRID
FIGURE 8 MIDDLE EAST & AFRICA POLYETHYLENE GLYCOL MARKET: MARKET APPLICATION COVERAGE GRID
FIGURE 9 MIDDLE EAST & AFRICA POLYETHYLENE GLYCOL MARKET: SEGMENTATION
FIGURE 10 THE GROWTH IN CONSTRUCTION AND BUILDING INDUSTRIES AND RISING DEMAND FOR WATER-BASED PAINTS TO PROVIDE A HIGH QUALITY PROTECTIVE COATING IS DRIVING THE GROWTH OF THE MIDDLE EAST & AFRICA POLYETHYLENE GLYCOL MARKET IN THE FORECAST PERIOD OF 2023 TO 2030
FIGURE 11 PEG 400 SEGMENT IS EXPECTED TO ACCOUNT FOR THE LARGEST SHARE OF THE MIDDLE EAST & AFRICA POLYETHYLENE GLYCOL MARKET IN 2023- 2030
FIGURE 12 IMPORT EXPORT SCENARIO (USD THOUSAND)
FIGURE 13 DRIVERS, RESTRAINTS, OPPORTUNITIES, AND CHALLENGES OF THE MIDDLE EAST & AFRICA POLYETHYLENE GLYCOL MARKET
FIGURE 14 MIDDLE EAST & AFRICA POLYETHYLENE GLYCOL MARKET, BY GRADE, 2022
FIGURE 15 MIDDLE EAST & AFRICA POLYETHYLENE GLYCOL MARKET, BY FORM, 2022
FIGURE 16 MIDDLE EAST & AFRICA POLYETHYLENE GLYCOL MARKET, BY PACKAGING SIZE, 2022
FIGURE 17 MIDDLE EAST & AFRICA POLYETHYLENE GLYCOL MARKET, BY APPLICATION, 2022
FIGURE 18 MIDDLE EAST AND AFRICA POLYETHYLENE GLYCOL MARKET: SNAPSHOT (2022)
FIGURE 19 MIDDLE EAST AND AFRICA POLYETHYLENE GLYCOL MARKET: BY COUNTRY (2022)
FIGURE 20 MIDDLE EAST AND AFRICA POLYETHYLENE GLYCOL MARKET: BY COUNTRY (2023 & 2030)
FIGURE 21 MIDDLE EAST AND AFRICA POLYETHYLENE GLYCOL MARKET: BY COUNTRY (2022 & 2030)
FIGURE 22 MIDDLE EAST AND AFRICA POLYETHYLENE GLYCOL MARKET: BY GRADE (2023-2030)
FIGURE 23 MIDDLE EAST & AFRICA POLYETHYLENE GLYCOL MARKET: COMPANY SHARE 2022 (%)
Middle East And Africa Polyethylene Glycol Market, Supply Chain Analysis and Ecosystem Framework
To support market growth and help clients navigate the impact of geopolitical shifts, DBMR has integrated in-depth supply chain analysis into its Middle East And Africa Polyethylene Glycol Market research reports. This addition empowers clients to respond effectively to global changes affecting their industries. The supply chain analysis section includes detailed insights such as Middle East And Africa Polyethylene Glycol Market consumption and production by country, price trend analysis, the impact of tariffs and geopolitical developments, and import and export trends by country and HSN code. It also highlights major suppliers with data on production capacity and company profiles, as well as key importers and exporters. In addition to research, DBMR offers specialized supply chain consulting services backed by over a decade of experience, providing solutions like supplier discovery, supplier risk assessment, price trend analysis, impact evaluation of inflation and trade route changes, and comprehensive market trend analysis.
Research Methodology
Data collection and base year analysis are done using data collection modules with large sample sizes. The stage includes obtaining market information or related data through various sources and strategies. It includes examining and planning all the data acquired from the past in advance. It likewise envelops the examination of information inconsistencies seen across different information sources. The market data is analysed and estimated using market statistical and coherent models. Also, market share analysis and key trend analysis are the major success factors in the market report. To know more, please request an analyst call or drop down your inquiry.
The key research methodology used by DBMR research team is data triangulation which involves data mining, analysis of the impact of data variables on the market and primary (industry expert) validation. Data models include Vendor Positioning Grid, Market Time Line Analysis, Market Overview and Guide, Company Positioning Grid, Patent Analysis, Pricing Analysis, Company Market Share Analysis, Standards of Measurement, Global versus Regional and Vendor Share Analysis. To know more about the research methodology, drop in an inquiry to speak to our industry experts.
Customization Available
Data Bridge Market Research is a leader in advanced formative research. We take pride in servicing our existing and new customers with data and analysis that match and suits their goal. The report can be customized to include price trend analysis of target brands understanding the market for additional countries (ask for the list of countries), clinical trial results data, literature review, refurbished market and product base analysis. Market analysis of target competitors can be analyzed from technology-based analysis to market portfolio strategies. We can add as many competitors that you require data about in the format and data style you are looking for. Our team of analysts can also provide you data in crude raw excel files pivot tables (Fact book) or can assist you in creating presentations from the data sets available in the report.

