
Market Analysis and Insights: Middle East and Africa Data Center Busway Market
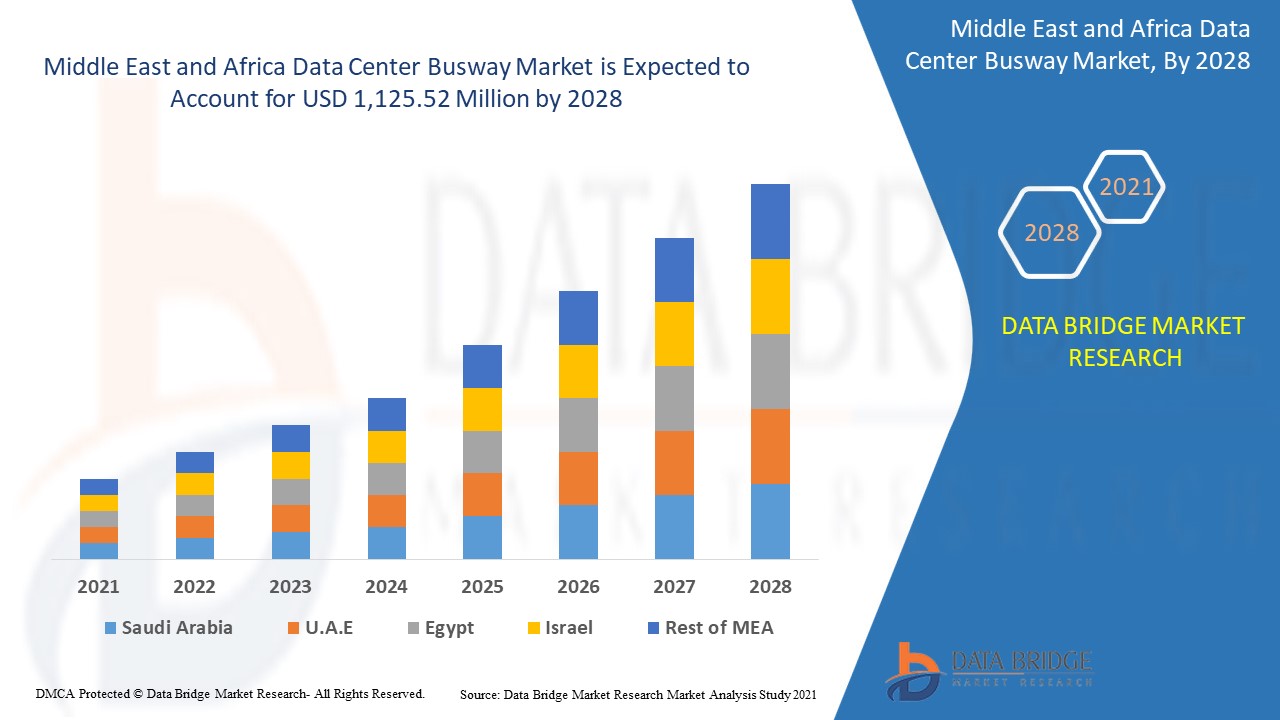
The Middle East and Africa data center busway market is expected to gain market growth in the forecast period of 2021 to 2028. Data Bridge Market Research analyses that the market is growing in the forecast period of 2021 to 2028 and expected to reach USD 1,125.52 million by 2028.
Data center busways are straight length power distribution components used for supplying power to electronic components in mission critical facilities such as data centers, manufacturing units, IT facilities, residential buildings and others. In a power distribution system busways are integrated with intelligent PDUs, monitoring systems, UPS and others. Busways provide advantages over the conventional wire & cable system of power distribution as once installed the cable & wire assemblies are difficult to change. Busways are pre-fabricated or can be customised according to the facility. Copper or aluminium is used as a conductor in the busways. Busways are usually employed where high power transmission is required as they are more efficient, scalable and safe as compared to the wire & cable system. Busways are preferred in the facilities where high power distribution system is required as for high power transmission the cable & wire installation becomes cluttered and takes more space apart from that the maintaining the busways is less costly as compared to the cables & wires.
The major factors driving the growth of the data center busway market are increasing adoption of data centers, adoption of new technologies in data center busway, rising demand for compact power distribution solutions for data center. Rising growth in digitalization is leading to cross-border data center busway products and creating opportunities for the growth of the market. High Installation cost is acting as the major restraint for data center busway market. Alternate power solutions are acting as a major challenge for the growth of the market.
This Middle East and Africa data center busway market report provides details of market share, new developments, and product pipeline analysis, impact of domestic and localised market players, analyses opportunities in terms of emerging revenue pockets, changes in market regulations, product approvals, strategic decisions, product launches, geographical expansions, and technological innovations in the market. To understand the analysis and the market scenario contact us for an Analyst Brief, our team will help you create a revenue impact solution to achieve your desired goal.
Middle East and Africa Data Center Busway Market Scope and Market Size
The Middle East and Africa data center busway market is segmented on the basis of product type, type, implementation, data center type, current ampere, and vertical. The growth among segments helps you analyse niche pockets of growth and strategies to approach the market and determine your core application areas and the difference in your target markets.
- On the basis of product type, the Middle East and Africa data center busway market has been segmented into air splicing busway (BMC), intensive insulation plug busway (CMC), high strength enclosed busway (CFW), power distribution units (PDUs) and others. In 2021, the power distribution units (PDUS) holds the largest share in the market, as it is the easiest way to distribute power to UPS, generators and multiple rack rods which are used at data center. One dual circuit PDUs has a benefit of two separate PDUs which makes it cost effective and space efficient.
- On the basis of type, the Middle East and Africa data center busway market has been segmented into 3-phase 4-wire, 3-phase 5-wire and others. In 2021, 3-phase 4-wire holds the largest share in the market, as the 3 phase wire circuit provides greater power density than other phase wire and the 4 wire systems is cost effective and balances load between the devices.
- On the basis of implementation, the Middle East and Africa data center busway market has been segmented into raised floor and ceiling overhead. In 2021, the ceiling overhead category holds the largest share in the market as is easy to install and also the wires are covered with safety instruments. The repair work for ceiling work is very easy and hassle free.
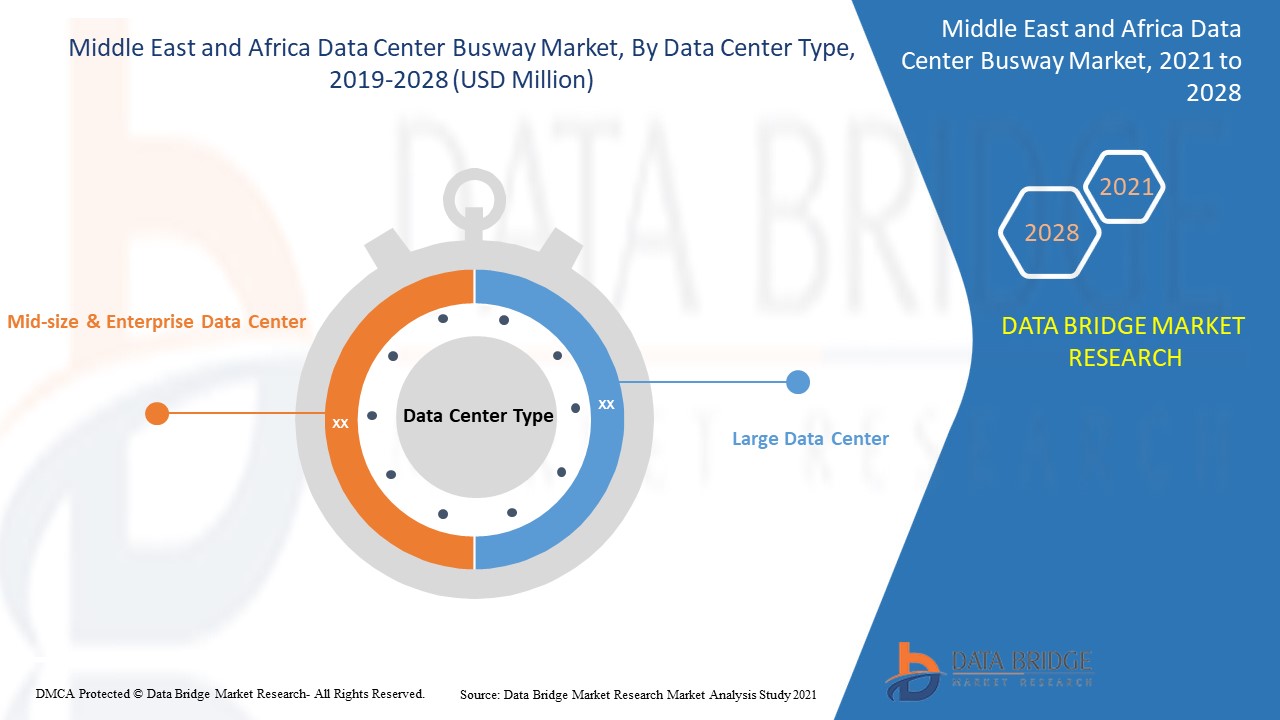
- On the basis of data center type, the Middle East and Africa data center busway market has been segmented into mid-sized & enterprise data center and large data center. In 2021, the large data center held a larger share in the market as the size of data center increases, power distribution units also increases and also increases the computing capacity of the organization. The large amount of investment is done by the large data center for construction and computing.
- On the basis of current ampere, the Middle East and Africa data center busway market has been segmented into low and high. In 2021, low holds the largest share in the market as the power distributions units provided by company are of low voltage which helps in avoiding any mishaps and accidents at data center.
- On the basis of vertical, the Middle East and Africa data center busway market has been segmented into banking, financial services and insurance (BFSI), IT & telecom, government & defense, healthcare, retail & ecommerce, research & academia, energy & utilities, manufacturing and others. In 2021, the IT & telecom holds the largest share in the market as the industry is moving towards AI and deep learning which requires data and computing processes which requires data center. The cloud based systems which is entering in education industry is also growing which requires data center and their busway systems.
Middle East and Africa Data Center Busway Market Country Level Analysis
The Middle East and Africa data center busway market is analysed and market size information is provided by the country, product type, type, implementation, data center type, current ampere, and vertical.
The countries covered in Middle East and Africa data center busway market report are the South Africa, Saudi Arabia, U.A.E., Egypt, Israel, Rest of Middle East and Africa.
The South Africa accounts for maximum share in the Middle East and Africa data center busway market owing to factors such as presence of large number of companies manufacturing data center busways for data center and also the large number of data centers which are present in South Africa requires power distribution units.
The country section of the Middle East and Africa data center busway market report also provides individual market impacting factors and changes in regulation in the market domestically that impacts the current and future trends of the market. Data points such as new sales, replacement sales, country demographics, regulatory acts and import-export analysis are some of the major pointers used to forecast the market scenario for individual countries. Also, presence and availability of global brands and their challenges faced due to large or scarce competition from local and domestic brands, impact of sales channels are considered while providing forecast analysis of the country data.
Increasing Adoption of Contract Manufacturing
The Middle East and Africa data center busway market also provides you with detailed market analysis for every country growth in installed base of different kind of products for Middle East and Africa data center busway market, impact of technology using life line curves and changes in requirement of abrasives products, regulatory scenarios and their impact on the data center busway market. The data is available for historic period 2010 to 2019.
Competitive Landscape and Middle East and Africa Data Center Busway Market Share Analysis
The Middle East and Africa data center busway market competitive landscape provides details by competitor. Details included are company overview, company financials, revenue generated, market potential, investment in research and development, new market initiatives, global presence, production sites and facilities, company strengths and weaknesses, product launch, clinical trials pipelines, brand analysis, product approvals, patents, product width and breadth, application dominance, technology lifeline curve. The above data points provided are only related to the companies’ focus related to Middle East and Africa data center busway market.
Some of the major players operating in the report are EAE Inc., Vass Electrical Industries, Anord Mardix, ABB, Schneider Electric, Eaton, Siemens, Legrand SA, Delta Power Solutions, Megabarre Group, Ltd., TAIAN-ECOBAR TECHNOLOGY, FURUKAWA ELECTRIC CO.LTD., Vertiv Group Corp., Lapp Connecto Oy, and Rittal GmbH & Co. KG among others. DBMR analysts understand competitive strengths and provide competitive analysis for each competitor separately.
For instance,
- In January 2019, Eaton announced its High Density Rack PDU Platform for the Middle East and African market. This product is integrated with bus bars designed to implement more outlets in less space. With this launch, Eaton enhanced the power distribution technology in the market and strengthened market competition.
Partnership, joint ventures and other strategies enhances the company market share with increased coverage and presence. It also provides the benefit for organisation to improve their offering for Middle East and Africa data center busway market through expanded product range.
SKU-
Get online access to the report on the World's First Market Intelligence Cloud

- Interactive Data Analysis Dashboard
- Company Analysis Dashboard for high growth potential opportunities
- Research Analyst Access for customization & queries
- Competitor Analysis with Interactive dashboard
- Latest News, Updates & Trend analysis
- Harness the Power of Benchmark Analysis for Comprehensive Competitor Tracking
Table of Content
1 INTRODUCTION
1.1 OBJECTIVES OF THE STUDY
1.2 MARKET DEFINITION
1.3 OVERVIEW OF MIDDLE EAST AND AFRICA DATA CENTER BUSWAY MARKET
1.4 CURRENCY AND PRICING
1.5 LIMITATIONS
1.6 MARKETS COVERED
2 MARKET SEGMENTATION
2.1 MARKETS COVERED
2.2 GEOGRAPHICAL SCOPE
2.3 YEARS CONSIDERED FOR THE STUDY
2.4 DBMR TRIPOD DATA VALIDATION MODEL
2.5 PRIMARY INTERVIEWS WITH KEY OPINION LEADERS
2.6 DBMR MARKET POSITION GRID
2.7 VENDOR SHARE ANALYSIS
2.8 MULTIVARIATE MODELING
2.9 PRODUCT TYPE TIMELINE CURVE
2.1 MARKET VERTICAL COVERAGE GRID
2.11 SECONDARY SOURCES
2.12 ASSUMPTIONS
3 EXECUTIVE SUMMARY
4 PREMIUM INSIGHTS
5 CASE STUDY
5.1 CASE STUDY 1- EXPANSION OF FUJITSU’S NORTH LONDON DATA CENTER FACILITY
5.2 CASE STUDY 2- NORTH CAROLINA BASED GIGA DATA CENTRE SERVICE PROVIDER CHOOSE ABB’S POWER DISTRIBUTION SOLUTIONS FOR ITS NEW DATA CENTRE
5.3 CASE STUDY 3- EATON’S BUSWAY ENABLES SMOOTH OPERATIONS AND NEW LEVELS OF DATA CENTER FLEXIBILITY
6 MARKET OVERVIEW
6.1 DRIVERS
6.1.1 HIGH BENEFITS OFFERED BY BUSWAY SYSTEMS ACTING AS AN ALTERNATIVE TO TRADITIONAL CABLE SYSTEM
6.1.2 HIGH POWER CONSUMPTION REQUIREMENT BY DATA CENTERS
6.1.3 RISING DEMANDS FOR COMPACT POWER DISTRIBUTION SYSTEMS
6.1.4 SURGING DEMAND FOR DATA CENTERS
6.1.5 EASE OF MONITORING THE POWER DISTRIBUTION SYSTEMS
6.2 RESTRAINTS
6.2.1 HIGH INSTALLATION COSTS
6.2.2 AVAILABILITY OF CHEAPER ALTERNATIVE POWER DISTRIBUTION SYSTEMS
6.3 OPPORTUNITIES
6.3.1 GROWING EMPHASIS ON DIGITALIZATION AND CLOUD COMPUTING
6.3.2 INCREASING INVESTMENTS IN THE DEVELOPMENT OF IT INFRASTRUCTURE
6.3.3 RAPID EMERGENCE OF ADVANCED TECHNOLOGIES
6.3.4 RISE IN BIG DATA GENERATION
6.4 CHALLENGES
6.4.1 LACK OF SKILLED LABOR FOR INSTALLATION OF BUSWAY SYSTEMS
6.4.2 HIGH COMPLEXITY OF DATA CENTER DESIGNS
7 IMPACT OF COVID-19 ON MIDDLE EAST AND AFRICA DATA CENTER BUSWAY MARKET
7.1 ANALYSIS ON IMPACT OF COVID-19 ON THE MARKET
7.2 AFTERMATH OF COVID-19 AND GOVERNMENT INITIATIVE TO BOOST THE MARKET
7.3 STRATEGIC DECISIONS FOR MANUFACTURERS AFTER COVID-19 TO GAIN COMPETITIVE MARKET SHARE
7.4 IMPACT ON DEMAND
7.5 IMPACT ON SUPPLY CHAIN
7.6 IMPACT ON PRICE
7.7 CONCLUSION
8 MIDDLE EAST AND AFRICA DATA CENTER BUSWAY MARKET, BY PRODUCT TYPE
8.1 OVERVIEW
8.2 POWER DISTRIBUTION UNITS (PDUS)
8.3 HIGH STRENGTH ENCLOSED BUSWAY (CFW)
8.4 INTENSIVE INSULATION PLUG BUSWAY (CMC)
8.5 AIR SPLICING BUSWAY (BMC)
8.6 OTHERS
9 MIDDLE EAST AND AFRICA DATA CENTER BUSWAY MARKET, BY TYPE
9.1 OVERVIEW
9.2 3-PHASE 4-WIRE
9.2.1 CEILING OVERHEAD
9.2.2 RAISED FLOOR
9.3 3-PHASE 5-WIRE
9.3.1 CEILING OVERHEAD
9.3.2 RAISED FLOOR
9.4 OTHERS
10 MIDDLE EAST AND AFRICA DATA CENTER BUSWAY MARKET, BY IMPLEMENTATION
10.1 OVERVIEW
10.2 CEILING OVERHEAD
10.3 RAISED FLOOR
11 MIDDLE EAST AND AFRICA DATA CENTER BUSWAY MARKET, BY DATA CENTER TYPE
11.1 OVERVIEW
11.2 LARGE DATA CENTER
11.2.1 CEILING OVERHEAD
11.2.2 RAISED FLOOR
11.3 MID-SIZE & ENTERPRISE DATA CENTER
11.3.1 CEILING OVERHEAD
11.3.2 RAISED FLOOR
12 MIDDLE EAST AND AFRICA DATA CENTER BUSWAY MARKET, BY CURRENT AMPERE
12.1 OVERVIEW
12.2 LOW
12.3 HIGH
13 MIDDLE EAST AND AFRICA DATA CENTER BUSWAY MARKET, BY VERTICAL
13.1 OVERVIEW
13.2 IT & TELECOM
13.3 BANKING, FINANCIAL SERVICES AND INSURANCE (BFSI)
13.4 GOVERNMENT & DEFENSE
13.5 MANUFACTURING
13.6 RETAIL & ECOMMERCE
13.7 ENERGY & UTILITIES
13.8 HEALTHCARE
13.9 RESEARCH & ACADEMIA
13.1 OTHERS
14 MIDDLE EAST AND AFRICA DATA CENTER BUSWAY MARKET, BY REGION
14.1 MIDDLE EAST AND AFRICA
14.1.1 SOUTH AFRICA
14.1.2 SAUDI ARABIA
14.1.3 U.A.E.
14.1.4 EGYPT
14.1.5 ISRAEL
14.1.6 REST OF MIDDLE EAST AND AFRICA
15 MIDDLE EAST AND AFRICA DATA CENTER BUSWAY MARKET: COMPANY LANDSCAPE
15.1 COMPANY SHARE ANALYSIS: MIDDLE EAST AND AFRICA
16 SWOT ANALYSIS
17 COMPANY PROFILE
17.1 ABB
17.1.1 COMPANY SNAPSHOT
17.1.2 REVENUE ANALYSIS
17.1.3 COMPANY SHARE ANALYSIS
17.1.4 PRODUCT PORTFOLIO
17.1.5 RECENT DEVELOPMENTS
17.2 SCHNEIDER ELECTRIC
17.2.1 COMPANY SNAPSHOT
17.2.2 REVENUE ANALYSIS
17.2.3 COMPANY SHARE ANALYSIS
17.2.4 PRODUCT PORTFOLIO
17.2.5 RECENT DEVELOPMENTS
17.3 SIEMENS
17.3.1 COMPANY SNAPSHOT
17.3.2 REVENUE ANALYSIS
17.3.3 COMPANY SHARE ANALYSIS
17.3.4 PRODUCT PORTFOLIO
17.3.5 RECENT DEVELOPMENTS
17.4 EATON
17.4.1 COMPANY SNAPSHOT
17.4.2 REVENUE ANALYSIS
17.4.3 COMPANY SHARE ANALYSIS
17.4.4 PRODUCT PORTFOLIO
17.4.5 RECENT DEVELOPMENTS
17.5 LEGRAND SA
17.5.1 COMPANY SNAPSHOT
17.5.2 REVENUE ANALYSIS
17.5.3 COMPANY SHARE ANALYSIS
17.5.4 PRODUCT PORTFOLIO
17.5.5 RECENT DEVELOPMENTS
17.6 VERTIV GROUP CORP.
17.6.1 COMPANY SNAPSHOT
17.6.2 REVENUE ANALYSIS
17.6.3 PRODUCT PORTFOLIO
17.6.4 RECENT DEVELOPMENTS
17.7 DELTA POWER SOLUTIONS
17.7.1 COMPANY SNAPSHOT
17.7.2 PRODUCT PORTFOLIO
17.7.3 RECENT DEVELOPMENTS
17.8 ANORD MARDIX
17.8.1 COMPANY SNAPSHOT
17.8.2 PRODUCT PORTFOLIO
17.8.3 RECENT DEVELOPMENTS
17.9 DINGSHENG GROUP
17.9.1 COMPANY SNAPSHOT
17.9.2 PRODUCT PORTFOLIO
17.9.3 RECENT DEVELOPMENT
17.1 EAE INC.
17.10.1 COMPANY SNAPSHOT
17.10.2 PRODUCT PORTFOLIO
17.10.3 RECENT DEVELOPMENTS
17.11 FURUKAWA ELECTRIC CO., LTD.
17.11.1 COMPANY SNAPSHOT
17.11.2 REVENUE ANALYSIS
17.11.3 PRODUCT PORTFOLIO
17.11.4 RECENT DEVELOPMENT
17.12 FURUTEC ELECTRICAL SDN BHD
17.12.1 COMPANY SNAPSHOT
17.12.2 PRODUCT PORTFOLIO
17.12.3 RECENT DEVELOPMENT
17.13 LAPP CONNECTO OY
17.13.1 COMPANY SNAPSHOT
17.13.2 PRODUCT PORTFOLIO
17.13.3 RECENT DEVELOPMENTS
17.14 MEGABARRE GROUP, LTD.
17.14.1 COMPANY SNAPSHOT
17.14.2 PRODUCT PORTFOLIO
17.14.3 RECENT DEVELOPMENTS
17.15 POWER PLUG BUSDUCT SDN. BHD.
17.15.1 COMPANY SNAPSHOT
17.15.2 PRODUCT PORTFOLIO
17.15.3 RECENT DEVELOPMENT
17.16 RITTAL GMBH & CO. KG
17.16.1 COMPANY SNAPSHOT
17.16.2 PRODUCT PORTFOLIO
17.16.3 RECENT DEVELOPMENT
17.17 TAIAN-ECOBAR TECHNOLOGY
17.17.1 COMPANY SNAPSHOT
17.17.2 PRODUCT PORTFOLIO
17.17.3 RECENT DEVELOPMENTS
17.18 TAI SIN ELECTRIC LIMITED
17.18.1 COMPANY SNAPSHOT
17.18.2 REVENUE ANALYSIS
17.18.3 PRODUCT PORTFOLIO
17.18.4 RECENT DEVELOPMENT
17.19 VASS ELECTRICAL INDISTRIES
17.19.1 COMPANY SNAPSHOT
17.19.2 PRODUCT PORTFOLIO
17.19.3 RECENT DEVELOPMENT
17.2 WETOWN
17.20.1 COMPANY SNAPSHOT
17.20.2 PRODUCT PORTFOLIO
17.20.3 RECENT DEVELOPMENT
18 QUESTIONNAIRE
19 RELATED REPORTS
List of Table
TABLE 1 MIDDLE EAST AND AFRICA DATA CENTER BUSWAY MARKET, BY PRODUCT TYPE, 2019-2028 (USD MILLION)
TABLE 2 MIDDLE EAST AND AFRICA POWER DISTRIBUTION UNITS (PDUS) IN DATA CENTER BUSWAY MARKET, BY REGION, 2019-2028 (USD MILLION)
TABLE 3 MIDDLE EAST AND AFRICA HIGH STRENGTH ENCLOSED BUSWAY (CFW) IN DATA CENTER BUSWAY MARKET, BY REGION, 2019-2028 (USD MILLION)
TABLE 4 MIDDLE EAST AND AFRICA INTENSIVE INSULATION PLUG BUSWAY (CMC) IN DATA CENTER BUSWAY MARKET, BY REGION, 2019-2028 (USD MILLION)
TABLE 5 MIDDLE EAST AND AFRICA AIR SPLICING BUSWAY (BMC) IN DATA CENTER BUSWAY MARKET, BY REGION, 2019-2028 (USD MILLION)
TABLE 6 MIDDLE EAST AND AFRICA OTHERS IN DATA CENTER BUSWAY MARKET, BY REGION, 2019-2028 (USD MILLION)
TABLE 7 MIDDLE EAST AND AFRICA DATA CENTER BUSWAY MARKET, BY TYPE, 2019-2028 (USD MILLION)
TABLE 8 MIDDLE EAST AND AFRICA 3-PHASE 4-WIRE IN DATA CENTER BUSWAY MARKET, BY REGION, 2019-2028 (USD MILLION)
TABLE 9 MIDDLE EAST AND AFRICA 3-PHASE 4-WIRE IN DATA CENTER BUSWAY MARKET, BY IMPLEMENTATION, 2019-2028 (USD MILLION)
TABLE 10 MIDDLE EAST AND AFRICA 3-PHASE 5-WIRE IN DATA CENTER BUSWAY MARKET, BY REGION, 2019-2028 (USD MILLION)
TABLE 11 MIDDLE EAST AND AFRICA 3-PHASE 5-WIRE IN DATA CENTER BUSWAY MARKET, BY IMPLEMENTATION, 2019-2028 (USD MILLION)
TABLE 12 MIDDLE EAST AND AFRICA OTHERS IN DATA CENTER BUSWAY MARKET, BY REGION, 2019-2028 (USD MILLION)
TABLE 13 MIDDLE EAST AND AFRICA DATA CENTER BUSWAY MARKET, BY IMPLEMENTATION, 2019-2028 (USD MILLION)
TABLE 14 MIDDLE EAST AND AFRICA CEILING OVERHEAD IN DATA CENTER BUSWAY MARKET, BY REGION, 2019-2028 (USD MILLION)
TABLE 15 MIDDLE EAST AND AFRICA RAISED FLOOR IN DATA CENTER BUSWAY MARKET, BY REGION, 2019-2028 (USD MILLION)
TABLE 16 MIDDLE EAST AND AFRICA DATA CENTER BUSWAY MARKET, BY DATA CENTER TYPE, 2019-2028 (USD MILLION)
TABLE 17 MIDDLE EAST AND AFRICA LARGE DATA CENTER IN DATA CENTER BUSWAY MARKET, BY REGION, 2019-2028 (USD MILLION)
TABLE 18 MIDDLE EAST AND AFRICA LARGE DATA CENTER IN DATA CENTER BUSWAY MARKET, BY IMPLEMENTATION, 2019-2028 (USD MILLION)
TABLE 19 MIDDLE EAST AND AFRICA MID-SIZE & ENTERPRISE DATA CENTER IN DATA CENTER BUSWAY MARKET, BY REGION, 2019-2028 (USD MILLION)
TABLE 20 MIDDLE EAST AND AFRICA MID-SIZE & ENTERPRISE DATA CENTER IN DATA CENTER BUSWAY MARKET, BY IMPLEMENTATION, 2019-2028 (USD MILLION)
TABLE 21 MIDDLE EAST AND AFRICA DATA CENTER BUSWAY MARKET, BY CURRENT AMPERE, 2019-2028 (USD MILLION)
TABLE 22 MIDDLE EAST AND AFRICA LOW IN DATA CENTER BUSWAY MARKET, BY REGION, 2019-2028 (USD MILLION)
TABLE 23 MIDDLE EAST AND AFRICA HIGH IN DATA CENTER BUSWAY MARKET, BY REGION, 2019-2028 (USD MILLION)
TABLE 24 MIDDLE EAST AND AFRICA DATA CENTER BUSWAY MARKET, BY VERTICAL, 2019-2028 (USD MILLION)
TABLE 25 MIDDLE EAST AND AFRICA IT & TELECOM IN DATA CENTER BUSWAY MARKET, BY REGION, 2019-2028 (USD MILLION)
TABLE 26 MIDDLE EAST AND AFRICA BANKING, FINANCIAL SERVICES AND INSURANCE (BFSI) IN DATA CENTER BUSWAY MARKET, BY REGION, 2019-2028 (USD MILLION)
TABLE 27 MIDDLE EAST AND AFRICA GOVERNMENT & DEFENSE IN DATA CENTER BUSWAY MARKET, BY REGION, 2019-2028 (USD MILLION)
TABLE 28 MIDDLE EAST AND AFRICA MANUFACTURING IN DATA CENTER BUSWAY MARKET, BY REGION, 2019-2028 (USD MILLION)
TABLE 29 MIDDLE EAST AND AFRICA RETAIL & ECOMMERCE IN DATA CENTER BUSWAY MARKET, BY REGION, 2019-2028 (USD MILLION)
TABLE 30 MIDDLE EAST AND AFRICA ENERGY & UTILITIES IN DATA CENTER BUSWAY MARKET, BY REGION, 2019-2028 (USD MILLION)
TABLE 31 MIDDLE EAST AND AFRICA HEALTHCARE IN DATA CENTER BUSWAY MARKET, BY REGION, 2019-2028 (USD MILLION)
TABLE 32 MIDDLE EAST AND AFRICA RESEARCH & ACADEMIA IN DATA CENTER BUSWAY MARKET, BY REGION, 2019-2028 (USD MILLION)
TABLE 33 MIDDLE EAST AND AFRICA OTHERS IN DATA CENTER BUSWAY MARKET, BY REGION, 2019-2028 (USD MILLION)
TABLE 34 MIDDLE EAST AND AFRICA DATA CENTER BUSWAY MARKET, BY COUNTRY, 2019-2028 (USD MILLION)
TABLE 35 MIDDLE EAST AND AFRICA DATA CENTER BUSWAY MARKET, BY PRODUCT TYPE, 2019-2028 (USD MILLION)
TABLE 36 MIDDLE EAST AND AFRICA DATA CENTER BUSWAY MARKET, BY TYPE, 2019-2028 (USD MILLION)
TABLE 37 MIDDLE EAST AND AFRICA 3-PHASE 4-WIRE IN DATA CENTER BUSWAY MARKET, BY IMPLEMENTATION, 2019-2028 (USD MILLION)
TABLE 38 MIDDLE EAST AND AFRICA 3-PHASE 5-WIRE IN DATA CENTER BUSWAY MARKET, BY IMPLEMENTATION, 2019-2028 (USD MILLION)
TABLE 39 MIDDLE EAST AND AFRICA DATA CENTER BUSWAY MARKET, BY IMPLEMENTATION, 2019-2028 (USD MILLION)
TABLE 40 MIDDLE EAST AND AFRICA DATA CENTER BUSWAY MARKET, BY DATA CENTER TYPE, 2019-2028 (USD MILLION)
TABLE 41 MIDDLE EAST AND AFRICA LARGE DATA CENTER IN DATA CENTER BUSWAY MARKET, BY IMPLEMENTATION, 2019-2028 (USD MILLION)
TABLE 42 MIDDLE EAST AND AFRICA MID-SIZE & ENTERPRISE DATA CENTER IN DATA CENTER BUSWAY MARKET, BY IMPLEMENTATION, 2019-2028 (USD MILLION)
TABLE 43 MIDDLE EAST AND AFRICA DATA CENTER BUSWAY MARKET, BY CURRENT AMPERE, 2019-2028 (USD MILLION)
TABLE 44 MIDDLE EAST AND AFRICA DATA CENTER BUSWAY MARKET, BY VERTICAL, 2019-2028 (USD MILLION)
TABLE 45 SOUTH AFRICA DATA CENTER BUSWAY MARKET, BY PRODUCT TYPE, 2019-2028 (USD MILLION)
TABLE 46 SOUTH AFRICA DATA CENTER BUSWAY MARKET, BY TYPE, 2019-2028 (USD MILLION)
TABLE 47 SOUTH AFRICA 3-PHASE 4-WIRE IN DATA CENTER BUSWAY MARKET, BY IMPLEMENTATION, 2019-2028 (USD MILLION)
TABLE 48 SOUTH AFRICA 3-PHASE 5-WIRE IN DATA CENTER BUSWAY MARKET, BY IMPLEMENTATION, 2019-2028 (USD MILLION)
TABLE 49 SOUTH AFRICA DATA CENTER BUSWAY MARKET, BY IMPLEMENTATION, 2019-2028 (USD MILLION)
TABLE 50 SOUTH AFRICA DATA CENTER BUSWAY MARKET, BY DATA CENTER TYPE, 2019-2028 (USD MILLION)
TABLE 51 SOUTH AFRICA LARGE DATA CENTER IN DATA CENTER BUSWAY MARKET, BY IMPLEMENTATION, 2019-2028 (USD MILLION)
TABLE 52 SOUTH AFRICA MID-SIZE & ENTERPRISE DATA CENTER IN DATA CENTER BUSWAY MARKET, BY IMPLEMENTATION, 2019-2028 (USD MILLION)
TABLE 53 SOUTH AFRICA DATA CENTER BUSWAY MARKET, BY CURRENT AMPERE, 2019-2028 (USD MILLION)
TABLE 54 SOUTH AFRICA DATA CENTER BUSWAY MARKET, BY VERTICAL, 2019-2028 (USD MILLION)
TABLE 55 SAUDI ARABIA DATA CENTER BUSWAY MARKET, BY PRODUCT TYPE, 2019-2028 (USD MILLION)
TABLE 56 SAUDI ARABIA DATA CENTER BUSWAY MARKET, BY TYPE, 2019-2028 (USD MILLION)
TABLE 57 SAUDI ARABIA 3-PHASE 4-WIRE IN DATA CENTER BUSWAY MARKET, BY IMPLEMENTATION, 2019-2028 (USD MILLION)
TABLE 58 SAUDI ARABIA 3-PHASE 5-WIRE IN DATA CENTER BUSWAY MARKET, BY IMPLEMENTATION, 2019-2028 (USD MILLION)
TABLE 59 SAUDI ARABIA DATA CENTER BUSWAY MARKET, BY IMPLEMENTATION, 2019-2028 (USD MILLION)
TABLE 60 SAUDI ARABIA DATA CENTER BUSWAY MARKET, BY DATA CENTER TYPE, 2019-2028 (USD MILLION)
TABLE 61 SAUDI ARABIA LARGE DATA CENTER IN DATA CENTER BUSWAY MARKET, BY IMPLEMENTATION, 2019-2028 (USD MILLION)
TABLE 62 SAUDI ARABIA MID-SIZE & ENTERPRISE DATA CENTER IN DATA CENTER BUSWAY MARKET, BY IMPLEMENTATION, 2019-2028 (USD MILLION)
TABLE 63 SAUDI ARABIA DATA CENTER BUSWAY MARKET, BY CURRENT AMPERE, 2019-2028 (USD MILLION)
TABLE 64 SAUDI ARABIA DATA CENTER BUSWAY MARKET, BY VERTICAL, 2019-2028 (USD MILLION)
TABLE 65 U.A.E. DATA CENTER BUSWAY MARKET, BY PRODUCT TYPE, 2019-2028 (USD MILLION)
TABLE 66 U.A.E. DATA CENTER BUSWAY MARKET, BY TYPE, 2019-2028 (USD MILLION)
TABLE 67 U.A.E. 3-PHASE 4-WIRE IN DATA CENTER BUSWAY MARKET, BY IMPLEMENTATION, 2019-2028 (USD MILLION)
TABLE 68 U.A.E. 3-PHASE 5-WIRE IN DATA CENTER BUSWAY MARKET, BY IMPLEMENTATION, 2019-2028 (USD MILLION)
TABLE 69 U.A.E. DATA CENTER BUSWAY MARKET, BY IMPLEMENTATION, 2019-2028 (USD MILLION)
TABLE 70 U.A.E. DATA CENTER BUSWAY MARKET, BY DATA CENTER TYPE, 2019-2028 (USD MILLION)
TABLE 71 U.A.E. LARGE DATA CENTER IN DATA CENTER BUSWAY MARKET, BY IMPLEMENTATION, 2019-2028 (USD MILLION)
TABLE 72 U.A.E. MID-SIZE & ENTERPRISE DATA CENTER IN DATA CENTER BUSWAY MARKET, BY IMPLEMENTATION, 2019-2028 (USD MILLION)
TABLE 73 U.A.E. DATA CENTER BUSWAY MARKET, BY CURRENT AMPERE, 2019-2028 (USD MILLION)
TABLE 74 U.A.E. DATA CENTER BUSWAY MARKET, BY VERTICAL, 2019-2028 (USD MILLION)
TABLE 75 EGYPT DATA CENTER BUSWAY MARKET, BY PRODUCT TYPE, 2019-2028 (USD MILLION)
TABLE 76 EGYPT DATA CENTER BUSWAY MARKET, BY TYPE, 2019-2028 (USD MILLION)
TABLE 77 EGYPT 3-PHASE 4-WIRE IN DATA CENTER BUSWAY MARKET, BY IMPLEMENTATION, 2019-2028 (USD MILLION)
TABLE 78 EGYPT 3-PHASE 5-WIRE IN DATA CENTER BUSWAY MARKET, BY IMPLEMENTATION, 2019-2028 (USD MILLION)
TABLE 79 EGYPT DATA CENTER BUSWAY MARKET, BY IMPLEMENTATION, 2019-2028 (USD MILLION)
TABLE 80 EGYPT DATA CENTER BUSWAY MARKET, BY DATA CENTER TYPE, 2019-2028 (USD MILLION)
TABLE 81 EGYPT LARGE DATA CENTER IN DATA CENTER BUSWAY MARKET, BY IMPLEMENTATION, 2019-2028 (USD MILLION)
TABLE 82 EGYPT MID-SIZE & ENTERPRISE DATA CENTER IN DATA CENTER BUSWAY MARKET, BY IMPLEMENTATION, 2019-2028 (USD MILLION)
TABLE 83 EGYPT DATA CENTER BUSWAY MARKET, BY CURRENT AMPERE, 2019-2028 (USD MILLION)
TABLE 84 EGYPT DATA CENTER BUSWAY MARKET, BY VERTICAL, 2019-2028 (USD MILLION)
TABLE 85 ISRAEL DATA CENTER BUSWAY MARKET, BY PRODUCT TYPE, 2019-2028 (USD MILLION)
TABLE 86 ISRAEL DATA CENTER BUSWAY MARKET, BY TYPE, 2019-2028 (USD MILLION)
TABLE 87 ISRAEL 3-PHASE 4-WIRE IN DATA CENTER BUSWAY MARKET, BY IMPLEMENTATION, 2019-2028 (USD MILLION)
TABLE 88 ISRAEL 3-PHASE 5-WIRE IN DATA CENTER BUSWAY MARKET, BY IMPLEMENTATION, 2019-2028 (USD MILLION)
TABLE 89 ISRAEL DATA CENTER BUSWAY MARKET, BY IMPLEMENTATION, 2019-2028 (USD MILLION)
TABLE 90 ISRAEL DATA CENTER BUSWAY MARKET, BY DATA CENTER TYPE, 2019-2028 (USD MILLION)
TABLE 91 ISRAEL LARGE DATA CENTER IN DATA CENTER BUSWAY MARKET, BY IMPLEMENTATION, 2019-2028 (USD MILLION)
TABLE 92 ISRAEL MID-SIZE & ENTERPRISE DATA CENTER IN DATA CENTER BUSWAY MARKET, BY IMPLEMENTATION, 2019-2028 (USD MILLION)
TABLE 93 ISRAEL DATA CENTER BUSWAY MARKET, BY CURRENT AMPERE, 2019-2028 (USD MILLION)
TABLE 94 ISRAEL DATA CENTER BUSWAY MARKET, BY VERTICAL, 2019-2028 (USD MILLION)
TABLE 95 REST OF MIDDLE EAST AND AFRICA DATA CENTER BUSWAY MARKET, BY PRODUCT TYPE, 2019-2028 (USD MILLION)
List of Figure
FIGURE 1 MIDDLE EAST AND AFRICA DATA CENTER BUSWAY MARKET: SEGMENTATION
FIGURE 2 MIDDLE EAST AND AFRICA DATA CENTER BUSWAY MARKET: DATA TRIANGULATION
FIGURE 3 MIDDLE EAST AND AFRICA DATA CENTER BUSWAY MARKET: DROC ANALYSIS
FIGURE 4 MIDDLE EAST AND AFRICA DATA CENTER BUSWAY MARKET: MIDDLE EAST AND AFRICA VS REGIONAL MARKET ANALYSIS
FIGURE 5 MIDDLE EAST AND AFRICA DATA CENTER BUSWAY MARKET: COMPANY RESEARCH ANALYSIS
FIGURE 6 MIDDLE EAST AND AFRICA DATA CENTER BUSWAY MARKET: INTERVIEW DEMOGRAPHICS
FIGURE 7 MIDDLE EAST AND AFRICA DATA CENTER BUSWAY MARKET: DBMR MARKET POSITION GRID
FIGURE 8 MIDDLE EAST AND AFRICA DATA CENTER BUSWAY MARKET: VENDOR SHARE ANALYSIS
FIGURE 9 MIDDLE EAST AND AFRICA DATA CENTER BUSWAY MARKET: MARKET VERTICAL COVERAGE GRID
FIGURE 10 MIDDLE EAST AND AFRICA DATA CENTER BUSWAY MARKET: SEGMENTATION
FIGURE 11 RISING DEMAND FOR COMPACT POWER DISTRIBUTION SYSTEMS IS EXPECTED TO DRIVE MIDDLE EAST AND AFRICA DATA CENTER BUSWAY MARKET IN THE FORECAST PERIOD OF 2021 TO 2028
FIGURE 12 POWER DISTRIBUTION UNITS (PDUS) SEGMENT IS EXPECTED TO ACCOUNT FOR THE LARGEST SHARE OF MIDDLE EAST AND AFRICA DATA CENTER BUSWAY MARKET IN 2021 & 2028
FIGURE 13 DRIVERS, RESTRAINTS, OPPORTUNITIES AND CHALLENGES OF MIDDLE EAST AND AFRICA DATA CENTER BUSWAY MARKET
FIGURE 14 MIDDLE EAST AND AFRICA DATA CENTER BUSWAY MARKET: BY PRODUCT TYPE, 2020
FIGURE 15 MIDDLE EAST AND AFRICA DATA CENTER BUSWAY MARKET: BY TYPE, 2020
FIGURE 16 MIDDLE EAST AND AFRICA DATA CENTER BUSWAY MARKET: BY IMPLEMENTATION, 2020
FIGURE 17 MIDDLE EAST AND AFRICA DATA CENTER BUSWAY MARKET: BY DATA CENTER TYPE, 2020
FIGURE 18 MIDDLE EAST AND AFRICA DATA CENTER BUSWAY MARKET: BY CURRENT AMPERE, 2020
FIGURE 19 MIDDLE EAST AND AFRICA DATA CENTER BUSWAY MARKET: BY VERTICAL, 2020
FIGURE 20 MIDDLE EAST AND AFRICA DATA CENTER BUSWAY MARKET: SNAPSHOT (2020)
FIGURE 21 MIDDLE EAST AND AFRICA DATA CENTER BUSWAY MARKET: BY COUNTRY (2020)
FIGURE 22 MIDDLE EAST AND AFRICA DATA CENTER BUSWAY MARKET: BY COUNTRY (2021 & 2028)
FIGURE 23 MIDDLE EAST AND AFRICA DATA CENTER BUSWAY MARKET: BY COUNTRY (2020 & 2028)
FIGURE 24 MIDDLE EAST AND AFRICA DATA CENTER BUSWAY MARKET: BY PRODUCT TYPE (2021-2028)
FIGURE 25 MIDDLE EAST AND AFRICA DATA CENTER BUSWAY MARKET: COMPANY SHARE 2020 (%)
Research Methodology
Data collection and base year analysis are done using data collection modules with large sample sizes. The stage includes obtaining market information or related data through various sources and strategies. It includes examining and planning all the data acquired from the past in advance. It likewise envelops the examination of information inconsistencies seen across different information sources. The market data is analysed and estimated using market statistical and coherent models. Also, market share analysis and key trend analysis are the major success factors in the market report. To know more, please request an analyst call or drop down your inquiry.
The key research methodology used by DBMR research team is data triangulation which involves data mining, analysis of the impact of data variables on the market and primary (industry expert) validation. Data models include Vendor Positioning Grid, Market Time Line Analysis, Market Overview and Guide, Company Positioning Grid, Patent Analysis, Pricing Analysis, Company Market Share Analysis, Standards of Measurement, Global versus Regional and Vendor Share Analysis. To know more about the research methodology, drop in an inquiry to speak to our industry experts.
Customization Available
Data Bridge Market Research is a leader in advanced formative research. We take pride in servicing our existing and new customers with data and analysis that match and suits their goal. The report can be customized to include price trend analysis of target brands understanding the market for additional countries (ask for the list of countries), clinical trial results data, literature review, refurbished market and product base analysis. Market analysis of target competitors can be analyzed from technology-based analysis to market portfolio strategies. We can add as many competitors that you require data about in the format and data style you are looking for. Our team of analysts can also provide you data in crude raw excel files pivot tables (Fact book) or can assist you in creating presentations from the data sets available in the report.

