Middle East And Africa Car T Cell Therapy Treatment Market
Market Size in USD Million
CAGR :
% 
 USD
16.22 Million
USD
138.11 Million
2024
2032
USD
16.22 Million
USD
138.11 Million
2024
2032
| 2025 –2032 | |
| USD 16.22 Million | |
| USD 138.11 Million | |
| % | |
|
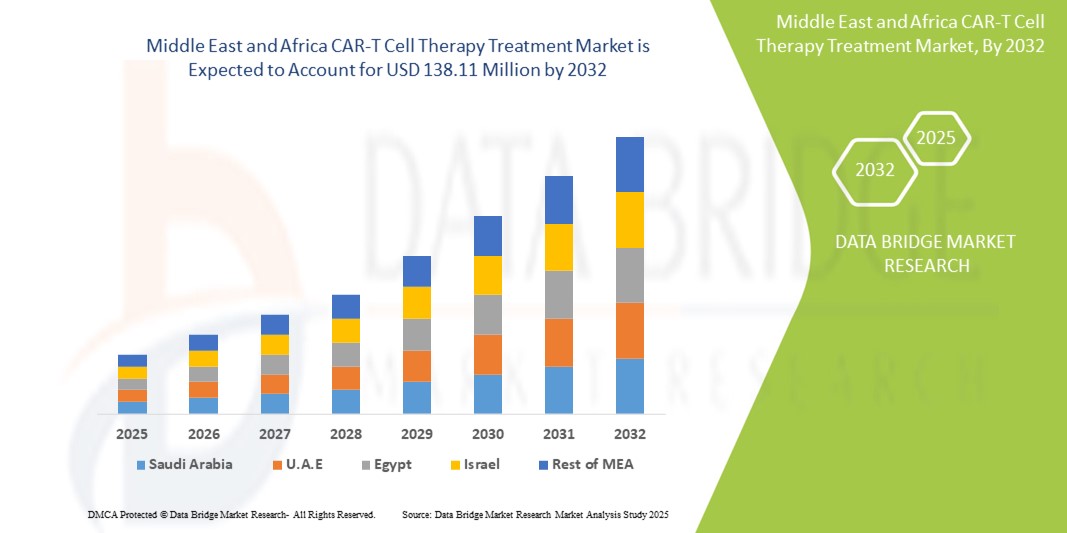
MEA CAR-T Cell Therapy Treatment Market Size
- The MEA CAR-T cell therapy treatment market size was valued at USD 16.22 million in 2024 and is expected to reach USD 138.11 million by 2032, at a CAGR of 30.7% during the forecast period
- The market growth is largely fueled by the increasing prevalence of hematologic malignancies and the progressive expansion of advanced cell and gene therapy infrastructure across the Middle East and Africa (MEA) region. Improved regulatory frameworks, growing investment in biotechnology, and the establishment of CAR-T research and manufacturing centers are accelerating the clinical development and availability of CAR-T cell therapies
- Furthermore, rising patient demand for targeted, personalized, and highly effective treatment options is positioning CAR-T cell therapy as a breakthrough approach in cancer care. These converging factors are accelerating the uptake of MEA CAR-T Cell Therapy Treatment solutions, thereby significantly boosting the industry's growth across key markets such as the UAE, Saudi Arabia, South Africa, and Egypt
MEA CAR-T Cell Therapy Treatment Market Analysis
- CAR-T cell therapy, an innovative immunotherapy that reprograms a patient’s T-cells to recognize and attack cancer cells, is increasingly becoming a critical treatment approach for hematologic malignancies across the MEA region due to its high efficacy, personalized nature, and ability to induce durable remissions in relapsed or refractory cases
- The rising demand for CAR-T cell therapy is primarily fueled by the growing prevalence of blood cancers such as leukemia and lymphoma, increasing awareness among healthcare providers and patients, and expanding clinical research in the MEA region
- U.A.E. dominated the MEA CAR-T cell therapy treatment market with the largest revenue share of 26.8% in 2024, characterized by strong healthcare infrastructure, early adoption of innovative treatments, and significant investment in personalized cancer therapies
- Israel is expected to be the fastest growing country in the MEA CAR-T cell therapy treatment market with a projected CAGR of 17.5% from 2025 to 2032, driven by cutting-edge research in immuno-oncology, an expanding biotech ecosystem, and high clinical trial activity in cell and gene therapy
- Antigens on hematologic malignancies segment dominated the MEA CAR-T cell therapy treatment market with a market share of 66.4% in 2024, fueled by the success of CAR-T therapies for blood cancers such as leukemia, lymphoma, and multiple myeloma
Report Scope and MEA CAR-T Cell Therapy Treatment Market Segmentation
|
Attributes |
MEA CAR-T Cell Therapy Treatment Key Market Insights |
|
Segments Covered |
|
|
Countries Covered |
Middle East and Africa
|
|
Key Market Players |
|
|
Market Opportunities |
|
|
Value Added Data Infosets |
In addition to the insights on market scenarios such as market value, growth rate, segmentation, geographical coverage, and major players, the market reports curated by the Data Bridge Market Research also include in-depth expert analysis, pricing analysis, brand share analysis, consumer survey, demography analysis, supply chain analysis, value chain analysis, raw material/consumables overview, vendor selection criteria, PESTLE Analysis, Porter Analysis, and regulatory framework. |
MEA CAR-T Cell Therapy Treatment Market Trends
“Growing Access to Advanced Immunotherapies in MEA”
- A significant and accelerating trend in the MEA CAR-T cell therapy treatment market is the rising access to advanced immunotherapies across the region, especially in urban healthcare centers. Hospitals and specialty clinics in the Middle East and parts of Africa are increasingly adopting cell-based cancer therapies, reflecting a shift toward precision medicine
- For instance, several cancer centers in countries such as the United Arab Emirates (UAE) and Saudi Arabia have partnered with international biotech firms to explore CAR-T clinical trials and treatment protocols. These collaborations are enabling local physicians to deliver cutting-edge therapies previously limited to Western markets
- The growing regional awareness of personalized oncology treatments is influencing both public and private healthcare providers to incorporate CAR-T into long-term cancer care strategies. The increase in patient advocacy and awareness campaigns around hematologic malignancies is also playing a role in market growth
- Furthermore, the MEA region is witnessing a rise in government-supported initiatives aimed at improving cancer survival rates, such as national cancer control programs and cancer genomic testing infrastructures. These efforts are crucial in identifying eligible patients for CAR-T cell therapy and streamlining treatment access
- Academic medical centers in countries like South Africa and Egypt are now exploring partnership models with multinational biopharma companies to establish CAR-T research and manufacturing hubs, further driving the therapy’s regional accessibility
- The convergence of rising cancer incidence, medical infrastructure development, and regulatory support is creating a favorable environment for CAR-T therapy market expansion across the Middle East and Africa
MEA CAR-T Cell Therapy Treatment Market Dynamics
Driver
“Growing Need Due to Rising Cancer Burden and Advancements in Precision Medicine”
- The increasing prevalence of hematologic malignancies such as diffuse large B-cell lymphoma, multiple myeloma, and acute lymphoblastic leukemia across the Middle East and Africa (MEA) is a significant driver for the growing demand for CAR-T cell therapies. Rising cancer incidences and an unmet need for effective, long-lasting treatments are propelling healthcare systems to adopt cutting-edge immunotherapies
- For instance, in March 2024, regional healthcare providers in Saudi Arabia and the UAE collaborated with global biotechnology firms to establish CAR-T therapy centers, focusing on enhancing accessibility and patient outcomes. Such initiatives reflect the region’s strategic commitment to integrate advanced cellular therapies into national cancer care pathways
- Furthermore, the MEA region is witnessing rising investments in personalized medicine, which supports the application of CAR-T therapies tailored to individual patients' tumor profiles. The availability of autologous CAR-T products like Yescarta and Kymriah is contributing to early adoption in specialty hospitals and research institutes
- Expanding government healthcare budgets and favorable regulatory frameworks, particularly in GCC countries, are facilitating clinical trials and commercial approvals of CAR-T products. Growing awareness among oncologists and patients regarding the efficacy of these therapies in relapsed or refractory cases is further fueling market expansion
Restraint/Challenge
“High Treatment Costs and Limited Infrastructure in Emerging Markets”
- One of the most critical challenges restraining the MEA CAR-T Cell therapy treatment market is the high cost of therapy, which can range from USD 350,000 to USD 500,000 per treatment cycle. This cost includes cell harvesting, manufacturing, hospital care, and follow-up, posing a significant burden on public healthcare systems and uninsured patients
- For instance, several African countries currently lack CAR-T cell manufacturing and storage infrastructure, resulting in reliance on international logistics and prolonged lead times. This affects the timely administration of the therapy and compromises outcomes, especially in aggressive cancers
- In addition, a shortage of trained clinical personnel and certified facilities for administering CAR-T therapy poses a barrier to widespread access. Limited diagnostic capabilities for identifying eligible patients further delay treatment initiation
- To overcome these hurdles, market players are focusing on developing decentralized CAR-T manufacturing units and establishing training programs in collaboration with regional governments. Efforts to lower production costs through allogeneic (off-the-shelf) CAR-T cell platforms may also expand affordability in low- and middle-income countries within the MEA region
- Addressing reimbursement challenges, regulatory complexities, and logistical constraints through regional partnerships and innovative pricing models will be vital for the long-term success of the MEA CAR-T Cell Therapy Treatment market
MEA CAR-T Cell Therapy Treatment Market Scope
The MEA CAR-T cell therapy treatment market is segmented into four notable segments based on product, structure, targeted antigens, and therapeutic application.
• By Product
On the basis of product, the MEA CAR-T cell therapy treatment market is segmented into autologous CAR-T Cells and allogeneic CAR-T Cells. The autologous CAR-T cells segment dominated the market with the largest revenue share of 72.3% in 2024, driven by reduced immunogenicity and personalization advantages.
The allogeneic CAR-T cells segment is expected to witness the fastest CAGR of 24.8% from 2025 to 2032 due to their off-the-shelf availability and cost-efficiency.
• By Structure
On the basis of structure, the MEA CAR-T cell therapy treatment market is segmented into first generation CAR-T cells, second generation CAR-T cells, third generation CAR-T cells, and fourth generation CAR-T cells. The second generation CAR-T cells segment held the largest market share of 58.9% in 2024, owing to their enhanced efficacy and widespread clinical application.
The fourth generation CAR-T Cells segment is expected to grow at the fastest CAGR of 26.1% during the forecast period, driven by advanced gene-editing technologies and multi-targeting abilities.
• By Targeted Antigens
On the basis of targeted antigens, the MEA CAR-T cell therapy treatment market is segmented into antigens on solid tumors, antigens on hematologic malignancies, and others. Antigens on hematologic malignancies accounted for the largest revenue share of 66.4% in 2024, fueled by the success of CAR-T therapies for blood cancers.
Antigens on solid tumors are projected to grow at the highest CAGR of 25.7% during the forecast period, driven by ongoing clinical trials and innovations in tumor microenvironment targeting.
• By Brand
On the basis of brand, the MEA CAR-T cell therapy treatment market is segmented into yescarta, kymriah, tecartus, and others. Yescarta held the largest market share of 41.2% in 2024, with strong adoption for DLBCL and other lymphomas.
Tecartus is anticipated to register the fastest CAGR of 22.9% from 2025 to 2032, driven by its performance in mantle cell lymphoma.
• By Therapeutic Application
On the basis of therapeutic application, the MEA CAR-T cell therapy treatment market is segmented into diffuse large B-Cell lymphoma, follicular lymphoma, acute lymphoblastic leukemia (ALL), mantle cell lymphoma, multiple myeloma, hematologic malignancies, lung cancer, chronic lymphocytic leukemia, gastric cancer, pancreatic cancer, breast cancer, and others. Diffuse large B-Cell lymphoma (DLBCL) captured the largest share of 36.5% in 2024, driven by early approvals and successful patient outcomes.
Multiple myeloma is expected to grow at the fastest CAGR of 28.3% during the forecast period, spurred by new BCMA-targeting CAR-T product launches in MEA.
• By End User
On the basis of end user, the MEA CAR-T cell therapy treatment market is segmented into hospitals, specialty clinics, and others. Hospitals led the segment with a market share of 69.8% in 2024 due to their ability to support CAR-T infusion, monitoring, and recovery protocols.
Specialty clinics are expected to grow at the highest CAGR of 21.6% during the forecast period, benefiting from decentralization and expanding immunotherapy networks.
• By Distribution Channel
On the basis of distribution channel, the MEA CAR-T cell therapy treatment market is segmented into hospital pharmacy and others. The hospital pharmacy segment held the largest market share of 78.1% in 2024, driven by complex cold chain and compliance requirements.
The others segment is projected to expand at a CAGR of 19.5% during the forecast period, as more CAR-T manufacturers streamline distribution through specialty logistics providers.
MEA CAR-T Cell Therapy Treatment Market Regional Analysis
- U.A.E. dominated the MEA CAR-T cell therapy treatment market with the largest revenue share of 26.8% in 2024, characterized by strong healthcare infrastructure, early adoption of innovative treatments, and significant investment in personalized cancer therapies
- Patients and healthcare providers in the region increasingly value the targeted efficacy, personalized approach, and long-term remission potential offered by CAR-T cell therapies in treating hematologic cancers such as leukemia and lymphoma
- This rising adoption is further driven by expanding clinical trial activity, improving access to advanced oncology care, and growing government investments in cell-based treatments, positioning CAR-T therapy as a transformative option across select MEA markets
Saudi Arabia MEA CAR-T Cell Therapy Treatment Market Insight
The Saudi Arabia CAR-T cell therapy treatment market accounted for 21.3% of the MEA market revenue share in 2024 and is anticipated to grow at a substantial CAGR during the forecast period. This growth is driven by the government's Vision 2030 healthcare transformation strategy, expansion of specialized oncology centers, and partnerships with international biotech firms. Rising hematologic cancer cases and a national push for precision medicine adoption are fueling market expansion.
U.A.E. MEA CAR-T Cell Therapy Treatment Market Insight
The U.A.E. CAR-T cell therapy treatment market captured the highest market revenue share of 26.8% in the MEA region in 2024, driven by its robust investment in advanced therapies, high healthcare expenditure, and proactive regulatory approvals. CAR-T therapies are being rapidly adopted in the country’s leading oncology hospitals, supported by collaborations with global innovators such as Gilead and Novartis.
Israel MEA CAR-T Cell Therapy Treatment Market Insight
The Israel CAR-T cell therapy treatment market with a projected CAGR of 17.5% from 2025 to 2032, thanks to its advanced biotechnology sector, strong academic R&D capabilities, and high levels of CAR-T clinical trial activity. The market is poised to expand further with growing domestic development and application of next-gen immunotherapies.
MEA CAR-T Cell Therapy Treatment Market Share
The MEA CAR-T cell therapy treatment industry is primarily led by well-established companies, including:
- Novartis AG (Switzerland)
- Gilead Sciences, Inc. (U.S.)
- Bristol-Myers Squibb Company (U.S.)
- Johnson & Johnson Services, Inc. (U.S.)
- Autolus Therapeutics plc (U.K.)
- Poseida Therapeutics, Inc. (U.S.)
- Sorrento Therapeutics, Inc. (U.S.)
- Miltenyi Biotec (Germany)
- CARsgen Therapeutics (China)
- JW Therapeutics (Shanghai) Co., Ltd. (China)
- Legend Biotech Corporation (China)
- Tessa Therapeutics (Singapore)
- Adaptimmune Therapeutics plc (U.K.)
- Bluebird Bio, Inc. (U.S.)
- Celyad Oncology SA (Belgium)
- Allogene Therapeutics (U.S.)
- Immatics N.V. (Germany)
- Pfizer Inc. (U.S.)
Latest Developments in MEA CAR-T Cell Therapy Treatment Market
- In December 2023, Gilead Sciences, Inc. announced U.S. FDA has approved a label update for Yescarta (axicabtagene ciloleucel) to include the overall survival (OS) primary analysis from the landmark Phase 3 ZUMA-7 study showing a statistically significant improvement for Yescarta in OS versus standard of care (SOC) as second-line treatment with curative intent for patients with relapsed or refractory large B-cell lymphoma (R/R LBCL) within 12 months of completion of first-line therapy
- In May 2022, Bristol-Myers Squibb Company announced the approval of Opdivo plus Yervoy as a first line treatment for adult patients by Japan's Ministry of Health, Labour and Welfare. This may help the company to strengthen its product portfolio
- In February 2022, the FDA has approved CARVYKTI (ciltacabtagene autoleucel) from Janssen for treating adults with relapsed or refractory multiple myeloma after four or more prior lines of therapy, marking Janssen's inaugural cell therapy. This will underscore the dedication to advance their oncology treatment options
- In December 2021, Novartis AG has signed an agreement with BeiGene, Ltd. for ociperlimab (BGB-A1217), enhancing the company's immuno-oncology Research and development. This collaboration contributes to Novartis Oncology's broader initiative to advance innovation in cancer treatments by incorporating a potentially transformative therapy into its expanding immunotherapy platform
SKU-
Get online access to the report on the World's First Market Intelligence Cloud

- Interactive Data Analysis Dashboard
- Company Analysis Dashboard for high growth potential opportunities
- Research Analyst Access for customization & queries
- Competitor Analysis with Interactive dashboard
- Latest News, Updates & Trend analysis
- Harness the Power of Benchmark Analysis for Comprehensive Competitor Tracking
Research Methodology
Data collection and base year analysis are done using data collection modules with large sample sizes. The stage includes obtaining market information or related data through various sources and strategies. It includes examining and planning all the data acquired from the past in advance. It likewise envelops the examination of information inconsistencies seen across different information sources. The market data is analysed and estimated using market statistical and coherent models. Also, market share analysis and key trend analysis are the major success factors in the market report. To know more, please request an analyst call or drop down your inquiry.
The key research methodology used by DBMR research team is data triangulation which involves data mining, analysis of the impact of data variables on the market and primary (industry expert) validation. Data models include Vendor Positioning Grid, Market Time Line Analysis, Market Overview and Guide, Company Positioning Grid, Patent Analysis, Pricing Analysis, Company Market Share Analysis, Standards of Measurement, Global versus Regional and Vendor Share Analysis. To know more about the research methodology, drop in an inquiry to speak to our industry experts.
Customization Available
Data Bridge Market Research is a leader in advanced formative research. We take pride in servicing our existing and new customers with data and analysis that match and suits their goal. The report can be customized to include price trend analysis of target brands understanding the market for additional countries (ask for the list of countries), clinical trial results data, literature review, refurbished market and product base analysis. Market analysis of target competitors can be analyzed from technology-based analysis to market portfolio strategies. We can add as many competitors that you require data about in the format and data style you are looking for. Our team of analysts can also provide you data in crude raw excel files pivot tables (Fact book) or can assist you in creating presentations from the data sets available in the report.

