
Global Water Treatment Chemicals Market
Market Size in USD Million
 USD
36.00 Million
USD
44.00 Million
2021
2029
USD
36.00 Million
USD
44.00 Million
2021
2029
| 2022 - 2029 | |
| USD 36.00 Million | |
| USD 44.00 Million | |
| % | |
|
Water Treatment Chemicals Market Analysis and Size
The essential factors contributing to the growth of the global water treatment chemicals market in the forecast period of 2023 to 2030 include the limited availability of water due to increased wastewater recycling. Also, the requirement for clean water in oil and gas, power plant, mining, pulp & paper, and chemical processing industries significantly contributes to the market's growth.
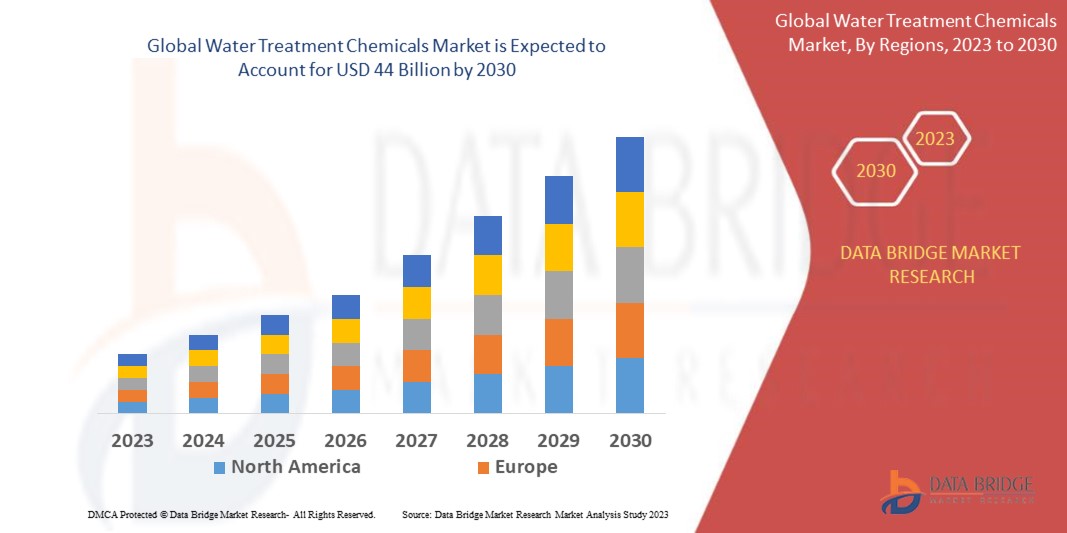
Data Bridge Market Research analyses that the global water treatment chemicals market, which was USD 36 billion in 2022, is expected to reach USD 44 billion by 2030, growing at a CAGR of 3% from 2023 to 2030. In addition to the insights on market scenarios such as market value, growth rate, segmentation, geographical coverage, and major players, the market reports curated by the Data Bridge Market Research also include in-depth expert analysis, geographically represented company-wise production and capacity, network layouts of distributors and partners, detailed and updated price trend analysis and deficit analysis of supply chain and demand.
Water Treatment Chemicals Market Scope and Segmentation
|
Report Metric |
Details |
|
Forecast Period |
2023 to 2030 |
|
Base Year |
2022 |
|
Historic Years |
2021 (Customizable to 2015-2020) |
|
Quantitative Units |
Revenue in USD Billion, Volumes in Units, Pricing in USD |
|
Segments Covered |
Type (Flocculants and Coagulants, Biocides and Disinfectants, Defoamers and Defoaming Agents, pH Adjusters and Softeners and Corrosion Inhibitors), Category (Boiling Water Treatment and Cooling Water Treatment), End-User (Electric Power Generation, Oil and Gas, Chemicals Manufacturing, Mining and Minerals Processing, Municipal, Food and Beverages and Pulp and Paper) |
|
Countries Covered |
U.S., Canada, Mexico, Germany, France, U.K., Italy, Spain, Russia, Turkey, Belgium, Netherlands, Switzerland, Luxemburg, Rest of Europe, Japan, China, South Korea, India, Australia And New Zealand, Singapore, Thailand, Malaysia, Indonesia, Philippines, Rest of Asia-Pacific, Brazil, Argentina, Rest of South America UAE, Saudi Arabia, Egypt, Israel, South Africa, and Rest of Middle East and Africa |
|
Market Players Covered |
Ecolab (U.S.), Kemira (Finland), Danaher (U.S.), BASF SE (Germany), Kurita Water Industries Ltd (Japan), GENERAL ELECTRIC (U.S.), BWA Water Additives (UK), Cortec Corporation (U.S.), DOW (U.S.), Buckman (U.S.), Solvay (Belgium), Akzo Nobel N.V (The Netherlands), Air Products and Chemicals, Inc (U.S.), ION EXCHANGE (India), Carus Group Inc (U.S.), Thermax Limited (India), Hydrite Chemical Co (U.S.), Lonza (Switzerland), SUEZ (France), Solenis (Delaware) among others |
|
Market Opportunities |
|
Market Definition
Water treatment chemical refers to a method utilized to scrub water by exploiting various chemicals. Water treatment chemicals prevent suspended solids, corrosion, and microorganism contamination.
Global Water Treatment Chemicals Market Dynamics
Driver
- Limited availability of water has increased the use of recycling wastewater
Limited water availability has also increased the use of wastewater recycling, which is the major factor accelerating the growth of the water treatment chemicals market. Furthermore, the requirement for clean water in oil and gas, power plant, mining, pulp and paper and chemical processing industries is also expected to drive the growth of the water treatment chemicals market.
Opportunity
- Stringent government regulations
In addition, stringent government regulations on the TSS level of the water will create ample opportunities for the water treatment chemicals market.
Restraint/Challenge
- Presence of alternate treatment technology
The increasing water treatment chemicals process and the presence of alternate treatment technology will restrains the water treatment chemicals market, whereas the need for eco-friendly formulations and vulnerability regarding copying of patents will challenge the growth of the water treatment chemicals market.
This global water treatment chemicals market report provides details of new recent developments, trade regulations, import-export analysis, production analysis, value chain optimization, market share, impact of domestic and localized market players, analyses opportunities in terms of emerging revenue pockets, changes in market regulations, strategic market growth analysis, market size, category market growths, application niches and dominance, product approvals, product launches, geographic expansions, technological innovations in the market. To gain more info on the global Water Treatment Chemicals market contact Data Bridge Market Research for an Analyst Brief, our team will help you take an informed market decision to achieve market growth.
Impact and Current Market Scenario of Raw Material Shortage and Shipping Delays
Data Bridge Market Research offers a high-level analysis of the market and delivers information by keeping in account the impact and current market environment of raw material shortage and shipping delays. This translates into assessing strategic possibilities, creating effective action plans, and assisting businesses in making important decisions. Apart from the standard report, we also offer in-depth analysis of the procurement level from forecasted shipping delays, distributor mapping by region, commodity analysis, production analysis, price mapping trends, sourcing, category performance analysis, supply chain risk management solutions, advanced benchmarking, and other services for procurement and strategic support.
Expected Impact of Economic Slowdown on the Pricing and Availability of Products
When economic activity slows, industries begin to suffer. The forecasted effects of the economic downturn on the pricing and accessibility of the products are taken into account in the market insight reports and intelligence services provided by DBMR. With this, our clients can typically keep one step ahead of their competitors, project their sales and revenue, and estimate their profit and loss expenditures.
Recent Development
- In June 2021, Danaher Corporation (NYSE: DHR) announced that it had signed a legally binding agreement to buy privately held Aldevron for about $9.6 billion in cash.
- In December 2022, Cortec Corporation announced purchasing the Singapore-based Cortec Southeast Asia (CSEA) offices. The Cortec Corporation currently owns all of CSEA. Due to a direct connection to the Cortec headquarters in Saint Paul, Minnesota, this expansion promises to enhance service and support to clients in Southeast Asia.
Global Water Treatment Chemicals Market Scope
The global water treatment chemicals market is segmented on the basis of type, category, and end-user. The growth amongst these segments will help you analyse meagre growth segments in the industries and provide the users with a valuable market overview and market insights to help them make strategic decisions for identifying core market applications.
Type
- Flocculants and Coagulants
- Biocides and Disinfectants
- Defoamers and Defoaming Agents
- pH Adjusters and Softeners
- Corrosion Inhibitors
Category
- Boiling Water Treatment
- Cooling Water Treatment
End-User
- Electric Power Generation
- Oil and Gas
- Chemicals Manufacturing
- Mining and Minerals Processing
- Municipal
- Food and Beverages
- Pulp and Paper
Global Water Treatment Chemicals Market Regional Analysis/Insights
The global water treatment chemicals market is analyzed and market size insights and trends are provided by type, category, and end-user, as referenced above.
The countries covered in the global water treatment chemicals market report U.S., Canada, Mexico, Germany, France, U.K., Italy, Spain, Russia, Turkey, Belgium, Netherlands, Switzerland, Luxemburg, rest of Europe, Japan, China, South Korea, India, Australia And New Zealand, Singapore, Thailand, Malaysia, Indonesia, Philippines, rest of Asia-Pacific, Brazil, Argentina, rest of South America UAE, Saudi Arabia, Egypt, Israel, South Africa, and rest of Middle East and Africa.
North America dominates the water treatment chemicals market due to the limited availability of water. The increasing recycling of wastewater is the major factor accelerating the growth of the water treatment chemicals market.
Asia-Pacific is expected to grow from 2023 to 2030 due to the requirement for clean water in oil and gas, power plant, mining, pulp and paper, and chemical processing industries. The increased water recycling has fueled the worldwide demand for water treatment chemicals and is driving the market's growth.
The country section of the report also provides individual market impacting factors and changes in regulation in the market domestically that impacts the current and future trends of the market. Data points like down-stream and upstream value chain analysis, technical trends and porter's five forces analysis, case studies are some of the pointers used to forecast the market scenario for individual countries. Also, the presence and availability of global brands and their challenges faced due to large or scarce competition from local and domestic brands, impact of domestic tariffs and trade routes are considered while providing forecast analysis of the country data.
Competitive Landscape and Global Water Treatment Chemicals Market Share Analysis
The global water treatment chemicals market competitive landscape provides details by competitor. Details included are company overview, company financials, revenue generated, market potential, investment in research and development, new market initiatives, global presence, production sites and facilities, production capacities, company strengths and weaknesses, product launch, product width and breadth, application dominance. The above data points provided are only related to the companies' focus related to the market.
Some of the major players operating in the global water treatment chemicals market are:
- Ecolab (U.S.)
- Kemira (Finland)
- Danaher (U.S.)
- BASF SE (Germany)
- Kurita Water Industries Ltd (Japan)
- GENERAL ELECTRIC (U.S.)
- BWA Water Additives (UK)
- Cortec Corporation (U.S.)
- DOW (U.S.)
- Buckman (U.S.)
- Solvay (Belgium)
- Akzo Nobel N.V (The Netherlands)
- Air Products and Chemicals, Inc (U.S.)
- ION EXCHANGE (India)
- Carus Group Inc (U.S.)
- Thermax Limited (India)
- Hydrite Chemical Co (U.S.)
- Lonza (Switzerland)
- SUEZ (France)
- Solenis (Delaware)
SKU-

- Interactive Data Analysis Dashboard
- Company Analysis Dashboard for high growth potential opportunities
- Research Analyst Access for customization & queries
- Competitor Analysis with Interactive dashboard
- Latest News, Updates & Trend analysis
- Harness the Power of Benchmark Analysis for Comprehensive Competitor Tracking
Table of Content
1 INTRODUCTION
1.1 OBJECTIVES OF THE STUDY
1.2 MARKET DEFINITION
1.3 OVERVIEW OF GLOBAL WATER TREATMENT CHEMICALS MARKET
1.4 CURRENCY AND PRICING
1.5 LIMITATION
1.6 MARKETS COVERED
2 MARKET SEGMENTATION
2.1 KEY TAKEAWAYS
2.2 ARRIVING AT THE GLOBAL WATER TREATMENT CHEMICALS MARKET SIZE
2.3 VENDOR POSITIONING GRID
2.4 MARKETS COVERED
2.5 GEOGRAPHIC SCOPE
2.6 YEARS CONSIDERED FOR THE STUDY
2.7 RESEARCH METHODOLOGY
2.8 TECHNOLOGY LIFE LINE CURVE
2.9 MULTIVARIATE MODELLING
2.1 PRIMARY INTERVIEWS WITH KEY OPINION LEADERS
2.11 DBMR MARKET POSITION GRID
2.12 MARKET APPLICATION COVERAGE GRID
2.13 DBMR MARKET CHALLENGE MATRIX
2.14 SECONDARY SOURCES
2.15 GLOBAL WATER TREATMENT CHEMICALS MARKET: RESEARCH SNAPSHOT
2.16 ASSUMPTIONS
3 MARKET OVERVIEW
3.1 DRIVERS
3.2 RESTRAINTS
3.3 OPPORTUNITIES
3.4 CHALLENGES
4 EXECUTIVE SUMMARY
5 PREMIUM INSIGHTS
5.1 RAW MATERIAL COVERAGE
5.2 PRODUCTION CONSUMPTION ANALYSIS
5.3 IMPORT EXPORT SCENARIO
5.4 TECHNOLOGICAL ADVANCEMENT BY MANUFACTURERS
5.5 PORTER’S FIVE FORCES
5.6 VENDOR SELECTION CRITERIA
5.7 PESTEL ANALYSIS
5.8 REGULATION COVERAGE
5.8.1 PRODUCT CODES
5.8.2 CERTIFIED STANDARDS
5.8.3 SAFETY STANDARDS
5.8.3.1. MATERIAL HANDLING & STORAGE
5.8.3.2. TRANSPORT & PRECAUTIONS
5.8.3.3. HARAD IDENTIFICATION
6 SUPPLY CHAIN ANALYSIS
7 CLIMATE CHANGE SCENARIO
7.1 ENVIRONMENTAL CONCERNS
7.2 INDUSTRY RESPONSE
7.3 GOVERNMENT’S ROLE
7.4 ANALYST RECOMMENDATIONS
8 PRODUCTION CAPACITY OUTLOOK
9 GLOBAL WATER TREATMENT CHEMICALS MARKET, BY PRODUCT, 2018-2032 (USD MILLION) (KILO TONS)
9.1 OVERVIEW
9.2 COAGULANTS AND FLOCCULANTS
9.2.1 ORGANIC COAGULANTS
9.2.1.1. ALUMINUM SULFATE (ALUM)
9.2.1.2. FERRIC CHLORIDE
9.2.1.3. FERRIC SULFATE
9.2.1.4. POLYMERIC ALUMINUM COAGULANTS
9.2.1.5. OTHERS
9.2.2 INORGANIC COAGULANTS
9.2.2.1. POLYACRYLAMIDES (PAM)
9.2.2.2. POLYAMINES
9.2.2.3. POLYDADMAC (POLYDIALLYLDIMETHYLAMMONIUM CHLORIDE)
9.2.2.4. OTHERS
9.3 CORROSION INHIBITORS
9.3.1 ANODIC INHIBITORS
9.3.1.1. CHROMATES
9.3.1.2. PHOSPHATES
9.3.1.3. MOLYBDATES
9.3.1.4. OTHERS
9.3.2 CATHODIC INHIBITORS
9.3.2.1. ZINC-BASED COMPOUNDS
9.3.2.2. POLYPHOSPHATES
9.3.3 MIXED INHIBITORS
9.3.3.1. SILICATES
9.3.3.2. BENZOTRIAZOLE DERIVATIVES
9.3.3.3. OTHERS
9.3.4 OTHERS
9.4 BIOCIDES
9.4.1 OXIDIZING BIOCIDES
9.4.1.1. CHLORINE
9.4.1.2. SODIUM HYPOCHLORITE
9.4.1.3. CHLORINE DIOXIDE
9.4.1.4. OZONE
9.4.1.5. PERACETIC ACID (PAA)
9.4.1.6. OTHERS
9.4.2 NON-OXIDIZING BIOCIDES
9.4.2.1. ISOTHIAZOLINONES
9.4.2.2. GLUTARALDEHYDE
9.4.2.3. QUATERNARY AMMONIUM COMPOUNDS (QUATS)
9.4.2.4. POLYMERIC BIGUANIDES
9.4.2.5. OTHERS
9.5 SCALE INHIBITORS
9.5.1 POLYPHOSPHATES
9.5.1.1. AMINO-TRIMETHYLENE PHOSPHONIC ACID (ATMP)
9.5.1.2. HYDROXYETHYLIDENE DIPHOSPHONIC ACID (HEDP)
9.5.2 PHOSPHONATES
9.5.2.1. POLYMALEIC ACID
9.5.2.2. POLYACRYLIC ACID
9.6 PH ADJUSTERS
9.6.1 ACIDS
9.6.1.1. SULFURIC ACID
9.6.1.2. HYDROCHLORIC ACID
9.6.1.3. NITRIC ACID
9.6.2 ALKALIS
9.6.2.1. SODIUM HYDROXIDE
9.6.2.2. POTASSIUM HYDROXIDE
9.6.2.3. LIME (CALCIUM HYDROXIDE)
9.7 ANTI-FOAMING AGENTS
9.7.1 SILICONE-BASED
9.7.1.1. MODIFIED SILOXANES
9.7.1.2. DIMETHYLPOLYSILOXANE
9.7.2 NON-SILICONE-BASED
9.7.2.1. OIL-BASED
9.7.2.2. ALKYL POLYACRYLATES
9.7.2.3. FATTY ALCOHOLS
9.7.2.4. OTHERS
9.8 ALGOECIDES
9.9 OXIDANTS
9.9.1 HYDROGEN PEROXIDE
9.9.2 OZONE
9.9.3 OXYGEN
9.1 OTHERS
10 GLOBAL WATER TREATMENT CHEMICALS MARKET, BY FUNCTIONALITY, 2018-2032 (USD MILLION)
10.1 OVERVIEW
10.2 PRIMARY TREATMENT
10.2.1 PRIMARY TREATMENT, BY TECHNOLOGY
10.2.1.1. SCREENING, FILTRATION AND CENTRIFUGAL SEPARATION
10.2.1.2. SEDIMENTATION AND GRAVITY SEPARATION
10.2.1.3. COAGULATION
10.2.1.4. FLOTATION
10.3 SECONDARY TREATMENT
10.3.1 SECONDARY TREATMENT, BY TECHNOLOGY
10.3.1.1. AEROBIC PROCESS
10.3.1.2. ANAEROBIC PROCESS
10.4 TERTIARY TREATMENT
10.4.1 TERTIARY TREATMENT, BY TECHNOLOGY
10.4.1.1. DISTILLATION
10.4.1.1.1. CRYSTALLIZATION
10.4.1.2. EVAPORATION
10.4.1.2.1. SOLVENT EXTRACTION
10.4.1.3. OXIDATION
10.4.1.3.1. PRECIPITATION
10.4.1.4. ION EXCHANGE
10.4.1.4.1. MICRO-AND ULTRA FILTRATION
10.4.1.5. REVERSE OSMOSIS
10.4.1.5.1. ADSORPTION
10.4.1.6. ELECTROLYSIS
10.4.1.6.1. ELECTRODIALYSIS
10.5 RECYCLING AND REUSE
10.6 ZERO LIQUID DISCHARGE (ZLD) SYSTEMS
10.7 OTHERS
11 GLOBAL WATER TREATMENT CHEMICALS MARKET, BY APPLICATION, 2018-2032 (USD MILLION)
11.1 OVERVIEW
11.2 MUNICIPAL WATER TREATMENT
11.2.1 DRINKING WATER TREATMENT
11.2.2 SEWAGE TREATMENT
11.3 INDUSTRIAL WATER TREATMENT
11.3.1 PROCESS WATER TREATMENT
11.3.2 COOLING WATER TREATMENT
11.3.3 BOILER WATER TREATMENT
11.4 DESALINATION
11.4.1 SEAWATER DESALINATION
11.4.2 BRACKISH WATER DESALINATION
11.5 STORMWATER MANAGEMENT
11.6 IRRIGATION
11.7 OTHERS
12 GLOBAL WATER TREATMENT CHEMICALS MARKET, BY END-USE, 2018-2032 (USD MILLION)
12.1 OVERVIEW
12.2 RESIDENTIAL/COMMERCIAL/INFRASTRUCTURE
12.2.1 BY CHEMICALS TYPE
12.2.1.1. COAGULANTS AND FLOCCULANTS
12.2.1.2. CORROSION INHIBITORS
12.2.1.3. BIOCIDES
12.2.1.4. SCALE INHIBITORS
12.2.1.5. PH ADJUSTERS
12.2.1.6. ANTI-FOAMING AGENTS
12.2.1.7. ALGOECIDES
12.2.1.8. OXIDANTS
12.2.1.9. OTHERS
12.3 OIL AND GAS
12.3.1 BY CATEGORY
12.3.1.1. UPSTREAM
12.3.1.2. DOWNSTREAM
12.3.1.3. MIDSTREAM
12.3.2 BY CHEMICALS TYPE
12.3.2.1. COAGULANTS AND FLOCCULANTS
12.3.2.2. CORROSION INHIBITORS
12.3.2.3. BIOCIDES
12.3.2.4. SCALE INHIBITORS
12.3.2.5. PH ADJUSTERS
12.3.2.6. ANTI-FOAMING AGENTS
12.3.2.7. ALGOECIDES
12.3.2.8. OXIDANTS
12.3.2.9. OTHERS
12.4 POWER GENERATION
12.4.1 BY CATEGORY
12.4.1.1. THERMAL POWER PLANTS
12.4.1.2. WIND POWER PLANTS
12.4.1.3. HYDROPOWER PLANTS
12.4.1.4. OTHERS
12.4.2 BY CHEMICALS TYPE
12.4.2.1. COAGULANTS AND FLOCCULANTS
12.4.2.2. CORROSION INHIBITORS
12.4.2.3. BIOCIDES
12.4.2.4. SCALE INHIBITORS
12.4.2.5. PH ADJUSTERS
12.4.2.6. ANTI-FOAMING AGENTS
12.4.2.7. ALGOECIDES
12.4.2.8. OXIDANTS
12.4.2.9. OTHERS
12.5 CHEMICALS
12.5.1 BY CHEMICALS TYPE
12.5.1.1. COAGULANTS AND FLOCCULANTS
12.5.1.2. CORROSION INHIBITORS
12.5.1.3. BIOCIDES
12.5.1.4. SCALE INHIBITORS
12.5.1.5. PH ADJUSTERS
12.5.1.6. ANTI-FOAMING AGENTS
12.5.1.7. ALGOECIDES
12.5.1.8. OXIDANTS
12.5.1.9. OTHERS
12.6 FOOD AND BEVERAGE
12.6.1 BY CATEGORY
12.6.1.1. BEVERAGE PROCESSING
12.6.1.2. DAIRY PROCESSING
12.6.1.3. BREWERIES
12.6.1.4. OTHERS
12.6.2 BY CHEMICALS TYPE
12.6.2.1. COAGULANTS AND FLOCCULANTS
12.6.2.2. CORROSION INHIBITORS
12.6.2.3. BIOCIDES
12.6.2.4. SCALE INHIBITORS
12.6.2.5. PH ADJUSTERS
12.6.2.6. ANTI-FOAMING AGENTS
12.6.2.7. ALGOECIDES
12.6.2.8. OXIDANTS
12.6.2.9. OTHERS
12.7 PHARMACEUTICALS
12.7.1 BY CHEMICALS TYPE
12.7.1.1. COAGULANTS AND FLOCCULANTS
12.7.1.2. CORROSION INHIBITORS
12.7.1.3. BIOCIDES
12.7.1.4. SCALE INHIBITORS
12.7.1.5. PH ADJUSTERS
12.7.1.6. ANTI-FOAMING AGENTS
12.7.1.7. ALGOECIDES
12.7.1.8. OXIDANTS
12.7.1.9. OTHERS
12.8 MINING AND METALS
12.8.1 BY CHEMICALS TYPE
12.8.1.1. COAGULANTS AND FLOCCULANTS
12.8.1.2. CORROSION INHIBITORS
12.8.1.3. BIOCIDES
12.8.1.4. SCALE INHIBITORS
12.8.1.5. PH ADJUSTERS
12.8.1.6. ANTI-FOAMING AGENTS
12.8.1.7. ALGOECIDES
12.8.1.8. OXIDANTS
12.8.1.9. OTHERS
12.9 PULP AND PAPER
12.9.1 BY CHEMICALS TYPE
12.9.1.1. COAGULANTS AND FLOCCULANTS
12.9.1.2. CORROSION INHIBITORS
12.9.1.3. BIOCIDES
12.9.1.4. SCALE INHIBITORS
12.9.1.5. PH ADJUSTERS
12.9.1.6. ANTI-FOAMING AGENTS
12.9.1.7. ALGOECIDES
12.9.1.8. OXIDANTS
12.9.1.9. OTHERS
12.1 TEXTILES
12.10.1 BY CHEMICALS TYPE
12.10.1.1. COAGULANTS AND FLOCCULANTS
12.10.1.2. CORROSION INHIBITORS
12.10.1.3. BIOCIDES
12.10.1.4. SCALE INHIBITORS
12.10.1.5. PH ADJUSTERS
12.10.1.6. ANTI-FOAMING AGENTS
12.10.1.7. ALGOECIDES
12.10.1.8. OXIDANTS
12.10.1.9. OTHERS
12.11 ELECTRONICS AND SEMICONDUCTORS
12.11.1 BY CHEMICALS TYPE
12.11.1.1. COAGULANTS AND FLOCCULANTS
12.11.1.2. CORROSION INHIBITORS
12.11.1.3. BIOCIDES
12.11.1.4. SCALE INHIBITORS
12.11.1.5. PH ADJUSTERS
12.11.1.6. ANTI-FOAMING AGENTS
12.11.1.7. ALGOECIDES
12.11.1.8. OXIDANTS
12.11.1.9. OTHERS
12.12 OTHERS
12.12.1 BY CHEMICALS TYPE
12.12.1.1. COAGULANTS AND FLOCCULANTS
12.12.1.2. CORROSION INHIBITORS
12.12.1.3. BIOCIDES
12.12.1.4. SCALE INHIBITORS
12.12.1.5. PH ADJUSTERS
12.12.1.6. ANTI-FOAMING AGENTS
12.12.1.7. ALGOECIDES
12.12.1.8. OXIDANTS
12.12.1.9. OTHERS
13 GLOBAL WATER TREATMENT CHEMICALS MARKET, BY REGION, 2018-2032 (USD MILLION) (KILO TONS)
GLOBAL WASTEWATER TREATMENT CHEMICALS MARKET, (ALL SEGMENTATION PROVIDED ABOVE IS REPRESENTED IN THIS CHAPTER BY COUNTRY)
13.1 NORTH AMERICA
13.1.1 U.S.
13.1.2 CANADA
13.1.3 MEXICO
13.2 EUROPE
13.2.1 GERMANY
13.2.2 U.K.
13.2.3 ITALY
13.2.4 FRANCE
13.2.5 SPAIN
13.2.6 RUSSIA
13.2.7 SWITZERLAND
13.2.8 TURKEY
13.2.9 BELGIUM
13.2.10 NETHERLANDS
13.2.11 SWEDEN
13.2.12 POLAND
13.2.13 LUXEMBURG
13.2.14 REST OF EUROPE
13.3 ASIA-PACIFIC
13.3.1 JAPAN
13.3.2 CHINA
13.3.3 SOUTH KOREA
13.3.4 INDIA
13.3.5 SINGAPORE
13.3.6 THAILAND
13.3.7 INDONESIA
13.3.8 MALAYSIA
13.3.9 PHILIPPINES
13.3.10 AUSTRALIA
13.3.11 NEW ZEALAND
13.3.12 REST OF ASIA-PACIFIC
13.4 SOUTH AMERICA
13.4.1 BRAZIL
13.4.2 ARGENTINA
13.4.3 REST OF SOUTH AMERICA
13.5 MIDDLE EAST AND AFRICA
13.5.1 SOUTH AFRICA
13.5.2 EGYPT
13.5.3 SAUDI ARABIA
13.5.4 UNITED ARAB EMIRATES
13.5.5 ISRAEL
13.5.6 REST OF MIDDLE EAST AND AFRICA
14 GLOBAL WASTEWATER TREATMENT CHEMICALS MARKET, COMPANY LANDSCAPE
14.1 COMPANY SHARE ANALYSIS: GLOBAL
14.2 COMPANY SHARE ANALYSIS: NORTH AMERICA
14.3 COMPANY SHARE ANALYSIS: EUROPE
14.4 COMPANY SHARE ANALYSIS: ASIA-PACIFIC
14.5 MERGERS AND ACQUISITIONS
14.6 NEW PRODUCT DEVELOPMENT AND APPROVALS
14.7 EXPANSIONS
14.8 PARTNERSHIP AND OTHER STRATEGIC DEVELOPMENTS
15 GLOBAL WATER TREATMENT CHEMICALS MARKET - SWOT ANALYSIS
16 GLOBAL WATER TREATMENT CHEMICALS MARKET - COMPANY PROFILES
16.1 B & V CHEMICALS
16.1.1 COMPANY SNAPSHOT
16.1.2 PRODUCT PORTFOLIO
16.1.3 REVENUE ANALYSIS
16.1.4 RECENT UPDATES
16.2 BASF SE
16.2.1 COMPANY SNAPSHOT
16.2.2 PRODUCT PORTFOLIO
16.2.3 REVENUE ANALYSIS
16.2.4 RECENT UPDATES
16.3 NOURYON
16.3.1 COMPANY SNAPSHOT
16.3.2 PRODUCT PORTFOLIO
16.3.3 REVENUE ANALYSIS
16.3.4 RECENT UPDATES
16.4 ACCEPTA WATER TREATMENT
16.4.1 COMPANY SNAPSHOT
16.4.2 PRODUCT PORTFOLIO
16.4.3 REVENUE ANALYSIS
16.4.4 RECENT UPDATES
16.5 WATER TREATMENT PRODUCTS LTD
16.5.1 COMPANY SNAPSHOT
16.5.2 PRODUCT PORTFOLIO
16.5.3 REVENUE ANALYSIS
16.5.4 RECENT UPDATES
16.6 AIREDALE GROUP
16.6.1 COMPANY SNAPSHOT
16.6.2 PRODUCT PORTFOLIO
16.6.3 REVENUE ANALYSIS
16.6.4 RECENT UPDATES
16.7 CHEMIFLOC
16.7.1 COMPANY SNAPSHOT
16.7.2 PRODUCT PORTFOLIO
16.7.3 REVENUE ANALYSIS
16.7.4 RECENT UPDATES
16.8 CLINTY CHEMICALS
16.8.1 COMPANY SNAPSHOT
16.8.2 PRODUCT PORTFOLIO
16.8.3 REVENUE ANALYSIS
16.8.4 RECENT UPDATES
16.9 INDUSTRIAL WATER MANAGEMENT LTD.
16.9.1 COMPANY SNAPSHOT
16.9.2 PRODUCT PORTFOLIO
16.9.3 REVENUE ANALYSIS
16.9.4 RECENT UPDATES
16.1 CHEMIPHASE
16.10.1 COMPANY SNAPSHOT
16.10.2 PRODUCT PORTFOLIO
16.10.3 REVENUE ANALYSIS
16.10.4 RECENT UPDATES
16.11 HYDROCHEM GROUP
16.11.1 COMPANY SNAPSHOT
16.11.2 PRODUCT PORTFOLIO
16.11.3 REVENUE ANALYSIS
16.11.4 RECENT UPDATES
16.12 KEMIRA
16.12.1 COMPANY SNAPSHOT
16.12.2 PRODUCT PORTFOLIO
16.12.3 REVENUE ANALYSIS
16.12.4 RECENT UPDATES
16.13 KURITA WATER INDUSTRIES LTD.
16.13.1 COMPANY SNAPSHOT
16.13.2 PRODUCT PORTFOLIO
16.13.3 REVENUE ANALYSIS
16.13.4 RECENT UPDATES
16.14 SOLENIS
16.14.1 COMPANY SNAPSHOT
16.14.2 PRODUCT PORTFOLIO
16.14.3 REVENUE ANALYSIS
16.14.4 RECENT UPDATES
16.15 ECOLAB
16.15.1 COMPANY SNAPSHOT
16.15.2 PRODUCT PORTFOLIO
16.15.3 REVENUE ANALYSIS
16.15.4 RECENT UPDATES
16.16 IEI
16.16.1 COMPANY SNAPSHOT
16.16.2 PRODUCT PORTFOLIO
16.16.3 REVENUE ANALYSIS
16.16.4 RECENT UPDATES
16.17 SNF
16.17.1 COMPANY SNAPSHOT
16.17.2 PRODUCT PORTFOLIO
16.17.3 REVENUE ANALYSIS
16.17.4 RECENT UPDATES
16.18 SOLVAY
16.18.1 COMPANY SNAPSHOT
16.18.2 PRODUCT PORTFOLIO
16.18.3 REVENUE ANALYSIS
16.18.4 RECENT UPDATES
NOTE: THE COMPANIES PROFILED IS NOT EXHAUSTIVE LIST AND IS AS PER OUR PREVIOUS CLIENT REQUIREMENT. WE PROFILE MORE THAN 100 COMPANIES IN OUR STUDY AND HENCE THE LIST OF COMPANIES CAN BE MODIFIED OR REPLACED ON REQUEST
17 RELATED REPORTS
18 QUESTIONNAIRE
19 CONCLUSION
20 ABOUT DATA BRIDGE MARKET RESEARCH
Global Water Treatment Chemicals Market, Supply Chain Analysis and Ecosystem Framework
To support market growth and help clients navigate the impact of geopolitical shifts, DBMR has integrated in-depth supply chain analysis into its Global Water Treatment Chemicals Market research reports. This addition empowers clients to respond effectively to global changes affecting their industries. The supply chain analysis section includes detailed insights such as Global Water Treatment Chemicals Market consumption and production by country, price trend analysis, the impact of tariffs and geopolitical developments, and import and export trends by country and HSN code. It also highlights major suppliers with data on production capacity and company profiles, as well as key importers and exporters. In addition to research, DBMR offers specialized supply chain consulting services backed by over a decade of experience, providing solutions like supplier discovery, supplier risk assessment, price trend analysis, impact evaluation of inflation and trade route changes, and comprehensive market trend analysis.
Data collection and base year analysis are done using data collection modules with large sample sizes. The stage includes obtaining market information or related data through various sources and strategies. It includes examining and planning all the data acquired from the past in advance. It likewise envelops the examination of information inconsistencies seen across different information sources. The market data is analysed and estimated using market statistical and coherent models. Also, market share analysis and key trend analysis are the major success factors in the market report. To know more, please request an analyst call or drop down your inquiry.
The key research methodology used by DBMR research team is data triangulation which involves data mining, analysis of the impact of data variables on the market and primary (industry expert) validation. Data models include Vendor Positioning Grid, Market Time Line Analysis, Market Overview and Guide, Company Positioning Grid, Patent Analysis, Pricing Analysis, Company Market Share Analysis, Standards of Measurement, Global versus Regional and Vendor Share Analysis. To know more about the research methodology, drop in an inquiry to speak to our industry experts.
Data Bridge Market Research is a leader in advanced formative research. We take pride in servicing our existing and new customers with data and analysis that match and suits their goal. The report can be customized to include price trend analysis of target brands understanding the market for additional countries (ask for the list of countries), clinical trial results data, literature review, refurbished market and product base analysis. Market analysis of target competitors can be analyzed from technology-based analysis to market portfolio strategies. We can add as many competitors that you require data about in the format and data style you are looking for. Our team of analysts can also provide you data in crude raw excel files pivot tables (Fact book) or can assist you in creating presentations from the data sets available in the report.


