
Global Smart Contact Lens Market
Market Size in USD Million
 USD
297.46 Million
USD
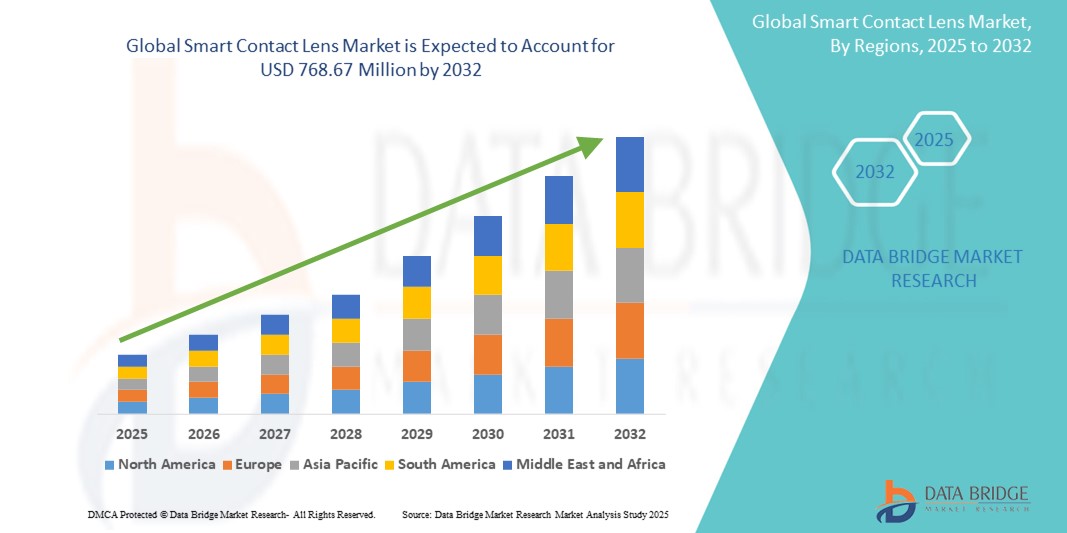
768.67 Million
2024
2032
USD
297.46 Million
USD
768.67 Million
2024
2032
| 2025 - 2032 | |
| USD 297.46 Million | |
| USD 768.67 Million | |
| % | |
|
Smart Contact Lens Market Size
- The global smart contact lens market size was valued at USD 297.46 million in 2024 and is expected to reach USD 768.67 million by 2032, at a CAGR of 12.60% during the forecast period
- This growth is driven by factors such as the rising prevalence of diabetes and glaucoma, increasing demand for wearable medical devices, and technological advancements in sensor and wireless technologies
Smart Contact Lens Market Analysis
- Smart contact lenses are advanced wearable medical devices designed to monitor health parameters such as glucose levels and intraocular pressure, or to provide augmented vision capabilities
- The market growth is driven by increasing prevalence of chronic diseases such as diabetes and glaucoma, rising demand for continuous health monitoring, and advancements in nanotechnology and wireless communication
- North America is expected to dominate the smart contact lens market with a market share of 36.8%, due to advanced healthcare infrastructure, high adoption of cutting-edge wearable technologies, and the strong presence of key market players
- Asia-Pacific is expected to be the fastest growing region in the smart contact lens market with a CAGR of 10.2%, during the forecast period due to rapid expansion in healthcare infrastructure, rising awareness about eye health, and the increasing demand for wearable medical technologies
- Poly (2-Hydroxyethyl Methacrylate) (PHEMA) segment is expected to dominate the market with a market share of 33.5% due to its high biocompatibility, excellent oxygen permeability, and flexibility, which are crucial for maintaining comfort and safety during prolonged use
Report Scope and Smart Contact Lens Market Segmentation
|
Attributes |
Smart Contact Lens Key Market Insights |
|
Segments Covered |
|
|
Countries Covered |
North America
Europe
Asia-Pacific
Middle East and Africa
South America
|
|
Key Market Players |
|
|
Market Opportunities |
|
|
Value Added Data Infosets |
In addition to the insights on market scenarios such as market value, growth rate, segmentation, geographical coverage, and major players, the market reports curated by the Data Bridge Market Research also include import export analysis, production capacity overview, production consumption analysis, price trend analysis, climate change scenario, supply chain analysis, value chain analysis, raw material/consumables overview, vendor selection criteria, PESTLE Analysis, Porter Analysis, and regulatory framework. |
Smart Contact Lens Market Trends
“Integration of Biosensors & Wireless Technology for Real-Time Health Monitoring”
- One prominent trend in the global smart contact lens market is the increasing integration of biosensors and wireless communication technology for continuous, real-time health monitoring
- These innovations enable smart lenses to monitor vital biomarkers such as glucose levels and intraocular pressure, transmitting data seamlessly to external devices for medical analysis and management
- For instance, smart contact lenses equipped with electrochemical and fluorescence-based sensors are being developed to offer non-invasive glucose monitoring, especially for diabetic patients, significantly enhancing patient comfort and compliance
- These technological advancements are redefining personal healthcare, supporting the shift toward preventive and remote monitoring, and are driving the demand for smart contact lenses in both medical and consumer market
Smart Contact Lens Market Dynamics
Driver
“Rising Prevalence of Chronic Diseases and Demand for Non-Invasive Monitoring”
- The increasing prevalence of chronic conditions such as diabetes and glaucoma is a major driver fueling the growth of the smart contact lens market
- These diseases require continuous and precise health monitoring, and smart contact lenses offer a non-invasive, real-time solution to track vital biomarkers such as glucose levels and intraocular pressure
- As more individuals seek treatment for these conditions, the demand for operational microscopes rises, ensuring improved surgical outcomes and reducing the risks associated with eye surgeries
For instance,
- In April 2023, according to the World Health Organization (WHO), over 422 million people worldwide are living with diabetes, with the number expected to increase significantly in the coming decades. The growing burden of chronic diseases underscores the need for innovative and patient-friendly monitoring solutions
- As a result of the increasing burden of chronic health issues and the demand for continuous, comfortable health monitoring technologies, there is a significant rise in the adoption and development of smart contact lenses globally
Opportunity
“Transforming Healthcare Through AI-Driven Smart Lenses”
- The integration of artificial intelligence (AI) with smart contact lenses offers immense potential to revolutionize personalized healthcare by enabling predictive analytics, enhanced diagnostics, and real-time decision support
- AI algorithms can analyze the continuous health data collected by smart lenses—such as glucose levels or intraocular pressure—and detect patterns or anomalies that indicate early stages of disease, allowing for timely intervention
- In addition, AI-powered systems can connect smart lenses with cloud-based health monitoring platforms, enabling healthcare providers to access real-time data remotely and make informed treatment decisions.
For instance,
- In October 2024, according to a study published in Nature Biomedical Engineering, researchers demonstrated an AI-integrated smart lens prototype capable of detecting early diabetic retinopathy by analyzing tear glucose levels and correlating them with AI-predicted progression risks, potentially reducing the need for invasive diagnostics
- the integration of AI in smart contact lenses not only enhances the accuracy and efficiency of disease management but also creates opportunities for remote patient monitoring, early diagnostics, and improved chronic disease outcomes, ultimately leading to better quality of life and reduced healthcare costs
Restraint/Challenge
“High Production Costs and Accessibility Challenges”
- The high cost of manufacturing smart contact lenses remains a significant barrier to widespread market adoption, particularly in developing regions where access to advanced healthcare technologies is limited
- Smart contact lenses, which integrate advanced sensors and wireless communication technologies, often come with substantial production costs, leading to high retail prices that may not be affordable for all consumers or healthcare providers
- This financial challenge can limit the adoption of smart contact lenses, especially in regions with constrained healthcare budgets or lower consumer purchasing power, resulting in a reliance on traditional contact lenses or other less expensive health monitoring alternatives
For instance,
- In August 2023, according to a report from TechSci Research, one of the main challenges for the smart contact lens market is the high cost of development and manufacturing, which affects affordability and limits adoption among patients and healthcare facilities, especially in low-income regions
- Consequently, these high costs could hinder the growth potential of the market, as they pose an obstacle to both consumer penetration and widespread healthcare integration of these advanced lenses. This may lead to disparities in access to cutting-edge healthcare technologies
Smart Contact Lens Market Scope
The market is segmented on the basis of design, material, application, usability, technology, population type, end user, distribution channel
|
Segmentation |
Sub-Segmentation |
|
By Design |
|
|
By Material |
|
|
By Application |
|
|
By U.S.bility
|
|
|
By Technology |
|
|
By Population Type
|
|
|
By End User
|
|
|
By Distribution Channel
|
|
In 2025, the poly (2-Hydroxyethyl Methacrylate) (PHEMA)is projected to dominate the market with a largest share in Material segment
The poly (2-Hydroxyethyl Methacrylate) (PHEMA) segment is expected to dominate the smart contact lens market with the largest share of 33.5% in 2025 due to its high biocompatibility, excellent oxygen permeability, and flexibility, which are crucial for maintaining comfort and safety during prolonged use. In addition, PHEMA's ability to integrate with advanced sensors and wireless technology makes it an ideal material for developing smart lenses, allowing for efficient monitoring of health parameters such as glucose levels or intraocular pressure. Its widespread use and proven track record in conventional contact lenses further contribute to its market dominance
The monitoring is expected to account for the largest share during the forecast period in application market
In 2025, monitoring segment is expected to dominate the market with the largest market share of 61.5% due to its growing prevalence of glaucoma and the need for continuous, non-invasive monitoring of intraocular pressure. Smart contact lenses equipped with pressure-sensing technologies provide a convenient, real-time solution for managing eye health, especially for glaucoma patients who require frequent monitoring. This segment’s dominance is also driven by advancements in sensor technology, improving accuracy and patient compliance in managing intraocular pressure
Smart Contact Lens Market Regional Analysis
“North America Holds the Largest Share in the Smart Contact Lens Market”
- North America dominates the smart contact lens market with a market share of estimated 36.8%, driven, by advanced healthcare infrastructure, high adoption of cutting-edge wearable technologies, and the strong presence of key market players
- U.S. holds a market share of 55.5%, due to increasing demand for non-invasive health monitoring technologies, rising prevalence of chronic diseases such as diabetes and glaucoma, and continuous advancements in smart lens technology
- The availability of well-established health insurance coverage, along with growing investments in R&D by leading companies, further strengthens the market
- In addition, the increasing focus on preventive healthcare and the growing trend of personalized medicine is fueling market expansion across the region
“Asia-Pacific is Projected to Register the Highest CAGR in the Smart Contact Lens Market”
- Asia-Pacific is expected to witness the highest growth rate in the smart contact lens market with a CAGR of 10.2%, driven by rapid expansion in healthcare infrastructure, rising awareness about eye health, and the increasing demand for wearable medical technologies
- Countries such as China, India, and Japan are emerging as key markets due to the growing aging population and the high prevalence of chronic diseases such as diabetes and glaucoma
- Japan, with its advanced medical technology and high adoption of innovative healthcare devices, remains a crucial market for smart contact lenses. The country is focusing on enhancing patient care with non-invasive health monitoring tools
- India is projected to register the highest CAGR of 12.8% in the smart contact lens market, driven by expanding healthcare infrastructure, rising awareness of eye diseases, and increasing adoption of advanced wearable health monitoring technologies
Smart Contact Lens Market Share
The market competitive landscape provides details by competitor. Details included are company overview, company financials, revenue generated, market potential, investment in research and development, new market initiatives, global presence, production sites and facilities, production capacities, company strengths and weaknesses, product launch, product width and breadth, application dominance. The above data points provided are only related to the companies' focus related to market.
The Major Market Leaders Operating in the Market Are:
- Johnson & Johnson Services, Inc. (U.S.)
- Alcon Inc. (U.S.)
- Bausch + Lomb (Canada)
- Mojo Vision (U.S.)
- XPANCEO (UAE)
- Sensimed AG (Switzerland)
- Innovega Inc. (U.S.)
- SAMSUNG (South Korea)
- Sony Corporation (Japan)
- Google LLC (U.S.)
- Medella Health Inc. (Canada)
- Ocumetics Technology Corp. (U.S.)
- Menicon Co., Ltd. (Japan)
- 1-800 Contacts (U.S.)
- Essilor International (France)
- Carl Zeiss AG (Germany)
- CooperVision (U.S.)
- Innolens (U.S.)
- Smartlens Inc. (U.S.)
- Sensimed SA (Switzerland)
Latest Developments in Global Smart Contact Lens Market
- In March 2025, XPANCEO showcased five innovative smart contact lens prototypes at the Mobile World Congress (MWC) in Barcelona. These prototypes include lenses with wireless powering capabilities, intraocular pressure (IOP) sensors for early glaucoma detection, and biosensors for monitoring glucose and hormone levels through tear fluid
- In December 2024, researchers introduced ElectraSight, a non-invasive eye tracking system for smart glasses. This system combines contact and contactless electrooculography (EOG) to achieve high accuracy in eye movement classification, enabling applications in augmented reality and health diagnostics
- In August 2024, XPANCEO unveiled five advanced smart contact lens prototypes. Notable among them was the Smart Contact Lens with Nanoparticles for Color Correction, designed to enhance color perception for individuals with color blindness, and the Smart Contact Lens with a Unique Optical Pattern for Verification, aimed at improving security through dynamic visual effects
- In May 2024, a study published in Advanced Functional Materials presented a smart contact lens capable of monitoring intraocular pressure with high environmental stability. The lens utilizes a capacitive pressure sensor with a porous polydimethylsiloxane (PDMS) structure encased in a hydrogel, demonstrating reliable performance across varying temperatures and conditions
- In January 2023 describes a wireless theranostic smart contact lens designed for monitoring and controlling intraocular pressure (IOP) in glaucoma patients. This lens integrates diagnostic and therapeutic functions, offering a non-invasive approach to managing glaucoma
SKU-

- Interactive Data Analysis Dashboard
- Company Analysis Dashboard for high growth potential opportunities
- Research Analyst Access for customization & queries
- Competitor Analysis with Interactive dashboard
- Latest News, Updates & Trend analysis
- Harness the Power of Benchmark Analysis for Comprehensive Competitor Tracking
Data collection and base year analysis are done using data collection modules with large sample sizes. The stage includes obtaining market information or related data through various sources and strategies. It includes examining and planning all the data acquired from the past in advance. It likewise envelops the examination of information inconsistencies seen across different information sources. The market data is analysed and estimated using market statistical and coherent models. Also, market share analysis and key trend analysis are the major success factors in the market report. To know more, please request an analyst call or drop down your inquiry.
The key research methodology used by DBMR research team is data triangulation which involves data mining, analysis of the impact of data variables on the market and primary (industry expert) validation. Data models include Vendor Positioning Grid, Market Time Line Analysis, Market Overview and Guide, Company Positioning Grid, Patent Analysis, Pricing Analysis, Company Market Share Analysis, Standards of Measurement, Global versus Regional and Vendor Share Analysis. To know more about the research methodology, drop in an inquiry to speak to our industry experts.
Data Bridge Market Research is a leader in advanced formative research. We take pride in servicing our existing and new customers with data and analysis that match and suits their goal. The report can be customized to include price trend analysis of target brands understanding the market for additional countries (ask for the list of countries), clinical trial results data, literature review, refurbished market and product base analysis. Market analysis of target competitors can be analyzed from technology-based analysis to market portfolio strategies. We can add as many competitors that you require data about in the format and data style you are looking for. Our team of analysts can also provide you data in crude raw excel files pivot tables (Fact book) or can assist you in creating presentations from the data sets available in the report.


