
Global Skin Microbiome Market
Market Size in USD Billion
CAGR :
% 
 USD
1.03 Billion
USD
2.86 Billion
2024
2032
USD
1.03 Billion
USD
2.86 Billion
2024
2032
| 2025 –2032 | |
| USD 1.03 Billion | |
| USD 2.86 Billion | |
| % | |
|
Skin Microbiome Market Size
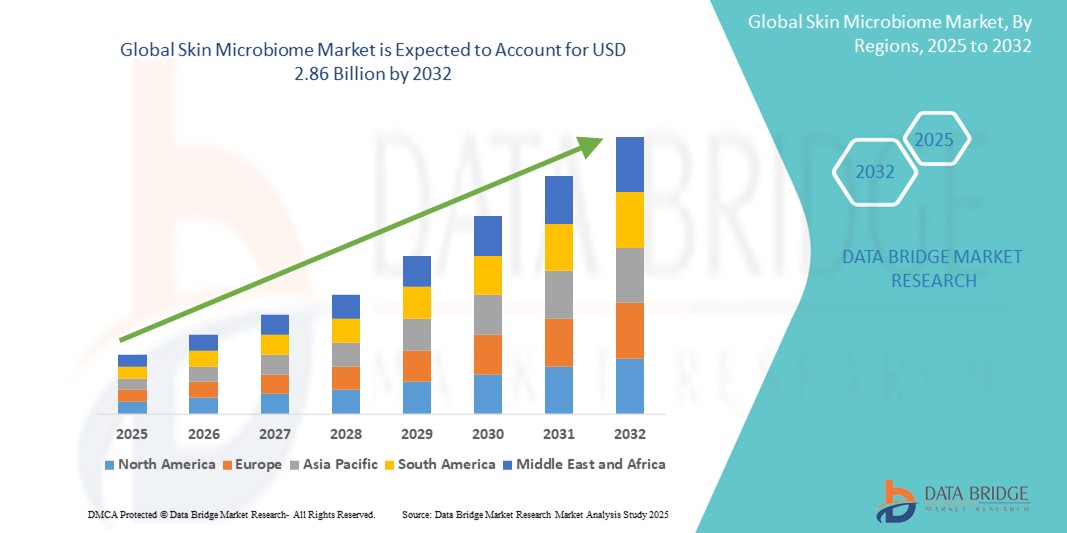
- The global skin microbiome market was valued at USD 1.03 billion in 2024 and is expected to reach USD 2.86 billion by 2032
- During the forecast period of 2025 to 2032 the market is likely to grow at a CAGR of 13.68%, primarily driven by the rising consumer awareness of skin health and the increasing demand for probiotic and microbiome-friendly skincare products
- This growth is driven by factors such as the increasing prevalence of skin disorders, advancements in microbiome research, and rising demand for personalized skincare solutions
Skin Microbiome Market Analysis
- The skin microbiome refers to the community of microorganisms—including bacteria, fungi, viruses, and mites—that naturally live on the skin of humans and other animals. These microbes play a key role in maintaining skin health, protecting against harmful pathogens, supporting the immune system, and even influencing skin conditions such as acne, eczema, and psoriasis
- The growth in this market is significantly driven by increasing consumer awareness about skin microbiota, rising demand for natural and probiotic skincare, and growing interest in personalized beauty and wellness solutions
- North America stands out as one of the dominant regions for the skin microbiome market, driven by a strong presence of major skincare and pharmaceutical companies, high consumer spending on innovative skincare products, and growing demand for wellness-driven beauty solutions
- For instance, the U.S. market has seen a surge in microbiome-focused skincare launches, supported by dermatological research, consumer education, and the rapid growth of direct-to-consumer beauty brands embracing microbiome science
- Globally, skin microbiome-based products are becoming a cornerstone in the evolution of skincare, emerging as a leading category within dermocosmetics and playing a transformative role in the future of skin health and personalized beauty care
Report Scope and Skin Microbiome Market Segmentation
|
Attributes |
Skin Microbiome Key Market Insights |
|
Segments Covered |
|
|
Countries Covered |
North America
Europe
Asia-Pacific
Middle East and Africa
South America
|
|
Key Market Players |
|
|
Market Opportunities |
|
|
Value Added Data Infosets |
In addition to the insights on market scenarios such as market value, growth rate, segmentation, geographical coverage, and major players, the market reports curated by the Data Bridge Market Research also include import export analysis, production capacity overview, production consumption analysis, price trend analysis, climate change scenario, supply chain analysis, value chain analysis, raw material/consumables overview, vendor selection criteria, PESTLE Analysis, Porter Analysis, and regulatory framework. |
Skin Microbiome Market Trends
“Rising Focus on Personalized and Probiotic Skincare Solutions”
- One prominent trend in the global skin microbiome market is the increasing focus on personalized and probiotic skincare solutions tailored to individual skin microbiota profiles
- These innovative approaches aim to balance and support the skin’s natural microbiome, leading to healthier skin and improved management of conditions such as acne, rosacea, and dryness
- For instance, companies are leveraging skin microbiome testing to develop customized skincare regimens based on an individual's unique microbial composition, enhancing efficacy and user satisfaction
- Probiotic and prebiotic formulations are also gaining popularity, as they help nourish beneficial skin bacteria and strengthen the skin barrier, appealing to consumers seeking natural and science-backed skincare
- This trend is transforming the skincare industry by aligning with the growing demand for wellness-focused, science-driven, and personalized beauty products, fueling innovation and growth in the global skin microbiome market
Skin Microbiome Market Dynamics
Driver
“Increasing Skin Disorders and Demand for Natural, Microbiome-Friendly Solutions”
- The growing prevalence of skin disorders such as acne, eczema, rosacea, and psoriasis is a major driver for the increasing demand in the skin microbiome market
- As consumers become more aware of the role the skin microbiome plays in maintaining skin health, there is a rising shift towards products that support and restore the natural balance of skin microorganisms
- Traditional skincare products often contain harsh chemicals that disrupt the skin barrier, leading to increased interest in probiotic, prebiotic, and microbiome-friendly formulations that are gentler and more effective for sensitive or compromised skin
- The Advancements in dermatological and microbiome research have made it possible to create targeted, science-backed skincare solutions that cater to individual microbiome needs, further fueling market growth
- With an increasing number of consumers experiencing chronic or environmentally-triggered skin conditions, the demand for skin microbiome-based products continues to grow as a safer and more holistic alternative to conventional treatments
For instance,
- In June 2023, a study published in the Journal of Investigative Dermatology emphasized the link between disrupted skin microbiota and inflammatory skin conditions such as eczema and acne, suggesting microbiome-based therapies as promising interventions
- In October 2022, the American Academy of Dermatology highlighted growing consumer interest in microbiome-supportive skincare, with dermatologists increasingly recommending microbiome-safe products for sensitive skin management
- As skin disorders become more prevalent and consumers prioritize long-term skin health, the demand for microbiome-focused skincare solutions is expected to accelerate, making it a key driver of growth in the global skin microbiome market
Opportunity
“Leveraging AI and Genomic Technologies for Personalized Skincare”
- The integration of artificial intelligence (AI) and genomic technologies presents a significant opportunity in the global skin microbiome market, enabling the development of highly personalized skincare solutions based on an individual’s unique skin microbiota and genetic profile
- AI-powered platforms can analyze vast datasets from skin microbiome tests, environmental factors, and lifestyle inputs to generate tailored product recommendations, improving skincare efficacy and customer satisfaction
- By combining machine learning with microbiome sequencing, brands can create adaptive skincare regimens that evolve with changes in the user's skin health, environment, or age—offering dynamic, real-time customization
For instance,
- In August 2024, a study published in Frontiers in Microbiology highlighted how AI-driven analysis of skin microbiome samples led to the successful development of individualized skincare treatments, which significantly improved barrier function and reduced inflammation in patients with atopic dermatitis
- In March 2023, a U.S.-based biotech company launched an AI-enabled skin testing kit that combines microbiome data with genomics to deliver hyper-personalized skincare routines, marking a leap forward in precision skincare
- The integration of AI and microbiome science opens new avenues for innovation, allowing brands to offer smarter, data-backed skincare solutions. This not only enhances user experience and product effectiveness but also strengthens consumer trust and loyalty—positioning it as a major growth opportunity for the global skin microbiome market
Restraint/Challenge
“High Development Costs and Regulatory Hurdles Limiting Market Expansion”
- The high costs associated with research, development, and testing of microbiome-based skincare products present a significant challenge for market growth, especially for smaller companies and startups
- These formulating products that effectively support or restore the skin microbiome requires advanced biotechnological processes, clinical trials, and rigorous safety assessments, all of which contribute to increased time and financial investment
- In addition, the evolving and often unclear regulatory landscape surrounding microbiome-focused skincare products adds further complexity, slowing product approvals and limiting market entry for new players
For instance,
- In May 2023, according to a report published by Skin Health Alliance, the development of microbiome-based skincare involves challenges in identifying beneficial strains, ensuring product stability, and proving efficacy through scientific validation—all of which drive up production costs
- In July 2022, the Global Cosmetic Regulatory Summit noted that while interest in microbiome skincare is growing, the absence of standardized global regulations on probiotics and live bacteria in cosmetics is creating uncertainty for manufacturers and limiting international expansion
- Consequently, high development costs and regulatory ambiguity can slow innovation, restrict access to new products, and create disparities in availability across different regions, ultimately restraining the full growth potential of the global skin microbiome market
Skin Microbiome Market Scope
The market is segmented on the basis of type, skin type, and disease.
|
Segmentation |
Sub-Segmentation |
|
By Type |
|
|
By Skin Type |
|
|
By Disease |
|
Skin Microbiome Market Regional Analysis
“North America is the Dominant Region in the Skin Microbiome Market”
- North America leads the global skin microbiome market, driven by high consumer awareness, widespread adoption of probiotic and science-backed skincare, and the strong presence of major skincare and biotechnology companies
- U.S. holds a significant share owing to growing demand for personalized skincare solutions, increased prevalence of skin conditions such as acne and eczema, and an established culture of wellness-focused beauty consumption
- The region benefits from advanced dermatological research capabilities, rising interest in microbiome-based therapeutics, and the proliferation of direct-to-consumer brands utilizing AI and skin testing to deliver personalized product recommendations
- In addition, robust investment in research and development, coupled with collaborations between biotech firms and cosmetic brands, continues to strengthen innovation and commercialization of microbiome-focused products in the region
“Asia-Pacific is Projected to Register the Highest Growth Rate”
- Asia-Pacific is expected to experience the fastest growth in the global skin microbiome market, fueled by rising awareness of skin health, increasing disposable income, and growing demand for clean, natural, and customized skincare
- Countries such as China, South Korea, Japan, and India are emerging as high-potential markets due to their large, youthful populations and expanding interest in skin wellness and preventative skincare solutions
- Japan, known for its cutting-edge beauty innovations and strong regulatory support, remains a leader in microbiome-related skincare technologies. South Korea, with its influential beauty industry, is also driving adoption of microbiome-friendly products
- In China and India, rapid urbanization, environmental stressors, and a growing middle class are contributing to higher incidences of skin conditions, encouraging demand for innovative, microbiome-supportive skincare solutions. The increasing entry of international brands and investment in R&D across the region is further propelling market expansion
Skin Microbiome Market Share
The market competitive landscape provides details by competitor. Details included are company overview, company financials, revenue generated, market potential, investment in research and development, new market initiatives, global presence, production sites and facilities, production capacities, company strengths and weaknesses, product launch, product width and breadth, application dominance. The above data points provided are only related to the companies' focus related to market.
The Major Market Leaders Operating in the Market Are:
- Aurelia London (U.K.)
- GALLINÉE (U.K.)
- Esse Skincare (South Africa)
- S-BIOMEDIC (Belgium)
- Elizabeth Arden (Switzerland)
- YUN (Belgium)
- TULA Life, Inc. (U.S.)
- The Beauty Chef (Australia)
- L’Oreal Paris (France)
- Clinique Laboratories, llc. (U.S.)
- La Roche-Posay (France)
- BEBE & BELLA (U.S.)
- ILDONG PHARMACEUTICAL CO.,LTD. (South Korea)
- AMOREPACIFIC US, INC. (South Korea)
- BELANO medical AG (Germany)
- Interpharma Group (Thailand)
- GLOWBIOTICS (U.S.)
- Börlind GmbH (Germany)
- BIOMILK Skincare (Israel)
- SkinBioTherapeutics PLC (U.K.)
Latest Developments in Global Skin Microbiome Market
- In February 2025, Phyla, a skincare brand backed by Ryan Reynolds, launched a breakthrough acne treatment using bacteriophages to target Cutibacterium acnes, the bacteria primarily responsible for acne. The Acne Phage Serum (USD 70) offers a natural and highly targeted method, with early users reporting notable improvements
- In December 2024, French brand Gallinée released a microbiome-friendly Anti-Ageing Face Recovery Mask, formulated with prebiotics and probiotics to support skin barrier restoration, hydration, and radiance
- In September 2024, Evonik introduced a new lab model that realistically simulates skin microbiota to test cosmetic ingredients. This allows brands to create scientifically validated, microbiome-supporting skincare products
- In March 2024, POND’S launched a Microbiome Analyzer pilot in the Philippines, offering skin swab analysis with AI-driven, personalized skincare recommendations within an hour—part of its mission to deliver science-backed beauty at scale
- In March 2024, New Zealand-based Emma Lewisham’s brand reported NZD USD13 million in sales with projections to double, driven by its commitment to sustainability and microbiome-conscious, natural skincare
SKU-
Get online access to the report on the World's First Market Intelligence Cloud

- Interactive Data Analysis Dashboard
- Company Analysis Dashboard for high growth potential opportunities
- Research Analyst Access for customization & queries
- Competitor Analysis with Interactive dashboard
- Latest News, Updates & Trend analysis
- Harness the Power of Benchmark Analysis for Comprehensive Competitor Tracking
Table of Content
1 INTRODUCTION
1.1 OBJECTIVES OF THE STUDY
1.2 MARKET DEFINITION
1.3 OVERVIEW OF GLOBAL SKIN MICROBIOME MARKET
1.4 CURRENCY AND PRICING
1.5 LIMITATION
1.6 MARKETS COVERED
2 MARKET SEGMENTATION
2.1 KEY TAKEAWAYS
2.2 ARRIVING AT THE GLOBAL SKIN MICROBIOME MARKET SIZE
2.2.1 VENDOR POSITIONING GRID
2.2.2 TECHNOLOGY LIFE LINE CURVE
2.2.3 TRIPOD DATA VALIDATION MODEL
2.2.4 MARKET GUIDE
2.2.5 MULTIVARIATE MODELLING
2.2.6 TOP TO BOTTOM ANALYSIS
2.2.7 CHALLENGE MATRIX
2.2.8 APPLICATION COVERAGE GRID
2.2.9 STANDARDS OF MEASUREMENT
2.2.10 EPIDEMIOLOGY BASED MODEL
2.2.11 VENDOR SHARE ANALYSIS
2.2.12 DATA POINTS FROM KEY PRIMARY INTERVIEWS
2.2.13 DATA POINTS FROM KEY SECONDARY DATABASES
2.3 GLOBAL SKIN MICROBIOME MARKET: RESEARCH SNAPSHOT
2.4 ASSUMPTIONS
3 MARKET OVERVIEW
3.1 DRIVERS
3.2 RESTRAINTS
3.3 OPPORTUNITIES
3.4 CHALLENGES
4 EXECUTIVE SUMMARY
5 PREMIUM INSIGHTS
5.1 REGULATORY SCENARIO
5.2 PESTEL ANALYSIS
5.3 PORTER’S 5 FORCES
5.4 REIMBURSMENT SCENARIO
6 INDUSTRY INSIGHTS
7 REGULATORY FRAMEWORK
8 GLOBAL SKIN MICROBIOME MARKET, BY PRODUCT
9 NOTE: MARKET VALUE, VOLUME AND ASP ANALYSIS WOULD BE PROVIDED FOR ALL SEGMENTS AND SUB-SEGMENTS OF PRODUCT)
9.1 OVERVIEW
9.2 PROBIOTIC
9.2.1 LACTOCOCCUS
9.2.1.1. TOPICAL
9.2.1.1.1. SPRAY
9.2.1.1.1.1 MARKET VALUE(USD MILLION)
9.2.1.1.1.2 MARKET VOLUME(UNITS)
9.2.1.1.1.3 AVERAGE SELLING PRICE(ASP)
9.2.1.1.2. SERUM
9.2.1.1.2.1 MARKET VALUE(USD MILLION)
9.2.1.1.2.2 MARKET VOLUME(UNITS)
9.2.1.1.2.3 AVERAGE SELLING PRICE(ASP)
9.2.1.1.3. MOISTURIZER
9.2.1.1.3.1 MARKET VALUE(USD MILLION)
9.2.1.1.3.2 MARKET VOLUME(UNITS)
9.2.1.1.3.3 AVERAGE SELLING PRICE(ASP)
9.2.1.1.4. OIL
9.2.1.1.4.1 MARKET VALUE(USD MILLION)
9.2.1.1.4.2 MARKET VOLUME(UNITS)
9.2.1.1.4.3 AVERAGE SELLING PRICE(ASP)
9.2.1.1.5. CLEANSER
9.2.1.1.5.1 MARKET VALUE(USD MILLION)
9.2.1.1.5.2 MARKET VOLUME(UNITS)
9.2.1.1.5.3 AVERAGE SELLING PRICE(ASP)
9.2.1.1.6. GELS
9.2.1.1.6.1 MARKET VALUE(USD MILLION)
9.2.1.1.6.2 MARKET VOLUME(UNITS)
9.2.1.1.6.3 AVERAGE SELLING PRICE(ASP)
9.2.1.1.7. MASKS
9.2.1.1.7.1 MARKET VALUE(USD MILLION)
9.2.1.1.7.2 MARKET VOLUME(UNITS)
9.2.1.1.7.3 AVERAGE SELLING PRICE(ASP)
9.2.1.1.8. PRIMERS
9.2.1.1.8.1 MARKET VALUE(USD MILLION)
9.2.1.1.8.2 MARKET VOLUME(UNITS)
9.2.1.1.8.3 AVERAGE SELLING PRICE(ASP)
9.2.1.1.9. OTHERS
9.2.1.2. ORAL
9.2.1.3. OTHERS
9.2.2 BIFIDOBACTERIUM
9.2.2.1. TOPICAL
9.2.2.1.1. SPRAY
9.2.2.1.1.1 MARKET VALUE(USD MILLION)
9.2.2.1.1.2 MARKET VOLUME(UNITS)
9.2.2.1.1.3 AVERAGE SELLING PRICE(ASP)
9.2.2.1.2. SERUM
9.2.2.1.2.1 MARKET VALUE(USD MILLION)
9.2.2.1.2.2 MARKET VOLUME(UNITS)
9.2.2.1.2.3 AVERAGE SELLING PRICE(ASP)
9.2.2.1.3. MOISTURIZER
9.2.2.1.3.1 MARKET VALUE(USD MILLION)
9.2.2.1.3.2 MARKET VOLUME(UNITS)
9.2.2.1.3.3 AVERAGE SELLING PRICE(ASP)
9.2.2.1.4. OIL
9.2.2.1.4.1 MARKET VALUE(USD MILLION)
9.2.2.1.4.2 MARKET VOLUME(UNITS)
9.2.2.1.4.3 AVERAGE SELLING PRICE(ASP)
9.2.2.1.5. CLEANSER
9.2.2.1.5.1 MARKET VALUE(USD MILLION)
9.2.2.1.5.2 MARKET VOLUME(UNITS)
9.2.2.1.5.3 AVERAGE SELLING PRICE(ASP)
9.2.2.1.6. GELS
9.2.2.1.6.1 MARKET VALUE(USD MILLION)
9.2.2.1.6.2 MARKET VOLUME(UNITS)
9.2.2.1.6.3 AVERAGE SELLING PRICE(ASP)
9.2.2.1.7. MASKS
9.2.2.1.7.1 MARKET VALUE(USD MILLION)
9.2.2.1.7.2 MARKET VOLUME(UNITS)
9.2.2.1.7.3 AVERAGE SELLING PRICE(ASP)
9.2.2.1.8. PRIMERS
9.2.2.1.8.1 MARKET VALUE(USD MILLION)
9.2.2.1.8.2 MARKET VOLUME(UNITS)
9.2.2.1.8.3 AVERAGE SELLING PRICE(ASP)
9.2.2.1.9. OTHERS
9.2.2.2. ORAL
9.2.2.3. OTHERS
9.2.3 STREPTOCOCCUS THERMOPHILUS
9.2.3.1. TOPICAL
9.2.3.1.1. SPRAY
9.2.3.1.1.1 MARKET VALUE(USD MILLION)
9.2.3.1.1.2 MARKET VOLUME(UNITS)
9.2.3.1.1.3 AVERAGE SELLING PRICE(ASP)
9.2.3.1.2. SERUM
9.2.3.1.2.1 MARKET VALUE(USD MILLION)
9.2.3.1.2.2 MARKET VOLUME(UNITS)
9.2.3.1.2.3 AVERAGE SELLING PRICE(ASP)
9.2.3.1.3. MOISTURIZER
9.2.3.1.3.1 MARKET VALUE(USD MILLION)
9.2.3.1.3.2 MARKET VOLUME(UNITS)
9.2.3.1.3.3 AVERAGE SELLING PRICE(ASP)
9.2.3.1.4. OIL
9.2.3.1.4.1 MARKET VALUE(USD MILLION)
9.2.3.1.4.2 MARKET VOLUME(UNITS)
9.2.3.1.4.3 AVERAGE SELLING PRICE(ASP)
9.2.3.1.5. CLEANSER
9.2.3.1.5.1 MARKET VALUE(USD MILLION)
9.2.3.1.5.2 MARKET VOLUME(UNITS)
9.2.3.1.5.3 AVERAGE SELLING PRICE(ASP)
9.2.3.1.6. GELS
9.2.3.1.6.1 MARKET VALUE(USD MILLION)
9.2.3.1.6.2 MARKET VOLUME(UNITS)
9.2.3.1.6.3 AVERAGE SELLING PRICE(ASP)
9.2.3.1.7. MASKS
9.2.3.1.7.1 MARKET VALUE(USD MILLION)
9.2.3.1.7.2 MARKET VOLUME(UNITS)
9.2.3.1.7.3 AVERAGE SELLING PRICE(ASP)
9.2.3.1.8. PRIMERS
9.2.3.1.8.1 MARKET VALUE(USD MILLION)
9.2.3.1.8.2 MARKET VOLUME(UNITS)
9.2.3.1.8.3 AVERAGE SELLING PRICE(ASP)
9.2.3.1.9. OTHERS
9.2.3.2. ORAL
9.2.3.3. OTHERS
9.2.4 SACCHAROMYCES
9.2.4.1. TOPICAL
9.2.4.1.1. SPRAY
9.2.4.1.1.1 MARKET VALUE(USD MILLION)
9.2.4.1.1.2 MARKET VOLUME(UNITS)
9.2.4.1.1.3 AVERAGE SELLING PRICE(ASP)
9.2.4.1.2. SERUM
9.2.4.1.2.1 MARKET VALUE(USD MILLION)
9.2.4.1.2.2 MARKET VOLUME(UNITS)
9.2.4.1.2.3 AVERAGE SELLING PRICE(ASP)
9.2.4.1.3. MOISTURIZER
9.2.4.1.3.1 MARKET VALUE(USD MILLION)
9.2.4.1.3.2 MARKET VOLUME(UNITS)
9.2.4.1.3.3 AVERAGE SELLING PRICE(ASP)
9.2.4.1.4. OIL
9.2.4.1.4.1 MARKET VALUE(USD MILLION)
9.2.4.1.4.2 MARKET VOLUME(UNITS)
9.2.4.1.4.3 AVERAGE SELLING PRICE(ASP)
9.2.4.1.5. CLEANSER
9.2.4.1.5.1 MARKET VALUE(USD MILLION)
9.2.4.1.5.2 MARKET VOLUME(UNITS)
9.2.4.1.5.3 AVERAGE SELLING PRICE(ASP)
9.2.4.1.6. GELS
9.2.4.1.6.1 MARKET VALUE(USD MILLION)
9.2.4.1.6.2 MARKET VOLUME(UNITS)
9.2.4.1.6.3 AVERAGE SELLING PRICE(ASP)
9.2.4.1.7. MASKS
9.2.4.1.7.1 MARKET VALUE(USD MILLION)
9.2.4.1.7.2 MARKET VOLUME(UNITS)
9.2.4.1.7.3 AVERAGE SELLING PRICE(ASP)
9.2.4.1.8. PRIMERS
9.2.4.1.8.1 MARKET VALUE(USD MILLION)
9.2.4.1.8.2 MARKET VOLUME(UNITS)
9.2.4.1.8.3 AVERAGE SELLING PRICE(ASP)
9.2.4.1.9. OTHERS
9.2.4.2. ORAL
9.2.4.3. OTHERS
9.2.5 LACTOBACILLUS
9.2.5.1. TOPICAL
9.2.5.1.1. SPRAY
9.2.5.1.1.1 MARKET VALUE(USD MILLION)
9.2.5.1.1.2 MARKET VOLUME(UNITS)
9.2.5.1.1.3 AVERAGE SELLING PRICE(ASP)
9.2.5.1.2. SERUM
9.2.5.1.2.1 MARKET VALUE(USD MILLION)
9.2.5.1.2.2 MARKET VOLUME(UNITS)
9.2.5.1.2.3 AVERAGE SELLING PRICE(ASP)
9.2.5.1.3. MOISTURIZER
9.2.5.1.3.1 MARKET VALUE(USD MILLION)
9.2.5.1.3.2 MARKET VOLUME(UNITS)
9.2.5.1.3.3 AVERAGE SELLING PRICE(ASP)
9.2.5.1.4. OIL
9.2.5.1.4.1 MARKET VALUE(USD MILLION)
9.2.5.1.4.2 MARKET VOLUME(UNITS)
9.2.5.1.4.3 AVERAGE SELLING PRICE(ASP)
9.2.5.1.5. CLEANSER
9.2.5.1.5.1 MARKET VALUE(USD MILLION)
9.2.5.1.5.2 MARKET VOLUME(UNITS)
9.2.5.1.5.3 AVERAGE SELLING PRICE(ASP)
9.2.5.1.6. GELS
9.2.5.1.6.1 MARKET VALUE(USD MILLION)
9.2.5.1.6.2 MARKET VOLUME(UNITS)
9.2.5.1.6.3 AVERAGE SELLING PRICE(ASP)
9.2.5.1.7. MASKS
9.2.5.1.7.1 MARKET VALUE(USD MILLION)
9.2.5.1.7.2 MARKET VOLUME(UNITS)
9.2.5.1.7.3 AVERAGE SELLING PRICE(ASP)
9.2.5.1.8. PRIMERS
9.2.5.1.8.1 MARKET VALUE(USD MILLION)
9.2.5.1.8.2 MARKET VOLUME(UNITS)
9.2.5.1.8.3 AVERAGE SELLING PRICE(ASP)
9.2.5.1.9. OTHERS
9.2.5.2. ORAL
9.2.5.3. OTHERS
9.2.6 LEUCONOSTOC
9.2.6.1. TOPICAL
9.2.6.1.1. SPRAY
9.2.6.1.1.1 MARKET VALUE(USD MILLION)
9.2.6.1.1.2 MARKET VOLUME(UNITS)
9.2.6.1.1.3 AVERAGE SELLING PRICE(ASP)
9.2.6.1.2. SERUM
9.2.6.1.2.1 MARKET VALUE(USD MILLION)
9.2.6.1.2.2 MARKET VOLUME(UNITS)
9.2.6.1.2.3 AVERAGE SELLING PRICE(ASP)
9.2.6.1.3. MOISTURIZER
9.2.6.1.3.1 MARKET VALUE(USD MILLION)
9.2.6.1.3.2 MARKET VOLUME(UNITS)
9.2.6.1.3.3 AVERAGE SELLING PRICE(ASP)
9.2.6.1.4. OIL
9.2.6.1.4.1 MARKET VALUE(USD MILLION)
9.2.6.1.4.2 MARKET VOLUME(UNITS)
9.2.6.1.4.3 AVERAGE SELLING PRICE(ASP)
9.2.6.1.5. CLEANSER
9.2.6.1.5.1 MARKET VALUE(USD MILLION)
9.2.6.1.5.2 MARKET VOLUME(UNITS)
9.2.6.1.5.3 AVERAGE SELLING PRICE(ASP)
9.2.6.1.6. GELS
9.2.6.1.6.1 MARKET VALUE(USD MILLION)
9.2.6.1.6.2 MARKET VOLUME(UNITS)
9.2.6.1.6.3 AVERAGE SELLING PRICE(ASP)
9.2.6.1.7. MASKS
9.2.6.1.7.1 MARKET VALUE(USD MILLION)
9.2.6.1.7.2 MARKET VOLUME(UNITS)
9.2.6.1.7.3 AVERAGE SELLING PRICE(ASP)
9.2.6.1.8. PRIMERS
9.2.6.1.8.1 MARKET VALUE(USD MILLION)
9.2.6.1.8.2 MARKET VOLUME(UNITS)
9.2.6.1.8.3 AVERAGE SELLING PRICE(ASP)
9.2.6.1.9. OTHERS
9.2.6.2. ORAL
9.2.6.3. OTHERS
9.3 PREBIOTIC
9.3.1 PLANT BASED
9.3.2 SYNTHESIZED
9.4 OTHERS
10 GLOBAL SKIN MICROBIOME MARKET, BY TYPES
10.1 OVERVIEW
10.2 RESIDENT MICROORGANISMS
10.3 TRANSIENT BACTERIA
11 GLOBAL SKIN MICROBIOME MARKET, BY DISEASE
11.1 OVERVIEW
11.2 ATOPIC DERMATITIS
11.3 ACNE VULGARIS
11.4 ROSACEA
11.5 PSORIASIS VULGARIS
11.6 ATOPIC DERMATITIS
11.7 PEMPHIGUS
11.8 ALOPECIA AREATA
11.9 EPIDERMOLYSIS BULLOSA
11.1 SCLERODERMA
11.11 ICHTHYOSIS
11.12 VITILIGO
11.13 OTHERS
12 GLOBAL SKIN MICROBIOME MARKET, BY ROUTE OF ADMINISTRATION
12.1 OVERVIEW
12.2 TOPICAL
12.3 ORAL
13 GLOBAL SKIN MICROBIOME MARKET, BY SKIN TYPE
13.1 OVERVIEW
13.2 MOIST SKIN
13.2.1 TOPICAL
13.2.2 ORAL
13.3 DRY SKIN
13.3.1 TOPICAL
13.3.2 ORAL
13.4 OILY SKIN
13.4.1 TOPICAL
13.4.2 ORAL
13.5 OTHER
14 GLOBAL SKIN MICROBIOME MARKET, BY POPULATION TYPE
14.1 OVERVIEW
14.2 MEN
14.3 WOMEN
14.4 CHILDREN
15 GLOBAL SKIN MICROBIOME MARKET, BY END USER
15.1 OVERVIEW
15.2 HOSPITALS
15.3 DERMATOLOGY HOSPITAL
15.4 SPECILITY HOSPITALS
15.5 SPA OR SALON
15.6 BEAUTY PARLERS
15.7 HOME HEALTHCARE
15.8 OTHERS
16 GLOBAL SKIN MICROBIOME MARKET, BY DISTRIBUTION CHANNEL
16.1 OVERVIEW
16.2 HOSPITAL PHARMACIES
16.3 RETAIL SALES
16.3.1 DRUG STORE
16.3.2 COMPANY OWNED BRANDED STORE
16.3.3 MULTIBRANDED STORE
16.3.4 OTHER
16.4 ONLINE SALES
16.4.1 COMPANY OWNED WEBSITE
16.4.2 E- COMMERCE WEBSITES
16.4.3 ONLINE PHARMACY
16.5 OTHER
17 GLOBAL SKIN MICROBIOME MARKET, COMPANY LANDSCAPE
17.1 COMPANY SHARE ANALYSIS: GLOBAL
17.2 COMPANY SHARE ANALYSIS: NORTH AMERICA
17.3 COMPANY SHARE ANALYSIS: EUROPE
17.4 COMPANY SHARE ANALYSIS: ASIA-PACIFIC
17.5 MERGERS & ACQUISITIONS
17.6 NEW PRODUCT DEVELOPMENT & APPROVALS
17.7 EXPANSIONS
17.8 REGULATORY CHANGES
17.9 PARTNERSHIP AND OTHER STRATEGIC DEVELOPMENTS
17.1
18 GLOBAL SKIN MICROBIOME MARKET, BY COUNTRY
GLOBAL SKIN MICROBIOME MARKET (ALL SEGMENTATION PROVIDED ABOVE IS REPRESENTED IN THIS CHAPTER BY COUNTRY)
18.1 NORTH AMERICA
18.1.1 U.S.
18.1.2 CANADA
18.1.3 MEXICO
18.2 EUROPE
18.2.1 GERMANY
18.2.2 U.K.
18.2.3 ITALY
18.2.4 FRANCE
18.2.5 SPAIN
18.2.6 RUSSIA
18.2.7 SWITZERLAND
18.2.8 TURKEY
18.2.9 BELGIUM
18.2.10 NETHERLANDS
18.2.11 DENMARK
18.2.12 SWEDEN
18.2.13 POLAND
18.2.14 NORWAY
18.2.15 FINLAND
18.2.16 REST OF EUROPE
18.3 ASIA-PACIFIC
18.3.1 JAPAN
18.3.2 CHINA
18.3.3 SOUTH KOREA
18.3.4 INDIA
18.3.5 SINGAPORE
18.3.6 THAILAND
18.3.7 INDONESIA
18.3.8 MALAYSIA
18.3.9 PHILIPPINES
18.3.10 AUSTRALIA
18.3.11 NEW ZEALAND
18.3.12 VIETNAM
18.3.13 TAIWAN
18.3.14 REST OF ASIA-PACIFIC
18.4 SOUTH AMERICA
18.4.1 BRAZIL
18.4.2 ARGENTINA
18.4.3 REST OF SOUTH AMERICA
18.5 MIDDLE EAST AND AFRICA
18.5.1 SOUTH AFRICA
18.5.2 EGYPT
18.5.3 BAHRAIN
18.5.4 UNITED ARAB EMIRATES
18.5.5 KUWAIT
18.5.6 OMAN
18.5.7 QATAR
18.5.8 SAUDI ARABIA
18.5.9 REST OF MEA
18.6 KEY PRIMARY INSIGHTS: BY MAJOR COUNTRIES
19 GLOBAL SKIN MICROBIOME MARKET, SWOT AND DBMR ANALYSIS
20 GLOBAL SKIN MICROBIOME MARKET, COMPANY PROFILE
20.1 AURELIA LONDON
20.1.1 COMPANY OVERVIEW
20.1.2 REVENUE ANALYSIS
20.1.3 GEOGRAPHIC PRESENCE
20.1.4 PRODUCT PORTFOLIO
20.1.5 RECENT DEVELOPMENTS
20.2 GALLINÉE.
20.2.1 COMPANY OVERVIEW
20.2.2 REVENUE ANALYSIS
20.2.3 GEOGRAPHIC PRESENCE
20.2.4 PRODUCT PORTFOLIO
20.2.5 RECENT DEVELOPMENTS
20.3 DAKOTA BIOTECH
20.3.1 COMPANY OVERVIEW
20.3.2 REVENUE ANALYSIS
20.3.3 GEOGRAPHIC PRESENCE
20.3.4 PRODUCT PORTFOLIO
20.3.5 RECENT DEVELOPMENTS
20.4 MOTHER DIRT'S
20.4.1 COMPANY OVERVIEW
20.4.2 REVENUE ANALYSIS
20.4.3 GEOGRAPHIC PRESENCE
20.4.4 PRODUCT PORTFOLIO
20.4.5 RECENT DEVELOPMENTS
20.5 ESSE SKINCARE
20.5.1 COMPANY OVERVIEW
20.5.2 REVENUE ANALYSIS
20.5.3 GEOGRAPHIC PRESENCE
20.5.4 PRODUCT PORTFOLIO
20.5.5 RECENT DEVELOPMENTS
20.6 S-BIOMEDIC
20.6.1 COMPANY OVERVIEW
20.6.2 REVENUE ANALYSIS
20.6.3 GEOGRAPHIC PRESENCE
20.6.4 PRODUCT PORTFOLIO
20.6.5 RECENT DEVELOPMENTS
20.7 ELIZABETH ARDEN
20.7.1 COMPANY OVERVIEW
20.7.2 REVENUE ANALYSIS
20.7.3 GEOGRAPHIC PRESENCE
20.7.4 PRODUCT PORTFOLIO
20.7.5 RECENT DEVELOPMENTS
20.8 YUN PEROBIOTHERAPY
20.8.1 COMPANY OVERVIEW
20.8.2 REVENUE ANALYSIS
20.8.3 GEOGRAPHIC PRESENCE
20.8.4 PRODUCT PORTFOLIO
20.8.5 RECENT DEVELOPMENTS
20.9 TULA LIFE, INC
20.9.1 COMPANY OVERVIEW
20.9.2 REVENUE ANALYSIS
20.9.3 GEOGRAPHIC PRESENCE
20.9.4 PRODUCT PORTFOLIO
20.9.5 RECENT DEVELOPMENTS
20.1 THE BEAUTY CHEF.
20.10.1 COMPANY OVERVIEW
20.10.2 REVENUE ANALYSIS
20.10.3 GEOGRAPHIC PRESENCE
20.10.4 PRODUCT PORTFOLIO
20.10.5 RECENT DEVELOPMENTS
20.11 L’OREAL PARIS
20.11.1 COMPANY OVERVIEW
20.11.2 REVENUE ANALYSIS
20.11.3 GEOGRAPHIC PRESENCE
20.11.4 PRODUCT PORTFOLIO
20.11.5 RECENT DEVELOPMENTS
20.12 CLINIQUE LABORATORIES, LLC.
20.12.1 COMPANY OVERVIEW
20.12.2 REVENUE ANALYSIS
20.12.3 GEOGRAPHIC PRESENCE
20.12.4 PRODUCT PORTFOLIO
20.12.5 RECENT DEVELOPMENTS
20.13 LA ROCHE-POSAY
20.13.1 COMPANY OVERVIEW
20.13.2 REVENUE ANALYSIS
20.13.3 GEOGRAPHIC PRESENCE
20.13.4 PRODUCT PORTFOLIO
20.13.5 RECENT DEVELOPMENTS
20.14 BEBE & BELLA, LLC.
20.14.1 COMPANY OVERVIEW
20.14.2 REVENUE ANALYSIS
20.14.3 GEOGRAPHIC PRESENCE
20.14.4 PRODUCT PORTFOLIO
20.14.5 RECENT DEVELOPMENTS
20.15 AMOREPACIFIC,
20.15.1 COMPANY OVERVIEW
20.15.2 REVENUE ANALYSIS
20.15.3 GEOGRAPHIC PRESENCE
20.15.4 PRODUCT PORTFOLIO
20.15.5 RECENT DEVELOPMENTS
20.16 BELANO MEDICAL AG
20.16.1 COMPANY OVERVIEW
20.16.2 REVENUE ANALYSIS
20.16.3 GEOGRAPHIC PRESENCE
20.16.4 PRODUCT PORTFOLIO
20.16.5 RECENT DEVELOPMENTS
20.17 GLOWBIOTICS LLC
20.17.1 COMPANY OVERVIEW
20.17.2 REVENUE ANALYSIS
20.17.3 GEOGRAPHIC PRESENCE
20.17.4 PRODUCT PORTFOLIO
20.17.5 RECENT DEVELOPMENTS
20.18 AOBIOME
20.18.1 COMPANY OVERVIEW
20.18.2 REVENUE ANALYSIS
20.18.3 GEOGRAPHIC PRESENCE
20.18.4 PRODUCT PORTFOLIO
20.18.5 RECENT DEVELOPMENTS
20.19 LAFLORE
20.19.1 COMPANY OVERVIEW
20.19.2 REVENUE ANALYSIS
20.19.3 GEOGRAPHIC PRESENCE
20.19.4 PRODUCT PORTFOLIO
20.19.5 RECENT DEVELOPMENTS
20.2 ESTÉE LAUDER INC
20.20.1 COMPANY OVERVIEW
20.20.2 REVENUE ANALYSIS
20.20.3 GEOGRAPHIC PRESENCE
20.20.4 PRODUCT PORTFOLIO
20.20.5 RECENT DEVELOPMENTS
20.21 ALGENIST
20.21.1 COMPANY OVERVIEW
20.21.2 REVENUE ANALYSIS
20.21.3 GEOGRAPHIC PRESENCE
20.21.4 PRODUCT PORTFOLIO
20.21.5 RECENT DEVELOPMENTS
20.22 BEBE & BELLA
20.22.1 COMPANY OVERVIEW
20.22.2 REVENUE ANALYSIS
20.22.3 GEOGRAPHIC PRESENCE
20.22.4 PRODUCT PORTFOLIO
20.22.5 RECENT DEVELOPMENTS
20.23 DSM
20.23.1 COMPANY OVERVIEW
20.23.2 REVENUE ANALYSIS
20.23.3 GEOGRAPHIC PRESENCE
20.23.4 PRODUCT PORTFOLIO
20.23.5 RECENT DEVELOPMENTS
20.24 EMINENCE ORGANIC SKIN CARE
20.24.1 COMPANY OVERVIEW
20.24.2 REVENUE ANALYSIS
20.24.3 GEOGRAPHIC PRESENCE
20.24.4 PRODUCT PORTFOLIO
20.24.5 RECENT DEVELOPMENTS
20.25 BIOPHILE
20.25.1 COMPANY OVERVIEW
20.25.2 REVENUE ANALYSIS
20.25.3 GEOGRAPHIC PRESENCE
20.25.4 PRODUCT PORTFOLIO
20.25.5 RECENT DEVELOPMENTS
20.26 PIERRE FABRE GROUP
20.26.1 COMPANY OVERVIEW
20.26.2 REVENUE ANALYSIS
20.26.3 GEOGRAPHIC PRESENCE
20.26.4 PRODUCT PORTFOLIO
20.26.5 RECENT DEVELOPMENTS
20.27 SIOLTA THERAPEUTICS
20.27.1 COMPANY OVERVIEW
20.27.2 REVENUE ANALYSIS
20.27.3 GEOGRAPHIC PRESENCE
20.27.4 PRODUCT PORTFOLIO
20.27.5 RECENT DEVELOPMENTS
20.28 IORA INDIA
20.28.1 COMPANY OVERVIEW
20.28.2 REVENUE ANALYSIS
20.28.3 GEOGRAPHIC PRESENCE
20.28.4 PRODUCT PORTFOLIO
20.28.5 RECENT DEVELOPMENTS
20.29 PROTA SKINCARE
20.29.1 COMPANY OVERVIEW
20.29.2 REVENUE ANALYSIS
20.29.3 GEOGRAPHIC PRESENCE
20.29.4 PRODUCT PORTFOLIO
20.29.5 RECENT DEVELOPMENTS
20.3 SABINSA.
20.30.1 COMPANY OVERVIEW
20.30.2 REVENUE ANALYSIS
20.30.3 GEOGRAPHIC PRESENCE
20.30.4 PRODUCT PORTFOLIO
20.30.5 RECENT DEVELOPMENTS
NOTE: THE COMPANIES PROFILED IS NOT EXHAUSTIVE LIST AND IS AS PER OUR PREVIOUS CLIENT REQUIREMENT. WE PROFILE MORE THAN 100 COMPANIES IN OUR STUDY AND HENCE THE LIST OF COMPANIES CAN BE MODIFIED OR REPLACED ON REQUEST
21 RELATED REPORTS
22 CONCLUSION
23 QUESTIONNAIRE
24 ABOUT DATA BRIDGE MARKET RESEARCH
Research Methodology
Data collection and base year analysis are done using data collection modules with large sample sizes. The stage includes obtaining market information or related data through various sources and strategies. It includes examining and planning all the data acquired from the past in advance. It likewise envelops the examination of information inconsistencies seen across different information sources. The market data is analysed and estimated using market statistical and coherent models. Also, market share analysis and key trend analysis are the major success factors in the market report. To know more, please request an analyst call or drop down your inquiry.
The key research methodology used by DBMR research team is data triangulation which involves data mining, analysis of the impact of data variables on the market and primary (industry expert) validation. Data models include Vendor Positioning Grid, Market Time Line Analysis, Market Overview and Guide, Company Positioning Grid, Patent Analysis, Pricing Analysis, Company Market Share Analysis, Standards of Measurement, Global versus Regional and Vendor Share Analysis. To know more about the research methodology, drop in an inquiry to speak to our industry experts.
Customization Available
Data Bridge Market Research is a leader in advanced formative research. We take pride in servicing our existing and new customers with data and analysis that match and suits their goal. The report can be customized to include price trend analysis of target brands understanding the market for additional countries (ask for the list of countries), clinical trial results data, literature review, refurbished market and product base analysis. Market analysis of target competitors can be analyzed from technology-based analysis to market portfolio strategies. We can add as many competitors that you require data about in the format and data style you are looking for. Our team of analysts can also provide you data in crude raw excel files pivot tables (Fact book) or can assist you in creating presentations from the data sets available in the report.

