
Global Safety Sensors Market
Market Size in USD Billion
 USD
614.14 Billion
USD
832.76 Billion
2024
2032
USD
614.14 Billion
USD
832.76 Billion
2024
2032
| 2025 - 2032 | |
| USD 614.14 Billion | |
| USD 832.76 Billion | |
| % | |
|
Safety Sensors Market Size
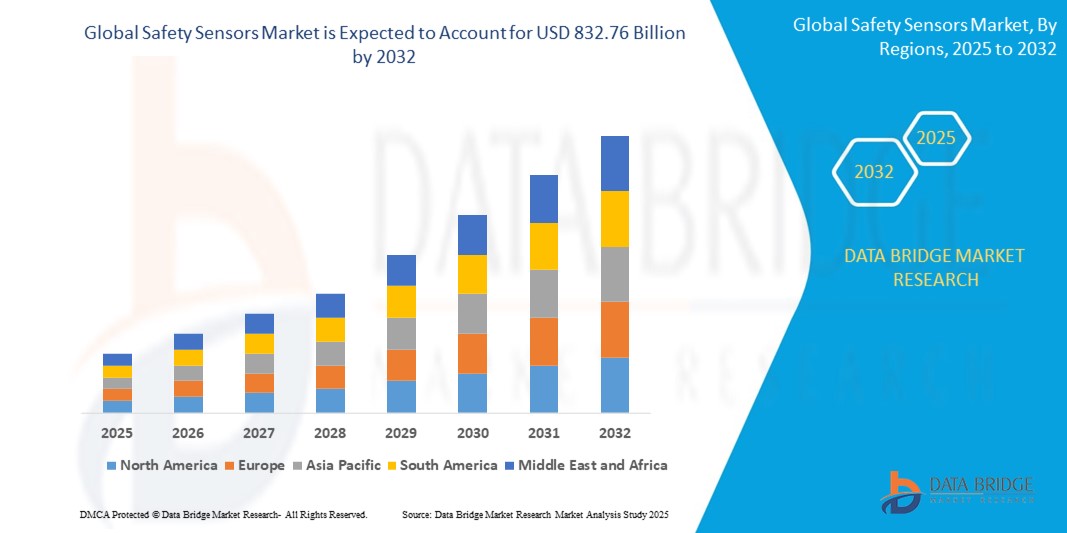
- The global safety sensors market size was valued at USD 614.14 billion in 2024 and is expected to reach USD 832.76 billion by 2032, at a CAGR of 3.88% during the forecast period
- The market growth is largely fueled by the increasing adoption of industrial automation, growing concerns about worker safety, and the rising demand for robust safety solutions in hazardous environments
- Increasing regulatory mandates and industry standards for workplace safety are further propelling the demand for safety sensors across manufacturing, construction, and other industrial sectors
Safety Sensors Market Analysis
- The safety sensors market is witnessing steady growth as more industries prioritize accident prevention and operational efficiency through advanced safety systems.
- Growing demand from both established and emerging industrial sectors is encouraging manufacturers to innovate with high-performance, reliable, and integrated safety sensor solutions.
- North America dominates the safety sensors market with the largest revenue share of 38.7% in 2024, driven by a mature industrial base and increasing adoption of automation and robotics in manufacturing.
- Asia-Pacific is expected to be the fastest-growing region in the safety sensors market during the forecast period, driven by rapid industrialization, increasing foreign investments in manufacturing, and rising awareness of occupational safety, particularly in countries such as China, India, and Southeast Asian nations.
- The safety light curtain segment holds the largest market revenue share of 35.5% in 2024, supported by their widespread adoption in machinery and industrial automation for safeguarding personnel from hazardous operations. Growing emphasis on "zero-harm" policies in manufacturing and increasing investments in automated production lines are also fueling this growth.
Report Scope and Safety Sensors Market Segmentation
|
Attributes |
Safety Sensors Key Market Insights |
|
Segments Covered |
|
|
Countries Covered |
North America
Europe
Asia-Pacific
Middle East and Africa
South America
|
|
Key Market Players |
|
|
Market Opportunities |
|
|
Value Added Data Infosets |
In addition to the insights on market scenarios such as market value, growth rate, segmentation, geographical coverage, and major players, the market reports curated by the Data Bridge Market Research also include in-depth expert analysis, geographically represented company-wise production and capacity, network layouts of distributors and partners, detailed and updated price trend analysis and deficit analysis of supply chain and demand. |
Safety Sensors Market Trends
“Growing Integration for IoT-Integrated Safety Sensors”
- IoT-integrated safety sensors are gaining traction due to their ability to provide real-time monitoring, predictive maintenance, and data-driven safety insights
- These sensors enable seamless integration with smart factory systems, enhancing operational efficiency and safety compliance
- In industries such as manufacturing and oil and gas, IoT safety sensors are preferred for their ability to reduce downtime and enhance worker safety
- For instance, Siemens offers IoT-enabled safety sensors for predictive maintenance in smart factories
- End users, particularly in logistics and automotive manufacturing, are adopting these sensors to comply with stringent safety regulations while optimizing processes
- In regions with high industrial activity, such as Germany and China, IoT safety sensors are increasingly integrated into automated production lines
Safety Sensors Market Dynamics
Driver
“Increasing Focus on Workplace Safety and Regulatory Compliance”
- Stringent safety regulations, such as OSHA in the U.S. and EU Machinery Directive in Europe, are driving the adoption of safety sensors to ensure worker safety and equipment protection
- The rise of automation and robotics in industries such as manufacturing and logistics is increasing the demand for safety sensors to prevent accidents and ensure human-machine collaboration
- Safety sensors enhance operational efficiency by reducing downtime caused by accidents or equipment failures, particularly in high-risk industries such as oil and gas and mining
- For instance, Rockwell Automation provides safety sensor solutions integrated with control systems to enhance workplace safety in manufacturing plants
- The growing adoption of electric and autonomous vehicles is boosting the demand for safety sensors to ensure safe operation and compliance with automotive safety standards
Restraint/Challenge
“High Installation and Maintenance Costs”
- The high initial costs of advanced safety sensors, such as laser scanners and IoT-enabled systems, can limit adoption, particularly among small and medium-sized enterprises (SMEs)
- Regular maintenance and calibration requirements increase operational costs, posing challenges for cost-sensitive industries
- In developing regions, budget constraints and lack of skilled technicians for sensor maintenance may hinder market growth
- For instance, complex safety sensor systems in mining and oil and gas require specialized expertise, which may not be readily available in some markets
- The need for skilled personnel for installation, calibration, and maintenance of these sophisticated systems further adds to the operational expenditure, deterring some potential adopters
Safety Sensors Market Scope
The market is segmented on the basis of type, sensor type, and end user.
- By Type
On the basis of type, the global safety sensors market is segmented into safety light curtain, safety laser scanner, safety mat, safety edge, and others. The safety light curtain segment holds the largest market revenue share of 35.5% in 2024, supported by their widespread adoption in machinery and industrial automation for safeguarding personnel from hazardous operations. Growing emphasis on "zero-harm" policies in manufacturing and increasing investments in automated production lines are also fueling this growth.
The safety laser scanner segment is expected to witness the fastest growth rate from 2025 to 2032, driven by their versatility in detecting objects and personnel in complex environments and their increasing use in AGVs/AMRs and robotics.
- By Sensor Type
On the basis of sensor type, the global safety sensors market is segmented into accelerometers, biosensors, image sensors, and motion detectors. The motion detectors segment dominate the market revenue share of 36% in 2024, owing to their critical role in detecting unauthorized access and ensuring safety in industrial settings.
The biosensors segment is expected to grow at the fastest rate during the forecast period, driven by their increasing use in healthcare and food and beverage industries for monitoring environmental and biological conditions.
- By End User
On the basis of end user, the global safety sensors market is segmented into construction, oil and gas, mining, healthcare, defense, manufacturing, logistics, food and beverages, and others. The manufacturing segment dominated the market revenue share of 31% in 2024, owing to the high adoption of automation and robotics in manufacturing facilities and the stringent safety regulations in the sector.
The logistics segment is expected to witness the fastest growth rate from 2025 to 2032, driven by increasing automation in warehouses and distribution centers, and the need to ensure worker safety around moving machinery and automated guided vehicles (AGVs).
Safety Sensors Market Regional Analysis
- North America dominates the global safety sensors market with the largest revenue share of 38.7% in 2024, driven by a mature industrial base and increasing adoption of automation and robotics in manufacturing
- Consumers prioritize safety sensors for enhancing worker protection, ensuring regulatory compliance, and improving operational efficiency, especially in industries with high-risk environments
- Growth is supported by advancements in sensor technology, including smart and connected safety solutions, alongside rising adoption in both new installations and retrofitting of existing machinery
U.S. Safety Sensors Market Insight
The U.S. dominates the North America safety sensors market with the highest revenue share in 2024, fueled by strong industrial growth and growing awareness of workplace safety standards. The trend towards industrial automation and increasing investments in advanced safety technologies further boost market expansion. Regulatory initiatives promoting a safe working environment also complement market growth.
Europe Safety Sensors Market Insight
The Europe safety sensors market is expected to witness significant growth, supported by stringent regulatory emphasis on industrial safety and occupational health. Industries seek sensors that improve operational safety while ensuring compliance with European Union directives. The growth is prominent in both new industrial setups and modernization projects, with countries such as Germany and France showing significant uptake due to their robust manufacturing sectors and focus on Industry 4.0.
U.K. Safety Sensors Market Insight
The U.K. market for safety sensors is expected to witness considerable growth, driven by demand for improved worker safety and compliance with health and safety regulations in industrial settings. Increased interest in smart factory initiatives and rising awareness of the benefits of proactive risk management encourage adoption. In addition, evolving machinery safety standards influence consumer choices, balancing performance with regulatory adherence.
Germany Safety Sensors Market Insight
Germany is expected to witness robust growth in safety sensors, attributed to its advanced industrial manufacturing sector and high consumer focus on automation safety and efficiency. German industries prefer technologically advanced sensors that contribute to a safer working environment and lower operational risks. The integration of these sensors in high-tech machinery and industrial automation solutions supports sustained market growth.
Asia-Pacific Safety Sensors Market Insight
The Asia-Pacific region is expected to witness the fastest growth rate, driven by expanding manufacturing capabilities and rising investments in industrial automation in countries such as China, India, and Japan. Increasing awareness of occupational safety, rapid urbanization, and a growing workforce are boosting demand. Government initiatives promoting industrial safety and modern manufacturing further encourage the use of advanced safety sensors.
Japan Safety Sensors Market Insight
Japan's safety sensors market is expected to witness significant growth due to strong industrial automation and a high focus on precision and safety in manufacturing. The presence of major automotive and electronics manufacturers and integration of safety sensors in advanced robotic systems accelerate market penetration. Rising interest in smart factory concepts also contributes to growth.
China Safety Sensors Market Insight
China holds the largest share of the Asia-Pacific safety sensors market, propelled by rapid industrialization, rising factory output, and increasing demand for robust safety solutions in hazardous environments. The country's growing manufacturing base and focus on intelligent manufacturing support the adoption of advanced safety sensors. Strong domestic manufacturing capabilities and competitive pricing enhance market accessibility.
Safety Sensors Market Share
The safety sensors industry is primarily led by well-established companies, including:
- ABB (Switzerland)
- Rockwell Automation (U.S.)
- Sensata Technologies, Inc. (U.S.)
- Pilz GmbH & Co. KG (Germany)
- Autonics Corporation (South Korea)
- Siemens (Germany)
- Balluff Automation India Pvt. Ltd. (India)
- ATEK Access Technologies (U.S.)
- Pepperl+Fuchs (Germany)
- Schneider Electric (France)
- Hans Turck GmbH & Co. KG (Germany)
- OMRON Corporation (Japan)
- Panasonic Industry Europe GmbH (Germany)
- Littelfuse, Inc. (U.S.)
- SICK AG (Germany)
Latest Developments in Global Safety Sensors Market
- In April 2025, SICK AG introduced the deTec4 safety light curtain, enhancing industrial safety with improved detection capabilities and streamlined integration. Designed for efficiency, this new series simplifies setup, reducing installation time while boosting operational effectiveness. By expanding its safety light curtain portfolio, SICK AG reinforces its presence in the industrial safety sector, catering to the rising demand for reliable and user-friendly solutions. The launch is expected to accelerate adoption in automated production lines, ensuring better worker protection and increased productivity
- In January 2025, Omron Corporation unveiled a new series of safety light curtains equipped with predictive maintenance features, designed to minimize downtime in smart factories. These advanced curtains enhance operational efficiency by detecting potential failures before they occur, ensuring seamless production processes. With this launch, Omron reinforces its presence in the Industry 4.0 market, addressing the growing demand for intelligent safety solutions. The integration of predictive maintenance technology aligns with modern automation trends, improving reliability and reducing maintenance costs
- In October 2024, researchers at the Centre for Nano and Soft Matter Sciences (CeNS) developed a prototype road safety sensor designed for high-risk curves prone to accidents. This innovative sensor is crafted from a newly developed polymer nanocomposite, which possesses both pressure-sensing and energy-harvesting capabilities. The prototype can be implanted in movable ramps and secured to roads, alerting approaching vehicles to potential hazards. The sensor operates on the principle of the piezoelectric effect, enabling it to generate and store energy for powering electronic devices
- In May 2024, Sonair unveiled groundbreaking advancements in sensor technology aimed at improving industrial automation safety. The company also announced the upcoming release of its first evaluation kit in the summer, marking a significant milestone in robotics and machine autonomy. Sonair’s 3D ultrasonic sensor enables autonomous mobile robots (AMRs) to accurately measure distance and direction within a 180×180 field of view, detecting objects up to five meters away. This innovation enhances navigation and safety in dynamic environments
- In December 2023, Panasonic Life Solutions India’s Industrial Devices Division introduced a 6-in-1, 6DoF (Degrees of Freedom) inertial sensor, designed to measure acceleration and angular rate across three axes (X, Y, and Z). This sensor enhances vehicle stability and safety by providing precise motion data, crucial for mission-critical applications. It complies with ISO26262 Functional Safety Standards, including ASIL-D, ensuring high reliability in automotive systems. The sensor supports Advanced Driver Assistance Systems (ADAS) and Vehicle-to-X (V2X) communication, improving autonomous driving capabilities
SKU-

- Interactive Data Analysis Dashboard
- Company Analysis Dashboard for high growth potential opportunities
- Research Analyst Access for customization & queries
- Competitor Analysis with Interactive dashboard
- Latest News, Updates & Trend analysis
- Harness the Power of Benchmark Analysis for Comprehensive Competitor Tracking
Table of Content
1 INTRODUCTION
1.1 OBJECTIVES OF THE STUDY
1.2 MARKET DEFINITION
1.3 OVERVIEW OF GLOBAL SAFETY SENSORS MARKET
1.4 CURRENCY AND PRICING
1.5 LIMITATION
1.6 MARKETS COVERED
2 MARKET SEGMENTATION
2.1 KEY TAKEAWAYS
2.2 ARRIVING AT THE GLOBAL SAFETY SENSORS MARKET
2.3 VENDOR POSITIONING GRID
2.4 TECHNOLOGY LIFE LINE CURVE
2.5 MARKET GUIDE
2.6 COMPANY POSITIONING GRID
2.7 MULTIVARIATE MODELLING
2.8 STANDARDS OF MEASUREMENT
2.9 TOP TO BOTTOM ANALYSIS
2.1 VENDOR SHARE ANALYSIS
2.11 DATA POINTS FROM KEY PRIMARY INTERVIEWS
2.12 DATA POINTS FROM KEY SECONDARY DATABASES
2.13 GLOBAL SAFETY SENSORS MARKET : RESEARCH SNAPSHOT
2.14 ASSUMPTIONS
3 MARKET OVERVIEW
3.1 DRIVERS
3.2 RESTRAINTS
3.3 OPPORTUNITIES
3.4 CHALLENGES
4 EXECUTIVE SUMMARY
5 PREMIUM INSIGHTS
5.1 INDUSTRY ANALYSIS & FUTURISTIC SCENARIO
5.2 PENETRATION AND GROWTH POSPECT MAPPING
5.3 PORTER’S FIVE FORCES
5.4 TECHNOLOGICAL TRENDS
5.5 CASE STUDIES
5.6 COMPANY PROFILING
5.6.1 COMPANY A
5.6.1.1. LIST OF ACQUISITIONS
5.6.1.2. SHAREHOLDING PATTERN
5.6.1.3. COMPANY’S COMPETITOR AND ALTERNATIVES
5.6.1.4. BUSINESS MODEL
5.6.1.5. HOW COMPANY’S MAKES MONEY CANVAS
5.6.1.5.1. COMPANY A CUSTOMER SEGMENTS
5.6.1.5.2. COMPANY A VALUE PROPOSITIONS
5.6.1.5.3. COMPANY A CHANNELS
5.6.1.5.4. COMPANY A CUSTOMER RELATIONSHIPS
5.6.1.5.5. COMPANY A REVENUE STREAMS
5.6.1.5.6. COMPANY A KEY RESOURCES
5.6.1.5.7. COMPANY A KEY ACTIVITIES
5.6.1.5.8. COMPANY A KEY PARTNERS
5.6.1.5.9. COMPANY A COST STRUCTURE
5.6.1.5.10. COMPANY A SWOT ANALYSIS
5.6.2 COMPETITIVE INTELLIGENCE
5.6.2.1. STRATEGIC DEVELOPMENT
5.6.2.2. TECHNOLOGY/PLATFORM COMPARATIVE MATRIX
5.6.2.3. TECHNOLOGY IMPLEMENTATION PROCESS
5.6.2.3.1. CHALLENGES
5.6.2.3.2. INHOUS IMPLEMENTATION/OUTSOURCED (THIRD PARTY) IMPLEMENTATION
5.6.2.4. TECHNOLOGY SPEND OF COMPANY
5.6.2.5. COMPANY COMPARATIVE ANALYSIS
5.6.2.5.1. CUSTOMER BASE
5.6.2.5.2. SERVICE POSITIONING
5.6.2.5.3. CUSTOMER FEEDBACK/RATING
5.6.2.5.4. APPLICATION REACH
5.6.2.5.5. MARKET SHARE
5.7 FUNDING DETAILS—INVESTOR DETAILS , REASON OF INVESTMENT FROM INVESTOR
6 GLOBAL SAFETY SENSORS MARKET, BY TYPE
6.1 OVERVIEW
6.2 PROXIMITY SENSORS
6.2.1 INDUCTIVE SENSORS
6.2.2 CAPACITIVE SENSORS
6.2.3 ULTRASONIC SENSORS
6.2.4 PHOTOELECTRIC SENSORS
6.3 SAFETY LASER CURTAINS
6.3.1 SINGLE-BEAM LIGHT CURTAINS
6.3.2 MULTI-BEAM LIGHT CURTAINS
6.4 SAFETY MAT
6.5 EMERGENCY STOP BUTTONS SWITCHES
6.5.1 BY FUNCTION
6.5.1.1. PULL-CORD EMERGENCY STOP SWITCHES
6.5.1.2. PUSH-BUTTON EMERGENCY STOP SWITCHES
6.5.2 BY FUSE TYPE
6.5.2.1. FUSIBLE
6.5.2.2. NON-FUSIBLE
6.6 MACHINE VISION SYSTEM
6.6.1 2D VISION SYSTEMS
6.6.2 3D VISION SYSTEMS
6.7 RFID SENSORS
6.7.1 ACTIVE RFID SENSORS
6.7.2 PASSIVE RFID SENSORS
6.8 TEMPERATURE SENSORS
6.9 PRESSURE SENSORS
6.1 TILT SENSORS
6.10.1 ANALOG TILT SENSORS
6.10.2 DIGITAL TILT SENSORS
6.11 SAFETY CONTROLLERS
6.11.1 BY ARCHITECTURE
6.11.1.1. 8- BIT SAFETY CONTROLLERS
6.11.1.2. 16-BIT SAFETY CONTROLLERS
6.11.1.3. OTHERS
6.11.2 BY TYPE
6.11.2.1. PLC
6.11.2.2. MICROCONTROLLERS
6.11.2.3. OTHERS
6.12 OTHERS
7 GLOBAL SAFETY SENSORS MARKET , BY TECHNOLOGY
7.1 OVERVIEW
7.2 ANALOG SENSOR
7.3 DIGITAL SENSOR
7.4 SMART SENSOR
8 GLOBAL SAFETY SENSORS MARKET , BY FUNCTION
8.1 OVERVIEW
8.2 MACHINE PROTECTION
8.3 PROCESS MONITORING
8.4 ENERGY MANAGEMENT
8.5 PARKING ASSISTANCE
8.6 COLLISION AVOIDANCE
8.7 VIBRATION MONITORING SYSTEM
8.8 EMERGENCY STOP SYSTEMS
8.9 OTHERS
9 GLOBAL SAFETY SENSORS MARKET , BY SENSOR TYPE
9.1 OVERVIEW
9.2 ACCELEROMETERS
9.3 BIOSENSORS
9.4 IMAGE SENSORS
9.5 MOTION DETECTORS
9.6 OTHERS
10 GLOBAL SAFETY SENSORS MARKET, BY ORGANIZATION SIZE
10.1 OVERVIEW
10.2 SMALL & MEDIUM SIZE ORGANIZATION
10.3 LARGE SCALE ORGANIZATION
11 GLOBAL SAFETY SENSORS MARKET , BY END-USER
11.1 OVERVIEW
11.2 AUTOMOTIVE
11.2.1 ACCELEROMETERS
11.2.2 BIOSENSORS
11.2.3 IMAGE SENSORS
11.2.4 MOTION DETECTORS
11.2.5 OTHERS
11.3 CONSUMER ELECTRONICS
11.3.1 ACCELEROMETERS
11.3.2 BIOSENSORS
11.3.3 IMAGE SENSORS
11.3.4 MOTION DETECTORS
11.3.5 OTHERS
11.4 OIL & GAS
11.4.1 ACCELEROMETERS
11.4.2 BIOSENSORS
11.4.3 IMAGE SENSORS
11.4.4 MOTION DETECTORS
11.4.5 OTHERS
11.5 TRANSPORTATION & LOGISTICS
11.5.1 ACCELEROMETERS
11.5.2 BIOSENSORS
11.5.3 IMAGE SENSORS
11.5.4 MOTION DETECTORS
11.5.5 OTHERS
11.6 FOOD AND BEVERAGES
11.6.1 ACCELEROMETERS
11.6.2 BIOSENSORS
11.6.3 IMAGE SENSORS
11.6.4 MOTION DETECTORS
11.6.5 OTHERS
11.7 HEALTHCARE
11.7.1 ACCELEROMETERS
11.7.2 BIOSENSORS
11.7.3 IMAGE SENSORS
11.7.4 MOTION DETECTORS
11.7.5 OTHERS
11.8 CONSTRUCTION INDSUTRY
11.8.1 ACCELEROMETERS
11.8.2 BIOSENSORS
11.8.3 IMAGE SENSORS
11.8.4 MOTION DETECTORS
11.8.5 OTHERS
11.9 AEROSPACE & DEFENSE
11.9.1 ACCELEROMETERS
11.9.2 BIOSENSORS
11.9.3 IMAGE SENSORS
11.9.4 MOTION DETECTORS
11.9.5 OTHERS
11.1 OTHERS
12 GLOBAL SAFETY SENSORS MARKET, BY DISTRIBUTION CHANNEL
12.1 OVERVIEW
12.2 DIRECT SALES
12.3 INDIRECT SALES
12.3.1 RETAIL
12.3.2 E-COMMERCE
12.3.3 WHOLESALER
12.3.4 OTHERS
13 GLOBAL SAFETY SENSORS MARKET , BY REGION
GLOBAL SAFETY SENSORS MARKET , (ALL SEGMENTATION PROVIDED ABOVE IS REPRESENTED IN THIS CHAPTER BY COUNTRY)
13.1 NORTH AMERICA
13.1.1 U.S.
13.1.2 CANADA
13.1.3 MEXICO
13.2 EUROPE
13.2.1 GERMANY
13.2.2 FRANCE
13.2.3 U.K.
13.2.4 ITALY
13.2.5 SPAIN
13.2.6 RUSSIA
13.2.7 TURKEY
13.2.8 BELGIUM
13.2.9 NETHERLANDS
13.2.10 SWITZERLAND
13.2.11 NORWAY
13.2.12 FINLAND
13.2.13 DENMARK
13.2.14 SWEDAN
13.2.15 POLAND
13.2.16 REST OF EUROPE
13.3 ASIA PACIFIC
13.3.1 JAPAN
13.3.2 CHINA
13.3.3 SOUTH KOREA
13.3.4 INDIA
13.3.5 AUSTRALIA
13.3.6 NEW ZEALAND
13.3.7 SINGAPORE
13.3.8 THAILAND
13.3.9 MALAYSIA
13.3.10 INDONESIA
13.3.11 PHILIPPINES
13.3.12 TAIWAN
13.3.13 VIETNAM
13.3.14 REST OF ASIA PACIFIC
13.4 SOUTH AMERICA
13.4.1 BRAZIL
13.4.2 ARGENTINA
13.4.3 REST OF SOUTH AMERICA
13.5 MIDDLE EAST AND AFRICA
13.5.1 SOUTH AFRICA
13.5.2 EGYPT
13.5.3 SAUDI ARABIA
13.5.4 U.A.E
13.5.5 ISRAEL
13.5.6 REST OF MIDDLE EAST AND AFRICA
13.6 KEY PRIMARY INSIGHTS: BY MAJOR COUNTRIES
14 GLOBAL SAFETY SENSORS MARKET ,COMPANY LANDSCAPE
14.1 COMPANY SHARE ANALYSIS: GLOBAL
14.2 COMPANY SHARE ANALYSIS: NORTH AMERICA
14.3 COMPANY SHARE ANALYSIS: EUROPE
14.4 COMPANY SHARE ANALYSIS: ASIA PACIFIC
14.5 MERGERS & ACQUISITIONS
14.6 NEW PRODUCT DEVELOPMENT & APPROVALS
14.7 EXPANSIONS
14.8 REGULATORY CHANGES
14.9 PARTNERSHIP AND OTHER STRATEGIC DEVELOPMENTS
15 GLOBAL SAFETY SENSORS MARKET , SWOT AND DBMR ANALYSIS
16 GLOBAL SAFETY SENSORS MARKET , COMPANY PROFILE
16.1 ROCKWELL AUTOMATION
16.1.1 COMPANY SNAPSHOT
16.1.2 REVENUE ANALYSIS
16.1.3 GEOGRAPHIC PRESENCE
16.1.4 PRODUCT PORTFOLIO
16.1.5 RECENT DEVELOPMENTS
16.2 ABB
16.2.1 COMPANY SNAPSHOT
16.2.2 REVENUE ANALYSIS
16.2.3 GEOGRAPHIC PRESENCE
16.2.4 PRODUCT PORTFOLIO
16.2.5 RECENT DEVELOPMENTS
16.3 PANASONIC ELECTRIC CO. LTD
16.3.1 COMPANY SNAPSHOT
16.3.2 REVENUE ANALYSIS
16.3.3 GEOGRAPHIC PRESENCE
16.3.4 PRODUCT PORTFOLIO
16.3.5 RECENT DEVELOPMENTS
16.4 SCHNEIDER ELECTRIC
16.4.1 COMPANY SNAPSHOT
16.4.2 REVENUE ANALYSIS
16.4.3 GEOGRAPHIC PRESENCE
16.4.4 PRODUCT PORTFOLIO
16.4.5 RECENT DEVELOPMENTS
16.5 BEI SENSOR
16.5.1 COMPANY SNAPSHOT
16.5.2 REVENUE ANALYSIS
16.5.3 GEOGRAPHIC PRESENCE
16.5.4 PRODUCT PORTFOLIO
16.5.5 RECENT DEVELOPMENTS
16.6 SIEMENS
16.6.1 COMPANY SNAPSHOT
16.6.2 REVENUE ANALYSIS
16.6.3 GEOGRAPHIC PRESENCE
16.6.4 PRODUCT PORTFOLIO
16.6.5 RECENT DEVELOPMENTS
16.7 PEPPERL+FUCHS
16.7.1 COMPANY SNAPSHOT
16.7.2 REVENUE ANALYSIS
16.7.3 GEOGRAPHIC PRESENCE
16.7.4 PRODUCT PORTFOLIO
16.7.5 RECENT DEVELOPMENTS
16.8 OMRON CORPORATION
16.8.1 COMPANY SNAPSHOT
16.8.2 REVENUE ANALYSIS
16.8.3 GEOGRAPHIC PRESENCE
16.8.4 PRODUCT PORTFOLIO
16.8.5 RECENT DEVELOPMENTS
16.9 SENSATA TECHNOLOGIES, INC
16.9.1 COMPANY SNAPSHOT
16.9.2 REVENUE ANALYSIS
16.9.3 GEOGRAPHIC PRESENCE
16.9.4 PRODUCT PORTFOLIO
16.9.5 RECENT DEVELOPMENTS
16.1 KEYENCE
16.10.1 COMPANY SNAPSHOT
16.10.2 REVENUE ANALYSIS
16.10.3 GEOGRAPHIC PRESENCE
16.10.4 PRODUCT PORTFOLIO
16.10.5 RECENT DEVELOPMENTS
16.11 HONEYWELL INTERNATIONAL INC
16.11.1 COMPANY SNAPSHOT
16.11.2 REVENUE ANALYSIS
16.11.3 GEOGRAPHIC PRESENCE
16.11.4 PRODUCT PORTFOLIO
16.11.5 RECENT DEVELOPMENTS
16.12 ATEK ACCESS TECHNOLOGIES
16.12.1 COMPANY SNAPSHOT
16.12.2 REVENUE ANALYSIS
16.12.3 GEOGRAPHIC PRESENCE
16.12.4 PRODUCT PORTFOLIO
16.12.5 RECENT DEVELOPMENTS
16.13 AUTONICS CORPORATION
16.13.1 COMPANY SNAPSHOT
16.13.2 REVENUE ANALYSIS
16.13.3 GEOGRAPHIC PRESENCE
16.13.4 PRODUCT PORTFOLIO
16.13.5 RECENT DEVELOPMENTS
16.14 SICK AG
16.14.1 COMPANY SNAPSHOT
16.14.2 REVENUE ANALYSIS
16.14.3 GEOGRAPHIC PRESENCE
16.14.4 PRODUCT PORTFOLIO
16.14.5 RECENT DEVELOPMENTS
16.15 HANS TURCK GMBH & CO. KG
16.15.1 COMPANY SNAPSHOT
16.15.2 REVENUE ANALYSIS
16.15.3 GEOGRAPHIC PRESENCE
16.15.4 PRODUCT PORTFOLIO
16.15.5 RECENT DEVELOPMENTS
16.16 BALLUFF AUTOMATION INDIA PVT. LTD.
16.16.1 COMPANY SNAPSHOT
16.16.2 REVENUE ANALYSIS
16.16.3 GEOGRAPHIC PRESENCE
16.16.4 PRODUCT PORTFOLIO
16.16.5 RECENT DEVELOPMENTS
16.17 FESTO
16.17.1 COMPANY SNAPSHOT
16.17.2 REVENUE ANALYSIS
16.17.3 GEOGRAPHIC PRESENCE
16.17.4 PRODUCT PORTFOLIO
16.17.5 RECENT DEVELOPMENTS
16.18 TURCK
16.18.1 COMPANY SNAPSHOT
16.18.2 REVENUE ANALYSIS
16.18.3 GEOGRAPHIC PRESENCE
16.18.4 PRODUCT PORTFOLIO
16.18.5 RECENT DEVELOPMENTS
17 CONCLUSION
18 QUESTIONNAIRE
19 RELATED REPORTS
20 ABOUT DATA BRIDGE MARKET RESEARCH
Global Safety Sensors Market, Supply Chain Analysis and Ecosystem Framework
To support market growth and help clients navigate the impact of geopolitical shifts, DBMR has integrated in-depth supply chain analysis into its Global Safety Sensors Market research reports. This addition empowers clients to respond effectively to global changes affecting their industries. The supply chain analysis section includes detailed insights such as Global Safety Sensors Market consumption and production by country, price trend analysis, the impact of tariffs and geopolitical developments, and import and export trends by country and HSN code. It also highlights major suppliers with data on production capacity and company profiles, as well as key importers and exporters. In addition to research, DBMR offers specialized supply chain consulting services backed by over a decade of experience, providing solutions like supplier discovery, supplier risk assessment, price trend analysis, impact evaluation of inflation and trade route changes, and comprehensive market trend analysis.
Data collection and base year analysis are done using data collection modules with large sample sizes. The stage includes obtaining market information or related data through various sources and strategies. It includes examining and planning all the data acquired from the past in advance. It likewise envelops the examination of information inconsistencies seen across different information sources. The market data is analysed and estimated using market statistical and coherent models. Also, market share analysis and key trend analysis are the major success factors in the market report. To know more, please request an analyst call or drop down your inquiry.
The key research methodology used by DBMR research team is data triangulation which involves data mining, analysis of the impact of data variables on the market and primary (industry expert) validation. Data models include Vendor Positioning Grid, Market Time Line Analysis, Market Overview and Guide, Company Positioning Grid, Patent Analysis, Pricing Analysis, Company Market Share Analysis, Standards of Measurement, Global versus Regional and Vendor Share Analysis. To know more about the research methodology, drop in an inquiry to speak to our industry experts.
Data Bridge Market Research is a leader in advanced formative research. We take pride in servicing our existing and new customers with data and analysis that match and suits their goal. The report can be customized to include price trend analysis of target brands understanding the market for additional countries (ask for the list of countries), clinical trial results data, literature review, refurbished market and product base analysis. Market analysis of target competitors can be analyzed from technology-based analysis to market portfolio strategies. We can add as many competitors that you require data about in the format and data style you are looking for. Our team of analysts can also provide you data in crude raw excel files pivot tables (Fact book) or can assist you in creating presentations from the data sets available in the report.


