
Global Risk And Vulnerability Proactive Security Market
Market Size in USD Billion
CAGR :
% 
 USD
5.55 Billion
USD
17.97 Billion
2025
2033
USD
5.55 Billion
USD
17.97 Billion
2025
2033
| 2026 –2033 | |
| USD 5.55 Billion | |
| USD 17.97 Billion | |
| % | |
|
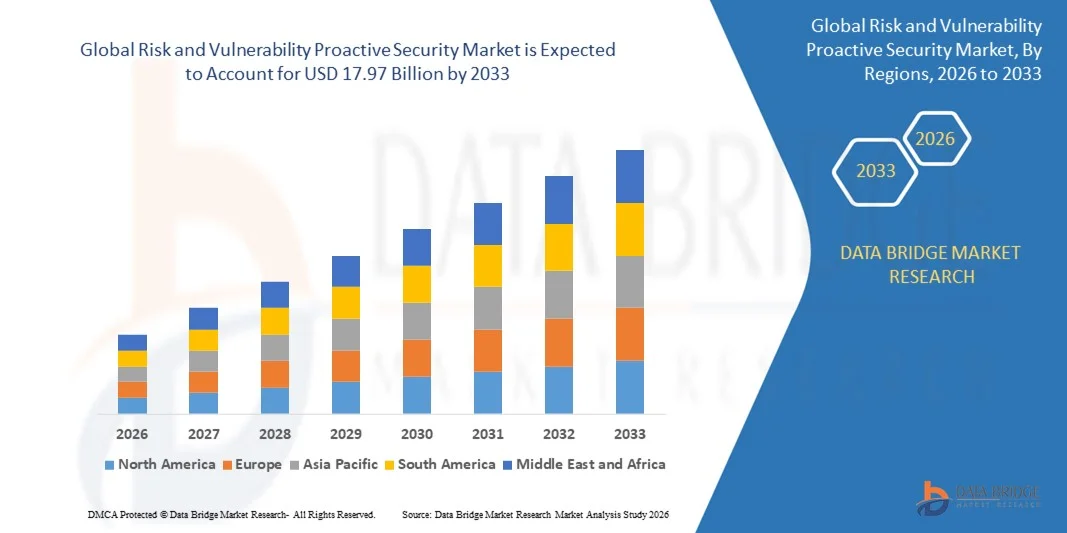
What is the Global Risk and Vulnerability Proactive Security Market Size and Growth Rate?
- The global risk and vulnerability proactive security market size was valued at USD 5.55 billion in 2025 and is expected to reach USD 17.97 billion by 2033, at a CAGR of15.80% during the forecast period
- The strategic shift towards proactive security owing to rising sophistication in attacking techniques have been directly influencing the growth of risk and vulnerability proactive security market
- Also, the increasing adoption of smart mobile devices and Iot is also flourishing the growth of the risk and vulnerability proactive security market. Also, the growing need to manage strict regulations and compliances is also positively impacting the growth of the market
What are the Major Takeaways of Risk and Vulnerability Proactive Security Market?
- The growing need for employing proactive security solutions is strengthen by raising the number of security breaches and cyber-attacks which is also acting as an active growth driver towards the growth of the risk and vulnerability proactive security market
- Moreover, the growing number of connected devices across enterprise due to bring your device (BYOD) and IoT execution, which has encouraged enterprises to shift from reactive to proactive security solutions, thus is also creating a huge demand for risk and vulnerability proactive security as well as lifting the growth of the risk and vulnerability proactive security market
- North America dominated the risk and vulnerability proactive security market with a 39.85% revenue share in 2025, supported by strong cybersecurity adoption across enterprises, government agencies, and critical infrastructure operators in the U.S. and Canada
- Asia-Pacific is projected to record the fastest CAGR of 8.69% from 2026 to 2033, driven by rapid digitalization, large-scale cloud adoption, and rising cyber threats across China, Japan, India, South Korea, and Southeast Asia
- The Large Enterprise segment dominated the market with a 62.4% share in 2025, driven by high cybersecurity spending, complex IT infrastructures, and the need for continuous vulnerability monitoring across hybrid, multi-cloud, and global operations
Report Scope and Risk and Vulnerability Proactive Security Market Segmentation
|
Attributes |
Risk and Vulnerability Proactive Security Key Market Insights |
|
Segments Covered |
|
|
Countries Covered |
North America
Europe
Asia-Pacific
Middle East and Africa
South America
|
|
Key Market Players |
|
|
Market Opportunities |
|
|
Value Added Data Infosets |
In addition to the insights on market scenarios such as market value, growth rate, segmentation, geographical coverage, and major players, the market reports curated by the Data Bridge Market Research also include in-depth expert analysis, pricing analysis, brand share analysis, consumer survey, demography analysis, supply chain analysis, value chain analysis, raw material/consumables overview, vendor selection criteria, PESTLE Analysis, Porter Analysis, and regulatory framework. |
What is the Key Trend in the Risk and Vulnerability Proactive Security Market?
Growing Integration of AI-Enabled, Cloud-Driven, and Automated Proactive Security Platforms
- The risk and vulnerability proactive security market is seeing accelerated adoption of AI-powered, cloud-integrated, and automation-driven security platforms that continuously monitor, prioritize, and remediate cyber risks across complex IT environments
- Vendors are introducing real-time threat analytics, machine learning–based anomaly detection, and autonomous response capabilities, enabling organizations to proactively mitigate vulnerabilities before exploitation occurs
- Rising enterprise demand for centralized dashboards, automated risk scoring, continuous configuration monitoring, and predictive intelligence is reshaping the proactive security landscape
- For instance, companies such as IBM, Palo Alto Networks, Cisco, and Rapid7 have upgraded their proactive security suites with enhanced behavioral analytics, automated remediation workflows, and cloud-native orchestration tools
- The need for faster vulnerability detection, multi-vector threat correlation, and proactive defense mechanisms is driving large-scale deployment across cloud, hybrid, and on-premise environments
- As cyberattacks grow more sophisticated, AI-led proactive security platforms will remain essential for real-time protection, risk forecasting, and continuous security enhancement across global enterprises
What are the Key Drivers of Risk and Vulnerability Proactive Security Market?
- Increasing demand for advanced threat detection, continuous vulnerability monitoring, and automated risk assessment is boosting global adoption across enterprise security ecosystems
- For instance, in 2025, vendors such as IBM, Cisco, Securonix, and LogRhythm expanded their proactive security portfolios with improved machine learning engines, risk analytics tools, and automated response capabilities
- Growing digital transformation, cloud migration, remote workforce expansion, and rising cyberattack frequency are accelerating adoption across the U.S., Europe, and Asia-Pacific
- Advancements in SIEM integration, SOAR automation, endpoint telemetry, and behavioral analytics have significantly strengthened detection accuracy, scalability, and operational efficiency
- Rising complexity in enterprise IT infrastructures and increasing use of IoT devices, hybrid cloud systems, SaaS platforms, and multi-vector threat surfaces are creating strong demand for proactive risk identification
- Supported by consistent investments in cybersecurity R&D, compliance needs, and enterprise modernization, the Risk and Vulnerability Proactive Security market is poised for strong long-term expansion
Which Factor is Challenging the Growth of the Risk and Vulnerability Proactive Security Market?
- High deployment and maintenance costs of AI-driven, automation-centric, and cloud-native proactive security platforms limit adoption among SMEs and budget-constrained organizations
- For instance, during 2024–2025, rising expenses related to security analytics engines, data storage, and threat intelligence subscriptions led to increased solution pricing among global cybersecurity vendors
- Growing complexity of multi-cloud environments, encrypted traffic analysis, API security, and zero-trust deployments increases the need for skilled cybersecurity professionals
- Limited awareness in developing regions regarding proactive security capabilities, automation benefits, and AI-based risk prediction slows market penetration
- Intense competition from traditional SIEM tools, EDR platforms, and manual vulnerability scanners creates pricing pressure and reduces differentiation for advanced proactive tools
- To overcome these barriers, vendors are emphasizing cost-optimized cloud offerings, modular deployments, AI-driven automation, and simplified integration frameworks to expand global adoption of proactive security solutions
How is the Risk and Vulnerability Proactive Security Market Segmented?
The market is segmented on the basis of organization size and end user.
- By Organization Size
On the basis of organization size, the risk and vulnerability proactive security market is segmented into Large Enterprises and Small & Medium-Sized Enterprises (SMEs). The Large Enterprise segment dominated the market with a 62.4% share in 2025, driven by high cybersecurity spending, complex IT infrastructures, and the need for continuous vulnerability monitoring across hybrid, multi-cloud, and global operations. Large enterprises increasingly deploy AI-driven risk analytics, automated threat response tools, and continuous compliance platforms to mitigate sophisticated cyberattacks and regulatory challenges. Their strong investment capacity, access to skilled cybersecurity teams, and adoption of proactive defense strategies contribute to substantial market demand.
The SMEs segment is expected to grow at the fastest CAGR from 2026 to 2033, driven by rising cyberattack exposure, adoption of cloud-based security platforms, and increasing availability of cost-efficient proactive security solutions. Growing digital transformation among SMEs further accelerates adoption of automated vulnerability management tools.
- By End User
On the basis of end user, the risk and vulnerability proactive security market is segmented into Banking, Financial Services, and Insurance (BFSI), Government & Defense, Retail & Ecommerce, IT & Telecom, Healthcare & Life Sciences, Energy & Utilities, Manufacturing, and Others. The BFSI segment dominated the market with a 27.8% share in 2025, driven by stringent regulatory compliance requirements, high transaction volumes, and the need for continuous risk surveillance to prevent data breaches and financial fraud. BFSI institutions rely heavily on AI-enabled risk scoring, real-time anomaly detection, and automated incident response systems to secure digital assets.
The IT & Telecom segment is projected to grow at the fastest CAGR from 2026 to 2033, fueled by rapid cloud expansion, rising cyber threats targeting digital infrastructure, and increasing adoption of proactive security tools for application security, network monitoring, and API protection. Significant growth in data traffic, IoT integration, and digital services further strengthens long-term demand.
Which Region Holds the Largest Share of the Risk and Vulnerability Proactive Security Market?
- North America dominated the risk and vulnerability proactive security market with a 39.85% revenue share in 2025, supported by strong cybersecurity adoption across enterprises, government agencies, and critical infrastructure operators in the U.S. and Canada
- Increasing frequency of cyberattacks, the rise of advanced persistent threats (APTs), and the expansion of cloud and hybrid IT ecosystems continue to accelerate the deployment of real-time vulnerability monitoring and proactive threat detection solutions
- Leading companies across the region are integrating AI-driven analytics, automated incident response, and cloud-native security tools, strengthening North America’s leadership in cybersecurity innovation. Continued investment in digital transformation, Zero-Trust architectures, and advanced security operations centres (SOCs) further reinforces market dominance
U.S. Risk and Vulnerability Proactive Security Market Insight
The U.S. remains the largest contributor in North America, driven by high cybersecurity spending, stringent regulatory frameworks, and the widespread adoption of proactive security tools in BFSI, defence, healthcare, and telecom sectors. Increasing risks from ransomware, phishing, and cloud-based attacks are accelerating deployment of AI-enhanced vulnerability assessment platforms and automated remediation tools. Presence of leading cybersecurity vendors, advanced SOC infrastructure, and strong enterprise digitalization levels further elevate market growth.
Canada Risk and Vulnerability Proactive Security Market Insight
Canada contributes strongly to regional growth as organizations adopt proactive security systems to safeguard critical infrastructure, smart manufacturing environments, and public-sector networks. Rising digitization in utilities, telecom, banking, and transportation has increased demand for automated risk scoring, continuous monitoring, and threat intelligence tools. Government-led cybersecurity programs, expanding tech innovation hubs, and growing awareness of cyber readiness support Canada’s rising adoption of advanced proactive security solutions.
Asia-Pacific Risk and Vulnerability Proactive Security Market
Asia-Pacific is projected to record the fastest CAGR of 8.69% from 2026 to 2033, driven by rapid digitalization, large-scale cloud adoption, and rising cyber threats across China, Japan, India, South Korea, and Southeast Asia. Expanding ecommerce, financial services, data centres, and 5G deployments are fueling the need for high-accuracy vulnerability scanning, automated patching, and AI-enabled threat prediction tools. Growing investment in cybersecurity infrastructure, government regulations, and increasing enterprise awareness of breach risks further accelerate adoption of proactive security platforms across the region.
China Risk and Vulnerability Proactive Security Market Insight
China leads the Asia-Pacific market due to strong investment in cybersecurity infrastructure, massive digital transformation initiatives, and rapid development of financial, telecom, and industrial sectors. Growing cyberattack exposure and increasing complexity of digital ecosystems are driving large-scale deployment of vulnerability assessment platforms, risk scoring systems, and AI-driven threat management solutions.
Japan Risk and Vulnerability Proactive Security Market Insight
Japan shows stable growth supported by advanced industrial automation, mature telecom infrastructure, and modernization of enterprise cybersecurity frameworks. Rising adoption of IoT, robotics, and digital manufacturing increases the need for precise, real-time vulnerability detection and proactive risk management tools. Strong focus on reliability and long-term security planning further drives market expansion.
India Risk and Vulnerability Proactive Security Market Insight
India is emerging as a fast-growing market due to expanding IT services, fintech adoption, and government-backed digital infrastructure programs. Increasing cyberattacks, rising cloud migration, and the growth of startups are accelerating demand for continuous vulnerability monitoring, automated compliance tools, and cloud-native security platforms. Growth in data centres and enterprise digital transformation further boosts adoption.
South Korea Risk and Vulnerability Proactive Security Market Insight
South Korea contributes significantly due to high technology penetration, strong adoption of 5G, and rapid expansion of digital services. Growing dependency on connected devices, AI systems, and industrial automation increases demand for advanced vulnerability management and real-time threat intelligence solutions. Strong manufacturing capacity and innovation-driven digital ecosystems support steady long-term growth.
Which are the Top Companies in Risk and Vulnerability Proactive Security Market?
The risk and vulnerability proactive security industry is primarily led by well-established companies, including:
- IBM Corporation (U.S.)
- FireEye, Inc. (U.S.)
- Palo Alto Networks, Inc. (U.S.)
- Securonix, Inc. (U.S.)
- LogRhythm, Inc. (U.S.)
- Rapid7 (U.S.)
- Qualys, Inc. (U.S.)
- AT&T Intellectual Property. (U.S.)
- McAfee, LLC (U.S.)
- Trustwave Holdings, Inc. (U.S.)
- CyberSponse, Inc. (U.S.)
- Cisco (U.S.)
- Broadcom. (U.S.)
- FireMon, LLC (U.S.)
- Centrify Corporation. (U.S.)
- Oracle (U.S.)
- Swimlane (U.S.)
- Skybox Security, Inc. (U.S.)
- RSA Security LLC (U.S.)
- ThreatConnect, Inc. (U.S.)
SKU-
Get online access to the report on the World's First Market Intelligence Cloud

- Interactive Data Analysis Dashboard
- Company Analysis Dashboard for high growth potential opportunities
- Research Analyst Access for customization & queries
- Competitor Analysis with Interactive dashboard
- Latest News, Updates & Trend analysis
- Harness the Power of Benchmark Analysis for Comprehensive Competitor Tracking
Research Methodology
Data collection and base year analysis are done using data collection modules with large sample sizes. The stage includes obtaining market information or related data through various sources and strategies. It includes examining and planning all the data acquired from the past in advance. It likewise envelops the examination of information inconsistencies seen across different information sources. The market data is analysed and estimated using market statistical and coherent models. Also, market share analysis and key trend analysis are the major success factors in the market report. To know more, please request an analyst call or drop down your inquiry.
The key research methodology used by DBMR research team is data triangulation which involves data mining, analysis of the impact of data variables on the market and primary (industry expert) validation. Data models include Vendor Positioning Grid, Market Time Line Analysis, Market Overview and Guide, Company Positioning Grid, Patent Analysis, Pricing Analysis, Company Market Share Analysis, Standards of Measurement, Global versus Regional and Vendor Share Analysis. To know more about the research methodology, drop in an inquiry to speak to our industry experts.
Customization Available
Data Bridge Market Research is a leader in advanced formative research. We take pride in servicing our existing and new customers with data and analysis that match and suits their goal. The report can be customized to include price trend analysis of target brands understanding the market for additional countries (ask for the list of countries), clinical trial results data, literature review, refurbished market and product base analysis. Market analysis of target competitors can be analyzed from technology-based analysis to market portfolio strategies. We can add as many competitors that you require data about in the format and data style you are looking for. Our team of analysts can also provide you data in crude raw excel files pivot tables (Fact book) or can assist you in creating presentations from the data sets available in the report.

