
Global Ready To Eat Soup Market
Market Size in USD Billion
CAGR :
% 
 USD
1.38 Billion
USD
2.47 Billion
2025
2033
USD
1.38 Billion
USD
2.47 Billion
2025
2033
| 2026 –2033 | |
| USD 1.38 Billion | |
| USD 2.47 Billion | |
| % | |
|
Global Ready to Eat Soup Market Size
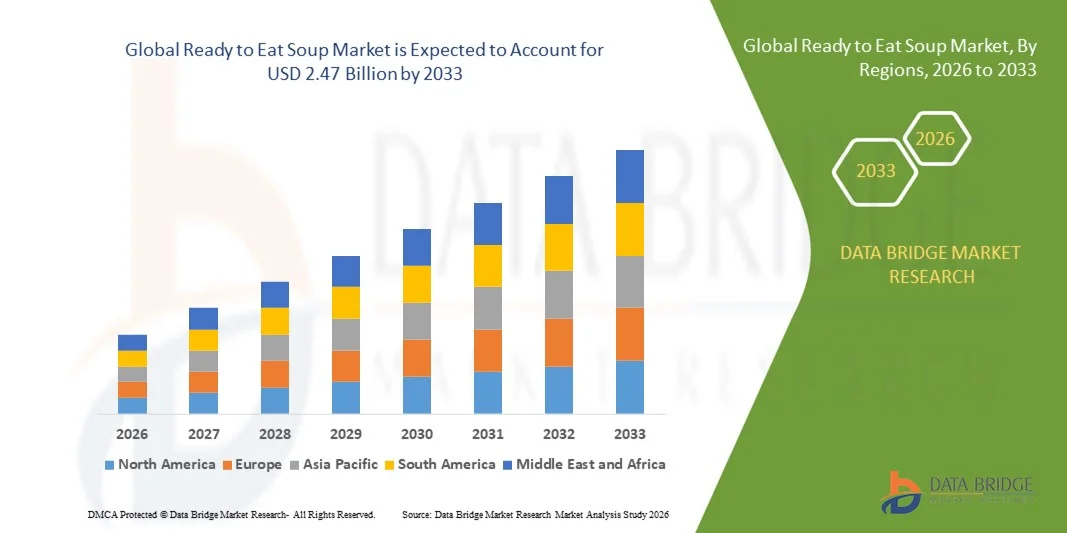
- The Global Ready to Eat Soup Market size was valued at USD 1.38 billion in 2025 and is projected to reach USD 2.47 billion by 2033, growing at a CAGR of 7.52% during the forecast period.
- The market expansion is primarily driven by evolving consumer lifestyles, increasing demand for convenient and nutritious meal options, and rapid urbanization, which collectively enhance the appeal of ready-to-eat food products.
- Additionally, advancements in packaging technology, extended shelf life, and the introduction of innovative flavors catering to diverse regional tastes are accelerating market adoption, thereby significantly propelling the growth of the ready-to-eat soup industry.
Global Ready to Eat Soup Market Analysis
- Ready to Eat Soups, offering convenient, pre-cooked meal solutions that require minimal preparation, are becoming essential components of modern diets in both residential and commercial settings due to their time efficiency, long shelf life, and expanding variety of flavors and nutritional options.
- The rising demand for ready to eat soups is primarily fueled by the growing preference for convenient, on-the-go food products, rapid urbanization, increasing numbers of working professionals, and a surge in consumer awareness regarding healthy and balanced eating habits.
- North America dominated the Global Ready to Eat Soup Market with the largest revenue share of 36% in 2025, driven by the strong presence of leading soup brands, high consumer purchasing power, and a well-established retail infrastructure, with the U.S. witnessing notable demand for premium, organic, and plant-based soup varieties supported by product innovations from major food manufacturers.
- Asia-Pacific is expected to be the fastest-growing region in the Global Ready to Eat Soup Market during the forecast period due to increasing urbanization, changing dietary patterns, and rising disposable incomes across emerging economies such as China, India, and Japan.
- The Wet Soup segment held the largest market revenue share of 58.6% in 2025, owing to its ready-to-consume nature and widespread availability in cans and microwavable bowls.
Report Scope and Global Ready to Eat Soup Market Segmentation
|
Attributes |
Ready to Eat Soup Key Market Insights |
|
Segments Covered |
|
|
Countries Covered |
North America
Europe
Asia-Pacific
Middle East and Africa
South America
|
|
Key Market Players |
|
|
Market Opportunities |
|
|
Value Added Data Infosets |
In addition to the insights on market scenarios such as market value, growth rate, segmentation, geographical coverage, and major players, the market reports curated by the Data Bridge Market Research also include in-depth expert analysis, pricing analysis, brand share analysis, consumer survey, demography analysis, supply chain analysis, value chain analysis, raw material/consumables overview, vendor selection criteria, PESTLE Analysis, Porter Analysis, and regulatory framework. |
Global Ready to Eat Soup Market Trends
Enhanced Convenience Through Product Innovation and Functional Formulations
- A significant and accelerating trend in the Global Ready to Eat Soup Market is the growing emphasis on product innovation, with manufacturers introducing nutrient-enriched, low-sodium, organic, and plant-based soup varieties to cater to evolving consumer health and wellness preferences. This innovation-driven approach is substantially enhancing consumer convenience and satisfaction.
- For instance, brands such as Campbell’s Well Yes! and Amy’s Kitchen have introduced ready to eat soups that combine wholesome ingredients such as lentils, quinoa, and vegetables, providing balanced nutrition with quick preparation. Similarly, Nestlé’s Maggi and Knorr have launched fortified soups tailored to regional tastes, offering both convenience and local flavor appeal.
- Increasing integration of technology in packaging and processing is also transforming the market—innovations such as microwave-safe containers, eco-friendly packaging, and shelf-stable pouches are improving ease of use, extending shelf life, and reducing waste. Furthermore, AI-driven consumer analytics are helping companies develop personalized soup options based on consumption trends and nutritional needs.
- The development of functional soup variants—enriched with proteins, vitamins, or immunity-boosting ingredients—aligns with the global trend toward health-oriented convenience foods. This has encouraged leading producers to invest in R&D for new formulations that support specific dietary goals such as vegan, gluten-free, or low-calorie diets.
- This trend toward smarter, healthier, and more diverse product offerings is fundamentally reshaping consumer expectations in the ready to eat food category. Consequently, companies such as Unilever and General Mills are expanding their portfolios with innovative soup lines targeting wellness-conscious consumers and sustainability goals.
- The demand for ready to eat soups offering enhanced nutrition, convenience, and functional benefits is growing rapidly across both developed and emerging markets, as consumers increasingly prioritize quick, wholesome, and accessible meal solutions.
Global Ready to Eat Soup Market Dynamics
Driver
Growing Demand Driven by Busy Lifestyles and Health-Conscious Eating
- The increasing prevalence of busy, urban lifestyles, coupled with the growing emphasis on health and nutrition, is a significant driver for the heightened demand for ready to eat soups. Consumers are seeking convenient, quick, and balanced meal options that fit seamlessly into their daily routines.
- For instance, in March 2025, Campbell Soup Company introduced a new range of high-protein, plant-based soups aimed at health-conscious millennials and working professionals. Similarly, Unilever’s Knorr brand expanded its portfolio in Asia-Pacific with nutrient-fortified, locally inspired soup recipes to cater to regional taste preferences and dietary needs.
- As consumers become more aware of the importance of healthy eating, ready to eat soups offering natural ingredients, low-sodium content, and clean labels are gaining rapid popularity. These soups provide a convenient alternative to traditional cooking without compromising on nutrition, making them a preferred choice for both home and on-the-go consumption.
- Furthermore, the growing expansion of modern retail, e-commerce platforms, and food delivery services has made these products more accessible, boosting their penetration in urban and semi-urban markets. Manufacturers are also investing in innovative packaging solutions such as microwavable cups and pouches that enhance portability and convenience.
- The availability of diverse soup types—ranging from vegetable and chicken varieties to organic and gluten-free options—is broadening consumer appeal and encouraging repeat purchases. The combination of health benefits, convenience, and affordability continues to drive strong market growth across both developed and emerging economies.
Restraint/Challenge
Rising Competition from Fresh Meal Alternatives and Price Sensitivity
- Despite strong growth prospects, the ready to eat soup market faces challenges from the increasing availability of fresh meal alternatives and home-delivery meal kits, which appeal to consumers seeking less processed and freshly prepared options.
- For instance, the growing popularity of meal kit services such as HelloFresh and Blue Apron has drawn health-conscious consumers away from packaged soups, citing freshness and ingredient transparency as key differentiators.
- Additionally, price sensitivity among consumers in developing markets poses a barrier to premium soup adoption. High-quality organic or protein-enriched soups often come at a higher price point compared to traditional instant or canned options, making affordability a concern for cost-conscious buyers.
- Addressing these challenges through product differentiation, value-based pricing, and effective marketing emphasizing health, taste, and convenience will be essential for brands to retain and expand their customer base. Furthermore, investing in sustainable packaging and cleaner ingredient sourcing can enhance brand trust and attract environmentally and health-conscious consumers.
- While the market continues to grow steadily, overcoming these barriers through innovation, affordability, and transparency will be crucial for sustaining long-term consumer loyalty and maintaining competitive advantage.
Global Ready to Eat Soup Market Scope
Ready to eat soup market is segmented on the basis of product type, form, source, packaging type, application and distribution channel.
- By Product Type
On the basis of product type, the Global Ready to Eat Soup Market is segmented into Tomato Ready to Eat Soup, Beans Ready to Eat Soup, Chicken Ready to Eat Soup, Beef Ready to Eat Soup, Mixed Vegetables Ready to Eat Soup, and Others. The Tomato Ready to Eat Soup segment dominated the market with the largest revenue share of 32.4% in 2025, driven by its universal appeal, affordability, and high nutritional value. Tomato soup’s tangy flavor and compatibility with diverse cuisines make it a staple choice across global households.
The Mixed Vegetables Ready to Eat Soup segment is projected to witness the fastest CAGR from 2026 to 2033, fueled by rising health consciousness and growing vegetarian and vegan consumer bases. The inclusion of nutrient-rich ingredients, combined with innovation in taste and packaging, continues to expand this segment’s demand in both developed and emerging markets.
- By Form
on the basis of form, the market is segmented into Dry Soup and Wet Soup. The Wet Soup segment held the largest market revenue share of 58.6% in 2025, owing to its ready-to-consume nature and widespread availability in cans and microwavable bowls. Wet soups are favored for their rich texture, freshness, and convenience, appealing to urban consumers seeking quick meal solutions.
The Dry Soup segment is expected to register the fastest CAGR during the forecast period, driven by its longer shelf life, lower storage costs, and suitability for on-the-go consumption. Growing product innovations in instant dry soups with enhanced taste, nutritional value, and easy reconstitution are expected to boost demand, especially in emerging economies and among working professionals.
- By Nature
On the basis of nature, the Global Ready to Eat Soup Market is segmented into Conventional and Organic soups. The Conventional segment dominated the market with a revenue share of 64.3% in 2025, primarily due to its affordability, wide availability, and strong brand presence across retail chains and supermarkets. Conventional soups continue to attract price-sensitive consumers in both developed and developing markets.
the Organic segment is anticipated to grow at the fastest CAGR from 2026 to 2033, driven by rising awareness of clean-label, non-GMO, and preservative-free products. Increasing health concerns and the preference for natural ingredients are encouraging manufacturers to expand their organic soup portfolios to meet the growing demand among health-conscious consumers.
- By Packaging Type
On the basis of packaging type, the market is segmented into Bottles, Cans, and Packets. The Cans segment dominated the market with the largest revenue share of 46.8% in 2025, attributed to its superior shelf stability, durability, and protection from external contaminants. Canned soups are favored for their long shelf life and ease of distribution through supermarkets and convenience stores.
The Packets segment is forecasted to record the fastest CAGR during 2026–2033, driven by the rising popularity of single-serve, lightweight, and eco-friendly packaging formats. Packets offer portability and portion control, aligning well with the needs of on-the-go consumers and sustainability-focused brands.
- By Application
On the basis of application, the market is segmented into Retail, Catering, Industrial, and Others. The Retail segment accounted for the largest revenue share of 52.1% in 2025, supported by strong consumer preference for home consumption and the wide availability of ready to eat soups in supermarkets, hypermarkets, and online channels.
The Catering segment is expected to witness the fastest CAGR from 2026 to 2033, driven by increasing adoption in institutional catering, restaurants, and quick-service establishments. The demand for ready-to-serve soups in bulk packaging is rising among caterers and hospitality service providers seeking time-efficient and cost-effective meal solutions.
- By Distribution Channel
On the basis of distribution channel, the Global Ready to Eat Soup Market is segmented into HoReCa (Hotels, Restaurants, and Cafés) and B2C (Business-to-Consumer). The B2C segment dominated the market with a revenue share of 61.5% in 2025, owing to strong demand from retail consumers and rapid expansion of online grocery platforms. Consumers increasingly purchase ready to eat soups through supermarkets and e-commerce for convenience and variety.
The HoReCa segment is projected to exhibit the fastest CAGR during the forecast period, driven by growing demand from hotels, restaurants, and catering services that utilize ready to eat soups for quick menu preparation, consistency in taste, and operational efficiency.
Global Ready to Eat Soup Market Regional Analysis
- North America dominated the Global Ready to Eat Soup Market with the largest revenue share of 36% in 2025, driven by the growing demand for convenient meal solutions, busy lifestyles, and increasing consumer preference for healthy, ready-to-consume food options.
- Consumers in the region highly value the convenience, nutritional balance, and variety offered by ready to eat soups, with strong brand loyalty toward leading manufacturers such as Campbell Soup Company, General Mills, and The Kraft Heinz Company.
- This widespread adoption is further supported by high disposable incomes, the popularity of on-the-go meals, and growing health awareness, making ready to eat soups a staple choice for both households and foodservice sectors across the United States and Canada. The market’s expansion is also bolstered by continuous product innovation, including organic, plant-based, and low-sodium variants, catering to evolving consumer dietary preferences.
U.S. Ready to Eat Soup Market Insight
The U.S. Ready to Eat Soup Market captured the largest revenue share of 81% in 2025 within North America, fueled by the increasing demand for convenient meal options among busy consumers and the rising trend of healthy eating. The growing number of working professionals, coupled with a preference for quick yet nutritious food, has accelerated the consumption of ready to eat soups. Furthermore, innovations by key players such as Campbell Soup Company and The Kraft Heinz Company, focusing on organic, low-sodium, and protein-enriched variants, continue to drive market growth. The increasing availability of these products through both offline retail and e-commerce platforms is also contributing significantly to market expansion.
Europe Ready to Eat Soup Market Insight
The Europe Ready to Eat Soup Market is projected to expand at a substantial CAGR throughout the forecast period, primarily driven by strong consumer demand for convenient, nutritious, and sustainably packaged food products. The region’s emphasis on healthy eating habits and eco-friendly consumption is fueling interest in organic and plant-based soups. European consumers are increasingly drawn to ready to eat soups that offer balanced nutrition and align with vegetarian or vegan lifestyles. Moreover, innovation in flavors, clean-label ingredients, and recyclable packaging is further promoting growth. The market is witnessing robust expansion across retail and foodservice sectors, particularly in urban centers.
U.K. Ready to Eat Soup Market Insight
The U.K. Ready to Eat Soup Market is anticipated to grow at a noteworthy CAGR during the forecast period, driven by the increasing adoption of convenient meal solutions and rising health awareness among consumers. Concerns related to nutrition and the desire for healthier alternatives are encouraging demand for soups made with natural, organic, and locally sourced ingredients. The strong presence of retail chains and online grocery platforms is enhancing product accessibility, while innovations from brands like Heinz and Premier Foods continue to cater to diverse taste preferences. Additionally, the growing vegan and flexitarian population in the U.K. is driving the shift toward plant-based soup varieties.
Germany Ready to Eat Soup Market Insight
The Germany Ready to Eat Soup Market is expected to expand at a considerable CAGR during the forecast period, fueled by the increasing popularity of healthy, ready-to-consume meals among urban consumers. Germany’s focus on sustainability and organic food production supports the growth of natural and preservative-free soup variants. The market is benefiting from technological advancements in packaging and the rising trend of premium, gourmet-style ready to eat soups. Consumers’ growing preference for convenience, coupled with their interest in nutritional transparency, is shaping demand in both retail and foodservice channels. The integration of eco-friendly packaging and innovative flavors is also a key growth driver in the German market.
Asia-Pacific Ready to Eat Soup Market Insight
The Asia-Pacific Ready to Eat Soup Market is poised to grow at the fastest CAGR of 24% during 2026 to 2033, driven by rising urbanization, increasing disposable incomes, and changing dietary patterns in countries such as China, Japan, and India. The rapid expansion of the food processing industry and the growing influence of Western eating habits are fueling demand for ready to eat soups across the region. Additionally, government initiatives promoting food safety and digital retail are boosting accessibility. The growing popularity of instant, healthy, and portable meal options among young professionals and students further supports strong regional growth.
Japan Ready to Eat Soup Market Insight
The Japan Ready to Eat Soup Market is gaining traction due to the country’s fast-paced lifestyle, advanced food technology, and preference for high-quality, convenient meal options. Japanese consumers value health, freshness, and portion control, making single-serve and microwavable soups highly popular. The market is also being driven by the aging population’s need for easy-to-prepare, nutritious food solutions. Leading domestic and international brands are focusing on traditional Japanese flavors and functional ingredients to appeal to local consumers. Moreover, innovations in packaging and product formulations are enhancing convenience and extending shelf life, fueling continued market expansion.
China Ready to Eat Soup Market Insight
The China Ready to Eat Soup Market accounted for the largest revenue share in the Asia-Pacific region in 2025, attributed to the country’s rapid urbanization, growing middle class, and rising interest in healthy convenience foods. China’s expanding e-commerce ecosystem and the increasing availability of affordable ready to eat soups through online and retail channels are key factors propelling growth. Domestic and international manufacturers are investing in localized flavors and nutritious formulations to appeal to diverse consumer preferences. Additionally, the surge in working professionals and the influence of Western dietary habits are further contributing to the market’s strong performance.
Global Ready to Eat Soup Market Share
The Ready to Eat Soup industry is primarily led by well-established companies, including:
• Campbell Soup Company (U.S.)
• Kraft Heinz Company (U.S.)
• Nestlé S.A. (Switzerland)
• Hain Celestial Group (U.S.)
• ConAgra Brands (U.S.)
• General Mills, Inc. (U.S.)
• Unilever PLC (U.K./Netherlands)
• Premier Foods plc (U.K.)
• PepsiCo, Inc. (U.S.)
• Souper Salad Co. (U.S.)
• Bonduelle S.A. (France)
• B&G Foods, Inc. (U.S.)
• AdeS (Brazil)
• Tomato King Co., Ltd. (China)
• Healthy Choice (U.S.)
• Sapporo Foods Co., Ltd. (Japan)
• Chupa Chups Ready Meals (Spain)
• McCain Foods Limited (Canada)
• Thai Union Group PCL (Thailand)
• Asian Home Gourmet (Singapore)
What are the Recent Developments in Global Ready to Eat Soup Market?
- In April 2024, Campbell Soup Company, a global leader in convenient food solutions, launched a strategic initiative in South Africa aimed at expanding the availability of its ready to eat soups in retail and foodservice channels. This initiative underscores the company’s commitment to delivering high-quality, nutritious, and convenient meal options tailored to regional taste preferences. By leveraging its global expertise and diverse product portfolio, Campbell is addressing local consumer demand while strengthening its presence in the rapidly growing Global Ready to Eat Soup Market.
- In March 2024, Hain Celestial Group, a U.S.-based natural and organic food company, introduced a new line of organic ready to eat soups specifically designed for schools, hospitals, and corporate cafeterias. The innovative range focuses on nutritional value and clean-label ingredients, offering convenient and healthy meal solutions. This advancement highlights Hain Celestial’s commitment to meeting evolving consumer expectations for wholesome, ready-to-eat products in institutional settings.
- In March 2024, Nestlé S.A. successfully launched the China Urban Convenience Soup Project, aimed at providing high-quality, ready to eat soups to busy urban professionals across major cities. This initiative utilizes advanced packaging technologies and locally inspired flavors to enhance convenience while maintaining freshness and nutritional value. The project underscores Nestlé’s dedication to addressing urban dietary needs and boosting adoption of ready to eat meals in fast-paced environments.
- In February 2024, Premier Foods plc, a leading U.K.-based packaged foods company, announced a strategic partnership with national retail chains to introduce a smart inventory and distribution program for ready to eat soups. This collaboration is designed to improve product availability, streamline supply chains, and ensure fresher products reach consumers efficiently. The initiative emphasizes Premier Foods’ focus on operational innovation and market expansion.
- In January 2024, Kraft Heinz Company unveiled its Heinz Microwavable Ready to Eat Soup Range at the International Food Expo 2024. This new product line features single-serve, microwave-ready portions designed for maximum convenience and extended shelf life. The launch highlights Kraft Heinz’s commitment to integrating modern convenience with traditional flavors, providing consumers with quick, nutritious, and easy-to-prepare meal options while reinforcing its leadership in the Global Ready to Eat Soup Market.
SKU-
Get online access to the report on the World's First Market Intelligence Cloud

- Interactive Data Analysis Dashboard
- Company Analysis Dashboard for high growth potential opportunities
- Research Analyst Access for customization & queries
- Competitor Analysis with Interactive dashboard
- Latest News, Updates & Trend analysis
- Harness the Power of Benchmark Analysis for Comprehensive Competitor Tracking
Global Ready To Eat Soup Market, Supply Chain Analysis and Ecosystem Framework
To support market growth and help clients navigate the impact of geopolitical shifts, DBMR has integrated in-depth supply chain analysis into its Global Ready To Eat Soup Market research reports. This addition empowers clients to respond effectively to global changes affecting their industries. The supply chain analysis section includes detailed insights such as Global Ready To Eat Soup Market consumption and production by country, price trend analysis, the impact of tariffs and geopolitical developments, and import and export trends by country and HSN code. It also highlights major suppliers with data on production capacity and company profiles, as well as key importers and exporters. In addition to research, DBMR offers specialized supply chain consulting services backed by over a decade of experience, providing solutions like supplier discovery, supplier risk assessment, price trend analysis, impact evaluation of inflation and trade route changes, and comprehensive market trend analysis.
Research Methodology
Data collection and base year analysis are done using data collection modules with large sample sizes. The stage includes obtaining market information or related data through various sources and strategies. It includes examining and planning all the data acquired from the past in advance. It likewise envelops the examination of information inconsistencies seen across different information sources. The market data is analysed and estimated using market statistical and coherent models. Also, market share analysis and key trend analysis are the major success factors in the market report. To know more, please request an analyst call or drop down your inquiry.
The key research methodology used by DBMR research team is data triangulation which involves data mining, analysis of the impact of data variables on the market and primary (industry expert) validation. Data models include Vendor Positioning Grid, Market Time Line Analysis, Market Overview and Guide, Company Positioning Grid, Patent Analysis, Pricing Analysis, Company Market Share Analysis, Standards of Measurement, Global versus Regional and Vendor Share Analysis. To know more about the research methodology, drop in an inquiry to speak to our industry experts.
Customization Available
Data Bridge Market Research is a leader in advanced formative research. We take pride in servicing our existing and new customers with data and analysis that match and suits their goal. The report can be customized to include price trend analysis of target brands understanding the market for additional countries (ask for the list of countries), clinical trial results data, literature review, refurbished market and product base analysis. Market analysis of target competitors can be analyzed from technology-based analysis to market portfolio strategies. We can add as many competitors that you require data about in the format and data style you are looking for. Our team of analysts can also provide you data in crude raw excel files pivot tables (Fact book) or can assist you in creating presentations from the data sets available in the report.

