
Global Procurement As A Service Market
Market Size in USD Billion
CAGR :
% 
 USD
9.46 Billion
USD
16.49 Billion
2024
2032
USD
9.46 Billion
USD
16.49 Billion
2024
2032
| 2025 - 2032 | |
| USD 9.46 Billion | |
| USD 16.49 Billion | |
| % | |
|
Procurement as a Service Market Size
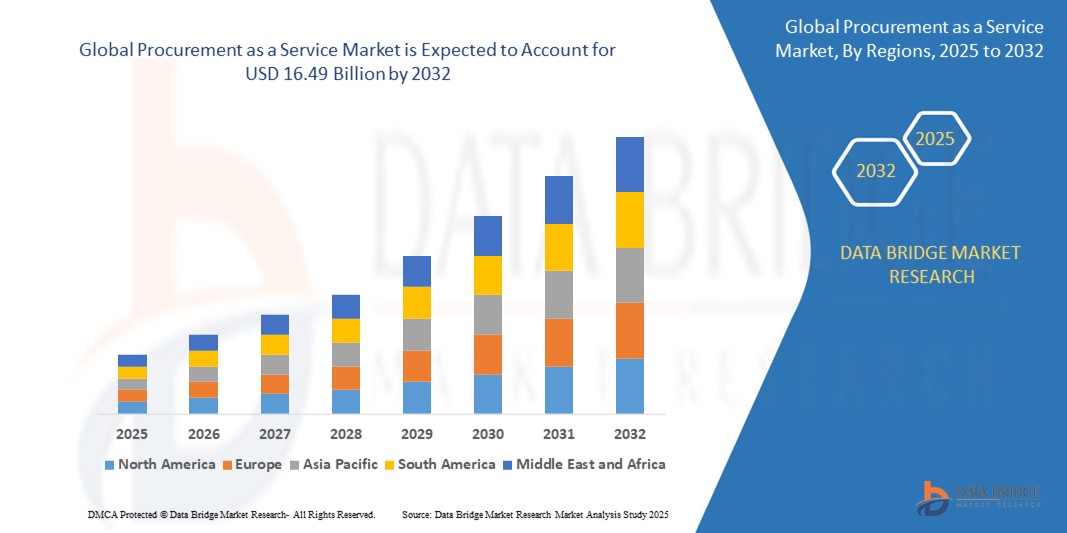
- The global procurement as a service market size was valued at USD 9.46 billion in 2024 and is expected to reach USD 16.49 billion by 2032, at a CAGR of 7.20% during the forecast period
- This growth is driven by factors such as need for cost efficiency, technological advancements such as AI and automation, and scalability to adapt to business growth
Procurement as a Service Market Analysis
- Procurement as a Service is a crucial tool used to streamline and optimize procurement processes, enhancing operational efficiency, cost-effectiveness, and supplier management. It plays a vital role in improving procurement decision-making, fostering better supplier relationships, and ensuring regulatory compliance across various industries
- The market is experiencing robust growth, driven by the increasing demand for cost-efficient procurement solutions, advancements in automation and artificial intelligence technologies, a heightened focus on strategic sourcing, and the growing complexity of global supply chains
- Europe is expected to dominate the procurement as a service market with a share of 40.5% due to presence of major market players, advanced digital infrastructure, and strong government support for digital transformation initiatives
- Asia-Pacific is expected to be the fastest growing region in the procurement as a service market during the forecast period due to rapid digitalization, significant investments in technological advancements, and an expanding middle class in emerging economies
- Large enterprises segment is expected to dominate the market with a market share of 70.5% due to their greater need for scalable, cost-efficient solutions. Large enterprises typically have complex procurement processes, involving multiple suppliers and higher volumes of transactions, which makes outsourcing these functions more attractive
Report Scope and Procurement as a Service Market Segmentation
|
Attributes |
Procurement as a Service Key Market Insights |
|
Segments Covered |
|
|
Countries Covered |
North America
Europe
Asia-Pacific
Middle East and Africa
South America
|
|
Key Market Players |
|
|
Market Opportunities |
|
|
Value Added Data Infosets |
In addition to the market insights such as market value, growth rate, market segments, geographical coverage, market players, and market scenario, the market report curated by the Data Bridge Market Research team includes in-depth expert analysis, import/export analysis, pricing analysis, production consumption analysis, and pestle analysis. |
Procurement as a Service Market Trends
“Growing Demand for Procurement”
- One prominent trend in the global procurement as a service market is the growing demand for procurement
- This trend is driven by the need for enhanced operational efficiency, better supplier management, and the increasing complexity of global supply chains
- For instance, companies such as IBM and Accenture are advancing procurement as a service offerings by integrating automation and artificial intelligence to streamline sourcing, automate tasks, and improve strategic decision-making
- The integration of automation and artificial intelligence into procurement processes is further accelerating this trend, enabling faster and more accurate procurement cycles
- As businesses focus on reducing operational costs and improving procurement outcomes, the adoption of procurement as a service is expected to significantly contribute to market growth, especially among small and medium-sized enterprises
Procurement as a Service Market Dynamics
Driver
“Rising Technological Advancements”
- The growing integration of advanced technologies is a key driver for the expansion of the procurement as a service market, as organizations look for smarter, more efficient ways to manage their procurement processes
- This shift is particularly noticeable in sectors such as manufacturing and retail, where automation, AI, and data analytics are transforming procurement into a more strategic and streamlined function
- As companies face pressure to optimize costs, enhance supplier relationships, and improve decision-making, the demand for advanced procurement solutions powered by cutting-edge technologies is rising
- Technology-driven platforms are evolving to include tools such as AI-based supplier selection, predictive analytics for demand forecasting, and robotic process automation (RPA) for invoice processing and procurement workflows
- The drive towards digital transformation is propelling the growth of procurement as a service, as businesses prioritize real-time insights, improved operational efficiencies, and enhanced supplier collaboration
For instance,
- Accenture has developed AI-powered procurement solutions that leverage machine learning to optimize supplier relationships and streamline sourcing processes
- IBM’s Watson is being integrated into procurement platforms to help organizations make smarter decisions based on predictive analytics and market trends
- The market is poised for substantial growth, driven by the demand for innovative procurement technologies, the need for efficiency in global supply chains, and the broader trend of digital transformation across industries
Opportunity
“Growing Emphasis on Cost Efficiency and Streamlined Operations”
- The increasing focus on cost efficiency and streamlined operations presents a significant opportunity for the procurement as a service market, as businesses seek to reduce procurement costs and improve operational efficiency without large upfront investments
- Organizations are increasingly adopting cloud-based procurement solutions to automate tasks, reduce manual intervention, and drive cost savings, which is fueling demand for innovative procurement as a service offerings that streamline procurement processes
- This shift aligns with the broader push for digital transformation, where procurement as a service solutions help businesses optimize supply chains, enhance vendor management, and enable more agile decision-making
For instance,
- Ariba, a SAP company, offers procurement solutions that integrate with cloud platforms, enabling organizations to automate procurement workflows and achieve greater operational efficiency at lower costs
- Oracle provides a comprehensive cloud-based procurement suite that integrates with enterprise resource planning (ERP) systems, allowing businesses to streamline sourcing, procurement, and supplier relationship management processes
- As businesses increasingly prioritize cost reduction and process optimization, the demand for procurement as a service solutions that offer efficiency, scalability, and real-time data access is expected to drive significant market growth and innovation
Restraint/Challenge
“Lack of Standardization”
- The lack of standardization across procurement platforms presents a significant challenge for the procurement as a service market, particularly as organizations seek to streamline and unify their procurement processes
- The absence of universal standards for data formats, supplier management, and workflow integration increases the complexity of adopting and implementing procurement as a service solutions, leading to inefficiencies and higher implementation costs
- This challenge is particularly prominent in industries with diverse procurement needs and varying supplier ecosystems, where organizations must manage multiple platforms with different systems, processes, and protocols, complicating the overall procurement process
For instance,
- Workday’s procurement solutions often require extensive customization to meet the unique needs of different industries, which can increase costs and delay implementation timelines
- Without consistent standards, organizations may struggle to fully leverage procurement as a service solutions, especially in multi-regional or multi-industry environments, which can hinder market growth and slow down the adoption of more advanced procurement technologies
Procurement as a Service Market Scope
The market is segmented on the basis of component, enterprise size, and vertical.
|
Segmentation |
Sub-Segmentation |
|
By Component |
|
|
By Enterprise Size |
|
|
By Vertical |
|
In 2025, the large enterprises is projected to dominate the market with a largest share in enterprise size segment
The large enterprises segment is expected to dominate the procurement as a service market with the largest share of 70.5% in 2025 due to their greater need for scalable, cost-efficient solutions. Large enterprises typically have complex procurement processes, involving multiple suppliers and higher volumes of transactions, which makes outsourcing these functions more attractive.
The strategic sourcing is expected to account for the largest share during the forecast period in component market
In 2025, the strategic sourcing segment is expected to dominate the market with the largest market share of 30.5% due to increasing focus on optimizing procurement processes and achieving cost savings. Organizations are placing greater emphasis on strategic sourcing to enhance supplier relationships, negotiate better contracts, and improve overall procurement efficiency.
Procurement as a Service Market Regional Analysis
“Europe Holds the Largest Share in the Procurement as a service Market”
- Europe dominates the procurement as a service market with a share of 40.5%, driven by the presence of major market players, advanced digital infrastructure, and strong government support for digital transformation initiatives
- U.K. holds a significant share of due to its well-established procurement systems, high adoption of cloud-based technologies, and ongoing focus on efficiency in public and private sector procurement
- The region’s mature markets, coupled with advancements in AI-driven procurement platforms and automation, position Europe as a leader in the procurement as a service market. Continuous investments in smart procurement technologies and a focus on sustainability further enhance its market presence, bolstering Europe’s dominance through 2032
- As companies increasingly seek to optimize procurement processes and reduce costs, Europe is expected to maintain its leading role in the market, supported by favorable regulations, advanced technological infrastructure, and a highly skilled workforce
“Asia-Pacific is Projected to Register the Highest CAGR in the Procurement as a service Market”
- Asia-Pacific is expected to witness the highest growth rate in the procurement as a service market with a share of, driven by rapid digitalization, significant investments in technological advancements, and an expanding middle class in emerging economies
- China holds a significant share of due to its rapidly expanding economy, increasing demand for digital transformation in procurement, and growing adoption of cloud-based platforms
- The region’s surge in e-commerce, manufacturing, and retail sectors is fueling the demand for more efficient procurement solutions to manage complex supply chains, optimize costs, and streamline operations. Local providers are also contributing by offering customized procurement as a service solutions tailored to the unique needs of regional industries
- With strong government support for digital initiatives, public-private collaborations, and increasing access to cloud-based platforms, Asia-Pacific is set to emerge as the fastest-growing region in the market, with sustained growth expected through 2032
Procurement as a Service Market Share
The market competitive landscape provides details by competitor. Details included are company overview, company financials, revenue generated, market potential, investment in research and development, new market initiatives, global presence, production sites and facilities, production capacities, company strengths and weaknesses, product launch, product width and breadth, application dominance. The above data points provided are only related to the companies' focus related to market.
The Major Market Leaders Operating in the Market Are:
- Accenture (Ireland)
- Infosys Limited (India)
- Aegis (India)
- Xchanging (U.K.)
- Genpact (U.S.)
- TATA Consultancy Services Limited (India)
- HCL Technologies Limited (India)
- WNS (Holdings) Ltd. (India)
- Wipro (India)
- Capgemini (France)
- IBM (U.S.)
Latest Developments in Global Procurement as a Service Market
- In November 2022, IBM and Vodafone collaborated to explore Quantum-Safe Cryptography and Quantum Computing. This partnership aims to enhance security systems, addressing the growing need for data protection against future quantum computing threats. The development of quantum-safe cryptography could significantly impact industries, including procurement, by setting new standards for data encryption and security
- In January 2022, Bain & Company acquired Proxima, boosting its expertise in supply chain and procurement. The acquisition strengthens Bain's procurement offerings by integrating Proxima's specialized knowledge. This move enhances Bain's ability to provide more strategic and data-driven procurement solutions, addressing the growing demand for efficiency in a complex global market
SKU-
Get online access to the report on the World's First Market Intelligence Cloud

- Interactive Data Analysis Dashboard
- Company Analysis Dashboard for high growth potential opportunities
- Research Analyst Access for customization & queries
- Competitor Analysis with Interactive dashboard
- Latest News, Updates & Trend analysis
- Harness the Power of Benchmark Analysis for Comprehensive Competitor Tracking
Table of Content
1 INTRODUCTION
1.1 OBJECTIVES OF THE STUDY
1.2 MARKET DEFINITION
1.3 OVERVIEW OF GLOBAL PROCUREMENT AS A SERVICE MARKET
1.4 CURRENCY AND PRICING
1.5 LIMITATION
1.6 MARKETS COVERED
2 MARKET SEGMENTATION
2.1 KEY TAKEAWAYS
2.2 ARRIVING AT THE GLOBAL PROCUREMENT AS A SERVICE MARKET
2.2.1 VENDOR POSITIONING GRID
2.2.2 TECHNOLOGY LIFE LINE CURVE
2.2.3 MARKET GUIDE
2.2.4 COMPANY POSITIONING GRID
2.2.5 MULTIVARIATE MODELLING
2.2.6 STANDARDS OF MEASUREMENT
2.2.7 TOP TO BOTTOM ANALYSIS
2.2.8 VENDOR SHARE ANALYSIS
2.2.9 DATA POINTS FROM KEY PRIMARY INTERVIEWS
2.2.10 DATA POINTS FROM KEY SECONDARY DATABASES
2.3 GLOBAL PROCUREMENT AS A SERVICE MARKET: RESEARCH SNAPSHOT
2.4 ASSUMPTIONS
3 MARKET OVERVIEW
3.1 DRIVERS
3.2 RESTRAINTS
3.3 OPPORTUNITIES
3.4 CHALLENGES
4 EXECUTIVE SUMMARY
5 PREMIUM INSIGHTS
5.1 CASE STUDIES
5.2 REGULATORY FRAMEWORK
5.3 TECHNOLOGICAL TRENDS
5.4 PRICING ANALYSIS
5.5 VALUE CHAIN ANALYSIS
6 GLOBAL PROCUREMENT AS A SERVICE MARKET, BY COMPONENT
6.1 OVERVIEW
6.2 CONTRACT MANAGEMENT
6.3 CATEGORY MANAGEMENT
6.4 PROCESS MANAGEMENT
6.5 TRANSACTIONS MANAGEMENT
6.6 SPEND MANAGEMENT
6.7 STRATEGIC SOURCING
6.8 OTHERS
7 GLOBAL PROCUREMENT AS A SERVICE MARKET, BY ORGANIZATION SIZE
7.1 OVERVIEW
7.2 SMALL SCALE ORGANIZATIONS
7.3 MEDIUM SCALE ORGANIZATIONS
7.4 LARGE SCALE ORGANIZATIONS
8 GLOBAL PROCUREMENT AS A SERVICE MARKET, BY END-USE
8.1 OVERVIEW
8.2 BFSI
8.2.1 BY COMPONENT
8.2.1.1. .CONTRACT MANAGEMENT
8.2.1.2. .CATEGORY MANAGEMENT
8.2.1.3. .PROCESS MANAGEMENT
8.2.1.4. .TRANSACTIONS MANAGEMENT
8.2.1.5. .SPEND MANAGEMENT
8.2.1.6. .STRATEGIC SOURCING
8.2.1.7. .OTHERS
8.3 IT & TELECOM
8.3.1 BY COMPONENT
8.3.1.1. .CONTRACT MANAGEMENT
8.3.1.2. .CATEGORY MANAGEMENT
8.3.1.3. .PROCESS MANAGEMENT
8.3.1.4. .TRANSACTIONS MANAGEMENT
8.3.1.5. .SPEND MANAGEMENT
8.3.1.6. .STRATEGIC SOURCING
8.3.1.7. .OTHERS
8.4 HEALTHCARE
8.4.1 BY COMPONENT
8.4.1.1. .CONTRACT MANAGEMENT
8.4.1.2. .CATEGORY MANAGEMENT
8.4.1.3. .PROCESS MANAGEMENT
8.4.1.4. .TRANSACTIONS MANAGEMENT
8.4.1.5. .SPEND MANAGEMENT
8.4.1.6. .STRATEGIC SOURCING
8.4.1.7. .OTHERS
8.5 ENERGY & UTILITIES
8.5.1 BY COMPONENT
8.5.1.1. .CONTRACT MANAGEMENT
8.5.1.2. .CATEGORY MANAGEMENT
8.5.1.3. .PROCESS MANAGEMENT
8.5.1.4. .TRANSACTIONS MANAGEMENT
8.5.1.5. .SPEND MANAGEMENT
8.5.1.6. .STRATEGIC SOURCING
8.5.1.7. .OTHERS
8.6 TRAVEL & HOSPITALITY
8.6.1 BY COMPONENT
8.6.1.1. .CONTRACT MANAGEMENT
8.6.1.2. .CATEGORY MANAGEMENT
8.6.1.3. .PROCESS MANAGEMENT
8.6.1.4. .TRANSACTIONS MANAGEMENT
8.6.1.5. .SPEND MANAGEMENT
8.6.1.6. .STRATEGIC SOURCING
8.6.1.7. .OTHERS
8.7 MANUFACTURING
8.7.1 BY COMPONENT
8.7.1.1. .CONTRACT MANAGEMENT
8.7.1.2. .CATEGORY MANAGEMENT
8.7.1.3. .PROCESS MANAGEMENT
8.7.1.4. .TRANSACTIONS MANAGEMENT
8.7.1.5. .SPEND MANAGEMENT
8.7.1.6. .STRATEGIC SOURCING
8.7.1.7. .OTHERS
8.8 RETAIL & CONSUMER GOODS
8.8.1 BY COMPONENT
8.8.1.1. CONTRACT MANAGEMENT
8.8.1.2. .CATEGORY MANAGEMENT
8.8.1.3. .PROCESS MANAGEMENT
8.8.1.4. .TRANSACTIONS MANAGEMENT
8.8.1.5. .SPEND MANAGEMENT
8.8.1.6. .STRATEGIC SOURCING
8.8.1.7. .OTHERS
8.9 OTHERS
8.9.1 BY COMPONENT
8.9.1.1. .CONTRACT MANAGEMENT
8.9.1.2. .CATEGORY MANAGEMENT
8.9.1.3. .PROCESS MANAGEMENT
8.9.1.4. .TRANSACTIONS MANAGEMENT
8.9.1.5. .SPEND MANAGEMENT
8.9.1.6. .STRATEGIC SOURCING
8.9.1.7. .OTHERS
9 GLOBAL PROCUREMENT AS A SERVICE MARKET, BY REGION
Global PROCUREMENT AS A SERVICE Market, (ALL SEGMENTATION PROVIDED ABOVE IS REPRESENTED IN THIS CHAPTER BY COUNTRY)
9.1 NORTH AMERICA
9.1.1 U.S.
9.1.2 CANADA
9.1.3 MEXICO
9.2 EUROPE
9.2.1 GERMANY
9.2.2 FRANCE
9.2.3 U.K.
9.2.4 ITALY
9.2.5 SPAIN
9.2.6 RUSSIA
9.2.7 TURKEY
9.2.8 BELGIUM
9.2.9 NETHERLANDS
9.2.10 SWITZERLAND
9.2.11 REST OF EUROPE
9.3 ASIA PACIFIC
9.3.1 JAPAN
9.3.2 CHINA
9.3.3 SOUTH KOREA
9.3.4 INDIA
9.3.5 AUSTRALIA
9.3.6 SINGAPORE
9.3.7 THAILAND
9.3.8 MALAYSIA
9.3.9 INDONESIA
9.3.10 PHILIPPINES
9.3.11 REST OF ASIA PACIFIC
9.4 SOUTH AMERICA
9.4.1 BRAZIL
9.4.2 ARGENTINA
9.4.3 REST OF SOUTH AMERICA
9.5 MIDDLE EAST AND AFRICA
9.5.1 SOUTH AFRICA
9.5.2 EGYPT
9.5.3 SAUDI ARABIA
9.5.4 U.A.E
9.5.5 ISRAEL
9.5.6 REST OF MIDDLE EAST AND AFRICA
10 GLOBAL PROCUREMENT AS A SERVICE MARKET,COMPANY LANDSCAPE
10.1 COMPANY SHARE ANALYSIS: GLOBAL
10.2 COMPANY SHARE ANALYSIS: NORTH AMERICA
10.3 COMPANY SHARE ANALYSIS: EUROPE
10.4 COMPANY SHARE ANALYSIS: ASIA-PACIFIC
10.5 MERGERS & ACQUISITIONS
10.6 NEW PRODUCT DEVELOPMENT AND APPROVALS
10.7 EXPANSIONS
10.8 REGULATORY CHANGES
10.9 PARTNERSHIP AND OTHER STRATEGIC DEVELOPMENTS
11 GLOBAL PROCUREMENT AS A SERVICE MARKET, SWOT AND DBMR ANALYSIS
12 GLOBAL PROCUREMENT AS A SERVICE MARKET, COMPANY PROFILE
12.1 ACCENTURE PLC
12.1.1 COMPANY SNAPSHOT
12.1.2 REVENUE ANALYSIS
12.1.3 GEOGRAPHIC PRESENCE
12.1.4 PRODUCT PORTFOLIO
12.1.5 RECENT DEVELOPMENTS
12.2 GENPACT LLC
12.2.1 COMPANY SNAPSHOT
12.2.2 REVENUE ANALYSIS
12.2.3 GEOGRAPHIC PRESENCE
12.2.4 PRODUCT PORTFOLIO
12.2.5 RECENT DEVELOPMENTS
12.3 INFOSYS LIMITED
12.3.1 COMPANY SNAPSHOT
12.3.2 REVENUE ANALYSIS
12.3.3 GEOGRAPHIC PRESENCE
12.3.4 PRODUCT PORTFOLIO
12.3.5 RECENT DEVELOPMENTS
12.4 CA TECHNOLOGIES
12.4.1 COMPANY SNAPSHOT
12.4.2 REVENUE ANALYSIS
12.4.3 GEOGRAPHIC PRESENCE
12.4.4 PRODUCT PORTFOLIO
12.4.5 RECENT DEVELOPMENTS
12.5 GEP
12.5.1 COMPANY SNAPSHOT
12.5.2 REVENUE ANALYSIS
12.5.3 GEOGRAPHIC PRESENCE
12.5.4 PRODUCT PORTFOLIO
12.5.5 RECENT DEVELOPMENTS
12.6 XCHANGING SOLUTIONS LTD
12.6.1 COMPANY SNAPSHOT
12.6.2 REVENUE ANALYSIS
12.6.3 GEOGRAPHIC PRESENCE
12.6.4 PRODUCT PORTFOLIO
12.6.5 RECENT DEVELOPMENTS
12.7 TATA CONSULTANCY SERVICES
12.7.1 COMPANY SNAPSHOT
12.7.2 REVENUE ANALYSIS
12.7.3 GEOGRAPHIC PRESENCE
12.7.4 PRODUCT PORTFOLIO
12.7.5 RECENT DEVELOPMENTS
12.8 WIPRO LIMITED
12.8.1 COMPANY SNAPSHOT
12.8.2 REVENUE ANALYSIS
12.8.3 GEOGRAPHIC PRESENCE
12.8.4 PRODUCT PORTFOLIO
12.8.5 RECENT DEVELOPMENTS
12.9 HCL TECHNOLOGIES LIMITED
12.9.1 COMPANY SNAPSHOT
12.9.2 REVENUE ANALYSIS
12.9.3 GEOGRAPHIC PRESENCE
12.9.4 PRODUCT PORTFOLIO
12.9.5 RECENT DEVELOPMENTS
12.1 IBM CORPORATION
12.10.1 COMPANY SNAPSHOT
12.10.2 REVENUE ANALYSIS
12.10.3 GEOGRAPHIC PRESENCE
12.10.4 PRODUCT PORTFOLIO
12.10.5 RECENT DEVELOPMENTS
12.11 CAPGEMINI SE
12.11.1 COMPANY SNAPSHOT
12.11.2 REVENUE ANALYSIS
12.11.3 GEOGRAPHIC PRESENCE
12.11.4 PRODUCT PORTFOLIO
12.11.5 RECENT DEVELOPMENTS
12.12 PROXIMA PROCUREMENT LTD
12.12.1 COMPANY SNAPSHOT
12.12.2 REVENUE ANALYSIS
12.12.3 GEOGRAPHIC PRESENCE
12.12.4 PRODUCT PORTFOLIO
12.12.5 RECENT DEVELOPMENTS
12.13 WNS GLOBAL
12.13.1 COMPANY SNAPSHOT
12.13.2 REVENUE ANALYSIS
12.13.3 GEOGRAPHIC PRESENCE
12.13.4 PRODUCT PORTFOLIO
12.13.5 RECENT DEVELOPMENTS
12.14 RFCODE
12.14.1 COMPANY SNAPSHOT
12.14.2 REVENUE ANALYSIS
12.14.3 GEOGRAPHIC PRESENCE
12.14.4 PRODUCT PORTFOLIO
12.14.5 RECENT DEVELOPMENTS
12.15 AEGIS
12.15.1 COMPANY SNAPSHOT
12.15.2 REVENUE ANALYSIS
12.15.3 GEOGRAPHIC PRESENCE
12.15.4 PRODUCT PORTFOLIO
12.15.5 RECENT DEVELOPMENTS
12.16 CORBUS
12.16.1 COMPANY SNAPSHOT
12.16.2 REVENUE ANALYSIS
12.16.3 GEOGRAPHIC PRESENCE
12.16.4 PRODUCT PORTFOLIO
12.16.5 RECENT DEVELOPMENTS
12.17 CEPROCS
12.17.1 COMPANY SNAPSHOT
12.17.2 REVENUE ANALYSIS
12.17.3 GEOGRAPHIC PRESENCE
12.17.4 PRODUCT PORTFOLIO
12.17.5 RECENT DEVELOPMENTS
12.18 KRONOS GROUP
12.18.1 COMPANY SNAPSHOT
12.18.2 REVENUE ANALYSIS
12.18.3 GEOGRAPHIC PRESENCE
12.18.4 PRODUCT PORTFOLIO
12.18.5 RECENT DEVELOPMENTS
12.19 BEROE, INC
12.19.1 COMPANY SNAPSHOT
12.19.2 REVENUE ANALYSIS
12.19.3 GEOGRAPHIC PRESENCE
12.19.4 PRODUCT PORTFOLIO
12.19.5 RECENT DEVELOPMENTS
12.2 EDS INTERNATIONAL
12.20.1 COMPANY SNAPSHOT
12.20.2 REVENUE ANALYSIS
12.20.3 GEOGRAPHIC PRESENCE
12.20.4 PRODUCT PORTFOLIO
12.20.5 RECENT DEVELOPMENTS
12.21 DRAGON SOURCING
12.21.1 COMPANY SNAPSHOT
12.21.2 REVENUE ANALYSIS
12.21.3 GEOGRAPHIC PRESENCE
12.21.4 PRODUCT PORTFOLIO
12.21.5 RECENT DEVELOPMENTS
12.22 SAP ARIBA
12.22.1 COMPANY SNAPSHOT
12.22.2 REVENUE ANALYSIS
12.22.3 GEOGRAPHIC PRESENCE
12.22.4 PRODUCT PORTFOLIO
12.22.5 RECENT DEVELOPMENTS
12.23 BASWARE
12.23.1 COMPANY SNAPSHOT
12.23.2 REVENUE ANALYSIS
12.23.3 GEOGRAPHIC PRESENCE
12.23.4 PRODUCT PORTFOLIO
12.23.5 RECENT DEVELOPMENTS
12.24 JAGGAER
12.24.1 COMPANY SNAPSHOT
12.24.2 REVENUE ANALYSIS
12.24.3 GEOGRAPHIC PRESENCE
12.24.4 PRODUCT PORTFOLIO
12.24.5 RECENT DEVELOPMENTS
NOTE: THE COMPANIES PROFILED IS NOT EXHAUSTIVE LIST AND IS AS PER OUR PREVIOUS CLIENT REQUIREMENT. WE PROFILE MORE THAN 100 COMPANIES IN OUR STUDIES AND HENCE THE LIST OF COMPANIES CAN BE MODIFIED OR REPLACED ON REQUEST.
13 CONCLUSION
14 QUESTIONNAIRE
15 RELATED REPORTS
16 ABOUT DATA BRIDGE MARKET RESEARCH
Research Methodology
Data collection and base year analysis are done using data collection modules with large sample sizes. The stage includes obtaining market information or related data through various sources and strategies. It includes examining and planning all the data acquired from the past in advance. It likewise envelops the examination of information inconsistencies seen across different information sources. The market data is analysed and estimated using market statistical and coherent models. Also, market share analysis and key trend analysis are the major success factors in the market report. To know more, please request an analyst call or drop down your inquiry.
The key research methodology used by DBMR research team is data triangulation which involves data mining, analysis of the impact of data variables on the market and primary (industry expert) validation. Data models include Vendor Positioning Grid, Market Time Line Analysis, Market Overview and Guide, Company Positioning Grid, Patent Analysis, Pricing Analysis, Company Market Share Analysis, Standards of Measurement, Global versus Regional and Vendor Share Analysis. To know more about the research methodology, drop in an inquiry to speak to our industry experts.
Customization Available
Data Bridge Market Research is a leader in advanced formative research. We take pride in servicing our existing and new customers with data and analysis that match and suits their goal. The report can be customized to include price trend analysis of target brands understanding the market for additional countries (ask for the list of countries), clinical trial results data, literature review, refurbished market and product base analysis. Market analysis of target competitors can be analyzed from technology-based analysis to market portfolio strategies. We can add as many competitors that you require data about in the format and data style you are looking for. Our team of analysts can also provide you data in crude raw excel files pivot tables (Fact book) or can assist you in creating presentations from the data sets available in the report.


