
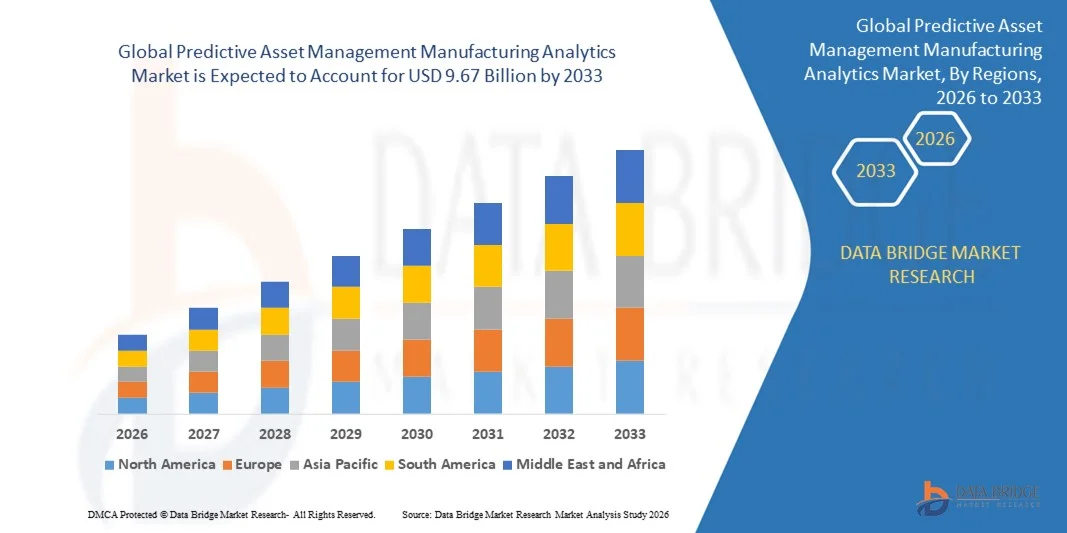
Global Predictive Asset Management Manufacturing Analytics Market
Market Size in USD Billion
 USD
9.67 Billion
USD
9.67 Billion
2025
2033
USD
9.67 Billion
USD
9.67 Billion
2025
2033
| 2026 - 2033 | |
| USD 9.67 Billion | |
| USD 9.67 Billion | |
| % | |
|
What is the Global Predictive Asset Management Manufacturing Analytics Market Size and Growth Rate?
- The global predictive asset management manufacturing analytics market size was valued at USD 9.67 billion in 2025 and is expected to reach USD 9.67 billion by 2033, at a CAGR of20.10% during the forecast period
- The growing need for process optimization, increasing adoption of advanced data management strategies across varied manufacturing applications, rising business agility and scalability, rising emergence of industrial internet of things (IIOT), prevalence of self-service access to centrally managed data, surging levels of investment on big data for manufacturing are some of the major as well as vital factors which will such asly to augment the growth of the predictive asset management manufacturing analytics market
What are the Major Takeaways of Predictive Asset Management Manufacturing Analytics Market?
- Increasing demand for real-time streaming analytics, prevalence of improved product design and development along with rising cloud adoption trends which will further contribute by generating massive opportunities that will lead to the growth of the predictive asset management manufacturing analytics market in the above mentioned projected timeframe
- Lack of integration with legacy systems, complex system structure along with lower return on investment which will such asly to act as market restraints factor for the growth of the predictive asset management manufacturing analytics in the above mentioned projected timeframe
- North America dominated the predictive asset management manufacturing analytics market with a 39.54% revenue share in 2025, driven by strong adoption of advanced manufacturing systems, predictive maintenance solutions, and AI-powered analytics platforms across the U.S. and Canada
- Asia-Pacific is projected to register the fastest CAGR of 11.9% from 2026 to 2033, fueled by rapid industrial expansion, smart manufacturing adoption, and investments in IoT, AI, and robotics across China, Japan, India, South Korea, and Southeast Asia
- The Software segment dominated the market with an estimated 62.4% share in 2025, driven by strong adoption of AI-based analytics platforms, machine learning models, and asset performance management software across manufacturing facilities
Report Scope and Predictive Asset Management Manufacturing Analytics Market Segmentation
|
Attributes |
Predictive Asset Management Manufacturing Analytics Key Market Insights |
|
Segments Covered |
|
|
Countries Covered |
North America
Europe
Asia-Pacific
Middle East and Africa
South America
|
|
Key Market Players |
|
|
Market Opportunities |
|
|
Value Added Data Infosets |
In addition to the insights on market scenarios such as market value, growth rate, segmentation, geographical coverage, and major players, the market reports curated by the Data Bridge Market Research also include in-depth expert analysis, pricing analysis, brand share analysis, consumer survey, demography analysis, supply chain analysis, value chain analysis, raw material/consumables overview, vendor selection criteria, PESTLE Analysis, Porter Analysis, and regulatory framework. |
What is the Key Trend in the Predictive Asset Management Manufacturing Analytics Market?
Increasing Shift Toward AI-Driven, Cloud-Integrated, and Real-Time Predictive Asset Management Analytics
- The predictive asset management manufacturing analytics market is witnessing strong adoption of AI-enabled and cloud-based analytics platforms designed to monitor equipment health, predict failures, and optimize asset performance across manufacturing operations
- Manufacturers are increasingly deploying machine learning models, digital twins, and real-time sensor data analytics to enable condition monitoring, anomaly detection, and predictive maintenance
- Growing demand for cost-efficient, scalable, and remotely accessible analytics solutions is driving adoption across discrete and process manufacturing plants, R&D facilities, and industrial operations
- For instance, companies such as IBM, SAP, Oracle, and Microsoft have enhanced their predictive asset management offerings with advanced AI algorithms, IoT integration, and cloud-native analytics capabilities
- Increasing need to minimize unplanned downtime, extend asset life cycles, and improve operational efficiency is accelerating the shift toward data-driven, predictive maintenance strategies
- As manufacturing systems become more automated and digitally connected, Predictive Asset Management Manufacturing Analytics will remain critical for real-time decision-making, asset reliability, and smart factory initiatives
What are the Key Drivers of Predictive Asset Management Manufacturing Analytics Market?
- Rising demand for predictive maintenance solutions to reduce equipment downtime, maintenance costs, and production losses across manufacturing industries
- For instance, in 2025, leading companies such as IBM, SAP, and SAS Institute expanded their manufacturing analytics platforms with AI-based predictive models and advanced asset performance management tools
- Growing adoption of Industrial IoT (IIoT), smart sensors, and connected machinery is boosting demand for advanced analytics across the U.S., Europe, and Asia-Pacific
- Advancements in big data analytics, cloud computing, AI, and digital twin technologies have strengthened accuracy, scalability, and real-time monitoring capabilities
- Increasing use of automation, robotics, and smart manufacturing systems is creating demand for data-driven asset optimization and failure prediction
- Supported by steady investments in Industry 4.0, digital transformation, and smart manufacturing infrastructure, the Predictive Asset Management Manufacturing Analytics market is expected to witness strong long-term growth
Which Factor is Challenging the Growth of the Predictive Asset Management Manufacturing Analytics Market?
- High implementation costs associated with advanced analytics platforms, IoT infrastructure, and AI model deployment restrict adoption among small and mid-sized manufacturers
- For instance, during 2024–2025, rising costs of industrial sensors, cloud services, and data integration tools increased overall deployment expenses for manufacturers
- Complexity in integrating analytics solutions with legacy equipment, disparate data sources, and existing enterprise systems increases implementation challenges
- Limited availability of skilled data scientists, AI engineers, and maintenance analytics experts slows effective adoption in emerging markets
- Data security concerns, interoperability issues, and resistance to digital transformation create additional barriers to market growth
- To address these challenges, companies are focusing on modular deployments, cloud-based platforms, training programs, and user-friendly analytics tools to expand global adoption of predictive asset management manufacturing analytics
How is the Predictive Asset Management Manufacturing Analytics Market Segmented?
The market is segmented on the basis of type, deployment model, and industry vertical.
- By Type
On the basis of type, the predictive asset management manufacturing analytics market is segmented into Software and Services. The Software segment dominated the market with an estimated 62.4% share in 2025, driven by strong adoption of AI-based analytics platforms, machine learning models, and asset performance management software across manufacturing facilities. These solutions enable real-time equipment monitoring, predictive maintenance scheduling, anomaly detection, and lifecycle optimization, helping manufacturers reduce downtime and maintenance costs. Integration with IoT sensors, digital twins, and enterprise systems further enhances software adoption across smart factories.
The Services segment is expected to grow at the fastest CAGR from 2026 to 2033, supported by rising demand for consulting, system integration, customization, and managed analytics services. Increasing complexity of data environments and the need for skilled analytics deployment are encouraging manufacturers to rely on service providers for implementation, optimization, and ongoing support.
- By Deployment Model
On the basis of deployment model, the market is segmented into On-Premises and On-Demand (Cloud-Based) solutions. The On-Premises segment accounted for a 54.1% market share in 2025, primarily due to data security concerns, regulatory compliance requirements, and the need for tight control over sensitive manufacturing and operational data. Large enterprises with legacy systems continue to prefer on-premises deployments for critical asset monitoring and mission-critical operations.
The On-Demand segment is projected to witness the fastest CAGR from 2026 to 2033, driven by scalability, lower upfront costs, faster deployment, and remote accessibility. Cloud-based predictive analytics platforms enable real-time insights, centralized monitoring across multiple plants, and seamless integration with IIoT ecosystems, making them increasingly attractive for SMEs and digitally transforming manufacturers.
- By Industry Vertical
On the basis of industry vertical, the predictive asset management manufacturing analytics market is segmented into Automotive and Aerospace Manufacturing, Electronics Equipment Manufacturing, Food and Beverages Manufacturing, Chemicals and Materials Manufacturing, Machinery and Industrial Equipment Manufacturing, Pharma and Life Sciences, Paper, Pulp, Plastic, and Rubber Manufacturing, and Others. The Automotive and Aerospace Manufacturing segment dominated the market with a 31.7% share in 2025, driven by high asset utilization rates, complex machinery, and strict quality and safety requirements. Predictive analytics play a critical role in minimizing production disruptions, improving equipment reliability, and optimizing maintenance schedules.
The Electronics Equipment Manufacturing segment is expected to grow at the fastest CAGR from 2026 to 2033, supported by rapid automation, high-speed production lines, and increasing reliance on precision equipment. Growing investments in smart manufacturing and Industry 4.0 initiatives continue to accelerate adoption across multiple industrial verticals.
Which Region Holds the Largest Share of the Predictive Asset Management Manufacturing Analytics Market?
- North America dominated the predictive asset management manufacturing analytics market with a 39.54% revenue share in 2025, driven by strong adoption of advanced manufacturing systems, predictive maintenance solutions, and AI-powered analytics platforms across the U.S. and Canada. Growing investments in smart factories, Industry 4.0 initiatives, and R&D activities in automotive, aerospace, and electronics sectors are fueling regional demand. High adoption of IoT sensors, digital twins, and connected asset management solutions further supports market expansion
- Leading companies in North America are introducing cloud-enabled analytics platforms, AI-driven predictive models, and integrated IoT solutions, strengthening the region’s technological leadership. Continuous investment in industrial automation, high-performance computing, and digital manufacturing infrastructure is expected to sustain long-term growth
- High concentration of engineering talent, innovation ecosystems, and government-backed manufacturing modernization programs reinforce North America’s dominance in the global market
U.S. Predictive Asset Management Manufacturing Analytics Market Insight
The U.S. is the largest contributor in North America, supported by widespread adoption of AI-powered predictive maintenance, real-time asset monitoring, and industrial analytics solutions. High demand in automotive, aerospace, electronics, and heavy industries for predictive monitoring of critical machinery, optimization of asset lifecycles, and reduction of unplanned downtime drives growth. Major manufacturing hubs, innovation labs, and strong startup ecosystems further accelerate deployment of advanced analytics tools.
Canada Predictive Asset Management Manufacturing Analytics Market Insight
Canada significantly contributes to regional growth, driven by expanding industrial automation initiatives, electronics manufacturing clusters, and smart factory implementations. Manufacturing units increasingly leverage predictive asset management solutions for IoT-enabled machine monitoring, performance analytics, and maintenance optimization. Government programs supporting digital manufacturing, robotics, and Industry 4.0 adoption enhance regional market penetration.
Asia-Pacific Predictive Asset Management Manufacturing Analytics Market
Asia-Pacific is projected to register the fastest CAGR of 11.9% from 2026 to 2033, fueled by rapid industrial expansion, smart manufacturing adoption, and investments in IoT, AI, and robotics across China, Japan, India, South Korea, and Southeast Asia. High-volume production in automotive, electronics, machinery, and FMCG sectors increases demand for predictive analytics solutions to minimize downtime and optimize operational efficiency.
China Predictive Asset Management Manufacturing Analytics Market Insight
China is the largest contributor in Asia-Pacific due to massive adoption of smart factories, extensive electronics and automotive manufacturing, and government-backed digital industrialization initiatives. Rising investment in AI-driven predictive models, industrial IoT sensors, and automated maintenance systems drives strong market growth. Local manufacturing capacity, cost advantages, and high-tech ecosystem support widespread adoption.
Japan Predictive Asset Management Manufacturing Analytics Market Insight
Japan exhibits steady growth, supported by precision manufacturing, advanced industrial automation, and strong focus on equipment reliability. Manufacturers increasingly deploy predictive analytics platforms for real-time asset monitoring, failure prevention, and operational efficiency improvements. Continuous modernization of factories and industrial control systems reinforces market expansion.
India Predictive Asset Management Manufacturing Analytics Market Insight
India is emerging as a key growth hub, driven by rising semiconductor and electronics manufacturing, government-backed industrial digitalization initiatives, and increasing startup activity. Growing demand for IoT-enabled predictive maintenance, AI-powered analytics, and factory automation accelerates adoption across automotive, telecom, and electronics sectors.
South Korea Predictive Asset Management Manufacturing Analytics Market Insight
South Korea contributes strongly due to high demand for advanced electronics, automotive manufacturing, and 5G-enabled industrial automation. Investments in AI-based predictive analytics, machine monitoring, and smart manufacturing systems are fueling adoption. Strong technological infrastructure and industrial innovation support sustained market growth.
Which are the Top Companies in Predictive Asset Management Manufacturing Analytics Market?
The predictive asset management manufacturing analytics industry is primarily led by well-established companies, including:
- IBM Corporation (U.S.)
- TABLEAU SOFTWARE, LLC (U.S.)
- Oracle (U.S.)
- SAP SE (Germany)
- Zensar Technologies Ltd. (India)
- SAS Institute Inc. (U.S.)
- DXC Technology Company (U.S.)
- TIBCO Software Inc. (U.S.)
- StatSoft Europe (Germany)
- ALTERYX, INC. (U.S.)
- 1010data (U.S.)
- Sisense Inc. (U.S.)
- Wipro Limited (India)
- General Electric (U.S.)
- BRIDGEi2i Analytics (U.S.)
- Cisco (U.S.)
- FICO (U.S.)
- Microsoft (U.S.)
- Civis Analytics (U.S.)
- RapidMiner, Inc (U.S.)
SKU-

- Interactive Data Analysis Dashboard
- Company Analysis Dashboard for high growth potential opportunities
- Research Analyst Access for customization & queries
- Competitor Analysis with Interactive dashboard
- Latest News, Updates & Trend analysis
- Harness the Power of Benchmark Analysis for Comprehensive Competitor Tracking
Data collection and base year analysis are done using data collection modules with large sample sizes. The stage includes obtaining market information or related data through various sources and strategies. It includes examining and planning all the data acquired from the past in advance. It likewise envelops the examination of information inconsistencies seen across different information sources. The market data is analysed and estimated using market statistical and coherent models. Also, market share analysis and key trend analysis are the major success factors in the market report. To know more, please request an analyst call or drop down your inquiry.
The key research methodology used by DBMR research team is data triangulation which involves data mining, analysis of the impact of data variables on the market and primary (industry expert) validation. Data models include Vendor Positioning Grid, Market Time Line Analysis, Market Overview and Guide, Company Positioning Grid, Patent Analysis, Pricing Analysis, Company Market Share Analysis, Standards of Measurement, Global versus Regional and Vendor Share Analysis. To know more about the research methodology, drop in an inquiry to speak to our industry experts.
Data Bridge Market Research is a leader in advanced formative research. We take pride in servicing our existing and new customers with data and analysis that match and suits their goal. The report can be customized to include price trend analysis of target brands understanding the market for additional countries (ask for the list of countries), clinical trial results data, literature review, refurbished market and product base analysis. Market analysis of target competitors can be analyzed from technology-based analysis to market portfolio strategies. We can add as many competitors that you require data about in the format and data style you are looking for. Our team of analysts can also provide you data in crude raw excel files pivot tables (Fact book) or can assist you in creating presentations from the data sets available in the report.


