
Global Omega 3 Market
Market Size in USD Billion
 USD
3.04 Billion
USD
6.24 Billion
2024
2032
USD
3.04 Billion
USD
6.24 Billion
2024
2032
| 2025 - 2032 | |
| USD 3.04 Billion | |
| USD 6.24 Billion | |
| % | |
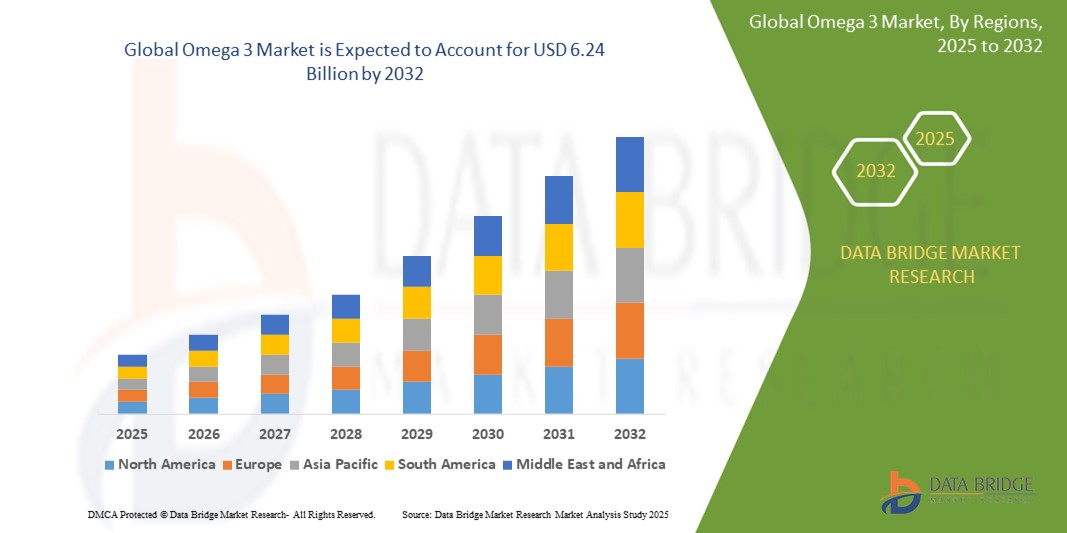
Omega 3 Market Size
- The global omega 3 market was valued at USD 3.04 billion in 2024 and is expected to reach USD 6.24 billion by 2032
- During the forecast period of 2025 to 2032 the market is such as to grow at a CAGR of 9.40%, primarily driven by the rising consumer demand for health and wellness products
- This growth is driven by factors such as increasing awareness of the health benefits of omega 3 fatty acids
Omega 3 Market Analysis
- The global omega-3 market is experiencing significant growth, with projections indicating substantial increases in market size over the coming years
- Technological advancements in extraction and production methods are enhancing the quality and sustainability of omega-3 products. For instance, innovations such as supercritical CO₂ extraction and molecular distillation are improving purity and potency, meeting the rising consumer demand for clean and effective supplements
- The market is diversifying beyond traditional fish oil sources, with plant-based alternatives such as algae oil gaining popularity. Algae-derived omega-3s appeal to vegan and environmentally conscious consumers, offering sustainable options without compromising on health benefits
- Omega-3 fatty acids are being incorporated into a wide range of products, including dairy items, bakery goods, and beverages, broadening their consumer base. This trend reflects the versatility of omega-3s in enhancing various food categories
- North America currently leads the omega-3 market, driven by high consumer awareness and widespread use of dietary supplements. The presence of major manufacturers and a strong emphasis on health and wellness contribute to the region's dominant position
Report Scope and Omega 3 Market Segmentation
|
Attributes |
Omega 3 Key Market Insights |
|
Segments Covered |
|
|
Countries Covered |
North America
Europe
Asia-Pacific
Middle East and Africa
South America
|
|
Key Market Players |
|
|
Market Opportunities |
|
|
Value Added Data Infosets |
In addition to the insights on market scenarios such as market value, growth rate, segmentation, geographical coverage, and major players, the market reports curated by the Data Bridge Market Research also include in-depth expert analysis, pricing analysis, brand share analysis, consumer survey, demography analysis, supply chain analysis, value chain analysis, raw material/consumables overview, vendor selection criteria, PESTLE Analysis, Porter Analysis, and regulatory framework. |
Omega 3 Market Trends
“Shift Toward Plant-Based Omega-3 Sources”
- The omega-3 market is shifting towards plant-based sources as consumer demand for vegan and sustainable alternatives grows
- Plant-based omega-3 supplements from algae, flaxseed, and chia seeds are becoming popular due to their alignment with ethical and environmental concerns
- Algae oil, a key plant-based source of omega-3 fatty acids, is emerging as a sustainable, vegan-friendly alternative to fish-derived omega-3 oils
- This shift reflects the broader trend of increasing plant-based diets and awareness of the environmental impact of marine-based omega-3 sourcing
- Innovations in product formulations and delivery methods are being developed to cater to health-conscious and environmentally aware consumers
- In conclusion, as the plant-based omega-3 segment expands, it creates new opportunities for brands to cater to evolving consumer demands and align with sustainability trends
Omega 3 Market Dynamics
Driver
“Health Awareness Boosting Omega-3 Demand”
- Rising global awareness about nutrition and wellness is boosting the demand for omega-3 fatty acids as consumers seek preventive healthcare solutions for long-term well-being
- Increasing cases of cardiovascular issues and lifestyle-related disorders such as obesity are pushing more people toward dietary supplements containing omega-3s for daily use
- Health professionals and institutions such as the American Heart Association recommend regular intake of omega-3s for heart and brain health, adding credibility and encouraging wider consumer adoption
- Companies such as Nestlé and Unilever are introducing omega-3 enriched products such as health drinks, dairy items, and fortified snacks to tap into the growing health-conscious market
- For instance, brands such as Nordic Naturals and Nature Made are offering high-purity omega-3 supplements in easy-to-consume forms such as gummies and soft gels, making them accessible to various age groups
- In conclusion, this growing alignment between health trends and product innovation positions omega-3s as a long-term essential in consumer health
Opportunity
“Rising Demand for Plant-Based Alternatives”
- There is a growing demand for plant-based omega-3 sources as more consumers adopt vegan and sustainable diets
- Plant-based omega-3 alternatives, such as algae, flaxseed, and chia seeds, are gaining traction due to their environmental benefits
- Algae oil, in particular, is becoming a prominent player as a sustainable and vegan-friendly alternative to fish-derived omega-3s
- This demand is fueled by consumers’ increasing awareness of the environmental impact of marine-sourced omega-3 fatty acids
- Companies are innovating with plant-based omega-3 supplements, fortified foods, and beverages to cater to health-conscious and eco-aware consumers
- In conclusion, the rise in plant-based diets and sustainable consumer values presents a significant growth opportunity for omega-3 brands
Restraint/Challenge
“Price-Sensitive Consumers in Various Income Groups”
- High-quality omega-3 supplements from sustainable sources such as algae tend to be expensive, making them less affordable for price-sensitive consumers in various income groups
- The advanced processes used for purity and safety, such as cold-press extraction and molecular distillation, increase manufacturing costs significantly
- For instance, algae-based omega-3 capsules by brands such as Ovega-3 are priced higher than traditional fish oil options due to eco-friendly sourcing and rigorous testing
- Regulatory compliance and third-party certifications add further to production costs, often resulting in a higher retail price that limits regular consumption
- The presence of cheaper, lower-quality alternatives in the market may lead some consumers to opt for less effective or unverified products, affecting the reputation of omega-3 supplements overall
- In conclusion, balancing premium quality with affordability is crucial to overcome this barrier and expand consumer reach
Omega 3 Market Scope
The market is segmented on the basis of type, source, and application.
|
Segmentation |
Sub-Segmentation |
|
By Type |
|
|
By Source |
|
|
By Application |
|
Omega 3 Market Regional Analysis
“North America is the Dominant Region in the Omega 3 Market”
- North America holds the largest share of the global omega-3 market, driven by high consumer awareness regarding the health benefits of omega-3 fatty acids
- The region's strong presence of key manufacturers, distributors, and suppliers ensures continuous growth and market dominance
- The rising demand for dietary supplements and functional foods, particularly omega-3 enriched products, is prominent across the U.S. and Canada
- The growing focus on preventive healthcare and chronic disease management has contributed significantly to the adoption of omega-3s in daily diets
- Consumers are increasingly willing to invest in premium-quality supplements, particularly those that provide heart, brain, and joint health benefits
- The prevalence of lifestyle-related diseases, such as cardiovascular conditions, has further encouraged omega-3 adoption in the region
- In conclusion, North America maintains its dominance in the omega-3 market due to high consumer demand and awareness of health benefits.
“Asia-Pacific is Projected to Register the Highest Growth Rate”
- Asia Pacific is experiencing the fastest market growth for omega-3 products, with a high compound annual growth rate expected over the coming years
- The rising middle class in countries such as China and India, along with improved disposable incomes, is driving the adoption of nutritional supplements, including omega-3s
- Increasing health awareness and the rising prevalence of chronic diseases such as diabetes, obesity, and cardiovascular diseases are pushing consumers towards omega-3 supplementation
- The market is benefiting from a growing shift towards healthier lifestyles and the adoption of Western diets, which have spurred interest in omega-3 enriched foods
- Algae-based omega-3 products are gaining popularity as a plant-based alternative to fish oil, appealing to environmentally conscious consumers
- Government initiatives and campaigns promoting nutrition and healthy living are contributing to the growth of the omega-3 market in the region
- In countries such as Japan, omega-3 supplements are being increasingly integrated into daily diets, both in supplement form and through fortified food products
- In conclusion, Asia Pacific is the fastest-growing region, driven by increasing health consciousness and rising disposable incomes
Omega 3 Market Share
The market competitive landscape provides details by competitor. Details included are company overview, company financials, revenue generated, market potential, investment in research and development, new market initiatives, global presence, production sites and facilities, production capacities, company strengths and weaknesses, product launch, product width and breadth, application dominance. The above data points provided are only related to the companies' focus related to market.
The Major Market Leaders Operating in the Market Are:
- DSM (Netherlands)
- BASF SE (Germany)
- Lonza Group (Switzerland)
- Glanbia Plc (Ireland)
- ADM (US)
- Farbest Brands (U.S)
- SternVitamin GmbH & Co. KG (Germany)
- Adisseo (France)
- BTSA Biotechnologias Aplicadas S.L. (Spain)
- Rabar Pty Ltd (Australia)
- Golden Omega (Chile)
- Kinomega Biopharm Inc. (China)
- Sinomega Biotech Engineering Co. Ltd. (China)
- Polaris (US), Pharma Marine AS (Norway)
- Huatai Biopharm (China)
- ALGISYS LLC (US)
- Biosearch Life (Spain)
Latest Developments in Global Omega 3 Market
- In February, 2025 GC Rieber VivoMega has introduced two new technologies, VivoTech and VivoSure, aimed at improving the quality, purity, and stability of omega-3 products. These innovations ensure a longer shelf life and enhanced sensory profiles by refining omega-3 concentrates with real-time evaluations
- In December 2024, Coromega launched Max Gold, the highest single-dose omega-3 fish oil supplement, designed for maximum wellness. This new product offers an easy and effective way to incorporate omega-3s into daily routines, just in time for consumers' 2025 New Year’s health resolutions. The Max Gold supplement aims to provide enhanced health benefits with a powerful, concentrated dose of omega-3s
- In December 2024, Nature's Bounty introduced a plant-based omega-3 supplement derived from algae, offering a vegetarian alternative to traditional fish oil. Each softgel provides 520 mg of omega-3 fatty acids, including 510 mg of EPA and DHA, to support heart, joint, and skin health. The supplement is available at major retailers such as Amazon, CVS, Walgreens, Publix, and Kroger
SKU-

- Interactive Data Analysis Dashboard
- Company Analysis Dashboard for high growth potential opportunities
- Research Analyst Access for customization & queries
- Competitor Analysis with Interactive dashboard
- Latest News, Updates & Trend analysis
- Harness the Power of Benchmark Analysis for Comprehensive Competitor Tracking
Table of Content
1 INTRODUCTION
1.1 OBJECTIVES OF THE STUDY
1.2 MARKET DEFINITION
1.3 OVERVIEW OF GLOBAL OMEGA 3 MARKET
1.4 CURRENCY AND PRICING
1.5 LIMITATION
1.6 MARKETS COVERED
2 MARKET SEGMENTATION
2.1 KEY TAKEAWAYS
2.2 ARRIVING AT THE GLOBAL OMEGA 3 MARKET SIZE
2.2.1 VENDOR POSITIONING GRID
2.2.2 TECHNOLOGY LIFE LINE CURVE
2.2.3 MARKET GUIDE
2.2.4 COMPANY POSITIONING GRID
2.2.5 COMAPANY MARKET SHARE ANALYSIS
2.2.6 MULTIVARIATE MODELLING
2.2.7 DEMAND AND SUPPLY-SIDE VARIABLES
2.2.8 CONSUMPTION TREND OF END PRODUCTS
2.2.9 TOP TO BOTTOM ANALYSIS
2.2.10 STANDARDS OF MEASUREMENT
2.2.11 VENDOR SHARE ANALYSIS
2.2.12 DATA POINTS FROM KEY PRIMARY INTERVIEWS
2.2.13 DATA POINTS FROM KEY SECONDARY DATABASES
2.3 GLOBAL OMEGA 3 MARKET: RESEARCH SNAPSHOT
2.4 ASSUMPTIONS
3 MARKET OVERVIEW
3.1 DRIVERS
3.2 RESTRAINTS
3.3 OPPORTUNITIES
3.4 CHALLENGES
4 EXECUTIVE SUMMARY
5 PREMIUM INSIGHTS
5.1 VALUE CHAIN ANALYSIS
5.2 SUPPLY CHAIN ANALYSIS
5.3 IMPORT-EXPORT ANALYSIS
5.4 PORTER’S FIVE FORCES ANALYSIS
5.4.1 BARGAINING POWER OF SUPPLIERS
5.4.2 BARGAINING POWER OF BUYERS/CONSUMERS
5.4.3 THREAT OF NEW ENTRANTS
5.4.4 THREAT OF SUBSTITUTE PRODUCTS
5.4.5 INTENSITY OF COMPETITIVE RIVALRY
5.5 RAW MATERIAL SOURCING ANALYSIS
5.6 OVERVIEW OF TECHNOLOGICAL INNOVATIONS
5.7 INDUSTRY TRENDS AND FUTURE PERSPECTIVE
5.8 GROWTH STRATEGIES ADOPTED BY KEY MARKET PLAYERS
5.9 FACTORS INFLUENCING PURCHASING DECISION OF END-USERS
6 IMPACT OF ECONOMIC SLOW DOWN ON MARKET
6.1 IMPACT ON PRICE
6.2 IMPACT ON SUPPLY CHAIN
6.3 IMPACT ON SHIPMENT
6.4 IMPACT ON COMPANY’S STRATEGIC DECISIONS
7 REGULATORY FRAMEWORK AND GUIDELINES
8 PRICING INDEX (PRICE AT B2B END & PRICES AT FOB)
9 PRODUCTION CAPACITY OUTLOOK
10 BRAND OUTLOOK
10.1 COMPARATIVE BRAND ANALYSIS
10.2 PRODUCT VS BRAND OVERVIEW
11 GLOBAL OMEGA 3 MARKET, BY TYPE, 2018-2032 (USD MILLION) (TONS)
11.1 OVERVIEW
11.2 EICOSAPENTAENOIC ACID (EPA)
11.2.1 MARINE-BASED EPA
11.2.1.1. FISH OIL
11.2.1.2. KRILL OIL
11.2.2 PLANT-BASED EPA
11.2.2.1. ALGAE-BASED
11.2.2.2. SEED OIL-DERIVED
11.2.3 SYNTHETIC/BIOTECHNOLOGICALLY PRODUCED EPA
11.3 DOCOSAHEXAENOIC ACID (DHA)
11.3.1 MARINE-BASED DHA
11.3.1.1. FISH OIL
11.3.1.2. COD LIVER OIL
11.3.2 ALGAE-BASED DHA
11.3.2.1. PURE DHA
11.3.2.2. BLENDS (DHA + EPA)
11.3.3 SYNTHETIC/FERMENTED DHA
11.4 ARACHIDONIC ACID (ARA)
11.4.1 MICROBIAL FERMENTATION-DERIVED ARA
11.4.1.1. NATURAL ARA
11.4.1.2. MEAT-BASED
11.4.1.3. EGG-BASED
11.4.2 SYNTHETIC ARA
11.5 COMBINED EPA/DHA BLENDS
11.5.1 STANDARDIZED EPA/DHA BLENDS
11.5.2 CUSTOM BLENDS FOR SPECIFIC APPLICATIONS
11.6 ALPHA-LINOLENIC ACID (ALA)
11.7 STEARIDONIC ACID (SDA)
12 GLOBAL OMEGA 3 MARKET, BY SOURCE, 2018-2032 (USD MILLION)
12.1 OVERVIEW
12.2 PLANTS
12.2.1 ALGAE OIL
12.2.2 SEED-BASED OMEGA-3
12.2.2.1. FLAXSEED
12.2.2.2. CHIA SEED
12.2.2.3. CAMELINA SEED
12.2.3 NUT-BASED OMEGA-3
12.2.3.1. WALNUTS
12.2.3.2. PECANS
12.2.3.3. OTHERS
12.2.4 LEAFY GREENS
12.2.5 OTHERS
12.3 SEAFOODS
12.3.1 FISH OIL
12.3.1.1. ANCHOVY OIL
12.3.1.2. SALMON OIL
12.3.1.3. COD LIVER OIL
12.3.2 KRILL OIL
12.3.2.1. ANTARCTIC KRILL
12.3.2.2. SUPERCRITICAL EXTRACTION KRILL OIL
12.3.3 MARINE MICRO-ORGANISMS
12.3.3.1. SCHIZOCHYTRIUM
12.3.3.2. CRYPTHECODINIUM
12.3.3.3. OTHERS
12.3.4 OTHERS
12.4 BIOTECHNOLOGICALLY SYNTHESIZED OMEGA-3
12.4.1 FERMENTATION-BASED OMEGA-3
12.4.2 GENETICALLY ENGINEERED PLANTS OR ALGAE
12.5 ANIMAL-BASED OMEGA-3
12.5.1 DAIRY
12.5.2 EGGS
12.5.3 OTHERS
12.6 OTHERS
13 GLOBAL OMEGA 3 MARKET, BY FORM, 2018-2032 (USD MILLION)
13.1 OVERVIEW
13.2 OIL
13.3 POWDER
13.3.1 MICROCAPSULE POWDER
13.3.2 BIOMASS POWDER
13.4 OTHERS
14 GLOBAL OMEGA 3 MARKET, BY PRODUCTION METHOD, 2018-2032 (USD MILLION)
14.1 OVERVIEW
14.2 CULTIVATION OF MARINE MICROALGAE OR BACTERIA
14.3 PLANT MOLECULAR FARMING
14.4 PRECISION FERMENTATION
14.5 OTHERS
15 GLOBAL OMEGA 3 MARKET, BY APPLICATION, 2018-2032 (USD MILLION)
15.1 OVERVIEW
15.2 DIETARY SUPPLEMENTS
15.2.1 DIETARY SUPPLEMENTS, BY TYPE
15.2.1.1. EICOSAPENTAENOIC ACID (EPA)
15.2.1.2. DOCOSAHEXAENOIC ACID (DHA)
15.2.1.3. ARACHIDONIC ACID (ARA)
15.2.1.4. COMBINED EPA/DHA BLENDS
15.2.1.5. ALPHA-LINOLENIC ACID (ALA)
15.2.1.6. STEARIDONIC ACID (SDA)
15.2.2 DIETARY SUPPLEMENTS, BY CATEGORY
15.2.2.1. CHEWABLES & GUMMIES
15.2.2.2. CAPSULES
15.2.2.3. POWDERS
15.2.2.4. TABLETS & SOFTGELS
15.2.2.5. OTHERS
15.2.3 DIETARY SUPPLEMENTS, BY TARGET CONSUMER
15.2.3.1. SPORTS FITNESS
15.2.3.2. ENERGY & WEIGHT MANAGEMENT
15.2.3.3. GENERAL HEALTH
15.2.3.4. BONE & JOINT HEALTH
15.2.3.5. GASTROINTESTINAL HEALTH
15.2.3.6. IMMUNITY
15.2.3.7. CARDIAC HEALTH
15.2.3.8. DIABETES
15.2.3.9. ANTI-CANCER
15.2.3.10. SKIN/HAIR/NAILS
15.2.3.11. BRAIN/MENTAL HEALTH
15.2.3.12. OTHERS
15.3 FUNCTIONAL FOODS AND BEVERAGES
15.3.1 FUNCTIONAL FOODS AND BEVERAGES, BY TYPE
15.3.1.1. EICOSAPENTAENOIC ACID (EPA)
15.3.1.2. DOCOSAHEXAENOIC ACID (DHA)
15.3.1.3. ARACHIDONIC ACID (ARA)
15.3.1.4. COMBINED EPA/DHA BLENDS
15.3.1.5. ALPHA-LINOLENIC ACID (ALA)
15.3.1.6. STEARIDONIC ACID (SDA)
15.3.2 FUNCTIONAL FOODS AND BEVERAGES, BY PRODUCT TYPE
15.3.2.1. OMEGA-3 ENRICHED DAIRY
15.3.2.1.1. MILK AND YOGURT
15.3.2.1.2. BUTTER AND CHEESE SPREADS
15.3.2.1.3. OTHERS
15.3.2.2. FORTIFIED BEVERAGES
15.3.2.2.1. JUICES
15.3.2.2.2. SMOOTHIES AND SHAKES
15.3.2.2.3. OTHERS
15.3.2.3. OMEGA-3 INFUSED SNACKS
15.3.2.3.1. PROTEIN BARS
15.3.2.3.2. CHIPS
15.3.2.3.3. OTHERS
15.3.2.4. OMEGA-3 FORTIFIED CEREALS AND GRAINS
15.4 SKINCARE AND PERSONAL CARE
15.4.1 SKINCARE AND PERSONAL CARE, BY TYPE
15.4.1.1. EICOSAPENTAENOIC ACID (EPA)
15.4.1.2. DOCOSAHEXAENOIC ACID (DHA)
15.4.1.3. ARACHIDONIC ACID (ARA)
15.4.1.4. COMBINED EPA/DHA BLENDS
15.4.1.5. ALPHA-LINOLENIC ACID (ALA)
15.4.1.6. STEARIDONIC ACID (SDA)
15.4.2 SKINCARE AND PERSONAL CARE, BY PRODUCT TYPE
15.4.2.1. SKIN CARE
15.4.2.1.1. SUN SCREEN LOTION
15.4.2.1.2. SERUM
15.4.2.1.3. MOISTURIZER
15.4.2.1.4. SCRUB
15.4.2.1.5. LIP CARE CREAM
15.4.2.1.6. OTHERS
15.4.2.2. HAIR CARE
15.4.2.2.1. SHAMPOO
15.4.2.2.2. CONDITIONER
15.4.2.2.3. HAIR OIL AND SERUM
15.4.2.2.4. OTHERS
15.4.2.3. OTHERS
15.5 PHARMACEUTICALS
15.5.1 PHARMACEUTICALS, BY TYPE
15.5.1.1. EICOSAPENTAENOIC ACID (EPA)
15.5.1.2. DOCOSAHEXAENOIC ACID (DHA)
15.5.1.3. ARACHIDONIC ACID (ARA)
15.5.1.4. COMBINED EPA/DHA BLENDS
15.5.1.5. ALPHA-LINOLENIC ACID (ALA)
15.5.1.6. STEARIDONIC ACID (SDA)
15.5.2 PHARMACEUTICALS, BY PRODUCT TYPE
15.5.2.1. PRESCRIPTION OMEGA-3 DRUGS
15.5.2.2. CARDIOVASCULAR HEALTH SUPPLEMENTS
15.5.2.3. NEUROLOGICAL AND COGNITIVE HEALTH TREATMENTS
15.5.2.4. ANTI-INFLAMMATORY FORMULATIONS
15.5.2.5. OTHERS
15.6 INFANT FORMULAS
15.6.1 INFABT FORMULAS, BY TYPE
15.6.1.1. EICOSAPENTAENOIC ACID (EPA)
15.6.1.2. DOCOSAHEXAENOIC ACID (DHA)
15.6.1.3. ARACHIDONIC ACID (ARA)
15.6.1.4. COMBINED EPA/DHA BLENDS
15.6.1.5. ALPHA-LINOLENIC ACID (ALA)
15.6.1.6. STEARIDONIC ACID (SDA)
15.6.2 INFANT FORMULAS, BY STAGE
15.6.2.1. SATGE 1
15.6.2.2. STAGE 2
15.6.2.3. STAGE 3
15.6.2.4. STAGE 4
15.6.3 INFANT FORMAULAS, BY FORMULA TYPE
15.6.3.1. STANDARD DHA/ARA FORTIFIED FORMULAS
15.6.3.2. HYPOALLERGENIC OR SPECIALIZED MEDICAL FORMULAS
15.6.4 OTHERS
15.7 ANIMAL NUTRITION
15.7.1 ANIMAL NUTRITION, BY TYPE
15.7.1.1. EICOSAPENTAENOIC ACID (EPA)
15.7.1.2. DOCOSAHEXAENOIC ACID (DHA)
15.7.1.3. ARACHIDONIC ACID (ARA)
15.7.1.4. COMBINED EPA/DHA BLENDS
15.7.1.5. ALPHA-LINOLENIC ACID (ALA)
15.7.1.6. STEARIDONIC ACID (SDA)
15.7.2 ANIMAL NUTRITION, BY END-USE
15.7.2.1. RUMINANTS
15.7.2.1.1. CALVES
15.7.2.1.2. DAIRY CATTLE
15.7.2.1.3. BEEF CATTLE
15.7.2.2. POULTRY
15.7.2.2.1. BROILER
15.7.2.2.2. LAYERS
15.7.2.2.3. BREEDER
15.7.2.3. SWINE
15.7.2.3.1. STARTERS
15.7.2.3.2. GROWERS
15.7.2.3.3. OTHERS
15.7.2.4. PET
15.7.2.4.1. CAT
15.7.2.4.2. DOG
15.7.2.4.3. RABBIT
15.7.2.4.4. MICE
15.7.2.4.5. OTHERS
15.7.2.5. AQUATIC ANIMAL
15.7.2.5.1. FISH FEED
15.7.2.5.2. MOLLUSK FEED
15.7.2.5.3. CRUSTACEANS
15.7.2.5.4. OTHERS
15.8 MEDICAL FOODS
15.8.1 MEDCIAL FOODS, BY TYPE
15.8.1.1. EICOSAPENTAENOIC ACID (EPA)
15.8.1.2. DOCOSAHEXAENOIC ACID (DHA)
15.8.1.3. ARACHIDONIC ACID (ARA)
15.8.1.4. COMBINED EPA/DHA BLENDS
15.8.1.5. ALPHA-LINOLENIC ACID (ALA)
15.8.1.6. STEARIDONIC ACID (SDA)
15.8.2 MEDICAL FOODS, BY END-USE
15.8.2.1. THERAPEUTIC NUTRITION FOR CHRONIC DISEASES
15.8.2.2. OMEGA-3 FOR MALNOURISHMENT RECOVERY
15.8.3 OTHERS
15.9 OTHERS
16 GLOBAL OMEGA 3 MARKET, COMPANY LANDSCAPE
16.1 COMPANY SHARE ANALYSIS: GLOBAL
16.2 COMPANY SHARE ANALYSIS: NORTH AMERICA
16.3 COMPANY SHARE ANALYSIS: EUROPE
16.4 COMPANY SHARE ANALYSIS: ASIAP-PACIFIC
16.5 MERGERS & ACQUISITIONS
16.6 NEW PRODUCT DEVELOPMENT & APPROVALS
16.7 EXPANSIONS & PARTNERSHIP
16.8 REGULATORY CHANGES
17 GLOBAL OMEGA 3 MARKET, BY GEOGRAPHY, 2018-2032 (USD MILLION) (TONS)
17.1 OVERVIEW (ALL SEGMENTATION PROVIDED ABOVE IS REPRESNTED IN THIS CHAPTER BY COUNTRY)
17.2 NORTH AMERICA
17.2.1 U.S.
17.2.2 CANADA
17.2.3 MEXICO
17.3 EUROPE
17.3.1 GERMANY
17.3.2 U.K.
17.3.3 ITALY
17.3.4 FRANCE
17.3.5 SPAIN
17.3.6 RUSSIA
17.3.7 SWITZERLAND
17.3.8 TURKEY
17.3.9 BELGIUM
17.3.10 POLAND
17.3.11 DENMARK
17.3.12 NORWAY
17.3.13 SWEDEN
17.3.14 NETHERLANDS
17.3.15 REST OF EUROPE
17.4 ASIA-PACIFIC
17.4.1 JAPAN
17.4.2 CHINA
17.4.3 SOUTH KOREA
17.4.4 INDIA
17.4.5 SINGAPORE
17.4.6 THAILAND
17.4.7 INDONESIA
17.4.8 MALAYSIA
17.4.9 PHILIPPINES
17.4.10 AUSTRALIA
17.4.11 NEW ZEALAND
17.4.12 REST OF ASIA-PACIFIC
17.5 SOUTH AMERICA
17.5.1 BRAZIL
17.5.2 ARGENTINA
17.5.3 REST OF SOUTH AMERICA
17.6 MIDDLE EAST AND AFRICA
17.6.1 SOUTH AFRICA
17.6.2 EGYPT
17.6.3 SAUDI ARABIA
17.6.4 UNITED ARAB EMIRATES
17.6.5 ISRAEL
17.6.6 REST OF MIDDLE EAST AND AFRICA
18 GLOBAL OMEGA 3 MARKET, SWOT & DBMR ANALYSIS
19 GLOBAL OMEGA 3 MARKET, COMPANY PROFILE
19.1 BASF
19.1.1 COMPANY OVERVIEW
19.1.2 REVENUE ANALYSIS
19.1.3 PRODUCT PORTFOLIO
19.1.4 RECENT DEVELOPMENTS
19.2 DSM-FIRMENICH
19.2.1 COMPANY OVERVIEW
19.2.2 REVENUE ANALYSIS
19.2.3 PRODUCT PORTFOLIO
19.2.4 RECENT DEVELOPMENTS
19.3 CRODA INTERNATIONAL PLC
19.3.1 COMPANY OVERVIEW
19.3.2 REVENUE ANALYSIS
19.3.3 PRODUCT PORTFOLIO
19.3.4 RECENT DEVELOPMENTS
19.4 CORBION
19.4.1 COMPANY OVERVIEW
19.4.2 REVENUE ANALYSIS
19.4.3 PRODUCT PORTFOLIO
19.4.4 RECENT DEVELOPMENTS
19.5 ARISTA INDUSTRIES, INC.
19.5.1 COMPANY OVERVIEW
19.5.2 REVENUE ANALYSIS
19.5.3 PRODUCT PORTFOLIO
19.5.4 RECENT DEVELOPMENTS
19.6 NU-MEGA INGREDIENTS
19.6.1 COMPANY OVERVIEW
19.6.2 REVENUE ANALYSIS
19.6.3 PRODUCT PORTFOLIO
19.6.4 RECENT DEVELOPMENTS
19.7 OMEGA PROTEIN CORPORATION
19.7.1 COMPANY OVERVIEW
19.7.2 REVENUE ANALYSIS
19.7.3 PRODUCT PORTFOLIO
19.7.4 RECENT DEVELOPMENTS
19.8 COPEINCA SAC
19.8.1 COMPANY OVERVIEW
19.8.2 REVENUE ANALYSIS
19.8.3 PRODUCT PORTFOLIO
19.8.4 RECENT DEVELOPMENTS
19.9 EPAX
19.9.1 COMPANY OVERVIEW
19.9.2 REVENUE ANALYSIS
19.9.3 PRODUCT PORTFOLIO
19.9.4 RECENT DEVELOPMENTS
19.1 SOLUTEX
19.10.1 COMPANY OVERVIEW
19.10.2 REVENUE ANALYSIS
19.10.3 PRODUCT PORTFOLIO
19.10.4 RECENT DEVELOPMENTS
19.11 OLVEA OMEGA SOLUTIONS
19.11.1 COMPANY OVERVIEW
19.11.2 REVENUE ANALYSIS
19.11.3 PRODUCT PORTFOLIO
19.11.4 RECENT DEVELOPMENTS
19.12 GOLDEN OMEGA
19.12.1 COMPANY OVERVIEW
19.12.2 REVENUE ANALYSIS
19.12.3 PRODUCT PORTFOLIO
19.12.4 RECENT DEVELOPMENTS
19.13 KINOMEGA BIOPHARM INC
19.13.1 COMPANY OVERVIEW
19.13.2 REVENUE ANALYSIS
19.13.3 PRODUCT PORTFOLIO
19.13.4 RECENT DEVELOPMENTS
19.14 GC RIEBER VIVOMEGA AS
19.14.1 COMPANY OVERVIEW
19.14.2 REVENUE ANALYSIS
19.14.3 PRODUCT PORTFOLIO
19.14.4 RECENT DEVELOPMENTS
19.15 EVONIK INDUSTRIES AG
19.15.1 COMPANY OVERVIEW
19.15.2 REVENUE ANALYSIS
19.15.3 PRODUCT PORTFOLIO
19.15.4 RECENT DEVELOPMENTS
19.16 IMPERIAL-OEL-IMPORT HANDELSGESELLSCHAFT MBH
19.16.1 COMPANY OVERVIEW
19.16.2 REVENUE ANALYSIS
19.16.3 PRODUCT PORTFOLIO
19.16.4 RECENT DEVELOPMENTS
19.17 ALPSPURE LIFESCIENCES PVT. LTD.
19.17.1 COMPANY OVERVIEW
19.17.2 REVENUE ANALYSIS
19.17.3 PRODUCT PORTFOLIO
19.17.4 RECENT DEVELOPMENTS
19.18 PHYTOLOGIX LIFE SCIENCES
19.18.1 COMPANY OVERVIEW
19.18.2 REVENUE ANALYSIS
19.18.3 PRODUCT PORTFOLIO
19.18.4 RECENT DEVELOPMENTS
19.19 ELEMENTA
19.19.1 COMPANY OVERVIEW
19.19.2 REVENUE ANALYSIS
19.19.3 PRODUCT PORTFOLIO
19.19.4 RECENT DEVELOPMENTS
19.2 KD PHARMA GROUP SA
19.20.1 COMPANY OVERVIEW
19.20.2 REVENUE ANALYSIS
19.20.3 PRODUCT PORTFOLIO
19.20.4 RECENT DEVELOPMENTS
NOTE: THE COMPANIES PROFILED IS NOT EXHAUSTIVE LIST AND IS AS PER OUR PREVIOUS CLIENT REQUIREMENT. WE PROFILE MORE THAN 100 COMPANIES IN OUR STUDY AND HENCE THE LIST OF COMPANIES CAN BE MODIFIED OR REPLACED ON REQUEST
20 RELATED REPORTS
21 QUESTIONNAIRE
22 ABOUT DATA BRIDGE MARKET RESEARCH
Global Omega 3 Market, Supply Chain Analysis and Ecosystem Framework
To support market growth and help clients navigate the impact of geopolitical shifts, DBMR has integrated in-depth supply chain analysis into its Global Omega 3 Market research reports. This addition empowers clients to respond effectively to global changes affecting their industries. The supply chain analysis section includes detailed insights such as Global Omega 3 Market consumption and production by country, price trend analysis, the impact of tariffs and geopolitical developments, and import and export trends by country and HSN code. It also highlights major suppliers with data on production capacity and company profiles, as well as key importers and exporters. In addition to research, DBMR offers specialized supply chain consulting services backed by over a decade of experience, providing solutions like supplier discovery, supplier risk assessment, price trend analysis, impact evaluation of inflation and trade route changes, and comprehensive market trend analysis.
Data collection and base year analysis are done using data collection modules with large sample sizes. The stage includes obtaining market information or related data through various sources and strategies. It includes examining and planning all the data acquired from the past in advance. It likewise envelops the examination of information inconsistencies seen across different information sources. The market data is analysed and estimated using market statistical and coherent models. Also, market share analysis and key trend analysis are the major success factors in the market report. To know more, please request an analyst call or drop down your inquiry.
The key research methodology used by DBMR research team is data triangulation which involves data mining, analysis of the impact of data variables on the market and primary (industry expert) validation. Data models include Vendor Positioning Grid, Market Time Line Analysis, Market Overview and Guide, Company Positioning Grid, Patent Analysis, Pricing Analysis, Company Market Share Analysis, Standards of Measurement, Global versus Regional and Vendor Share Analysis. To know more about the research methodology, drop in an inquiry to speak to our industry experts.
Data Bridge Market Research is a leader in advanced formative research. We take pride in servicing our existing and new customers with data and analysis that match and suits their goal. The report can be customized to include price trend analysis of target brands understanding the market for additional countries (ask for the list of countries), clinical trial results data, literature review, refurbished market and product base analysis. Market analysis of target competitors can be analyzed from technology-based analysis to market portfolio strategies. We can add as many competitors that you require data about in the format and data style you are looking for. Our team of analysts can also provide you data in crude raw excel files pivot tables (Fact book) or can assist you in creating presentations from the data sets available in the report.


