
Global Neurological Biomarkers Market
Market Size in USD Billion
CAGR :
% 
 USD
6.92 Billion
USD
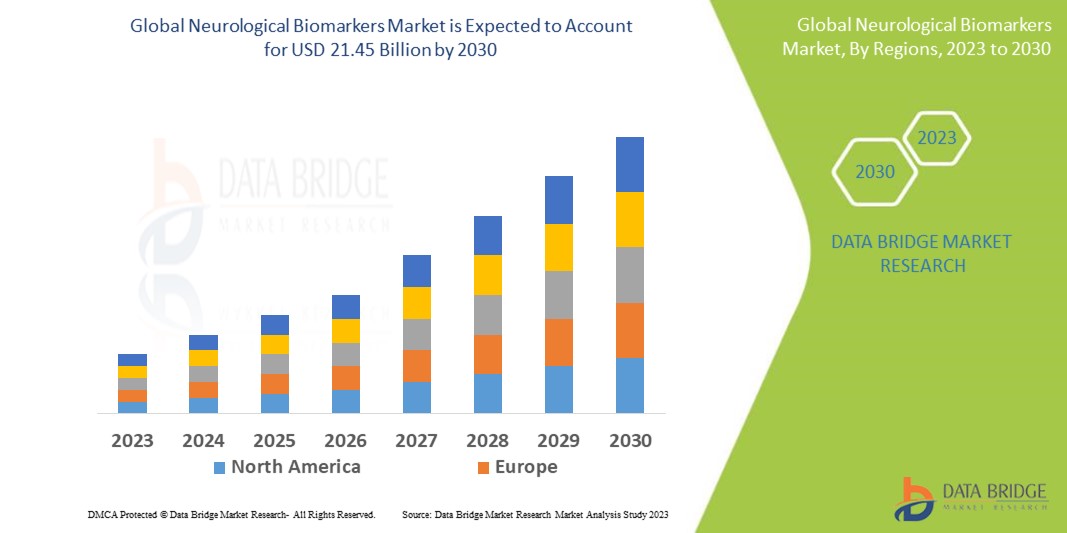
21.45 Billion
2022
2030
USD
6.92 Billion
USD
21.45 Billion
2022
2030
| 2023 –2030 | |
| USD 6.92 Billion | |
| USD 21.45 Billion | |
| % | |
|
Neurological Biomarkers Market Analysis and Size
As per the WHO, in 2016, epilepsy accounted for about 13 million disability-adjusted life years and more than 0.5% of the global disease burden. This increasing occurrence of neurological disorders can surge the demand for neurological biomarkers as it will help detect the disease. Furthermore, advanced imaging systems are helping in the early diagnosis of various diseases while decreasing the mortality rate.
Data Bridge Market Research analyses that the neurological biomarkers market, which was USD 6.92 billion in 2022, would rise to USD 21.45 billion by 2030 and is expected to undergo a CAGR of 13.4% during the forecast period from 2023 to 2030. In addition to the insights on market scenarios such as market value, growth rate, segmentation, geographical coverage, and major players, the market reports curated by the Data Bridge Market Research also include depth expert analysis, patient epidemiology, pipeline analysis, pricing analysis, and regulatory framework.
Neurological Biomarkers Market Scope and Segmentation
|
Report Metric |
Details |
|
Forecast Period |
2023 to 2030 |
|
Base Year |
2022 |
|
Historic Years |
2021 (Customizable to 2015 - 2020) |
|
Quantitative Units |
Revenue in USD Billion, Volumes in Units, Pricing in USD |
|
Segments Covered |
Product Type (Genomics Biomarker, Proteomics Biomarker, Imaging Biomarker, Metabolomics Biomarker, Others), Indication (Spinal Muscular Atrophy, Parkinson's Disease, Schizophrenia, Huntington's Disease, Alzheimer's Disease, Depression, Multiple Sclerosis), Imaging Techniques (Transcranial Magnetic Stimulation, Diffusion Tensor Imaging, Conventional Structural MRI, Functional Magnetic Resonance Imaging, Positron Emission Tomography), Services (Sample Preparation, Assay Development, Biomarker Validation and Testing), End- User (Clinical Diagnostics, Pharmaceutical and Biotechnology Companies, Research Organizations) |
|
Countries Covered |
U.S., Canada, and Mexico in North America, Germany, France, U.K., Netherlands, Switzerland, Belgium, Russia, Italy, Spain, Turkey, Rest of Europe in Europe, China, Japan, India, South Korea, Singapore, Malaysia, Australia, Thailand, Indonesia, Philippines, Rest of Asia-Pacific (APAC) in the Asia-Pacific (APAC), Saudi Arabia, U.A.E, South Africa, Egypt, Israel, Rest of Middle East and Africa (MEA) as a part of Middle East and Africa (MEA), Brazil, Argentina and Rest of South America as part of South America |
|
Market Players Covered |
Thermo Fisher Scientific (U.S.), QIAGEN (Netherlands), Agilent Technologies, Inc. (U.S.), McKesson Corporation (U.S), R1 RCM Inc., (U.S), F. Hoffmann-La Roche Ltd. (Switzerland), Bio-Rad Laboratories, Inc. (U.S.), BGI (China), Quanterix (U.S.), bioMérieux Inc (U.S.), Neurosteer Inc. (U.S.), Advanced Brain Monitoring, Inc (U.S.) |
|
Market Opportunities |
|
Market Definition
Neurological biomarkers are the biomarkers regarded as criteria for evaluating and calculating a method or symptom for acquiring a pharmacological response to a particular treatment. They are widely used for identifying numerous diseases, such as Parkinson's disease, autism, and depression. The common types of neurological biomarkers are imaging, genomics, proteomics, and metabolomics.
Global Neurological Biomarkers Market Dynamics
Drivers
- Increasing Technological Advancements by Market Players
Recent advancements in biomarkers, such as biomarker signatures, make neurological diseases more treatable. This has resulted in faster drug development, noninvasive testing, and early diagnosis. Additionally, digital biomarkers offer numerous pharmaceutical companies with supplemental information to conclude clinical trial decisions. The National Institute of Neurological Disorders and Stroke provides funding, such as development grants and cooperative agreements, for researchers performing studies associated with biomarker discovery, analytical validation, and clinical validation. Thus, this factor boosts market growth.
- Increasing Development of Precision Medicine
Biomarker research in neurodegenerative disease is a huge advancing area in personalized medicine. Many molecules have been assessed and associated with varied neurodegenerative disorders. This evolution within precision medicine has impacted the biopharmaceutical industry. Different players, from biopharma to diagnostics companies with several functions, such as research and development to commercial operations, will observe a huge change. This is anticipated to impact the market growth positively.
Opportunities
- Increasing Funds by Market Players
The wide presence of organizations providing funds at numerous stages of research is expected to drive market growth. For instance, the University of North Texas Health Science Center (HSC) was awarded about USD 45.5 million in funds from the National Institutes of Health (NIH) to support research associated with health disparities in Alzheimer's and brain aging. NIH is providing additional funds for biomarkers research for the current Health and Aging Brain Among Latino Elders (HABLE) study. Therefore, this factor boosts the market growth.
Restraints/Challenges
- High Startup Costs and Protracted Biomarker Development Cycles
The biomarkers vary in how well they perform in illness detection. Thus assessing biomarkers is a time-consuming process. Consequently, the validation process grows costly and time-consuming. The process and timetable for developing and validating biomarkers are thus comparable across various biomarker categories, with a few exceptions, as varied categories of biomarkers frequently share common development and validation process phases. Thus, this factor impedes market growth.
This neurological biomarkers market report provides details of new recent developments, trade regulations, import-export analysis, production analysis, value chain optimization, market share, impact of domestic and localized market players, analyses opportunities in terms of emerging revenue pockets, changes in market regulations, strategic market growth analysis, market size, category market growths, application niches and dominance, product approvals, product launches, geographic expansions, technological innovations in the market. To gain more info on the neurological biomarkers market contact Data Bridge Market Research for an Analyst Brief, our team will help you take an informed market decision to achieve market growth.
Recent Development
- In 2020, Johnson & Johnson Services, Inc. entered into a strategic agreement with Enigma Biomedical Group to assess novel neuroimaging biomarkers-JNJ-64413739 and JNJ-64511070-to understand Alzheimer's disease and other dementias.
Global Neurological Biomarkers Market Scope
The neurological biomarkers market is segmented on the basis of product type, indication, imaging techniques, services, and end user. The growth amongst these segments will help you analyze meagre growth segments in the industries and provide the users with a valuable market overview and market insights to help them make strategic decisions for identifying core market applications.
Product Type
- Genomics Biomarker
- Proteomics Biomarker
- Imaging Biomarker
- Metabolomics Biomarker
- Others
Indication
- Spinal Muscular Atrophy
- Parkinson's Disease
- Schizophrenia
- Huntington's Disease
- Alzheimer's Disease
- Depression
- Multiple Sclerosis
Imaging Techniques
- Transcranial Magnetic Stimulation
- Diffusion Tensor Imaging
- Conventional Structural MRI
- Functional Magnetic Resonance Imaging
- Positron Emission Tomography
Services
- Sample Preparation
- Assay Development
- Biomarker Validation and Testing
End User
- Clinical Diagnostics
- Pharmaceutical And Biotechnology Companies
- Research Organizations
Neurological Biomarkers Market Regional Analysis/Insights
The neurological biomarkers market is analyzed and market size insights and trends are provided by product type, indication, imaging techniques, services and end user as referenced above.
The countries covered in the neurological biomarkers market report are U.S., Canada, and Mexico in North America, Germany, France, U.K., Netherlands, Switzerland, Belgium, Russia, Italy, Spain, Turkey, Rest of Europe in Europe, China, Japan, India, South Korea, Singapore, Malaysia, Australia, Thailand, Indonesia, Philippines, Rest of Asia-Pacific (APAC) in the Asia-Pacific (APAC), Saudi Arabia, U.A.E, South Africa, Egypt, Israel, Rest of Middle East and Africa (MEA) as a part of Middle East and Africa (MEA), Brazil, Argentina and Rest of South America as part of South America.
North America dominates the neurological biomarkers market because of the increase in healthcare expenditure and huge commercial performances of neurological diagnostics in the U.S. Furthermore, the growing product launches combined with the increase in demand for biomarkers are anticipated to impact the regional market positively.
Asia-Pacific is expected to witness significant growth because of the region's improvement in healthcare infrastructure and increase in disposable income. Also, an increasing number of clinical trials being performed in emerging countries, such as India and China, leads to market growth.
The country section of the report also provides individual market impacting factors and changes in regulation in the market domestically that impacts the current and future trends of the market. Data points like down-stream and upstream value chain analysis, technical trends and porter's five forces analysis, case studies are some of the pointers used to forecast the market scenario for individual countries. Also, the presence and availability of global brands and their challenges faced due to large or scarce competition from local and domestic brands, impact of domestic tariffs and trade routes are considered while providing forecast analysis of the country data.
Healthcare Infrastructure growth Installed base and New Technology Penetration
The neurological biomarkers market also provides you with detailed market analysis for every country growth in healthcare expenditure for capital equipment, installed base of different kind of products for neurological biomarkers market, impact of technology using life line curves and changes in healthcare regulatory scenarios and their impact on the neurological biomarkers market. The data is available for historic period 2011-2021.
Competitive Landscape and Neurological Biomarkers Market Share Analysis
The neurological biomarkers market competitive landscape provides details by competitor. Details included are company overview, company financials, revenue generated, market potential, investment in research and development, new market initiatives, global presence, production sites and facilities, production capacities, company strengths and weaknesses, product launch, product width and breadth, application dominance. The above data points provided are only related to the companies' focus related to the neurological biomarkers market.
Some of the major players operating in the neurological biomarkers market are:
- Thermo Fisher Scientific (U.S.)
- QIAGEN (Netherlands)
- Agilent Technologies, Inc. (U.S.)
- McKesson Corporation (U.S)
- R1 RCM Inc., (U.S)
- F. Hoffmann-La Roche Ltd. (Switzerland)
- Bio-Rad Laboratories, Inc. (U.S.)
- BGI (China), Quanterix (U.S.)
- bioMérieux Inc (U.S.)
- Neurosteer Inc. (U.S.)
- Advanced Brain Monitoring, Inc (U.S.)
SKU-
Get online access to the report on the World's First Market Intelligence Cloud

- Interactive Data Analysis Dashboard
- Company Analysis Dashboard for high growth potential opportunities
- Research Analyst Access for customization & queries
- Competitor Analysis with Interactive dashboard
- Latest News, Updates & Trend analysis
- Harness the Power of Benchmark Analysis for Comprehensive Competitor Tracking
Table of Content
1 INTRODUCTION
1.1 OBJECTIVES OF THE STUDY
1.2 MARKET DEFINITION
1.3 OVERVIEW OF GLOBAL NEUROLOGICAL BIOMARKERS MARKET
1.4 CURRENCY AND PRICING
1.5 LIMITATION
1.6 MARKETS COVERED
2 MARKET SEGMENTATION
2.1 KEY TAKEAWAYS
2.2 ARRIVING AT THE GLOBAL NEUROLOGICAL BIOMARKERS MARKET SIZE
2.2.1 VENDOR POSITIONING GRID
2.2.2 TECHNOLOGY LIFE LINE CURVE
2.2.3 TRIPOD DATA VALIDATION MODEL
2.2.4 MARKET GUIDE
2.2.5 MULTIVARIATE MODELLING
2.2.6 TOP TO BOTTOM ANALYSIS
2.2.7 CHALLENGE MATRIX
2.2.8 APPLICATION COVERAGE GRID
2.2.9 STANDARDS OF MEASUREMENT
2.2.10 VENDOR SHARE ANALYSIS
2.2.11 DATA POINTS FROM KEY PRIMARY INTERVIEWS
2.2.12 DATA POINTS FROM KEY SECONDARY DATABASES
2.3 GLOBAL NEUROLOGICAL BIOMARKERS MARKET: RESEARCH SNAPSHOT
2.4 ASSUMPTIONS
3 MARKET OVERVIEW
3.1 DRIVERS
3.2 RESTRAINTS
3.3 OPPORTUNITIES
3.4 CHALLENGES
4 EXECUTIVE SUMMARY
5 PREMIUM INSIGHTS
5.1 PESTEL ANALYSIS
5.2 PORTER’S 5 FORCES MODEL
5.3 STRATEGIC INITIATIVES
5.4 PIPELINE ANALYSIS
5.5 PATENT ANALYSIS
5.6 RECENT ADVANCES IN BIOMARKERS FOR DEMENTIA WITH LEWY BODIES
6 INDUSTRY INSIGHTS
6.1 KEY PRICING STRATEGIES
6.2 INTERVIEWS WITH PHYSICIANS
6.3 INTERVIEWS WITH MANUFACTURERS
6.4 INTERVIEWS WITH INDUSTRY STAKEHOLDERS
6.5 OTHER KOL SNAPSHOTS
7 EPIDEMOLOGY
8 REGULATORY FRAMWORK
9 GLOBAL NEUROLOGICAL BIOMARKERS MARKET, BY PRODUCT TYPE
9.1 OVERVIEW
9.2 GENOMICS BIOMARKER
9.3 PROTEOMICS BIOMARKER
9.4 IMAGING BIOMARKER
9.5 METABOLOMICS BIOMARKER
9.6 OTHERS
10 GLOBAL NEUROLOGICAL BIOMARKERS MARKET, BY INDICATION
10.1 OVERVIEW
10.2 SPINAL MUSCULAR ATROPHY
10.3 PARKINSON'S DISEASE
10.4 SCHIZOPHRENIA
10.5 HUNTINGTON'S DISEASE
10.6 ALZHEIMER'S DISEASE
10.7 DEMENTIA
10.8 DEPRESSION
10.9 MULTIPLE SCLEROSIS
11 GLOBAL NEUROLOGICAL BIOMARKERS MARKET, BY IMAGING TECHNIQUES
11.1 OVERVIEW
11.2 TRANSCRANIAL MAGNETIC STIMULATION
11.3 DIFFUSION TENSOR IMAGING
11.4 CONVENTIONAL STRUCTURAL MRI
11.5 FUNCTIONAL MAGNETIC RESONANCE IMAGING
11.6 POSITRON EMISSION TOMOGRAPHY
12 GLOBAL NEUROLOGICAL BIOMARKERS MARKET, BY AGE GROUP
12.1 PEDIATRIC
12.2 ADULT
13 GLOBAL NEUROLOGICAL BIOMARKERS MARKET, BY END USER
13.1 OVERVIEW
13.2 HOSPITALS
13.3 DIAGNOSTIC LABORATORIES
13.4 ACADEMIC AND RESEARCH ORGANIZATIONS
13.5 PHARMACEUTICAL AND BIOTECHNOLOGY COMPANIES
14 GLOBAL NEUROLOGICAL BIOMARKERS MARKET, BY GEOGRAPHY
GLOBAL NEUROLOGICAL BIOMARKERS MARKET, (ALL SEGMENTATION PROVIDED ABOVE IS REPRESENTED IN THIS CHAPTER BY COUNTRY)
14.1 NORTH AMERICA
14.1.1 U.S.
14.1.1.1. U.S. NEUROLOGICAL BIOMARKERS MARKET, BY PRODUCT TYPE
14.1.1.2. U.S. NEUROLOGICAL BIOMARKERS MARKET, BY INDICATION
14.1.1.3. U.S. NEUROLOGICAL BIOMARKERS MARKET, BY IMAGING TECHNIQUES
14.1.1.4. U.S. NEUROLOGICAL BIOMARKERS MARKET, BY AGE GROUP
14.1.1.5. U.S. NEUROLOGICAL BIOMARKERS MARKET, BY END USER
14.1.2 CANADA
14.1.3 MEXICO
14.2 EUROPE
14.2.1 GERMANY
14.2.2 U.K.
14.2.3 ITALY
14.2.4 FRANCE
14.2.5 SPAIN
14.2.6 RUSSIA
14.2.7 SWITZERLAND
14.2.8 TURKEY
14.2.9 BELGIUM
14.2.10 NETHERLANDS
14.2.11 DENMARK
14.2.12 SWEDEN
14.2.13 POLAND
14.2.14 NORWAY
14.2.15 FINLAND
14.2.16 REST OF EUROPE
14.3 ASIA-PACIFIC
14.3.1 JAPAN
14.3.2 CHINA
14.3.3 SOUTH KOREA
14.3.4 INDIA
14.3.5 SINGAPORE
14.3.6 THAILAND
14.3.7 INDONESIA
14.3.8 MALAYSIA
14.3.9 PHILIPPINES
14.3.10 AUSTRALIA
14.3.11 NEW ZEALAND
14.3.12 REST OF ASIA-PACIFIC
14.4 SOUTH AMERICA
14.4.1 BRAZIL
14.4.2 ARGENTINA
14.4.3 VENEZUELA
14.4.4 PERU
14.4.5 CHILE
14.4.6 REST OF SOUTH AMERICA
14.5 MIDDLE EAST AND AFRICA
14.5.1 SOUTH AFRICA
14.5.2 EGYPT
14.5.3 BAHRAIN
14.5.4 UNITED ARAB EMIRATES
14.5.5 KUWAIT
14.5.6 OMAN
14.5.7 QATAR
14.5.8 SAUDI ARABIA
14.5.9 REST OF MEA
14.6 KEY PRIMARY INSIGHTS: BY MAJOR COUNTRIES
15 GLOBAL NEUROLOGICAL BIOMARKERS MARKET, SWOT AND DBMR ANALYSIS
16 GLOBAL NEUROLOGICAL BIOMARKERS MARKET, COMPANY LANDSCAPE
16.1 COMPANY SHARE ANALYSIS
16.2 MERGERS & ACQUISITIONS
16.3 NEW PRODUCT DEVELOPMENT & APPROVALS
16.4 EXPANSIONS
16.5 REGULATORY CHANGES
16.6 PARTNERSHIP AND OTHER STRATEGIC DEVELOPMENTS
17 GLOBAL NEUROLOGICAL BIOMARKERS MARKET, COMPANY PROFILE
17.1 THERMO FISHER SCIENTIFIC INC.
17.1.1 COMPANY OVERVIEW
17.1.2 GEOGRAPHIC PRESENCE
17.1.3 PRODUCT PORTFOLIO
17.1.4 REVENUE ANALYSIS
17.1.5 RECENT DEVELOPMENTS
17.2 QIAGEN
17.2.1 COMPANY OVERVIEW
17.2.2 GEOGRAPHIC PRESENCE
17.2.3 PRODUCT PORTFOLIO
17.2.4 REVENUE ANALYSIS
17.2.5 RECENT DEVELOPMENTS
17.3 Q2 SOLUTIONS
17.3.1 COMPANY OVERVIEW
17.3.2 GEOGRAPHIC PRESENCE
17.3.3 PRODUCT PORTFOLIO
17.3.4 REVENUE ANALYSIS
17.3.5 RECENT DEVELOPMENTS
17.4 F. HOFFMANN-LA ROCHE LTD
17.4.1 COMPANY OVERVIEW
17.4.2 GEOGRAPHIC PRESENCE
17.4.3 PRODUCT PORTFOLIO
17.4.4 REVENUE ANALYSIS
17.4.5 RECENT DEVELOPMENTS
17.5 IMAGILYS
17.5.1 COMPANY OVERVIEW
17.5.2 GEOGRAPHIC PRESENCE
17.5.3 PRODUCT PORTFOLIO
17.5.4 REVENUE ANALYSIS
17.5.5 RECENT DEVELOPMENTS
17.6 AMPRION INC.
17.6.1 COMPANY OVERVIEW
17.6.2 GEOGRAPHIC PRESENCE
17.6.3 PRODUCT PORTFOLIO
17.6.4 REVENUE ANALYSIS
17.6.5 RECENT DEVELOPMENTS
17.7 ADX NEUROSCIENCES NV
17.7.1 COMPANY OVERVIEW
17.7.2 GEOGRAPHIC PRESENCE
17.7.3 PRODUCT PORTFOLIO
17.7.4 REVENUE ANALYSIS
17.7.5 RECENT DEVELOPMENTS
17.8 QUANTERIX
17.8.1 COMPANY OVERVIEW
17.8.2 GEOGRAPHIC PRESENCE
17.8.3 PRODUCT PORTFOLIO
17.8.4 REVENUE ANALYSIS
17.8.5 RECENT DEVELOPMENTS
17.9 ELI LILLY AND COMPANY
17.9.1 COMPANY OVERVIEW
17.9.2 GEOGRAPHIC PRESENCE
17.9.3 PRODUCT PORTFOLIO
17.9.4 REVENUE ANALYSIS
17.9.5 RECENT DEVELOPMENTS
17.1 MERCK KGAA
17.10.1 COMPANY OVERVIEW
17.10.2 GEOGRAPHIC PRESENCE
17.10.3 PRODUCT PORTFOLIO
17.10.4 REVENUE ANALYSIS
17.10.5 RECENT DEVELOPMENTS
17.11 ATHENA DIAGNOSTICS, INC.
17.11.1 COMPANY OVERVIEW
17.11.2 GEOGRAPHIC PRESENCE
17.11.3 PRODUCT PORTFOLIO
17.11.4 REVENUE ANALYSIS
17.11.5 RECENT DEVELOPMENTS
17.12 BIO-RAD LABORATORIES, INC.
17.12.1 COMPANY OVERVIEW
17.12.2 GEOGRAPHIC PRESENCE
17.12.3 PRODUCT PORTFOLIO
17.12.4 REVENUE ANALYSIS
17.12.5 RECENT DEVELOPMENTS
17.13 BIOMÉRIEUX INC.
17.13.1 COMPANY OVERVIEW
17.13.2 GEOGRAPHIC PRESENCE
17.13.3 PRODUCT PORTFOLIO
17.13.4 REVENUE ANALYSIS
17.13.5 RECENT DEVELOPMENTS
17.14 JANSSEN GLOBAL SERVICES, LLC
17.14.1 COMPANY OVERVIEW
17.14.2 GEOGRAPHIC PRESENCE
17.14.3 PRODUCT PORTFOLIO
17.14.4 REVENUE ANALYSIS
17.14.5 RECENT DEVELOPMENTS
17.15 CHARLES RIVER LABORATORIES.
17.15.1 COMPANY OVERVIEW
17.15.2 GEOGRAPHIC PRESENCE
17.15.3 PRODUCT PORTFOLIO
17.15.4 REVENUE ANALYSIS
17.15.5 RECENT DEVELOPMENTS
17.16 ADVANCED BRAIN MONITORING, INC.
17.16.1 COMPANY OVERVIEW
17.16.2 GEOGRAPHIC PRESENCE
17.16.3 PRODUCT PORTFOLIO
17.16.4 REVENUE ANALYSIS
17.16.5 RECENT DEVELOPMENTS
17.17 NEUROSTEER INC.
17.17.1 COMPANY OVERVIEW
17.17.2 GEOGRAPHIC PRESENCE
17.17.3 PRODUCT PORTFOLIO
17.17.4 REVENUE ANALYSIS
17.17.5 RECENT DEVELOPMENTS
17.18 AC IMMUNE SA
17.18.1 COMPANY OVERVIEW
17.18.2 GEOGRAPHIC PRESENCE
17.18.3 PRODUCT PORTFOLIO
17.18.4 REVENUE ANALYSIS
17.18.5 RECENT DEVELOPMENTS
17.19 AXON NEUROSCIENCE
17.19.1 COMPANY OVERVIEW
17.19.2 GEOGRAPHIC PRESENCE
17.19.3 PRODUCT PORTFOLIO
17.19.4 REVENUE ANALYSIS
17.19.5 RECENT DEVELOPMENTS
17.2 EATRIS ERIC
17.20.1 COMPANY OVERVIEW
17.20.2 GEOGRAPHIC PRESENCE
17.20.3 PRODUCT PORTFOLIO
17.20.4 REVENUE ANALYSIS
17.20.5 RECENT DEVELOPMENTS
17.21 CEREBRAL THERAPEUTICS, INC.
17.21.1 COMPANY OVERVIEW
17.21.2 GEOGRAPHIC PRESENCE
17.21.3 PRODUCT PORTFOLIO
17.21.4 REVENUE ANALYSIS
17.21.5 RECENT DEVELOPMENTS
17.22 PERKINELMER INC.
17.22.1 COMPANY OVERVIEW
17.22.2 GEOGRAPHIC PRESENCE
17.22.3 PRODUCT PORTFOLIO
17.22.4 REVENUE ANALYSIS
17.22.5 RECENT DEVELOPMENTS
17.23 ALTOIDA
17.23.1 COMPANY OVERVIEW
17.23.2 GEOGRAPHIC PRESENCE
17.23.3 PRODUCT PORTFOLIO
17.23.4 REVENUE ANALYSIS
17.23.5 RECENT DEVELOPMENTS
17.24 FUJIREBIO
17.24.1 COMPANY OVERVIEW
17.24.2 GEOGRAPHIC PRESENCE
17.24.3 PRODUCT PORTFOLIO
17.24.4 REVENUE ANALYSIS
17.24.5 RECENT DEVELOPMENTS
17.25 HYTEST LTD
17.25.1 COMPANY OVERVIEW
17.25.2 GEOGRAPHIC PRESENCE
17.25.3 PRODUCT PORTFOLIO
17.25.4 REVENUE ANALYSIS
17.25.5 RECENT DEVELOPMENTS
17.26 RAYBIOTECH LIFE, INC.
17.26.1 COMPANY OVERVIEW
17.26.2 GEOGRAPHIC PRESENCE
17.26.3 PRODUCT PORTFOLIO
17.26.4 REVENUE ANALYSIS
17.26.5 RECENT DEVELOPMENTS
17.27 ABCAM PLC.
17.27.1 COMPANY OVERVIEW
17.27.2 GEOGRAPHIC PRESENCE
17.27.3 PRODUCT PORTFOLIO
17.27.4 REVENUE ANALYSIS
17.27.5 RECENT DEVELOPMENTS
17.28 ICON PLC
17.28.1 COMPANY OVERVIEW
17.28.2 GEOGRAPHIC PRESENCE
17.28.3 PRODUCT PORTFOLIO
17.28.4 REVENUE ANALYSIS
17.28.5 RECENT DEVELOPMENTS
17.29 LABORATORY CORPORATION OF AMERICA HOLDINGS.
17.29.1 COMPANY OVERVIEW
17.29.2 GEOGRAPHIC PRESENCE
17.29.3 PRODUCT PORTFOLIO
17.29.4 REVENUE ANALYSIS
17.29.5 RECENT DEVELOPMENTS
17.3 NQ MEDICAL.
17.30.1 COMPANY OVERVIEW
17.30.2 GEOGRAPHIC PRESENCE
17.30.3 PRODUCT PORTFOLIO
17.30.4 REVENUE ANALYSIS
17.30.5 RECENT DEVELOPMENTS
17.31 CREATIVE BIOLABS.
17.31.1 COMPANY OVERVIEW
17.31.2 GEOGRAPHIC PRESENCE
17.31.3 PRODUCT PORTFOLIO
17.31.4 REVENUE ANALYSIS
17.31.5 RECENT DEVELOPMENTS
17.32 OLINK
17.32.1 COMPANY OVERVIEW
17.32.2 GEOGRAPHIC PRESENCE
17.32.3 PRODUCT PORTFOLIO
17.32.4 REVENUE ANALYSIS
17.32.5 RECENT DEVELOPMENTS
17.33 RESONANCE HEALTH LTD
17.33.1 COMPANY OVERVIEW
17.33.2 GEOGRAPHIC PRESENCE
17.33.3 PRODUCT PORTFOLIO
17.33.4 REVENUE ANALYSIS
17.33.5 RECENT DEVELOPMENTS
18 RELATED REPORTS
19 CONCLUSION
20 QUESTIONNAIRE
21 ABOUT DATA BRIDGE MARKET RESEARCH
Research Methodology
Data collection and base year analysis are done using data collection modules with large sample sizes. The stage includes obtaining market information or related data through various sources and strategies. It includes examining and planning all the data acquired from the past in advance. It likewise envelops the examination of information inconsistencies seen across different information sources. The market data is analysed and estimated using market statistical and coherent models. Also, market share analysis and key trend analysis are the major success factors in the market report. To know more, please request an analyst call or drop down your inquiry.
The key research methodology used by DBMR research team is data triangulation which involves data mining, analysis of the impact of data variables on the market and primary (industry expert) validation. Data models include Vendor Positioning Grid, Market Time Line Analysis, Market Overview and Guide, Company Positioning Grid, Patent Analysis, Pricing Analysis, Company Market Share Analysis, Standards of Measurement, Global versus Regional and Vendor Share Analysis. To know more about the research methodology, drop in an inquiry to speak to our industry experts.
Customization Available
Data Bridge Market Research is a leader in advanced formative research. We take pride in servicing our existing and new customers with data and analysis that match and suits their goal. The report can be customized to include price trend analysis of target brands understanding the market for additional countries (ask for the list of countries), clinical trial results data, literature review, refurbished market and product base analysis. Market analysis of target competitors can be analyzed from technology-based analysis to market portfolio strategies. We can add as many competitors that you require data about in the format and data style you are looking for. Our team of analysts can also provide you data in crude raw excel files pivot tables (Fact book) or can assist you in creating presentations from the data sets available in the report.

