Global Microscopes Slides And Cover Slip Market
Market Size in USD Billion
CAGR :
% 
 USD
492.20 Million
USD
814.59 Million
2022
2030
USD
492.20 Million
USD
814.59 Million
2022
2030
| 2023 –2030 | |
| USD 492.20 Million | |
| USD 814.59 Million | |
| % | |
|
Global Microscopes Slides and Cover Slip Market, By Slides Type (Regular Microscope Slides, Adhesive Microscope Slides, Pattern Printed Microscope Slide, Others), Microscopes Slides Application (Scientific Research, Tissue-Based Testing, Urine Analysis, Others), Thickness (0.13 to 0.16 mm thick, 0.16 to 0.19 mm thick, 0.19 to 0.23 mm thick, Others thickness), Microscopes Cover Slip Application (Medicine, Biology, Education, Laboratories, Hospitals and Clinics, Pathology and Diagnostic Laboratories, Others) – Industry Trends and Forecast to 2030.
Microscopes Slides and Cover Slip Market Analysis and Size
Rising demand for microscopes and increased funding for biological research activities around the world are driving growth factors. Increased physician and patient awareness of the benefits of microscope slides and coverslips will generate enormous potential opportunities for the industry. Aside from the increasing number of R&D activities, which will further contribute by creating massive opportunities, the microscopes slides and coverslip market will grow from 2023 to 2030.
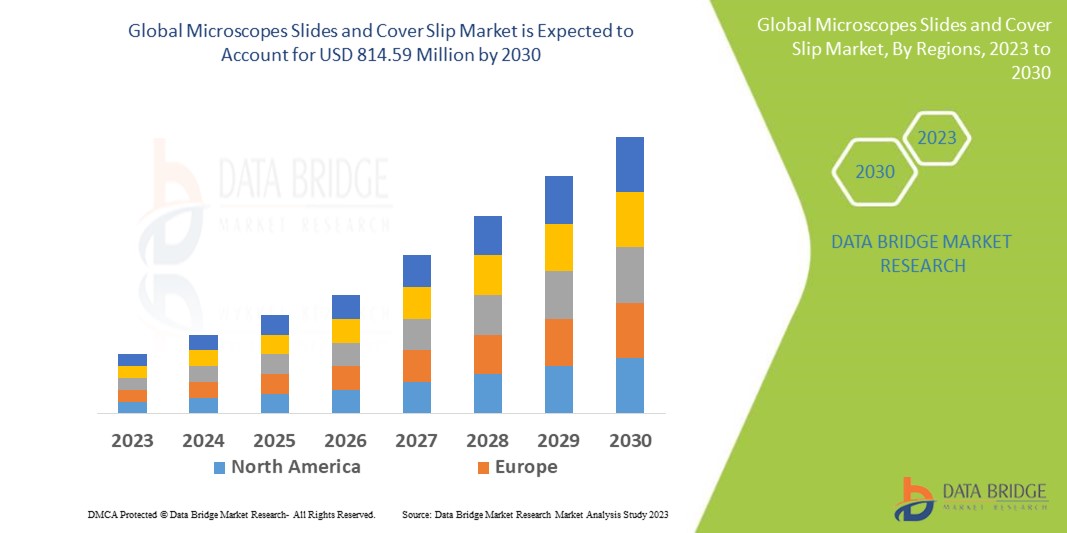
Data Bridge Market Research analyses that the microscopes slides and cover slip market which is USD 492.2 million in 2022, is expected to reach USD 814.59 million by 2030, at a CAGR of 6.5% during the forecast period 2023 to 2030. In addition to the insights on market scenarios such as market value, growth rate, segmentation, geographical coverage, and major players, the market reports curated by the Data Bridge Market Research also include depth expert analysis, patient epidemiology, pipeline analysis, pricing analysis, and regulatory framework.
Microscopes Slides and Cover Slip Market Scope and Segmentation
|
Report Metric |
Details |
|
Forecast Period |
2023 to 2030 |
|
Base Year |
2022 |
|
Historic Years |
2021 (Customizable to 2015 - 2020) |
|
Quantitative Units |
Revenue in USD Million, Volumes in Units, Pricing in USD |
|
Segments Covered |
Slides Type (Regular Microscope Slides, Adhesive Microscope Slides, Pattern Printed Microscope Slide, Others), Microscopes Slides Application (Scientific Research, Tissue-Based Testing, Urine Analysis, Others), Thickness (0.13 to 0.16 mm thick, 0.16 to 0.19 mm thick, 0.19 to 0.23 mm thick, Others thickness), Microscopes Cover Slip Application (Medicine, Biology, Education, Laboratories, Hospitals and Clinics, Pathology and Diagnostic Laboratories, Others) |
|
Countries Covered |
U.S., Canada and Mexico in North America, Germany, France, U.K., Netherlands, Switzerland, Belgium, Russia, Italy, Spain, Turkey, Rest of Europe in Europe, China, Japan, India, South Korea, Singapore, Malaysia, Australia, Thailand, Indonesia, Philippines, Rest of Asia-Pacific (APAC) in the Asia-Pacific (APAC), Saudi Arabia, U.A.E, South Africa, Egypt, Israel, Rest of Middle East and Africa (MEA) as a part of Middle East and Africa (MEA), Brazil, Argentina and Rest of South America as part of South America |
|
Market Players Covered |
Thermo Fisher Scientific Inc. (U.S.), Waldemar Knittel Glasbearbeitungs GmbH (Germany), BRG Biomedicals (India), Corning Incorporated (U.S.), Leica Biosystems Nussloch GmbH (Germany), Belden Inc. (U.S.), Globe Scientific Inc. (U.S.), DWK Life Sciences (Germany), Paul Marienfeld GmbH and Co. KG (Germany), CHEMGLASS (U.S.), MUTO PURE CHEMICALS CO.,LTD. (Japan), Canadian Scientific Lab Systems Inc. (Canada), Citotest Labware Manufacturing Co. Ltd. (China), Jiangsu Huida Medical Instruments Co. Ltd (China) |
|
Market Opportunities |
|
Market Definition
A microscope slide is a thin piece of glass that is used to examine various specimens in microscopes. Typically, the specimen is placed on a slide and then examined under a microscope. A cover slip, also known as a cover glass, is used to protect the specimen in a microscope slide.
Microscopes Slides and Cover Slip Market Dynamics
Drivers
- Growing usages of microscopes
Increasing demand for microscope slides by researchers and pathologists, global healthcare industry expansion, and the easy availability of advanced and improved devices are some of the major and critical factors that will likely augment the growth of the microscope slides and cover slip market in hospitals, laboratories, and other settings.
Opportunities
- Surging levels of investment for the frequency of advanced products
Along with the increasing number of R&D activities, which will contribute by generating massive opportunities, the microscopes slide and cover slip market will grow during the forecasted timeframe, and the increasing demand for microscopes slides by researchers and pathologists is another factor driving the market.
Restraints/Challenges
- High costs associated with microscope slides
The high costs associated with microscope slides and coverslip consumption will most likely act as a market constraint for the growth of microscope slides and cover slips. When wet mounts are placed under a microscope, the heat from the light evaporates the water, causing the mounts to dry faster. If this happens, just add a few more drops of liquid.
This microscopes slides and cover slip market report provides details of new recent developments, trade regulations, import-export analysis, production analysis, value chain optimization, market share, impact of domestic and localized market players, analyses opportunities in terms of emerging revenue pockets, changes in market regulations, strategic market growth analysis, market size, category market growths, application niches and dominance, product approvals, product launches, geographic expansions, technological innovations in the market. To gain more info on the microscopes slides and cover slip market contact Data Bridge Market Research for an Analyst Brief, our team will help you take an informed market decision to achieve market growth.
Global Microscopes Slides and Cover Slip Market Scope
The microscopes slides and cover slip market is segmented on the basis of type, cover slip application, microscope slides application, thickness. The growth amongst these segments will help you analyze meagre growth segments in the industries and provide the users with a valuable market overview and market insights to help them make strategic decisions for identifying core market applications.
Type
- Regular Microscope Slides
- Adhesive Microscope Slides
- Pattern Printed Microscope Slide
- Others
Microscope Slides Application
- Scientific Research
- Tissue Based Testing
- Urine Analysis
- Others
Thickness
- 13 to 0.16 mm thick
- 16 to 0.19 mm thick
- 19 to 0.23 mm thick
- Others thickness
Cover Slip Application
- Medicine
- Biology
- Education
- Laboratories
- Hospitals and Clinics
- Pathology and Diagnostic Laboratories
- Others
Microscopes Slides and Cover Slip Market Regional Analysis/Insights
The microscopes slides and cover slip market is analyzed and market size insights and trends are provided by country, type, cover slip application, microscope slides application, thickness as referenced above.
The countries covered in the microscopes slides and cover slip market report are U.S., Canada and Mexico in North America, Germany, France, U.K., Netherlands, Switzerland, Belgium, Russia, Italy, Spain, Turkey, Rest of Europe in Europe, China, Japan, India, South Korea, Singapore, Malaysia, Australia, Thailand, Indonesia, Philippines, Rest of Asia-Pacific (APAC) in the Asia-Pacific (APA C), Saudi Arabia, U.A.E, South Africa, Egypt, Israel, Rest of Middle East and Africa (MEA) as a part of Middle East and Africa (MEA), Brazil, Argentina and Rest of South America as part of South America.
North America dominates the microscopes slides and cover slip market due to the increasing growth of the healthcare sector in the region.
Asia-Pacific is expected to grow at the highest growth rate in the forecast period of 2023 to 2030 due to the high demand of the product along with increasing number of research and development activities in the region.
The country section of the report also provides individual market impacting factors and changes in regulation in the market domestically that impacts the current and future trends of the market. Data points like down-stream and upstream value chain analysis, technical trends and porter's five forces analysis, case studies are some of the pointers used to forecast the market scenario for individual countries. Also, the presence and availability of global brands and their challenges faced due to large or scarce competition from local and domestic brands, impact of domestic tariffs and trade routes are considered while providing forecast analysis of the country data.
Healthcare Infrastructure Growth Installed base and New Technology Penetration
The microscopes slides and cover slip market also provides you with detailed market analysis for every country growth in healthcare expenditure for capital equipment, installed base of different kind of products for microscopes slides and cover slip market, impact of technology using life line curves and changes in healthcare regulatory scenarios and their impact on the microscopes slides and cover slip market. The data is available for historic period 2011-2021.
Competitive Landscape and Microscopes Slides and Cover Slip Market Share Analysis
The microscopes slides and cover slip market competitive landscape provides details by competitor. Details included are company overview, company financials, revenue generated, market potential, investment in research and development, new market initiatives, global presence, production sites and facilities, production capacities, company strengths and weaknesses, product launch, product width and breadth, application dominance. The above data points provided are only related to the companies' focus related to microscopes slides and cover slip market.
Some of the major players operating in the microscopes slides and cover slip market are:
- Thermo Fisher Scientific Inc. (U.S.)
- Waldemar Knittel Glasbearbeitungs GmbH (Germany)
- BRG Biomedicals (India)
- Corning Incorporated (U.S.)
- Leica Biosystems Nussloch GmbH (Germany)
- Belden Inc. (U.S.)
- Globe Scientific Inc. (U.S.)
- DWK Life Sciences (Germany)
- Paul Marienfeld GmbH and Co. KG (Germany)
- CHEMGLASS (U.S.)
- MUTO PURE CHEMICALS CO. LTD. (Japan)
- Canadian Scientific Lab Systems Inc. (Canada)
- Citotest Labware Manufacturing Co. Ltd. (China)
- Jiangsu Huida Medical Instruments Co. Ltd (China)
SKU-
Get online access to the report on the World's First Market Intelligence Cloud

- Interactive Data Analysis Dashboard
- Company Analysis Dashboard for high growth potential opportunities
- Research Analyst Access for customization & queries
- Competitor Analysis with Interactive dashboard
- Latest News, Updates & Trend analysis
- Harness the Power of Benchmark Analysis for Comprehensive Competitor Tracking
Table of Content
1 INTRODUCTION
1.1 OBJECTIVES OF THE STUDY
1.2 MARKET DEFINITION
1.3 OVERVIEW OF GLOBAL MICROSCOPES SLIDES AND COVER SLIP MARKET
1.4 CURRENCY AND PRICING
1.5 LIMITATION
1.6 MARKETS COVERED
2 MARKET SEGMENTATION
2.1 KEY TAKEAWAYS
2.2 ARRIVING AT THE GLOBAL MICROSCOPES SLIDES AND COVER SLIP MARKET SIZE
2.3 VENDOR POSITIONING GRID
2.4 TECHNOLOGY LIFE LINE CURVE
2.5 MARKET GUIDE
2.6 COMPANY POSITIONING GRID
2.7 COMPANY MARKET SHARE ANALYSIS
2.8 MULTIVARIATE MODELLING
2.9 TOP TO BOTTOM ANALYSIS
2.1 STANDARDS OF MEASUREMENT
2.11 VENDOR SHARE ANALYSIS
2.12 SALES VOLUME
2.13 DATA POINTS FROM KEY PRIMARY INTERVIEWS
2.14 DATA POINTS FROM KEY SECONDARY DATABASES
2.15 GLOBAL MICROSCOPES SLIDES AND COVER SLIP MARKET: RESEARCH SNAPSHOT
2.16 ASSUMPTIONS
3 MARKET OVERVIEW
3.1 DRIVERS
3.2 RESTRAINTS
3.3 OPPORTUNITIES
3.4 CHALLENGES
4 EXECUTIVE SUMMARY
5 PREMIUM INSIGHTS
5.1 PESTEL ANALYSIS
5.2 PORTER’S 5 FORCES
5.3 PATENT ANALYSIS
5.4 TECHNOLOGICAL ADVANCEMENT IN DIGITAL PATHOLOGY
5.5 REIMBURSEMENT SCENARIO
5.6 PROBABLE UPCOMING PLAYERS
5.6.1 ACCU-SCOPE
5.6.2 NANOMSLIDE
5.6.3 PHENOM XL G2
5.6.4 ANDOR TECHNOLOGY
5.6.5 EVIDENT
5.6.6 WARD'S SCIENCE
5.6.7 GRUNDIUM LTD
5.6.8 EXPLORE SCIENTIFIC.
5.6.9 LIVING SLIDES
5.6.10 DIATOM LAB
5.6.11 DIGISCAN
5.6.12 MBF BIOSCIENCE
5.6.13 SPOT IMAGING
5.6.14 CAMICROSCOPE
5.6.15 THE DIGITAL SLIDE ARCHIVE
5.6.16 THE SEDEEN VIEWER
5.6.17 QUPATH
5.6.18 AUGMENTIQS
5.6.19 3DHISTECH LTD.
5.6.20 PATHOMATION
5.7 EMERGING TRENDS
5.8 SHORTER CYCLE TIMES WITH RECENT DEVELOPMENTS
5.9 MICROSCOPES SLIDES AND COVER SLIP MARKET ANALYSIS (QUALITATIVE AND QUANTITATIVE ANALYSIS)
6 INDUSTRY INSIGHTS
6.1 KEY PRICING STRATEGIES
6.2 INTERVIEWS WITH STERILIZATION COMPANIES
6.3 INTERVIEWS WITH SERVICE PROVIDERS
6.4 INTERVIEWS WITH RESEARCH SCHOLARS
6.5 OTHER KOL SNAPSHOTS
7 REGULATORY FRAMEWORK
8 GLOBAL MICROSCOPES SLIDES AND COVER SLIP MARKET, BY PRODUCTS
8.1 OVERVIEW
8.2 MICROSCOPE SLIDES
8.2.1 MICRSCOPE SLIDES, BY TYPE
8.2.1.1. REGULAR MICROSCOPE SLIDES
8.2.1.1.1. MARKET VALUE (USD MILLION)
8.2.1.1.2. MARKET VOLUME (UNIT)
8.2.1.1.3. AVERAGE SELLING PRICE (USD MILLION)
8.2.1.2. ADHESIVE MICROSCOPE SLIDES
8.2.1.2.1. MARKET VALUE (USD MILLION)
8.2.1.2.2. MARKET VOLUME (UNIT)
8.2.1.2.3. AVERAGE SELLING PRICE (USD MILLION)
8.2.1.3. PATTERN PRINTED MICROSCOPE SLIDE
8.2.1.3.1. MARKET VALUE (USD MILLION)
8.2.1.3.2. MARKET VOLUME (UNIT)
8.2.1.3.3. AVERAGE SELLING PRICE (USD MILLION)
8.2.1.3.4. OTHERS
8.2.2 MICRSCOPE SLIDES, BY SIZE
8.2.2.1. 0.13 TO 0.16 MM THICK
8.2.2.1.1. MARKET VALUE (USD MILLION)
8.2.2.1.2. MARKET VOLUME (UNIT)
8.2.2.1.3. AVERAGE SELLING PRICE (USD MILLION)
8.2.2.2. 0.16 TO 0.19 MM THICK
8.2.2.2.1. MARKET VALUE (USD MILLION)
8.2.2.2.2. MARKET VOLUME (UNIT)
8.2.2.2.3. AVERAGE SELLING PRICE (USD MILLION)
8.2.2.3. 0.19 TO 0.23 MM THICK
8.2.2.3.1. MARKET VALUE (USD MILLION)
8.2.2.3.2. MARKET VOLUME (UNIT)
8.2.2.3.3. AVERAGE SELLING PRICE (USD MILLION)
8.2.2.4. OTHER THICKNESS
8.3 COVER SLIP
8.3.1 GLASS
8.3.1.1. MARKET VALUE (USD MILLION)
8.3.1.2. MARKET VOLUME (UNIT)
8.3.1.3. AVERAGE SELLING PRICE (USD MILLION)
8.3.2 PLASTIC
8.3.2.1. MARKET VALUE (USD MILLION)
8.3.2.2. MARKET VOLUME (UNIT)
8.3.2.3. AVERAGE SELLING PRICE (USD MILLION)
9 GLOBAL MICROSCOPES SLIDES AND COVER SLIP MARKET, BY APPLICATION
9.1 OVERVIEW
9.2 SCIENTIFIC RESEARCH
9.2.1 REGULAR MICROSCOPE SLIDES
9.2.1.1. MARKET VALUE (USD MILLION)
9.2.1.2. MARKET VOLUME (UNIT)
9.2.1.3. AVERAGE SELLING PRICE (USD MILLION)
9.2.2 ADHESIVE MICROSCOPE SLIDES
9.2.2.1. MARKET VALUE (USD MILLION)
9.2.2.2. MARKET VOLUME (UNIT)
9.2.2.3. AVERAGE SELLING PRICE (USD MILLION)
9.2.3 PATTERN PRINTED MICROSCOPE SLIDE
9.2.3.1. MARKET VALUE (USD MILLION)
9.2.3.2. MARKET VOLUME (UNIT)
9.2.3.3. AVERAGE SELLING PRICE (USD MILLION)
9.2.4 OTHERS
9.3 TISSUE BASED
9.3.1 REGULAR MICROSCOPE SLIDES
9.3.1.1. MARKET VALUE (USD MILLION)
9.3.1.2. MARKET VOLUME (UNIT)
9.3.1.3. AVERAGE SELLING PRICE (USD MILLION)
9.3.2 ADHESIVE MICROSCOPE SLIDES
9.3.2.1. MARKET VALUE (USD MILLION)
9.3.2.2. MARKET VOLUME (UNIT)
9.3.2.3. AVERAGE SELLING PRICE (USD MILLION)
9.3.3 PATTERN PRINTED MICROSCOPE SLIDE
9.3.3.1. MARKET VALUE (USD MILLION)
9.3.3.2. MARKET VOLUME (UNIT)
9.3.3.3. AVERAGE SELLING PRICE (USD MILLION)
9.3.4 OTHERS
9.4 URINE ANALYSIS
9.4.1 REGULAR MICROSCOPE SLIDES
9.4.1.1. MARKET VALUE (USD MILLION)
9.4.1.2. MARKET VOLUME (UNIT)
9.4.1.3. AVERAGE SELLING PRICE (USD MILLION)
9.4.2 ADHESIVE MICROSCOPE SLIDES
9.4.2.1. MARKET VALUE (USD MILLION)
9.4.2.2. MARKET VOLUME (UNIT)
9.4.2.3. AVERAGE SELLING PRICE (USD MILLION)
9.4.3 PATTERN PRINTED MICROSCOPE SLIDE
9.4.3.1. MARKET VALUE (USD MILLION)
9.4.3.2. MARKET VOLUME (UNIT)
9.4.3.3. AVERAGE SELLING PRICE (USD MILLION)
9.4.4 OTHERS
9.5 OTHERS
10 GLOBAL MICROSCOPES SLIDES AND COVER SLIP MARKET, BY MICROSCOPES COVER SLIP, BY USAGE
10.1 OVERVIEW
10.2 CLINICAL
10.2.1 MICROSCOPES SLIDES
10.2.2 COVER SLIP
10.3 NON-CLINICAL
10.3.1 MICROSCOPES SLIDES
10.3.2 COVER SLIP
11 GLOBAL MICROSCOPES SLIDES AND COVER SLIP MARKET, BY END USER
11.1 OVERVIEW
11.2 HOSPITALS
11.2.1 BY TYPE
11.2.1.1. PUBLIC
11.2.1.2. PRIVATE
11.2.2 BY TIER
11.2.2.1. TIER I
11.2.2.2. TIER II
11.2.2.3. TIER III
11.3 CLINICS
11.4 PATHOLOGY LABORATORIES
11.5 RESEARCH & ACADEMIC INSTITUTES
11.6 OTHERS
12 GLOBAL MICROSCOPES SLIDES AND COVER SLIP MARKET, BY DISTRIBUTION CHANNEL
12.1 OVERVIEW
12.2 DIRECT TENDER
12.3 RETAIL SALES
12.4 OTHERS
13 GLOBAL MICROSCOPES SLIDES AND COVER SLIP MARKET, BY GEOGRAPHY
13.1 GLOBAL MICROSCOPES SLIDES AND COVER SLIP MARKET, (ALL SEGMENTATION PROVIDED ABOVE IS REPRESENTED IN THIS CHAPTER BY COUNTRY)
13.1.1 NORTH AMERICA
13.1.1.1. U.S.
13.1.1.2. CANADA
13.1.1.3. MEXICO
13.1.2 EUROPE
13.1.2.1. GERMANY
13.1.2.2. FRANCE
13.1.2.3. U.K.
13.1.2.4. ITALY
13.1.2.5. SPAIN
13.1.2.6. RUSSIA
13.1.2.7. TURKEY
13.1.2.8. BELGIUM
13.1.2.9. NETHERLANDS
13.1.2.10. SWITZERLAND
13.1.2.11. LUXEMBURG
13.1.2.12. REST OF EUROPE
13.1.3 ASIA-PACIFIC
13.1.3.1. JAPAN
13.1.3.2. CHINA
13.1.3.3. SOUTH KOREA
13.1.3.4. INDIA
13.1.3.5. AUSTRALIA
13.1.3.6. SINGAPORE
13.1.3.7. THAILAND
13.1.3.8. MALAYSIA
13.1.3.9. INDONESIA
13.1.3.10. PHILIPPINES
13.1.3.11. REST OF ASIA-PACIFIC
13.1.4 SOUTH AMERICA
13.1.4.1. BRAZIL
13.1.4.2. ARGENTINA
13.1.4.3. REST OF SOUTH AMERICA
13.1.5 MIDDLE EAST AND AFRICA
13.1.5.1. SOUTH AFRICA
13.1.5.2. EGYPT
13.1.5.3. SAUDI ARABIA
13.1.5.4. UAE
13.1.5.5. ISRAEL
13.1.5.6. REST OF MIDDLE EAST AND AFRICA
13.2 KEY PRIMARY INSIGHTS: BY MAJOR COUNTRIES
14 GLOBAL MICROSCOPES SLIDES AND COVER SLIP MARKET, COMPANY LANDSCAPE
14.1 COMPANY SHARE ANALYSIS: GLOBAL
14.2 COMPANY SHARE ANALYSIS: NORTH AMERICA
14.3 COMPANY SHARE ANALYSIS: EUROPE
14.4 COMPANY SHARE ANALYSIS: ASIA PACIFIC
14.5 MERGERS & ACQUISITIONS
14.6 NEW PRODUCT DEVELOPMENT & APPROVALS
14.7 EXPANSIONS
14.8 REGULATORY CHANGES
14.9 PARTNERSHIP AND OTHER STRATEGIC DEVELOPMENTS
15 GLOBAL MICROSCOPES SLIDES AND COVER SLIP MARKET, SWOT AND DBMR ANALYSIS
16 GLOBAL MICROSCOPES SLIDES AND COVER SLIP MARKET, COMPANY PROFILE
16.1 THERMO FISHER SCIENTIFIC INC
16.1.1 COMPANY OVERVIEW
16.1.2 REVENUE ANALYSIS
16.1.3 GEOGRAPHIC PRESENCE
16.1.4 PRODUCT PORTFOLIO
16.1.5 RECENT DEVELOPMENTS
16.2 WALDEMAR KNITTEL GLASBEARBEITUNGS GMBH
16.2.1 COMPANY OVERVIEW
16.2.2 REVENUE ANALYSIS
16.2.3 GEOGRAPHIC PRESENCE
16.2.4 PRODUCT PORTFOLIO
16.2.5 RECENT DEVELOPMENTS
16.3 BRG BIOMEDICALS
16.3.1 COMPANY OVERVIEW
16.3.2 REVENUE ANALYSIS
16.3.3 GEOGRAPHIC PRESENCE
16.3.4 PRODUCT PORTFOLIO
16.3.5 RECENT DEVELOPMENTS
16.4 LEICA BIOSYSTEMS
16.4.1 COMPANY OVERVIEW
16.4.2 REVENUE ANALYSIS
16.4.3 GEOGRAPHIC PRESENCE
16.4.4 PRODUCT PORTFOLIO
16.4.5 RECENT DEVELOPMENTS
16.5 GLOBE SCIENTIFIC INC.
16.5.1 COMPANY OVERVIEW
16.5.2 REVENUE ANALYSIS
16.5.3 GEOGRAPHIC PRESENCE
16.5.4 PRODUCT PORTFOLIO
16.5.5 RECENT DEVELOPMENTS
16.6 DWK LIFE SCIENCES
16.6.1 COMPANY OVERVIEW
16.6.2 REVENUE ANALYSIS
16.6.3 GEOGRAPHIC PRESENCE
16.6.4 PRODUCT PORTFOLIO
16.6.5 RECENT DEVELOPMENTS
16.7 CORNING INCORPORATED
16.7.1 COMPANY OVERVIEW
16.7.2 REVENUE ANALYSIS
16.7.3 GEOGRAPHIC PRESENCE
16.7.4 PRODUCT PORTFOLIO
16.7.5 RECENT DEVELOPMENTS
16.8 PAUL MARIENFELD GMBH & CO. KG
16.8.1 COMPANY OVERVIEW
16.8.2 REVENUE ANALYSIS
16.8.3 GEOGRAPHIC PRESENCE
16.8.4 PRODUCT PORTFOLIO
16.8.5 RECENT DEVELOPMENTS
16.9 CHEMGLASS
16.9.1 COMPANY OVERVIEW
16.9.2 REVENUE ANALYSIS
16.9.3 GEOGRAPHIC PRESENCE
16.9.4 PRODUCT PORTFOLIO
16.9.5 RECENT DEVELOPMENTS
16.1 MUTO PURE CHEMICALS CO.,LTD
16.10.1 COMPANY OVERVIEW
16.10.2 REVENUE ANALYSIS
16.10.3 GEOGRAPHIC PRESENCE
16.10.4 PRODUCT PORTFOLIO
16.10.5 RECENT DEVELOPMENTS
16.11 PROLAB SCIENTIFIC LTD.
16.11.1 COMPANY OVERVIEW
16.11.2 REVENUE ANALYSIS
16.11.3 GEOGRAPHIC PRESENCE
16.11.4 PRODUCT PORTFOLIO
16.11.5 RECENT DEVELOPMENTS
16.12 CITOTEST LABWARE MANUFACTURING CO.,LTD.
16.12.1 COMPANY OVERVIEW
16.12.2 REVENUE ANALYSIS
16.12.3 GEOGRAPHIC PRESENCE
16.12.4 PRODUCT PORTFOLIO
16.12.5 RECENT DEVELOPMENTS
16.13 JIANGSU HUIDA MEDICAL INSTRUMENTS CO.,LTD
16.13.1 COMPANY OVERVIEW
16.13.2 REVENUE ANALYSIS
16.13.3 GEOGRAPHIC PRESENCE
16.13.4 PRODUCT PORTFOLIO
16.13.5 RECENT DEVELOPMENTS
16.14 AGAR SCIENTIFIC LTD.
16.14.1 COMPANY OVERVIEW
16.14.2 REVENUE ANALYSIS
16.14.3 GEOGRAPHIC PRESENCE
16.14.4 PRODUCT PORTFOLIO
16.14.5 RECENT DEVELOPMENTS
16.15 VWR INTERNATIONAL, LLC.
16.15.1 COMPANY OVERVIEW
16.15.2 REVENUE ANALYSIS
16.15.3 GEOGRAPHIC PRESENCE
16.15.4 PRODUCT PORTFOLIO
16.15.5 RECENT DEVELOPMENTS
16.16 MATTEK
16.16.1 COMPANY OVERVIEW
16.16.2 REVENUE ANALYSIS
16.16.3 GEOGRAPHIC PRESENCE
16.16.4 PRODUCT PORTFOLIO
16.16.5 RECENT DEVELOPMENTS
16.17 SEMADENI AG
16.17.1 COMPANY OVERVIEW
16.17.2 REVENUE ANALYSIS
16.17.3 GEOGRAPHIC PRESENCE
16.17.4 PRODUCT PORTFOLIO
16.17.5 RECENT DEVELOPMENTS
16.18 GLASWARENFABRIK KARL HECHT GMBH & CO KG
16.18.1 COMPANY OVERVIEW
16.18.2 REVENUE ANALYSIS
16.18.3 GEOGRAPHIC PRESENCE
16.18.4 PRODUCT PORTFOLIO
16.18.5 RECENT DEVELOPMENTS
16.19 BHARAT ENTERPRISES(BIOPLUS).
16.19.1 COMPANY OVERVIEW
16.19.2 REVENUE ANALYSIS
16.19.3 GEOGRAPHIC PRESENCE
16.19.4 PRODUCT PORTFOLIO
16.19.5 RECENT DEVELOPMENTS
16.2 HAUSSER SCIENTIFIC.
16.20.1 COMPANY OVERVIEW
16.20.2 REVENUE ANALYSIS
16.20.3 GEOGRAPHIC PRESENCE
16.20.4 PRODUCT PORTFOLIO
16.20.5 RECENT DEVELOPMENTS
16.21 AZER SCIENTIFIC INC
16.21.1 COMPANY OVERVIEW
16.21.2 REVENUE ANALYSIS
16.21.3 GEOGRAPHIC PRESENCE
16.21.4 PRODUCT PORTFOLIO
16.21.5 RECENT DEVELOPMENTS
16.22 KEMTECH AMERICA INC.
16.22.1 COMPANY OVERVIEW
16.22.2 REVENUE ANALYSIS
16.22.3 GEOGRAPHIC PRESENCE
16.22.4 PRODUCT PORTFOLIO
16.22.5 RECENT DEVELOPMENTS
16.23 BIOCYTECH CORPORATION S/B
16.23.1 COMPANY OVERVIEW
16.23.2 REVENUE ANALYSIS
16.23.3 GEOGRAPHIC PRESENCE
16.23.4 PRODUCT PORTFOLIO
16.23.5 RECENT DEVELOPMENTS
16.24 CELESTRON, LLC
16.24.1 COMPANY OVERVIEW
16.24.2 REVENUE ANALYSIS
16.24.3 GEOGRAPHIC PRESENCE
16.24.4 PRODUCT PORTFOLIO
16.24.5 RECENT DEVELOPMENTS
16.25 COLE-PARMER INSTRUMENT COMPANY, LLC.
16.25.1 COMPANY OVERVIEW
16.25.2 REVENUE ANALYSIS
16.25.3 GEOGRAPHIC PRESENCE
16.25.4 PRODUCT PORTFOLIO
16.25.5 RECENT DEVELOPMENTS
16.26 SCIENION AG
16.26.1 COMPANY OVERVIEW
16.26.2 REVENUE ANALYSIS
16.26.3 GEOGRAPHIC PRESENCE
16.26.4 PRODUCT PORTFOLIO
16.26.5 RECENT DEVELOPMENTS
17 RELATED REPORTS
18 QUESTIONNAIRE
19 ABOUT DATA BRIDGE MARKET RESEARCH
Research Methodology
Data collection and base year analysis are done using data collection modules with large sample sizes. The stage includes obtaining market information or related data through various sources and strategies. It includes examining and planning all the data acquired from the past in advance. It likewise envelops the examination of information inconsistencies seen across different information sources. The market data is analysed and estimated using market statistical and coherent models. Also, market share analysis and key trend analysis are the major success factors in the market report. To know more, please request an analyst call or drop down your inquiry.
The key research methodology used by DBMR research team is data triangulation which involves data mining, analysis of the impact of data variables on the market and primary (industry expert) validation. Data models include Vendor Positioning Grid, Market Time Line Analysis, Market Overview and Guide, Company Positioning Grid, Patent Analysis, Pricing Analysis, Company Market Share Analysis, Standards of Measurement, Global versus Regional and Vendor Share Analysis. To know more about the research methodology, drop in an inquiry to speak to our industry experts.
Customization Available
Data Bridge Market Research is a leader in advanced formative research. We take pride in servicing our existing and new customers with data and analysis that match and suits their goal. The report can be customized to include price trend analysis of target brands understanding the market for additional countries (ask for the list of countries), clinical trial results data, literature review, refurbished market and product base analysis. Market analysis of target competitors can be analyzed from technology-based analysis to market portfolio strategies. We can add as many competitors that you require data about in the format and data style you are looking for. Our team of analysts can also provide you data in crude raw excel files pivot tables (Fact book) or can assist you in creating presentations from the data sets available in the report.

