
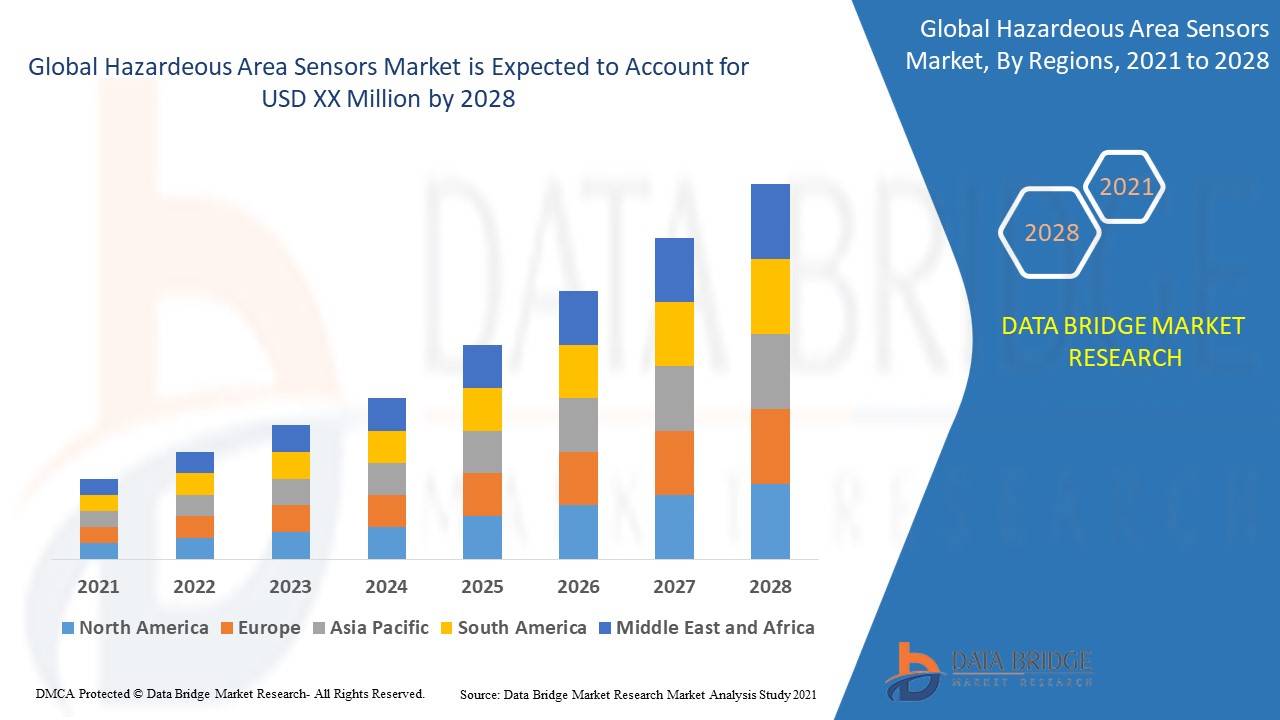
Market Analysis and Insights: Global Hazardeous Area Sensors Market
Hazardeous area sensors market will reach at an estimated value of USD 5679.10 million by 2028 and grow at a CAGR of 4.50% in the forecast period of 2021 to 2028. Rise in the importance of intrinsic safety in several manufacturing units, such as paint manufacturers, chemical plants, textile factories, refineries is an essential factor driving the hazardeous area sensors market.
Rise in the industrial safety measures acts as a crucial factor accelerating the market growth, also rise in the technological advancements in lighting solutions, rise in the industrialization and rise in the research and development activities are the major factors among others boosting the hazardeous area sensors market. Moreover, rise in the demand for low-cost and high light output per watt lighting solutions will further create new opportunities for hazardeous area sensors market in the forecast period mentioned above.
However, time-consuming and expensive inspection and maintenance and rise in the cost of research and development activities acts as the major factor among others restraining the market growth, and will further challenge the hazardeous area sensors market in the forecast period mentioned above.
This hazardeous area sensors market report provides details of new recent developments, trade regulations, import export analysis, production analysis, value chain optimization, market share, impact of domestic and localised market players, analyses opportunities in terms of emerging revenue pockets, changes in market regulations, strategic market growth analysis, market size, category market growths, application niches and dominance, product approvals, product launches, geographic expansions, technological innovations in the market. To gain more info on hazardeous area sensors market contact Data Bridge Market Research for an Analyst Brief, our team will help you take an informed market decision to achieve market growth.
Hazardeous Area Sensors Market Scope and Market Size
hazardeous area sensors market is segmented on the basis of type and application. The growth among segments helps you analyse niche pockets of growth and strategies to approach the market and determine your core application areas and the difference in your target markets.
- On the basis of type, hazardeous area sensors market is segmented into gas sensing, pressure sensing, current sensing, voltage sensing and temperature sensors.
The hazardeous area sensors market is also segmented on the basis of application into power, oil & gas, mining & metal, grain storage, healthcare, chemical, pharmaceutical, waste & sewage management, fertilizer and others.
Hazardeous Area Sensors Market Scope Country Level Analysis
Hazardeous area sensors market is analysed and market size, volume information is provided by country, type and application as referenced above.
The countries covered in the hazardeous area sensors market report are U.S., Canada and Mexico in North America, Brazil, Argentina and Rest of South America as part of South America, Germany, Italy, U.K., France, Spain, Netherlands, Belgium, Switzerland, Turkey, Russia, Rest of Europe in Europe, Japan, China, India, South Korea, Australia, Singapore, Malaysia, Thailand, Indonesia, Philippines, Rest of Asia-Pacific (APAC) in the Asia-Pacific (APAC), Saudi Arabia, U.A.E, South Africa, Egypt, Israel, Rest of Middle East and Africa (MEA) as a part of Middle East and Africa (MEA).
Asia-Pacific dominates the hazardeous area sensors market due to rise in the technological advancements in lighting solutions, rise in the industrialization and rise in the research and development activities in this region.
The country section of the hazardeous area sensors market report also provides individual market impacting factors and changes in regulation in the market domestically that impacts the current and future trends of the market. Data points like down-stream and upstream value chain analysis, technical trends and porter's five forces analysis, case studies are some of the pointers used to forecast the market scenario for individual countries. Also, the presence and availability of global brands and their challenges faced due to large or scarce competition from local and domestic brands, impact of domestic tariffs and trade routes are considered while providing forecast analysis of the country data.
Competitive Landscape and Hazardeous Area Sensors Market Share Analysis
hazardeous area sensors market competitive landscape provides details by competitor. Details included are company overview, company financials, revenue generated, market potential, investment in research and development, new market initiatives, regional presence, company strengths and weaknesses, product launch, product width and breadth, application dominance. The above data points provided are only related to the companies’ focus related to hazardeous area sensors market.
The major players covered in hazardeous area sensors market report are PATLITE Corporation., Eaton., Siemens, ABB, R. STAHL AG, Rockwell Automation, Emerson Electric Co., NHP., Honeywell International Inc., WERMA Signaltechnik GmbH + Co., Quintex GmbH., Potter Electric Signal Company, LLC, PATLITE Corporation., FEDERAL SIGNAL CORPORATION, Eaton and E2s Warning Signals among other domestic and global players. Market share data is available for global, North America, Europe, Asia-Pacific (APAC), Middle East and Africa (MEA) and South America separately. DBMR analysts understand competitive strengths and provide competitive analysis for each competitor separately.
SKU-
Get online access to the report on the World's First Market Intelligence Cloud

- Interactive Data Analysis Dashboard
- Company Analysis Dashboard for high growth potential opportunities
- Research Analyst Access for customization & queries
- Competitor Analysis with Interactive dashboard
- Latest News, Updates & Trend analysis
- Harness the Power of Benchmark Analysis for Comprehensive Competitor Tracking
Table of Content
1 INTRODUCTION
1.1 OBJECTIVES OF THE STUDY
1.2 MARKET DEFINITION
1.3 OVERVIEW OF GLOBAL HAZARDEOUS AREA SENSORS MARKET
1.4 CURRENCY AND PRICING
1.5 LIMITATION
1.6 MARKETS COVERED
2 MARKET SEGMENTATION
2.1 KEY TAKEAWAYS
2.2 ARRIVING AT THE GLOBAL HAZARDEOUS AREA SENSORS MARKET
2.2.1 VENDOR POSITIONING GRID
2.2.2 TECHNOLOGY LIFE LINE CURVE
2.2.3 MARKET GUIDE
2.2.4 COMPANY POSITIONING GRID
2.2.5 MULTIVARIATE MODELLING
2.2.6 STANDARDS OF MEASUREMENT
2.2.7 TOP TO BOTTOM ANALYSIS
2.2.8 VENDOR SHARE ANALYSIS
2.2.9 DATA POINTS FROM KEY PRIMARY INTERVIEWS
2.2.10 DATA POINTS FROM KEY SECONDARY DATABASES
2.3 GLOBAL HAZARDEOUS AREA SENSORS MARKET: RESEARCH SNAPSHOT
2.4 ASSUMPTIONS
3 MARKET OVERVIEW
3.1 DRIVERS
3.2 RESTRAINTS
3.3 OPPORTUNITIES
3.4 CHALLENGES
4 EXECUTIVE SUMMARY
5 PREMIUM INSIGHTS
5.1 CASE STUDIES
6 IMPACT OF COVID-19 PANDEMIC ON THE GLOBAL HAZARDEOUS AREA SENSORS MARKET
6.1 ANALYSIS ON IMPACT OF COVID-19 ON THE MARKET
6.2 AFTERMATH OF COVIF-19 AND GOVERNMENT INITIATIVE TO BOOST THE MARKET
6.3 STRATEGIC DECISIONS FOR MANUFACTUERS AFTER COVID-19 TO GAIN COMPETITIVE MARKET SHARE
6.4 PRICE IMPACT
6.5 IMPACT ON DEMAND
6.6 IMPACT ON SUPPLY CHAIN
6.7 CONCLUSION
7 GLOBAL HAZARDEOUS AREA SENSORS MARKET, BY TYPE
7.1 OVERVIEW
7.2 PRESSURE SENSORS
7.2.1 SOLID-STATE PRESSURE SENSORS
7.2.2 STRAIN-GAUGE PRESSURE SENSORS
7.2.3 MICROMACHINED SILICON PRESSURE SENSORS
7.3 CURRENT SENSORS
7.3.1 CORED CURRENT SENSOR
7.3.2 CORELESS CURRENT SENSOR
7.4 GAS SENSORS
7.4.1 INFRARED GAS SENSORS
7.4.2 METAL OXIDE GAS SENSORS
7.4.3 INDOOR AIR QUALITY GAS SENSORS
7.4.4 ELECTROCHEMICAL GAS SENSORS
7.4.5 THERMAL CONDUCTIVITY GAS SENSORS
7.4.6 CATALYTIC PELLISTORS
7.5 VOLTAGE SENSORS
7.5.1 CAPACITIVE VOLTAGE SENSOR
7.5.2 RESISTIVE VOLTAGE SENSOR
7.6 TEMPERATURE SENSORS
7.6.1 INFRARED SENSORS
7.6.2 CHANGE-OG-STATE SENSORS
7.6.3 BIMETALLIC SENSORS
7.6.4 THERMOCOUPLES
8 GLOBAL HAZARDEOUS AREA SENSORS MARKET, BY CLASSIFICATION
8.1 OVERVIEW
8.2 FREQUENCY RANGE
8.3 SENSITIVITY
8.4 MEASUREMENT RANGE
8.5 WEIGHT
8.6 SENSING ELEMENT
9 GLOBAL HAZARDEOUS AREA SENSORS MARKET, BY CONNECTIVITY SERVICE
9.1 OVERVIEW
9.2 WIRED CONNECTIVITY SERVICE
9.3 WIRELESS CONNECTIVITY SERVICE
10 GLOBAL HAZARDEOUS AREA SENSORS MARKET, BY FEATURES
10.1 OVERVIEW
10.2 MONITORING & CONTROLLING
10.3 POSITION DETERMINATION
10.4 NETWORKING & INTEGRATION
10.5 DETECTING
10.6 INDENTIFYING
10.7 MEASURING
10.8 PROTECTING
11 GLOBAL HAZARDEOUS AREA SENSORS MARKET, BY END-USER
11.1 OVERVIEW
11.2 OIL & GAS
11.3 POWER & ENERGY
11.4 HEALTHCARE
11.5 CHEMICALS
11.6 PHARMACEUTICAL
11.7 WASTEWATER TREATMENT
11.8 MINING & METALS
11.9 GRAIN STORAGE
11.1 OTHERS
12 GLOBAL HAZARDEOUS AREA SENSORS MARKET, BY REGION
12.1 GLOBAL HAZARDEOUS AREA SENSORS MARKET, (ALL SEGMENTATION PROVIDED ABOVE IS REPRESENTED IN THIS CHAPTER BY COUNTRY)
12.2 NORTH AMERICA
12.2.1 U.S.
12.2.2 CANADA
12.2.3 MEXICO
12.3 EUROPE
12.3.1 GERMANY
12.3.2 FRANCE
12.3.3 U.K.
12.3.4 ITALY
12.3.5 SPAIN
12.3.6 RUSSIA
12.3.7 TURKEY
12.3.8 BELGIUM
12.3.9 NETHERLANDS
12.3.10 SWITZERLAND
12.3.11 REST OF EUROPE
12.4 ASIA PACIFIC
12.4.1 JAPAN
12.4.2 CHINA
12.4.3 SOUTH KOREA
12.4.4 INDIA
12.4.5 AUSTRALIA
12.4.6 SINGAPORE
12.4.7 THAILAND
12.4.8 MALAYSIA
12.4.9 INDONESIA
12.4.10 PHILIPPINES
12.4.11 REST OF ASIA PACIFIC
12.5 SOUTH AMERICA
12.5.1 BRAZIL
12.5.2 ARGENTINA
12.5.3 REST OF SOUTH AMERICA
12.6 MIDDLE EAST AND AFRICA
12.6.1 SOUTH AFRICA
12.6.2 EGYPT
12.6.3 SAUDI ARABIA
12.6.4 U.A.E
12.6.5 ISRAEL
12.6.6 REST OF MIDDLE EAST AND AFRICA
13 GLOBAL HAZARDEOUS AREA SENSORS MARKET,COMPANY LANDSCAPE
13.1 COMPANY SHARE ANALYSIS: GLOBAL
13.2 COMPANY SHARE ANALYSIS: NORTH AMERICA
13.3 COMPANY SHARE ANALYSIS: EUROPE
13.4 COMPANY SHARE ANALYSIS: ASIA-PACIFIC
14 GLOBAL HAZARDEOUS AREA SENSORS MARKET, SWOT AND DBMR ANALYSIS
15 GLOBAL HAZARDEOUS AREA SENSORS MARKET, COMPANY PROFILE
15.1 SIEMENS AG
15.1.1 COMPANY SNAPSHOT
15.1.2 REVENUE ANALYSIS
15.1.3 GEOGRAPHIC PRESENCE
15.1.4 PRODUCT PORTFOLIO
15.1.5 RECENT DEVELOPMENTS
15.2 HONEYWELL INTERNATIONAL
15.2.1 COMPANY SNAPSHOT
15.2.2 REVENUE ANALYSIS
15.2.3 GEOGRAPHIC PRESENCE
15.2.4 PRODUCT PORTFOLIO
15.2.5 RECENT DEVELOPMENTS
15.3 YOKOGAWA ELECTRIC CORPORATION
15.3.1 COMPANY SNAPSHOT
15.3.2 REVENUE ANALYSIS
15.3.3 GEOGRAPHIC PRESENCE
15.3.4 PRODUCT PORTFOLIO
15.3.5 RECENT DEVELOPMENTS
15.4 ABB LTD
15.4.1 COMPANY SNAPSHOT
15.4.2 REVENUE ANALYSIS
15.4.3 GEOGRAPHIC PRESENCE
15.4.4 PRODUCT PORTFOLIO
15.4.5 RECENT DEVELOPMENTS
15.5 EATON CORPORATION
15.5.1 COMPANY SNAPSHOT
15.5.2 REVENUE ANALYSIS
15.5.3 GEOGRAPHIC PRESENCE
15.5.4 PRODUCT PORTFOLIO
15.5.5 RECENT DEVELOPMENTS
15.6 NEO MONITORS AS
15.6.1 COMPANY SNAPSHOT
15.6.2 REVENUE ANALYSIS
15.6.3 GEOGRAPHIC PRESENCE
15.6.4 PRODUCT PORTFOLIO
15.6.5 RECENT DEVELOPMENTS
15.7 SICK AG
15.7.1 COMPANY SNAPSHOT
15.7.2 REVENUE ANALYSIS
15.7.3 GEOGRAPHIC PRESENCE
15.7.4 PRODUCT PORTFOLIO
15.7.5 RECENT DEVELOPMENTS
15.8 METTLER-TOLEDO INTERNATIONAL
15.8.1 COMPANY SNAPSHOT
15.8.2 REVENUE ANALYSIS
15.8.3 GEOGRAPHIC PRESENCE
15.8.4 PRODUCT PORTFOLIO
15.8.5 RECENT DEVELOPMENTS
15.9 SERVOMEX GROUP LTD
15.9.1 COMPANY SNAPSHOT
15.9.2 REVENUE ANALYSIS
15.9.3 GEOGRAPHIC PRESENCE
15.9.4 PRODUCT PORTFOLIO
15.9.5 RECENT DEVELOPMENTS
15.1 ENDRESS+HAUSER
15.10.1 COMPANY SNAPSHOT
15.10.2 REVENUE ANALYSIS
15.10.3 GEOGRAPHIC PRESENCE
15.10.4 PRODUCT PORTFOLIO
15.10.5 RECENT DEVELOPMENTS
15.11 DEETER ELECTRONICS
15.11.1 COMPANY SNAPSHOT
15.11.2 REVENUE ANALYSIS
15.11.3 GEOGRAPHIC PRESENCE
15.11.4 PRODUCT PORTFOLIO
15.11.5 RECENT DEVELOPMENTS
15.12 AUTOMATION PRODUCTS GROUP
15.12.1 COMPANY SNAPSHOT
15.12.2 REVENUE ANALYSIS
15.12.3 GEOGRAPHIC PRESENCE
15.12.4 PRODUCT PORTFOLIO
15.12.5 RECENT DEVELOPMENTS
15.13 ESI TECHNOLOGY
15.13.1 COMPANY SNAPSHOT
15.13.2 REVENUE ANALYSIS
15.13.3 GEOGRAPHIC PRESENCE
15.13.4 PRODUCT PORTFOLIO
15.13.5 RECENT DEVELOPMENTS
15.14 MTS SENSORS
15.14.1 COMPANY SNAPSHOT
15.14.2 REVENUE ANALYSIS
15.14.3 GEOGRAPHIC PRESENCE
15.14.4 PRODUCT PORTFOLIO
15.14.5 RECENT DEVELOPMENTS
15.15 CONNECTION TECHNOLOGY CENTER
15.15.1 COMPANY SNAPSHOT
15.15.2 REVENUE ANALYSIS
15.15.3 GEOGRAPHIC PRESENCE
15.15.4 PRODUCT PORTFOLIO
15.15.5 RECENT DEVELOPMENTS
15.16 WILCOXON SENSING TECHNOLOGIES
15.16.1 COMPANY SNAPSHOT
15.16.2 REVENUE ANALYSIS
15.16.3 GEOGRAPHIC PRESENCE
15.16.4 PRODUCT PORTFOLIO
15.16.5 RECENT DEVELOPMENTS
15.17 EX ENGINEERING
15.17.1 COMPANY SNAPSHOT
15.17.2 REVENUE ANALYSIS
15.17.3 GEOGRAPHIC PRESENCE
15.17.4 PRODUCT PORTFOLIO
15.17.5 RECENT DEVELOPMENTS
15.18 PYROSALES
15.18.1 COMPANY SNAPSHOT
15.18.2 REVENUE ANALYSIS
15.18.3 GEOGRAPHIC PRESENCE
15.18.4 PRODUCT PORTFOLIO
15.18.5 RECENT DEVELOPMENTS
15.19 NEO MONITORS
15.19.1 COMPANY SNAPSHOT
15.19.2 REVENUE ANALYSIS
15.19.3 GEOGRAPHIC PRESENCE
15.19.4 PRODUCT PORTFOLIO
15.19.5 RECENT DEVELOPMENTS
15.2 STANDEX ELECTRONICS
15.20.1 COMPANY SNAPSHOT
15.20.2 REVENUE ANALYSIS
15.20.3 GEOGRAPHIC PRESENCE
15.20.4 PRODUCT PORTFOLIO
15.20.5 RECENT DEVELOPMENTS
15.21 BANNER ENGINEERING CORP
15.21.1 COMPANY SNAPSHOT
15.21.2 REVENUE ANALYSIS
15.21.3 GEOGRAPHIC PRESENCE
15.21.4 PRODUCT PORTFOLIO
15.21.5 RECENT DEVELOPMENTS
15.22 BALLUFF GMBH
15.22.1 COMPANY SNAPSHOT
15.22.2 REVENUE ANALYSIS
15.22.3 GEOGRAPHIC PRESENCE
15.22.4 PRODUCT PORTFOLIO
15.22.5 RECENT DEVELOPMENTS
16 CONCLUSION
17 QUESTIONNAIRE
18 RELATED REPORTS
19 ABOUT DATA BRIDGE MARKET RESEARCH
Research Methodology
Data collection and base year analysis are done using data collection modules with large sample sizes. The stage includes obtaining market information or related data through various sources and strategies. It includes examining and planning all the data acquired from the past in advance. It likewise envelops the examination of information inconsistencies seen across different information sources. The market data is analysed and estimated using market statistical and coherent models. Also, market share analysis and key trend analysis are the major success factors in the market report. To know more, please request an analyst call or drop down your inquiry.
The key research methodology used by DBMR research team is data triangulation which involves data mining, analysis of the impact of data variables on the market and primary (industry expert) validation. Data models include Vendor Positioning Grid, Market Time Line Analysis, Market Overview and Guide, Company Positioning Grid, Patent Analysis, Pricing Analysis, Company Market Share Analysis, Standards of Measurement, Global versus Regional and Vendor Share Analysis. To know more about the research methodology, drop in an inquiry to speak to our industry experts.
Customization Available
Data Bridge Market Research is a leader in advanced formative research. We take pride in servicing our existing and new customers with data and analysis that match and suits their goal. The report can be customized to include price trend analysis of target brands understanding the market for additional countries (ask for the list of countries), clinical trial results data, literature review, refurbished market and product base analysis. Market analysis of target competitors can be analyzed from technology-based analysis to market portfolio strategies. We can add as many competitors that you require data about in the format and data style you are looking for. Our team of analysts can also provide you data in crude raw excel files pivot tables (Fact book) or can assist you in creating presentations from the data sets available in the report.

