Market Analysis and Insights Global Feed Phosphates Market
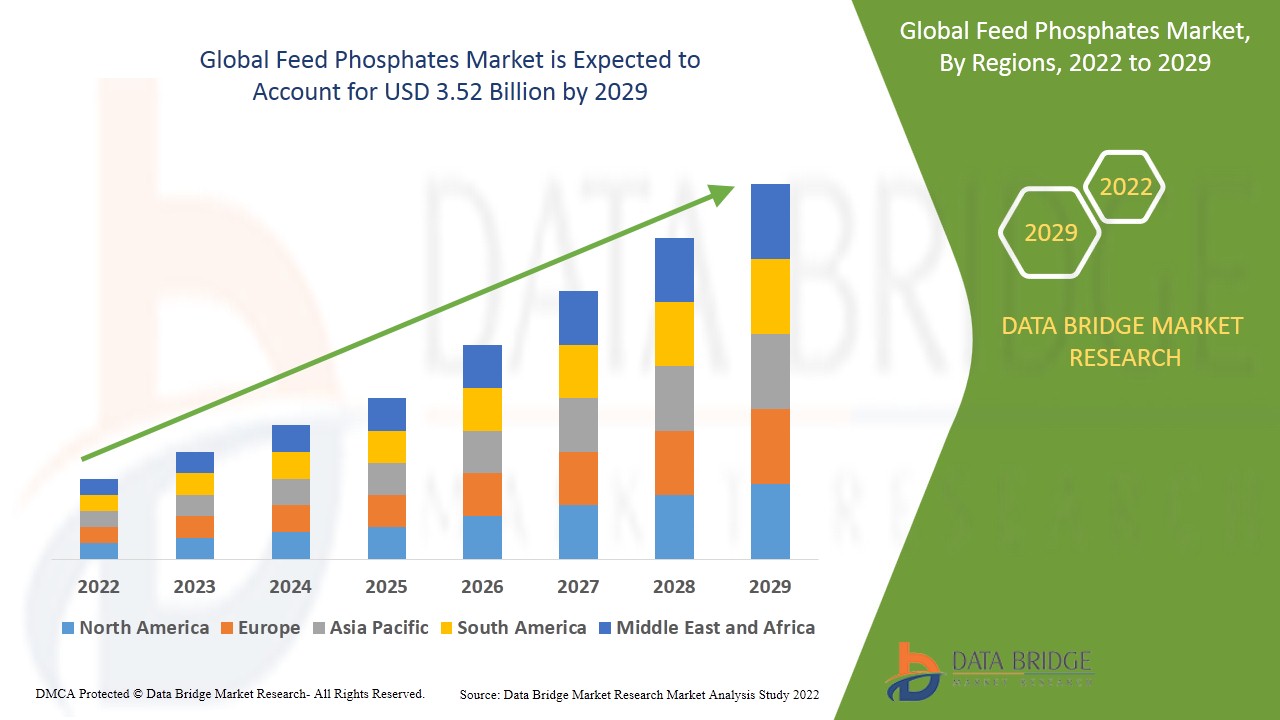
Data Bridge Market Research analyses that the feed phosphates market will project a compound annual growth rate (CAGR) of 4.30% during the forecast period of 2022-2029 and is likely to reach the USD 3.52 billion by 2029.
Phosphorous is a micronutrient required by practically all living organisms for proper growth and development in a reasonable amount of time. Phosphorus is delivered to animals in the form of feed phosphates in animal feed. Feed phosphates are inorganic salts of phosphoric acid that are used to supplement an animal's diet with phosphorus to guarantee optimal growth, performance, fertility, and bone development. Phosphates in animal feed boost laying capacity and help to avoid disease, hence they're commonly utilized in animal feed.
The rising threat of diseases in livestock and increasing prevalence of favourable regulatory norms will influence the revenue growth of feed phosphates market. The upsurge in the demand of meat and dairy products will accelerate the market’s growth. Rapid urbanization and increasing level of disposable income of people are the significant market drivers that will further flourish the growth rate. Furthermore, increase in the demand for poultry production will bolster the growth rate of feed phosphates market. Other factors such as changing food preference and increase in the number of population will positively impact the growth rate of feed phosphates market. Another significant factor includes upsurge in the demand for meat-based products and swift industrialization will act as a key trend that will further cushion the market’s growth rate.
Moreover, the development of high quality and new raw material and emerging new markets will further create lucrative and remunerative growth opportunities for the feed phosphates market during the forecast period 2022-2029. Additionally, increase in technological innovations and strong demand from various end-use industries will further propel the new growth opportunities in the future year.
However, fluctuating prices of raw material and availability of product alternatives will derail the feed phosphates market’s growth rate. Also, the lack of phosphate reserves globally and toxicity of feed phosphates will pose major challenges to the growth of the market. The negative impact of COVID-19 on supply chain and growing environmental concerns will act as major market restrain and further hinder the growth rate of feed phosphates market.
This feed phosphates market report provides details of new recent developments, trade regulations, import export analysis, production analysis, value chain optimization, market share, impact of domestic and localised market players, analyses opportunities in terms of emerging revenue pockets, changes in market regulations, strategic market growth analysis, market size, category market growths, application niches and dominance, product approvals, product launches, geographic expansions, technological innovations in the market. To gain more info on feed phosphates market contact Data Bridge Market Research for an Analyst Brief, our team will help you take an informed market decision to achieve market growth.
Global Feed Phosphates Market Scope and Market Size
The feed phosphates market is segmented on the basis of type, livestock, and form. The growth among segments helps you analyse niche pockets of growth and strategies to approach the market and determine your core application areas and the difference in your target markets.
- On the basis of type, the feed phosphates market is segmented into calcium phosphate, sodium phosphate, ammonium phosphate and others. The segment of calcium phosphate is further sub-segmented into dicalcium phosphate, monocalcium phosphate, mono-dicalcium phosphate, defluorinated phosphate, and tricalcium phosphate.
- Based on livestock, the feed phosphates market is segmented into poultry, swine, ruminants, aquaculture, and others.
- Based on the form, the feed phosphates market is segmented into powder, and granule.
Feed Phosphates Market Country Level Analysis
The global feed phosphates market is analyses and market size, volume information is provided by country, type, livestock, and form as referenced above.
The countries covered in the feed phosphates market report are U.S., Canada, Mexico in North America, Germany, Poland, Ireland, Italy, U.K., France, Spain, Netherlands, Belgium, Switzerland, Turkey, Russia, Rest of Europe in Europe, Japan, China, India, South Korea, New Zealand, Vietnam, Australia, Singapore, Malaysia, Thailand, Indonesia, Philippines, Rest of Asia-Pacific (APAC) in Asia-Pacific (APAC), Brazil, Argentina, Chile, Rest of South America as a part of South America, UAE, Saudi Arabia, Egypt, Kuwait, South Africa, Rest of Middle East and Africa(MEA) as a part of Middle East and Africa(MEA).
North America dominates the feed phosphates market and will continue to flourish its trend of dominance during the forecast period owing to the increasing consumption of meat products and presence of favorable regulatory norms in this region. Asia-Pacific is expected to grow during the forecast period of 2022-2029 due to the increasing level of disposable income, rising number of population and high consumption of meat as well as meat products in this region.
The country section of the feed phosphates market report also provides individual market impacting factors and changes in regulation in the market domestically that impacts the current and future trends of the market. Data points such as consumption volumes, production sites and volumes, import export analysis, price trend analysis, cost of raw materials, down-stream and upstream value chain analysis are some of the major pointers used to forecast the market scenario for individual countries. Also, presence and availability of global brands and their challenges faced due to large or scarce competition from local and domestic brands, impact of domestic tariffs and trade routes are considered while providing forecast analysis of the country data.
Competitive Landscape and Global Feed Phosphates Market Share Analysis
The feed phosphates market competitive landscape provides details by competitor. Details included are company overview, company financials, revenue generated, market potential, investment in research and development, new market initiatives, global presence, production sites and facilities, production capacities, company strengths and weaknesses, product launch, product width and breadth, application dominance. The above data points provided are only related to the companies’ focus related to feed phosphates market.
Some of the major players operating in the feed phosphates market are Mosaic, Nutrien Ltd., OCP, Yara, EuroChem Group, PhosAgro Group of Companies, Groupe Roullier, Ecophos Group, FOSFITALIA GROUP, J.R. Simplot Company, Quimpac S.A.,Wengfu Australia Pty Ltd., De Heus Animal Nutrition, Ma’aden, SINOCHEM YUNLONG CO.,LTD, and AG CHEMI GROUP s.r.o., among others.
SKU-
Get online access to the report on the World's First Market Intelligence Cloud

- Interactive Data Analysis Dashboard
- Company Analysis Dashboard for high growth potential opportunities
- Research Analyst Access for customization & queries
- Competitor Analysis with Interactive dashboard
- Latest News, Updates & Trend analysis
- Harness the Power of Benchmark Analysis for Comprehensive Competitor Tracking
Table of Content
1 INTRODUCTION
1.1 OBJECTIVES OF THE STUDY
1.2 MARKET DEFINITION
1.3 OVERVIEW OF GLOBAL FEED PHOSPHATES MARKET
1.4 CURRENCY AND PRICING
1.5 LIMITATION
1.6 MARKETS COVERED
2 MARKET SEGMENTATION
2.1 KEY TAKEAWAYS
2.2 ARRIVING AT THE GLOBAL FEED PHOSPHATES MARKET SIZE
2.2.1 VENDOR POSITIONING GRID
2.2.2 TECHNOLOGY LIFE LINE CURVE
2.2.3 MARKET GUIDE
2.2.4 COMPANY POSITIONING GRID
2.2.5 COMAPANY MARKET SHARE ANALYSIS
2.2.6 MULTIVARIATE MODELLING
2.2.7 DEMAND AND SUPPLY-SIDE VARIABLES
2.2.8 CONSUMPTION TREND OF END PRODUCTS
2.2.9 TOP TO BOTTOM ANALYSIS
2.2.10 STANDARDS OF MEASUREMENT
2.2.11 VENDOR SHARE ANALYSIS
2.2.12 DATA POINTS FROM KEY PRIMARY INTERVIEWS
2.2.13 DATA POINTS FROM KEY SECONDARY DATABASES
2.3 GLOBAL PALATANTS FOR FEED PHOSPHATES MARKET: RESEARCH SNAPSHOT
2.4 ASSUMPTIONS
3 MARKET OVERVIEW
3.1 DRIVERS
3.2 RESTRAINTS
3.3 OPPORTUNITIES
3.4 CHALLENGES
4 EXECUTIVE SUMMARY
5 PREMIUM INSIGHTS
5.1 VALUE CHAIN ANALYSIS
5.2 SUPPLY CHAIN ANALYSIS
5.3 PORTER’S FIVE FORCES ANALYSIS
5.3.1 BARGAINING POWER OF SUPPLIERS
5.3.2 BARGAINING POWER OF BUYERS/CONSUMERS
5.3.3 THREAT OF NEW ENTRANTS
5.3.4 THREAT OF SUBSTITUTE PRODUCTS
5.3.5 INTENSITY OF COMPETITIVE RIVALRY
5.4 GROWTH STRATEGIES ADOPTED BY KEY MARKET PLAYERS
5.5 OVERVIEW OF TECHNOLOGICAL INNOVATIONS
5.6 INDUSTRY TRENDS AND FUTURE PERSPECTIVE
5.7 FACTORS INFLUENCING PURCHASING DECISION OF END-USERS
6 REGULATORY FRAMEWORK AND GUIDELINES
7 GLOBAL FEED PHOSPHATES MARKET, BY TYPE
7.1 OVERVIEW
7.2 CALCIUM PHOSPHATE
7.2.1 CALCIUM PHOSPHATE, BY TYPE
7.2.1.1. MONOCALCIUM PHOSPHATE (MCP)
7.2.1.2. DICALCIUM PHOSPHATE (DCP)
7.2.1.3. OTHERS (IF ANY)
7.2.2 CALCIUM PHOSPHATE, BY FORM
7.2.2.1. DRY
7.2.2.2. LIQUID
7.2.2.3. SODIUM PHOSPHATE
7.2.3 SODIUM PHOSPHATE, BY FORM
7.2.3.1. DRY
7.2.3.2. LIQUID
7.2.3.3. AMMONIUM PHOSPHATE
7.2.4 AMMONIUM PHOSPHATE, BY FORM
7.2.4.1. DRY
7.2.4.2. LIQUID
7.2.4.3. MAGNESIUM PHOSPHATE
7.2.5 MAGNESIUM PHOSPHATE, BY FORM
7.2.5.1. DRY
7.2.5.2. LIQUID
7.2.5.3. OTHERS
8 GLOBAL FEED PHOSPHATES MARKET, BY FORM
8.1 OVERVIEW
8.2 DRY
8.2.1 DRY, BY TYPE
8.2.1.1. POWDER
8.2.1.2. GRANULE
8.2.1.3. OTHERS (IF ANY)
8.3 LIQUID
9 GLOBAL FEED PHOSPHATES MARKET, BY LIVESTOCK
9.1 OVERVIEW
9.2 RUMINANTS
9.2.1 RUMINANTS, BY PHOSPHATE TYPE
9.2.1.1. CALCIUM PHOSPHATE
9.2.1.2. SODIUM PHOSPHATE
9.2.1.3. AMMONIUM PHOSPHATE
9.2.1.4. MAGNESIUM PHOSPHATE
9.2.1.5. OTHERS
9.3 SWINE
9.3.1 SWINE, BY PHOSPHATE TYPE
9.3.1.1. CALCIUM PHOSPHATE
9.3.1.2. SODIUM PHOSPHATE
9.3.1.3. AMMONIUM PHOSPHATE
9.3.1.4. MAGNESIUM PHOSPHATE
9.3.1.5. OTHERS
9.4 POLUTRY
9.4.1 POLUTRY, BY PHOSPHATE TYPE
9.4.1.1. CALCIUM PHOSPHATE
9.4.1.2. SODIUM PHOSPHATE
9.4.1.3. AMMONIUM PHOSPHATE
9.4.1.4. MAGNESIUM PHOSPHATE
9.4.1.5. OTHERS
9.5 AQUACULTURE
9.5.1 AQUACULTURE, BY PHOSPHATE TYPE
9.5.1.1. CALCIUM PHOSPHATE
9.5.1.2. SODIUM PHOSPHATE
9.5.1.3. AMMONIUM PHOSPHATE
9.5.1.4. MAGNESIUM PHOSPHATE
9.5.1.5. OTHERS
9.6 OTHERS
10 GLOBAL FEED PHOSPHATES MARKET, BY DISTRIBUTION CHANNEL
10.1 OVERVIEW
10.2 DIRECT
10.3 INDIRECT
11 GLOBAL FEED PHOSPHATES MARKET, BY COUNTRY
11.1 GLOBAL FEED PHOSPHATES MARKET, (ALL SEGMENTATION PROVIDED ABOVE IS REPRESENTED IN THIS CHAPTER BY COUNTRY)
11.2 NORTH AMERICA
11.2.1 U.S.
11.2.2 CANADA
11.2.3 MEXICO
11.3 EUROPE
11.3.1 GERMANY
11.3.2 U.K.
11.3.3 ITALY
11.3.4 FRANCE
11.3.5 SPAIN
11.3.6 SWITZERLAND
11.3.7 NETHERLANDS
11.3.8 BELGIUM
11.3.9 RUSSIA
11.3.10 DENMARK
11.3.11 SWEDEN
11.3.12 POLAND
11.3.13 TURKEY
11.3.14 REST OF EUROPE
11.4 ASIA-PACIFIC
11.4.1 JAPAN
11.4.2 CHINA
11.4.3 SOUTH KOREA
11.4.4 INDIA
11.4.5 AUSTRALIA
11.4.6 SINGAPORE
11.4.7 THAILAND
11.4.8 INDONESIA
11.4.9 MALAYSIA
11.4.10 PHILIPPINES
11.4.11 NEW ZEALAND
11.4.12 VIETNAM
11.4.13 REST OF ASIA-PACIFIC
11.5 SOUTH AMERICA
11.5.1 BRAZIL
11.5.2 ARGENTINA
11.5.3 REST OF SOUTH AMERICA
11.6 MIDDLE EAST AND AFRICA
11.6.1 SOUTH AFRICA
11.6.2 UAE
11.6.3 SAUDI ARABIA
11.6.4 OMAN
11.6.5 QATAR
11.6.6 KUWAIT
11.6.7 REST OF THE MIDDLE EAST AND AFRICA
12 GLOBAL FEED PHOSPHATES MARKET, COMPANY LANDSCAPE
12.1 COMPANY SHARE ANALYSIS: GLOBAL
12.2 COMPANY SHARE ANALYSIS: NORTH AMERICA
12.3 COMPANY SHARE ANALYSIS: EUROPE
12.4 COMPANY SHARE ANALYSIS: ASIA-PACIFIC
12.5 MERGERS & ACQUISITIONS
12.6 NEW PRODUCT DEVELOPMENT & APPROVALS
12.7 EXPANSIONS & PARTNERSHIP
12.8 REGULATORY CHANGES
13 GLOBAL FEED PHOSPHATES MARKET, SWOT & DBMR ANALYSIS
14 GLOBAL FEED PHOSPHATES MARKET, COMPANY PROFILE
14.1 MOSAIC COMPANY
14.1.1 COMPANY OVERVIEW
14.1.2 REVENUE ANALYSIS
14.1.3 GEOGRAPHIC PRESENCE
14.1.4 PRODUCT PORTFOLIO
14.1.5 RECENT DEVELOPMENTS
14.2 NUTRIEN LTD
14.2.1 COMPANY OVERVIEW
14.2.2 REVENUE ANALYSIS
14.2.3 GEOGRAPHIC PRESENCE
14.2.4 PRODUCT PORTFOLIO
14.2.5 RECENT DEVELOPMENTS
14.3 OCP GROUP
14.3.1 COMPANY OVERVIEW
14.3.2 REVENUE ANALYSIS
14.3.3 GEOGRAPHIC PRESENCE
14.3.4 PRODUCT PORTFOLIO
14.3.5 RECENT DEVELOPMENTS
14.4 YARA INTERNATIONAL SA
14.4.1 COMPANY OVERVIEW
14.4.2 REVENUE ANALYSIS
14.4.3 GEOGRAPHIC PRESENCE
14.4.4 PRODUCT PORTFOLIO
14.4.5 RECENT DEVELOPMENTS
14.5 EUROCHEM GROUP
14.5.1 COMPANY OVERVIEW
14.5.2 REVENUE ANALYSIS
14.5.3 GEOGRAPHIC PRESENCE
14.5.4 PRODUCT PORTFOLIO
14.5.5 RECENT DEVELOPMENTS
14.6 PHOSAGRO GROUP OF COMPANIES
14.6.1 COMPANY OVERVIEW
14.6.2 REVENUE ANALYSIS
14.6.3 PRODUCT PORTFOLIO
14.6.4 GEOGRAPHIC PRESENCE
14.6.5 RECENT DEVELOPMENTS
14.7 GROUPE ROULLIER
14.7.1 COMPANY OVERVIEW
14.7.2 REVENUE ANALYSIS
14.7.3 PRODUCT PORTFOLIO
14.7.4 GEOGRAPHIC PRESENCE
14.7.5 RECENT DEVELOPMENTS
14.8 ECOPHOS GROUP
14.8.1 COMPANY OVERVIEW
14.8.2 REVENUE ANALYSIS
14.8.3 PRODUCT PORTFOLIO
14.8.4 GEOGRAPHIC PRESENCE
14.8.5 RECENT DEVELOPMENTS
14.9 FOSFITALIA GROUP
14.9.1 COMPANY OVERVIEW
14.9.2 REVENUE ANALYSIS
14.9.3 PRODUCT PORTFOLIO
14.9.4 GEOGRAPHIC PRESENCE
14.9.5 RECENT DEVELOPMENTS
14.1 J.R. SIMPLOT COMPANY
14.10.1 COMPANY OVERVIEW
14.10.2 REVENUE ANALYSIS
14.10.3 PRODUCT PORTFOLIO
14.10.4 GEOGRAPHIC PRESENCE
14.10.5 RECENT DEVELOPMENTS
14.11 TIMAB INDUSTRIES
14.11.1 COMPANY OVERVIEW
14.11.2 REVENUE ANALYSIS
14.11.3 PRODUCT PORTFOLIO
14.11.4 GEOGRAPHIC PRESENCE
14.11.5 RECENT DEVELOPMENTS
14.12 PHOSAGRO
14.12.1 COMPANY OVERVIEW
14.12.2 REVENUE ANALYSIS
14.12.3 PRODUCT PORTFOLIO
14.12.4 GEOGRAPHIC PRESENCE
14.12.5 RECENT DEVELOPMENTS
14.13 AG CHEMI GROUP S.R.O.
14.13.1 COMPANY OVERVIEW
14.13.2 REVENUE ANALYSIS
14.13.3 PRODUCT PORTFOLIO
14.13.4 GEOGRAPHIC PRESENCE
14.13.5 RECENT DEVELOPMENTS
14.14 ELIXIR GROUP DOO
14.14.1 COMPANY OVERVIEW
14.14.2 REVENUE ANALYSIS
14.14.3 PRODUCT PORTFOLIO
14.14.4 GEOGRAPHIC PRESENCE
14.14.5 RECENT DEVELOPMENTS
14.15 BAFFEED
14.15.1 COMPANY OVERVIEW
14.15.2 REVENUE ANALYSIS
14.15.3 PRODUCT PORTFOLIO
14.15.4 GEOGRAPHIC PRESENCE
14.15.5 RECENT DEVELOPMENTS
14.16 R A ENTERPRISES
14.16.1 COMPANY OVERVIEW
14.16.2 REVENUE ANALYSIS
14.16.3 PRODUCT PORTFOLIO
14.16.4 GEOGRAPHIC PRESENCE
14.16.5 RECENT DEVELOPMENTS
14.17 SBF PHARMA
14.17.1 COMPANY OVERVIEW
14.17.2 REVENUE ANALYSIS
14.17.3 PRODUCT PORTFOLIO
14.17.4 GEOGRAPHIC PRESENCE
14.17.5 RECENT DEVELOPMENTS
14.18 YUNNAN PHOSPHORUS CHEMICALS GROUP CO., LTD
14.18.1 COMPANY OVERVIEW
14.18.2 REVENUE ANALYSIS
14.18.3 PRODUCT PORTFOLIO
14.18.4 GEOGRAPHIC PRESENCE
14.18.5 RECENT DEVELOPMENTS
14.19 HEBEI KANGDALI PHARMACEUTICAL CO., LTD
14.19.1 COMPANY OVERVIEW
14.19.2 REVENUE ANALYSIS
14.19.3 PRODUCT PORTFOLIO
14.19.4 GEOGRAPHIC PRESENCE
14.19.5 RECENT DEVELOPMENTS
14.2 ROTEM TURKEY
14.20.1 COMPANY OVERVIEW
14.20.2 REVENUE ANALYSIS
14.20.3 PRODUCT PORTFOLIO
14.20.4 GEOGRAPHIC PRESENCE
14.20.5 RECENT DEVELOPMENTS
*NOTE: THE COMPANIES PROFILED IS NOT EXHAUSTIVE LIST AND IS AS PER OUR PREVIOUS CLIENT REQUIREMENT. WE PROFILE MORE THAN 100 COMPANIES IN OUR STUDY AND HENCE THE LIST OF COMPANIES CAN BE MODIFIED OR REPLACED ON REQUEST RELATED REPORTS
15 RELATED REPORTS
16 QUESTIONNAIRE
17 ABOUT DATA BRIDGE MARKET RESEARCH
18 ABOUT DATA BRIDGE MARKET RESEARCH
Research Methodology
Data collection and base year analysis are done using data collection modules with large sample sizes. The stage includes obtaining market information or related data through various sources and strategies. It includes examining and planning all the data acquired from the past in advance. It likewise envelops the examination of information inconsistencies seen across different information sources. The market data is analysed and estimated using market statistical and coherent models. Also, market share analysis and key trend analysis are the major success factors in the market report. To know more, please request an analyst call or drop down your inquiry.
The key research methodology used by DBMR research team is data triangulation which involves data mining, analysis of the impact of data variables on the market and primary (industry expert) validation. Data models include Vendor Positioning Grid, Market Time Line Analysis, Market Overview and Guide, Company Positioning Grid, Patent Analysis, Pricing Analysis, Company Market Share Analysis, Standards of Measurement, Global versus Regional and Vendor Share Analysis. To know more about the research methodology, drop in an inquiry to speak to our industry experts.
Customization Available
Data Bridge Market Research is a leader in advanced formative research. We take pride in servicing our existing and new customers with data and analysis that match and suits their goal. The report can be customized to include price trend analysis of target brands understanding the market for additional countries (ask for the list of countries), clinical trial results data, literature review, refurbished market and product base analysis. Market analysis of target competitors can be analyzed from technology-based analysis to market portfolio strategies. We can add as many competitors that you require data about in the format and data style you are looking for. Our team of analysts can also provide you data in crude raw excel files pivot tables (Fact book) or can assist you in creating presentations from the data sets available in the report.

