Global Data Center Busway Market
Market Size in USD Billion
CAGR :
%

![]() |
2025 –2032 |
![]() |
USD 2.50 Billion |
![]() |
USD 4.84 Billion |
![]() |
|
![]() |
Global Data Center Busway Market Segmentation, By Product Type (Air Splicing Busway (BMC), Intensive Insulation Plug Busway (CMC), High Strength Enclosed Busway (CFW), Power Distribution Units (PDUs), and Others), Type (3-Phase 4-Wire, 3-Phase 5-Wire, and Others), Implementation (Raised Floor and Ceiling Overhead), Data Center Type (Mid-sized & Enterprise Data Center and Large Data Center), Current Ampere (Low and High), Vertical (Banking, Financial Services and Insurance (BFSI), IT & Telecom, Government & Defence, Healthcare, Retail & E-commerce, Research & Academia, Energy & Utilities, Manufacturing, and Others)- Industry Trends and Forecast to 2032.
Data Center Busway Market Size
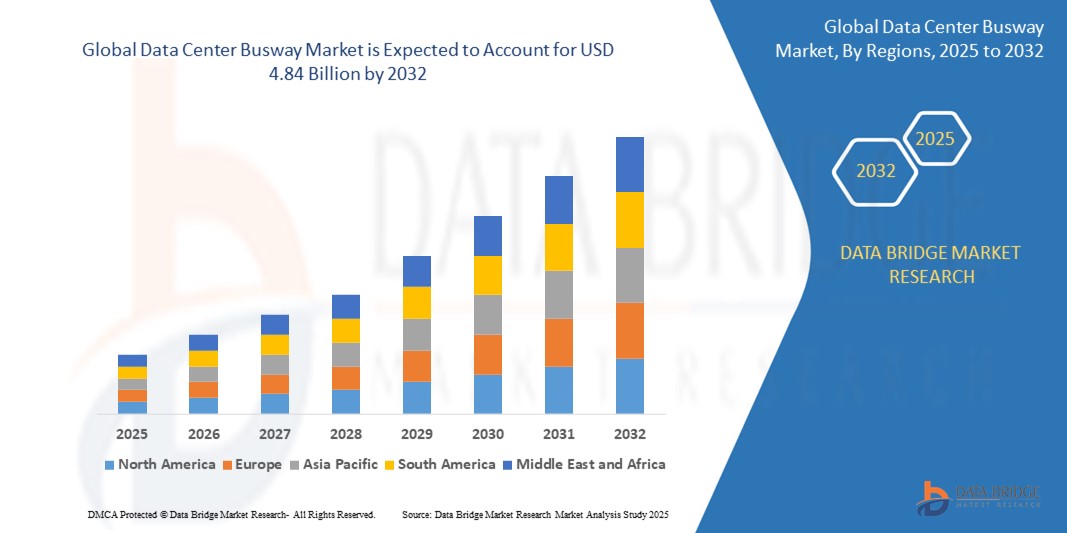
- The global data center busway market was valued at USD 2.50 billion in 2024 and is expected to reach USD 4.84 billion by 2032
- During the forecast period of 2025 to 2032 the market is likely to grow at a CAGR of 8.60% primarily driven by the rising demand for energy-efficient and scalable power distribution solutions
- This growth is driven by factors such as the increasing adoption of cloud computing, rapid expansion of data centers, and growing emphasis on modular infrastructure
Data Center Busway Market Analysis
- The data center busway market is steadily growing due to the increasing need for flexible and reliable power distribution in modern IT infrastructures
- For instance, Equinix expanded its SG5 data center in Singapore in 2024 using advanced busway systems, and Digital Realty integrated similar solutions in its new data center campus in Osaka to support high-capacity power loads
- The shift toward modular and scalable data center designs is driving the adoption of busway systems; for instance, Microsoft’s 2023 data center in Cheyenne, Wyoming, implemented modular busways to enable rapid expansion, and Facebook’s Clonee data center in Ireland used busways to minimize downtime during infrastructure upgrades
- Busways are being preferred over traditional cabling because they reduce cable congestion and improve airflow management in high-density environments
- For instance, Amazon Web Services used Starline Track Busway systems in its 2023 Frankfurt facility, and Alibaba Cloud adopted similar technology in its Singapore operations to optimize energy efficiency
- Manufacturers such as Schneider Electric and Siemens are introducing next-generation busway solutions focused on safety, flexibility, and ease of installation
- For instance, Schneider Electric launched the I-Line Busway System in 2024, and Siemens introduced its SIVACON 8PS series to support green data center initiatives and compact layouts
- As the global digital economy continues to expand, businesses are investing in data centers with advanced power infrastructure to ensure performance and efficiency
Report Scope and Data Center Busway Market Segmentation
Attributes |
Data Center Busway Key Market Insights |
Segments Covered |
|
Countries Covered |
North America
Europe
Asia-Pacific
Middle East and Africa
South America
|
Key Market Players |
|
Market Opportunities |
|
Value Added Data Infosets |
In addition to the market insights such as market value, growth rate, market segments, geographical coverage, market players, and market scenario, the market report curated by the Data Bridge Market Research team includes in-depth expert analysis, import/export analysis, pricing analysis, production consumption analysis, and pestle analysis. |
Data Center Busway Market Trends
“Rising Preference for Plug-and-Play Power Distribution Systems”
- Plug-and-play power distribution systems are gaining popularity in data centers for their quick installation and minimal need for complex wiring
- For instance, Digital Realty integrated plug-and-play busway solutions in its Singapore facility to accelerate deployment timelines
- These systems support rapid scalability, allowing data centers to expand or reconfigure power layouts without major downtime
- For instance, Microsoft’s modular data center in Sweden used plug-and-play components to enable seamless upgrades as demand increased
- The modular nature of plug-and-play busways enables hot-swapping, where power units can be added or removed without interrupting ongoing operations, making them ideal for environments that demand high uptime and flexibility
- Data centers benefit from reduced installation time and labor costs when using plug-and-play systems, which is especially valuable during time-sensitive expansions or build-outs
- Many leading manufacturers such as Starline and Schneider Electric are offering advanced plug-and-play busway solutions with integrated safety features and smart monitoring, aligning with the growing demand for user-friendly and efficient power infrastructure in large-scale data centers
Data Center Busway Market Dynamics
Driver
“Growing Demand for Scalable and Energy-Efficient Power Distribution”
- The growing demand for scalable and energy-efficient power distribution is a major driver of the data center busway market, as organizations require flexible infrastructure to meet evolving digital workloads
- Traditional cabling systems often lack the scalability and installation efficiency needed for modern operations, which is why modular busway systems are being adopted for faster, cost-effective power distribution
- For instance, Amazon Web Services in 2023 expanded its data center footprint in Northern Virginia using modular infrastructure, including busway systems, to speed up deployment while optimizing energy efficiency
- Busway systems help reduce cable congestion, enhance airflow, and improve cooling efficiency, which supports sustainability efforts and cuts operational costs
- For instance, Microsoft’s Sweden data center uses streamlined busway systems to maintain sustainable power flow while supporting growing cloud demands
- Major technology providers are now prioritizing power solutions that can scale quickly and reduce downtime, making busway systems a preferred option for hyperscale and enterprise-level data centers
Opportunity
“Integration of Smart Monitoring and IoT in Busway Systems”
- The integration of smart monitoring technologies and Internet of Things-based features is emerging as a key opportunity in the data center busway market, as operators aim for more intelligent and efficient infrastructure
- Smart busway systems enable real-time monitoring of energy usage, fault detection, and predictive maintenance, making data centers more reliable and responsive to issues
- For instance, Starline offers busway solutions with built-in energy monitoring at tap-off points, allowing data center managers to track power loads remotely and detect abnormalities before they cause failures
- These advanced systems support predictive maintenance by analyzing historical and live data, helping to avoid unexpected outages and optimize resource use
- For instance, Vertiv’s smart power monitoring solutions are being used in colocation centers to improve uptime and energy performance
- As digital transformation continues across sectors, the demand for smart, connected infrastructure grows, creating opportunities for vendors to innovate with Internet of Things-enabled busways that support long-term operational and sustainability goals
Restraint/Challenge
“High Initial Cost and Complex Customization Requirements”
- One of the main challenges in adopting data center busway systems is their high initial cost, which includes equipment, specialized installation, and detailed engineering design that can strain the budgets of small to mid-sized enterprises
- The requirement for custom layouts based on power density, architecture, and operational goals makes these systems complex to design and deploy, especially for facilities that require tailored configurations
- For instance, the deployment of a customized busway in a tier-4 data center operated by Equinix in Singapore involved precision engineering and high-end components to ensure zero downtime and full fault tolerance
- Retrofitting existing data centers presents additional complications due to space limitations and the need to maintain uninterrupted services
- For instance, when a financial institution in London upgraded its legacy facility with busway systems, installation had to be done in phases during off-peak hours to avoid service disruptions
- Although busway systems provide long-term efficiency and maintenance benefits, their steep upfront investment and design complexity continue to act as major restraints for budget-conscious or smaller-scale operations
Data Center Busway Market Scope
The market is segmented on the basis of product type, type, implementation, data center type, current ampere, and vertical
Segmentation |
Sub-Segmentation |
By Product Type |
|
By Type |
|
By Implementation |
|
By Data Center Type |
|
By Current Ampere |
|
By Vertical |
|
Data Center Busway Market Regional Analysis
“North America is the Dominant Region in the Data Center Busway Market”
- North America dominates the data center busway market due to its advanced technological infrastructure and widespread adoption of cutting-edge digital solutions
- The U.S. significantly contributes to this dominance as tech giants and cloud service providers continue expanding large-scale data centers to manage growing data volumes
- This expansion demands scalable and efficient power distribution systems such as busways, which offer modularity, flexibility, and reduced installation complexity
- The region places strong emphasis on energy efficiency and sustainability, leading to higher adoption of busway systems that optimize airflow and reduce cooling and energy costs
- Continuous investment in innovation, green energy practices, and rapid deployment of digital platforms further strengthens North America's leading position in the market
“Asia-Pacific is Projected to Register the Highest Growth Rate”
- The Asia-Pacific region is the fastest-growing market for data center busway systems due to rapid digital transformation and rising investments in IT infrastructure
- Countries such as China, India, and Japan are leading this growth, with increasing demand for data storage and processing driving the expansion of data centers
- In China, for instance, government initiatives focused on artificial intelligence and big data have accelerated the adoption of busway systems to support scalable power distribution in expanding facilities
- India’s fast-growing digital economy and surge in cloud computing services are prompting the development of new, modern data centers requiring efficient and flexible power infrastructure
- This widespread construction and modernization across Asia-Pacific highlights the essential role of busway systems in ensuring operational efficiency, energy savings, and future-ready scalability
Data Center Busway Market Share
The market competitive landscape provides details by competitor. Details included are company overview, company financials, revenue generated, market potential, investment in research and development, new market initiatives, global presence, production sites and facilities, production capacities, company strengths and weaknesses, product launch, product width and breadth, application dominance. The above data points provided are only related to the companies' focus related to market.
The Major Market Leaders Operating in the Market Are:
- EAE Electric (Turkey)
- Vass Electrical Industries (Australia)
- Anord Mardix (Ireland)
- ABB (Switzerland)
- Schneider Electric (France)
- Dingsheng group (China)
- Eaton (Ireland)
- Siemens (Germany)
- Delta Power Solutions (Taiwan)
- Wetown (China)
- Power Plug Busduct Sdn. Bhd (Malaysia)
- Rittal Pvt. Ltd (Germany)
- Tai Sin Electric Limited (Singapore)
- Furukawa Electric Co., Ltd. (Japan)
- Vertiv Group Corp. (U.S.)
- FURUTEC ELECTRICAL SDN. BHD. (Malaysia)
Latest Developments in Global Data Center Busway Market
- In February 2025, Schneider Electric announced the opening of new data center and microgrid testing labs at its Global R&D Center in Massachusetts. This development aims to enhance research and innovation in sustainable energy solutions for data centers and microgrids. The labs will focus on testing advanced power distribution technologies, including energy-efficient systems and renewable integration. The initiative is expected to provide companies with more reliable, sustainable, and scalable energy solutions for their operations. This moves positions Schneider Electric as a leader in advancing energy-efficient infrastructure, impacting the data center market by driving further adoption of green energy technologies and promoting sustainability across industries
- In April 2024, Schneider Electric unveiled the I-Line Track, the next generation of power distribution busway for data centers. This development introduces a more flexible, scalable, and energy-efficient solution for powering data centers, designed to meet the increasing demand for high-performance infrastructure. The I-Line Track allows for quick adjustments to power layouts, making it ideal for rapidly expanding facilities. The system enhances operational efficiency and reduces downtime during installation and upgrades. This innovation is expected to significantly impact the market by driving the adoption of smarter and more adaptable power distribution solutions in data centers globally
- In March 2024, Legrand announced the acquisition of Power Bus Way, a key player in power distribution systems for data centers in North America. This strategic acquisition aims to enhance Legrand's portfolio with advanced busway solutions, positioning the company to better meet the growing demand for energy-efficient and scalable power distribution systems in the data center market. The acquisition will enable Legrand to expand its product offerings and provide more comprehensive solutions to data center operators, driving innovation and supporting the industry's transition to more sustainable energy practices. This move is expected to strengthen Legrand's presence in the North American data center market and contribute to its growth in the global power distribution sector
SKU-
Get online access to the report on the World's First Market Intelligence Cloud
- Interactive Data Analysis Dashboard
- Company Analysis Dashboard for high growth potential opportunities
- Research Analyst Access for customization & queries
- Competitor Analysis with Interactive dashboard
- Latest News, Updates & Trend analysis
- Harness the Power of Benchmark Analysis for Comprehensive Competitor Tracking
Table of Content
- introduction
- OBJECTIVES OF THE STUDY
- MARKET DEFINITION
- OVERVIEW of Global Data center busway market
- Currency and Pricing
- LIMITATIONS
- MARKETS COVERED
- MARKET SEGMENTATION
- MARKETS COVERED
- geographicAL scope
- years considered for the study
- DBMR TRIPOD DATA VALIDATION MODEL
- primary interviews with key opinion leaders
- DBMR MARKET POSITION GRID
- vendor share analysis
- Multivariate Modeling
- PRODUCT TYPE timeline curve
- MARKET VERTICAL COVERAGE GRID
- secondary sourcEs
- assumptions
- EXECUTIVE SUMMARY
- premium insights
- CASE STUDY
- CASE STUDY 1- EXPANSION OF FUJITSU’S NORTH LONDON DATA CENTER FACILITY
- CASE STUDY 2- NORTH CAROLINA BASED GIGA DATA CENTRE SERVICE PROVIDER CHOOSE ABB’S POWER DISTRIBUTION SOLUTIONS FOR ITS NEW DATA CENTRE
- CASE STUDY 3- EATON’S BUSWAY ENABLES SMOOTH OPERATIONS AND NEW LEVELS OF DATA CENTER FLEXIBILITY
- market overview
- DRIVERS
- HIGH BENEFITS OFFERED BY BUSWAY SYSTEMS ACTING AS AN ALTERNATIVE TO TRADITIONAL CABLE SYSTEM
- HIGH POWER CONSUMPTION REQUIREMENT BY DATA CENTERS
- RISING DEMANDS FOR COMPACT POWER DISTRIBUTION SYSTEMS
- SURGING DEMAND FOR DATA CENTERS
- EASE OF MONITORING THE POWER DISTRIBUTION SYSTEMS
- RESTRAINTS
- HIGH INSTALLATION COSTS
- AVAILABILITY OF CHEAPER ALTERNATIVE POWER DISTRIBUTION SYSTEMS
- OPPORTUNITIES
- GROWING EMPHASIS ON DIGITALIZATION AND CLOUD COMPUTING
- INCREASING INVESTMENTS IN THE DEVELOPMENT OF IT INFRASTRUCTURE
- RAPID EMERGENCE OF ADVANCED TECHNOLOGIES
- RISE IN BIG DATA GENERATION
- CHALLENGES
- LACK OF SKILLED LABOR FOR INSTALLATION OF BUSWAY SYSTEMS
- HIGH COMPLEXITY OF DATA CENTER DESIGNS
- IMPACT OF COVID-19 ON GLOBAL DATA CENTER BUSWAY MARKET
- ANALYSIS ON IMPACT OF COVID-19 ON THE MARKET
- AFTERMATH OF COVID-19 AND GOVERNMENT INITIATIVE TO BOOST THE MARKET
- STRATEGIC DECISIONS FOR MANUFACTURERS AFTER COVID-19 TO GAIN COMPETITIVE MARKET SHARE
- IMPACT ON DEMAND
- IMPACT ON SUPPLY CHAIN
- IMPACT ON PRICE
- CONCLUSION
- global Data center busway MARKET, BY Product Type
- overview
- Power Distribution Units (PDUS)
- High Strength Enclosed Busway (CFW)
- Intensive Insulation Plug Busway (CMC)
- Air Splicing Busway (BMC)
- Others
- global DATA CENTER BUSWAY MARKET, BY type
- overview
- 3-Phase 4-Wire
- Ceiling Overhead
- Raised Floor
- 3-Phase 5-Wire
- Ceiling Overhead
- Raised Floor
- Others
- global Data center busway MARKET, By Implementation
- overview
- Ceiling Overhead
- Raised Floor
- global DATA CENTER BUSWAY MARKET, BY Data Center Type
- overview
- Large Data Center
- Ceiling Overhead
- Raised Floor
- Mid-Size & Enterprise Data Center
- Ceiling Overhead
- Raised Floor
- global Data center busway MARKET, By Current Ampere
- overview
- Low
- High
- global Data center busway MARKET, By Vertical
- overview
- IT & Telecom
- Banking, Financial Services and Insurance (BFSI)
- Government & Defense
- Manufacturing
- Retail & Ecommerce
- Energy & Utilities
- Healthcare
- Research & Academia
- Others
- Global data center busway market, by region
- overview
- NORTH AMERICa
- u.s.
- canada
- MEXICO
- Europe
- U.K.
- Germany
- France
- Netherlands
- Switzerland
- Italy
- Spain
- Turkey
- Russia
- Belgium
- rest of Europe
- asia-pacific
- CHINA
- India
- australia
- japan
- indonesia
- Singapore
- malaysia
- south korea
- thailand
- philippines
- rest of asia-pacific
- Middle East and Africa
- SOUTH AFRICA
- Saudi Arabia
- U.A.E.
- Egypt
- Israel
- Rest of Middle East and Africa
- SOUTH AMERICA
- Brazil
- Argentina
- REST OF SOUTH AMERICA
- GLOBAL Data Center Busway market: COMPANY landscape
- company share analysis: GLOBAL
- company share analysis: NORTH AMERICA
- company share analysis: EUROPE
- company share analysis: Asia-pacific
- swot analysis
- company profile
- ABB
- COMPANY SNAPSHOT
- REVENUE ANALYSIS
- company share analysis
- PRODUCT PORTFOLIO
- RECENT DEVELOPMENTS
- SCHNEIDER ELECTRIC
- COMPANY SNAPSHOT
- REVENUE ANALYSIS
- company share analysis
- PRODUCT PORTFOLIO
- RECENT DEVELOPMENTS
- SIEMENS
- COMPANY SNAPSHOT
- REVENUE ANALYSIS
- company share analysis
- PRODUCT PORTFOLIO
- RECENT DEVELOPMENTS
- EATON
- COMPANY SNAPSHOT
- REVENUE ANALYSIS
- company share analysis
- PRODUCT PORTFOLIO
- RECENT DEVELOPMENTS
- LEGRAND SA
- COMPANY SNAPSHOT
- REVENUE ANALYSIS
- company share analysis
- PRODUCT PORTFOLIO
- RECENT DEVELOPMENTS
- VERTIV GROUP CORP.
- COMPANY SNAPSHOT
- REVENUE ANALYSIS
- PRODUCT PORTFOLIO
- RECENT DEVELOPMENTS
- DELTA POWER SOLUTIONS
- COMPANY SNAPSHOT
- PRODUCT PORTFOLIO
- RECENT DEVELOPMENTS
- ANORD MARDIX
- COMPANY SNAPSHOT
- PRODUCT PORTFOLIO
- RECENT DEVELOPMENTS
- DINGSHENG GROUP
- COMPANY SNAPSHOT
- PRODUCT PORTFOLIO
- RECENT DEVELOPMENT
- EAE INC.
- COMPANY SNAPSHOT
- PRODUCT PORTFOLIO
- RECENT DEVELOPMENTS
- FURUKAWA ELECTRIC CO., LTD.
- COMPANY SNAPSHOT
- REVENUE ANALYSIS
- PRODUCT PORTFOLIO
- RECENT DEVELOPMENT
- FURUTEC ELECTRICAL SDN BHD
- COMPANY SNAPSHOT
- PRODUCT PORTFOLIO
- RECENT DEVELOPMENT
- LAPP CONNECTO OY
- COMPANY SNAPSHOT
- PRODUCT PORTFOLIO
- RECENT DEVELOPMENTS
- MEGABARRE GROUP, LTD.
- COMPANY SNAPSHOT
- PRODUCT PORTFOLIO
- RECENT DEVELOPMENTS
- POWER PLUG BUSDUCT SDN. BHD.
- COMPANY SNAPSHOT
- PRODUCT PORTFOLIO
- RECENT DEVELOPMENT
- RITTAL GMBH & CO. KG
- COMPANY SNAPSHOT
- PRODUCT PORTFOLIO
- RECENT DEVELOPMENT
- TAIAN-ECOBAR TECHNOLOGY
- COMPANY SNAPSHOT
- PRODUCT PORTFOLIO
- RECENT DEVELOPMENTS
- TAI SIN ELECTRIC LIMITED
- COMPANY SNAPSHOT
- REVENUE ANALYSIS
- PRODUCT PORTFOLIO
- RECENT DEVELOPMENT
- VASS ELECTRICAL INDISTRIES
- COMPANY SNAPSHOT
- PRODUCT PORTFOLIO
- RECENT DEVELOPMENT
- WETOWN
- COMPANY SNAPSHOT
- PRODUCT PORTFOLIO
- RECENT DEVELOPMENT
- questionnaire
- related reports
List of Table
TABLE 1 Global Data center busway Market, By product type, 2019-2028 (USD MILLION)
TABLE 2 Global Power Distribution Units (PDUS) in data center busway market, BY REGION, 2019-2028 (USD MILLION)
TABLE 3 Global High Strength Enclosed Busway (CFW) in data center busway market, BY REGION, 2019-2028 (USD MILLION)
TABLE 4 Global Intensive Insulation Plug Busway (CMC) in data center busway market, BY REGION, 2019-2028 (USD MILLION)
TABLE 5 Global Air Splicing Busway (BMC) in data center busway market, BY REGION, 2019-2028 (USD MILLION)
TABLE 6 Global Others in data center busway market, BY REGION, 2019-2028 (USD MILLION)
TABLE 7 Global Data center busway Market, By type, 2019-2028 (USD MILLION)
TABLE 8 Global 3-Phase 4-Wire in Data center busway Market, BY REGION, 2019-2028 (USD MILLION)
TABLE 9 Global 3-Phase 4-Wire in Data center busway market, By Implementation, 2019-2028 (USD Million)
TABLE 10 Global 3-Phase 5-Wire in Data center busway Market, BY REGION, 2019-2028 (USD MILLION)
TABLE 11 Global 3-Phase 5-Wire in Data center busway market, By Implementation, 2019-2028 (USD Million)
TABLE 12 Global Others in Data center busway Market, BY REGION, 2019-2028 (USD MILLION)
TABLE 13 Global Data center busway Market, By Implementation, 2019-2028 (USD MILLION)
TABLE 14 Global Ceiling Overhead in data center busway market, BY REGION, 2019-2028 (USD MILLION)
TABLE 15 Global Raised Floor in data center busway market, BY REGION, 2019-2028 (USD MILLION)
TABLE 16 Global Data center busway Market, By Data Center Type, 2019-2028 (USD MILLION)
TABLE 17 Global Large data center in Data center busway Market, BY REGION, 2019-2028 (USD MILLION)
TABLE 18 Global Large Data Center in Data center busway market, By Implementation, 2019-2028 (USD Million)
TABLE 19 Global Mid-Size & Enterprise Data Center in Data center busway Market, BY REGION, 2019-2028 (USD MILLION)
TABLE 20 Global Mid-Size & Enterprise Data Center in Data center busway market, By Implementation, 2019-2028 (USD Million)
TABLE 21 Global Data center busway Market, By Current Ampere, 2019-2028 (USD MILLION)
TABLE 22 Global Low in data center busway market, BY REGION, 2019-2028 (USD MILLION)
TABLE 23 Global High in data center busway market, BY REGION, 2019-2028 (USD MILLION)
TABLE 24 Global Data center busway Market, By Vertical, 2019-2028 (USD MILLION)
TABLE 25 Global IT & telecom in data center busway market, BY REGION, 2019-2028 (USD MILLION)
TABLE 26 Global Banking, financial services and insurance (BFSI) in data center busway market, BY REGION, 2019-2028 (USD MILLION)
TABLE 27 Global Government & Defense in data center busway market, BY REGION, 2019-2028 (USD MILLION)
TABLE 28 Global Manufacturing in data center busway market, BY REGION, 2019-2028 (USD MILLION)
TABLE 29 Global Retail & Ecommerce in data center busway market, BY REGION, 2019-2028 (USD MILLION)
TABLE 30 Global Energy & Utilities in data center busway market, BY REGION, 2019-2028 (USD MILLION)
TABLE 31 Global Healthcare in data center busway market, BY REGION, 2019-2028 (USD MILLION)
TABLE 32 Global Research & Academia in data center busway market, BY REGION, 2019-2028 (USD MILLION)
TABLE 33 Global Others in data center busway market, BY REGION, 2019-2028 (USD MILLION)
TABLE 34 Global data center busway market, By rEGION, 2019-2028 (USD Million)
TABLE 35 NORTH AMERICA DATA CENTER BUSWAY Market, By Country, 2019-2028 (USD Million)
TABLE 36 NORTH AMERICA DATA CENTER BUSWAY Market, By Product Type, 2019-2028 (USD Million)
TABLE 37 NORTH AMERICA DATA CENTER BUSWAY Market, By Type, 2019-2028 (USD Million)
TABLE 38 NORTH AMERICA 3-phase 4-wire in DATA CENTER BUSWAY Market, By Implementation, 2019-2028 (USD Million)
TABLE 39 NORTH AMERICA 3-phase 5-wire in DATA CENTER BUSWAY Market, By implementation, 2019-2028 (USD Million)
TABLE 40 NORTH AMERICA DATA CENTER BUSWAY Market, By Implementation, 2019-2028 (USD Million)
TABLE 41 NORTH AMERICA DATA CENTER BUSWAY Market, By data center type, 2019-2028 (USD Million)
TABLE 42 NORTH AMERICA large data center in DATA CENTER BUSWAY Market, By implementation, 2019-2028 (USD Million)
TABLE 43 NORTH AMERICA mid-size & enterprise data center in DATA CENTER BUSWAY Market, By implementation, 2019-2028 (USD Million)
TABLE 44 NORTH AMERICA DATA CENTER BUSWAY Market, By current ampere, 2019-2028 (USD Million)
TABLE 45 NORTH AMERICA Data Center Busway Market, By Vertical, 2019-2028 (USD Million)
TABLE 46 U.S. DATA CENTER BUSWAY Market, By Product Type, 2019-2028 (USD Million)
TABLE 47 U.S. DATA CENTER BUSWAY Market, By Type, 2019-2028 (USD Million)
TABLE 48 U.S. 3-phase 4-wire in DATA CENTER BUSWAY Market, By Implementation, 2019-2028 (USD Million)
TABLE 49 U.S. 3-phase 5-wire in DATA CENTER BUSWAY Market, By implementation, 2019-2028 (USD Million)
TABLE 50 U.S. DATA CENTER BUSWAY Market, By Implementation, 2019-2028 (USD Million)
TABLE 51 U.S. DATA CENTER BUSWAY Market, By data center type, 2019-2028 (USD Million)
TABLE 52 U.S. large data center in DATA CENTER BUSWAY Market, By implementation, 2019-2028 (USD Million)
TABLE 53 U.S. mid-size & enterprise data center in DATA CENTER BUSWAY Market, By implementation, 2019-2028 (USD Million)
TABLE 54 U.S. DATA CENTER BUSWAY Market, By current ampere, 2019-2028 (USD Million)
TABLE 55 U.S. Data Center Busway Market, By Vertical, 2019-2028 (USD Million)
TABLE 56 CANADA DATA CENTER BUSWAY Market, By Product Type, 2019-2028 (USD Million)
TABLE 57 CANADA DATA CENTER BUSWAY Market, By Type, 2019-2028 (USD Million)
TABLE 58 CANADA 3-phase 4-wire in DATA CENTER BUSWAY Market, By Implementation, 2019-2028 (USD Million)
TABLE 59 CANADA 3-phase 5-wire in DATA CENTER BUSWAY Market, By implementation, 2019-2028 (USD Million)
TABLE 60 CANADA DATA CENTER BUSWAY Market, By Implementation, 2019-2028 (USD Million)
TABLE 61 CANADA DATA CENTER BUSWAY Market, By data center type, 2019-2028 (USD Million)
TABLE 62 CANADA large data center in DATA CENTER BUSWAY Market, By implementation, 2019-2028 (USD Million)
TABLE 63 CANADA mid-size & enterprise data center in DATA CENTER BUSWAY Market, By implementation, 2019-2028 (USD Million)
TABLE 64 CANADA DATA CENTER BUSWAY Market, By current ampere, 2019-2028 (USD Million)
TABLE 65 CANADA Data Center Busway Market, By Vertical, 2019-2028 (USD Million)
TABLE 66 MEXICO DATA CENTER BUSWAY Market, By Product Type, 2019-2028 (USD Million)
TABLE 67 MEXICO DATA CENTER BUSWAY Market, By Type, 2019-2028 (USD Million)
TABLE 68 MEXICO 3-phase 4-wire in DATA CENTER BUSWAY Market, By Implementation, 2019-2028 (USD Million)
TABLE 69 MEXICO 3-phase 5-wire in DATA CENTER BUSWAY Market, By implementation, 2019-2028 (USD Million)
TABLE 70 MEXICO DATA CENTER BUSWAY Market, By Implementation, 2019-2028 (USD Million)
TABLE 71 MEXICO DATA CENTER BUSWAY Market, By data center type, 2019-2028 (USD Million)
TABLE 72 MEXICO large data center in DATA CENTER BUSWAY Market, By implementation, 2019-2028 (USD Million)
TABLE 73 MEXICO mid-size & enterprise data center in DATA CENTER BUSWAY Market, By implementation, 2019-2028 (USD Million)
TABLE 74 MEXICO DATA CENTER BUSWAY Market, By current ampere, 2019-2028 (USD Million)
TABLE 75 MEXICO Data Center Busway Market, By Vertical, 2019-2028 (USD Million)
TABLE 76 Europe DATA CENTER BUSWAY Market, By Country, 2019-2028 (USD Million)
TABLE 77 EUROPE DATA CENTER BUSWAY Market, By Product Type, 2019-2028 (USD Million)
TABLE 78 EUROPE DATA CENTER BUSWAY Market, By Type, 2019-2028 (USD Million)
TABLE 79 EUROPE 3-phase 4-wire in DATA CENTER BUSWAY Market, By Implementation, 2019-2028 (USD Million)
TABLE 80 EUROPE 3-phase 5-wire in DATA CENTER BUSWAY Market, By implementation, 2019-2028 (USD Million)
TABLE 81 EUROPE DATA CENTER BUSWAY Market, By Implementation, 2019-2028 (USD Million)
TABLE 82 EUROPE DATA CENTER BUSWAY Market, By data center type, 2019-2028 (USD Million)
TABLE 83 EUROPE large data center in DATA CENTER BUSWAY Market, By implementation, 2019-2028 (USD Million)
TABLE 84 EUROPE mid-size & enterprise data center in DATA CENTER BUSWAY Market, By implementation, 2019-2028 (USD Million)
TABLE 85 EUROPE DATA CENTER BUSWAY Market, By current ampere, 2019-2028 (USD Million)
TABLE 86 EUROPE Data Center Busway Market, By Vertical, 2019-2028 (USD Million)
TABLE 87 U.K. DATA CENTER BUSWAY Market, By Product Type, 2019-2028 (USD Million)
TABLE 88 U.K. DATA CENTER BUSWAY Market, By Type, 2019-2028 (USD Million)
TABLE 89 U.K. 3-phase 4-wire in DATA CENTER BUSWAY Market, By Implementation, 2019-2028 (USD Million)
TABLE 90 U.K. 3-phase 5-wire in DATA CENTER BUSWAY Market, By implementation, 2019-2028 (USD Million)
TABLE 91 U.K. DATA CENTER BUSWAY Market, By Implementation, 2019-2028 (USD Million)
TABLE 92 U.K. DATA CENTER BUSWAY Market, By data center type, 2019-2028 (USD Million)
TABLE 93 U.K. large data center in DATA CENTER BUSWAY Market, By implementation, 2019-2028 (USD Million)
TABLE 94 U.K. mid-size & enterprise data center in DATA CENTER BUSWAY Market, By implementation, 2019-2028 (USD Million)
TABLE 95 U.K. DATA CENTER BUSWAY Market, By current ampere, 2019-2028 (USD Million)
TABLE 96 U.K. Data Center Busway Market, By Vertical, 2019-2028 (USD Million)
TABLE 97 GERMANY DATA CENTER BUSWAY Market, By Product Type, 2019-2028 (USD Million)
TABLE 98 GERMANY DATA CENTER BUSWAY Market, By Type, 2019-2028 (USD Million)
TABLE 99 GERMANY 3-phase 4-wire in DATA CENTER BUSWAY Market, By Implementation, 2019-2028 (USD Million)
TABLE 100 GERMANY 3-phase 5-wire in DATA CENTER BUSWAY Market, By implementation, 2019-2028 (USD Million)
TABLE 101 GERMANY DATA CENTER BUSWAY Market, By Implementation, 2019-2028 (USD Million)
TABLE 102 GERMANY DATA CENTER BUSWAY Market, By data center type, 2019-2028 (USD Million)
TABLE 103 GERMANY large data center in DATA CENTER BUSWAY Market, By implementation, 2019-2028 (USD Million)
TABLE 104 GERMANY mid-size & enterprise data center in DATA CENTER BUSWAY Market, By implementation, 2019-2028 (USD Million)
TABLE 105 GERMANY DATA CENTER BUSWAY Market, By current ampere, 2019-2028 (USD Million)
TABLE 106 GERMANY Data Center Busway Market, By Vertical, 2019-2028 (USD Million)
TABLE 107 FRANCE DATA CENTER BUSWAY Market, By Product Type, 2019-2028 (USD Million)
TABLE 108 FRANCE DATA CENTER BUSWAY Market, By Type, 2019-2028 (USD Million)
TABLE 109 FRANCE 3-phase 4-wire in DATA CENTER BUSWAY Market, By Implementation, 2019-2028 (USD Million)
TABLE 110 FRANCE 3-phase 5-wire in DATA CENTER BUSWAY Market, By implementation, 2019-2028 (USD Million)
TABLE 111 FRANCE DATA CENTER BUSWAY Market, By Implementation, 2019-2028 (USD Million)
TABLE 112 FRANCE DATA CENTER BUSWAY Market, By data center type, 2019-2028 (USD Million)
TABLE 113 FRANCE large data center in DATA CENTER BUSWAY Market, By implementation, 2019-2028 (USD Million)
TABLE 114 FRANCE mid-size & enterprise data center in DATA CENTER BUSWAY Market, By implementation, 2019-2028 (USD Million)
TABLE 115 FRANCE DATA CENTER BUSWAY Market, By current ampere, 2019-2028 (USD Million)
TABLE 116 FRANCE Data Center Busway Market, By Vertical, 2019-2028 (USD Million)
TABLE 117 NETHERLANDS DATA CENTER BUSWAY Market, By Product Type, 2019-2028 (USD Million)
TABLE 118 NETHERLANDS DATA CENTER BUSWAY Market, By Type, 2019-2028 (USD Million)
TABLE 119 NETHERLANDS 3-phase 4-wire in DATA CENTER BUSWAY Market, By Implementation, 2019-2028 (USD Million)
TABLE 120 NETHERLANDS 3-phase 5-wire in DATA CENTER BUSWAY Market, By implementation, 2019-2028 (USD Million)
TABLE 121 NETHERLANDS DATA CENTER BUSWAY Market, By Implementation, 2019-2028 (USD Million)
TABLE 122 NETHERLANDS DATA CENTER BUSWAY Market, By data center type, 2019-2028 (USD Million)
TABLE 123 NETHERLANDS large data center in DATA CENTER BUSWAY Market, By implementation, 2019-2028 (USD Million)
TABLE 124 NETHERLANDS mid-size & enterprise data center in DATA CENTER BUSWAY Market, By implementation, 2019-2028 (USD Million)
TABLE 125 NETHERLANDS DATA CENTER BUSWAY Market, By current ampere, 2019-2028 (USD Million)
TABLE 126 NETHERLANDS Data Center Busway Market, By Vertical, 2019-2028 (USD Million)
TABLE 127 SWITZERLAND DATA CENTER BUSWAY Market, By Product Type, 2019-2028 (USD Million)
TABLE 128 SWITZERLAND DATA CENTER BUSWAY Market, By Type, 2019-2028 (USD Million)
TABLE 129 SWITZERLAND 3-phase 4-wire in DATA CENTER BUSWAY Market, By Implementation, 2019-2028 (USD Million)
TABLE 130 SWITZERLAND 3-phase 5-wire in DATA CENTER BUSWAY Market, By implementation, 2019-2028 (USD Million)
TABLE 131 SWITZERLAND DATA CENTER BUSWAY Market, By Implementation, 2019-2028 (USD Million)
TABLE 132 SWITZERLAND DATA CENTER BUSWAY Market, By data center type, 2019-2028 (USD Million)
TABLE 133 SWITZERLAND large data center in DATA CENTER BUSWAY Market, By implementation, 2019-2028 (USD Million)
TABLE 134 SWITZERLAND mid-size & enterprise data center in DATA CENTER BUSWAY Market, By implementation, 2019-2028 (USD Million)
TABLE 135 SWITZERLAND DATA CENTER BUSWAY Market, By current ampere, 2019-2028 (USD Million)
TABLE 136 SWITZERLAND Data Center Busway Market, By Vertical, 2019-2028 (USD Million)
TABLE 137 ITALY DATA CENTER BUSWAY Market, By Product Type, 2019-2028 (USD Million)
TABLE 138 ITALY DATA CENTER BUSWAY Market, By Type, 2019-2028 (USD Million)
TABLE 139 ITALY 3-phase 4-wire in DATA CENTER BUSWAY Market, By Implementation, 2019-2028 (USD Million)
TABLE 140 ITALY 3-phase 5-wire in DATA CENTER BUSWAY Market, By implementation, 2019-2028 (USD Million)
TABLE 141 ITALY DATA CENTER BUSWAY Market, By Implementation, 2019-2028 (USD Million)
TABLE 142 ITALY DATA CENTER BUSWAY Market, By data center type, 2019-2028 (USD Million)
TABLE 143 ITALY large data center in DATA CENTER BUSWAY Market, By implementation, 2019-2028 (USD Million)
TABLE 144 ITALY mid-size & enterprise data center in DATA CENTER BUSWAY Market, By implementation, 2019-2028 (USD Million)
TABLE 145 ITALY DATA CENTER BUSWAY Market, By current ampere, 2019-2028 (USD Million)
TABLE 146 ITALY Data Center Busway Market, By Vertical, 2019-2028 (USD Million)
TABLE 147 SPAIN DATA CENTER BUSWAY Market, By Product Type, 2019-2028 (USD Million)
TABLE 148 SPAIN DATA CENTER BUSWAY Market, By Type, 2019-2028 (USD Million)
TABLE 149 SPAIN 3-phase 4-wire in DATA CENTER BUSWAY Market, By Implementation, 2019-2028 (USD Million)
TABLE 150 SPAIN 3-phase 5-wire in DATA CENTER BUSWAY Market, By implementation, 2019-2028 (USD Million)
TABLE 151 SPAIN DATA CENTER BUSWAY Market, By Implementation, 2019-2028 (USD Million)
TABLE 152 SPAIN DATA CENTER BUSWAY Market, By data center type, 2019-2028 (USD Million)
TABLE 153 SPAIN large data center in DATA CENTER BUSWAY Market, By implementation, 2019-2028 (USD Million)
TABLE 154 SPAIN mid-size & enterprise data center in DATA CENTER BUSWAY Market, By implementation, 2019-2028 (USD Million)
TABLE 155 SPAIN DATA CENTER BUSWAY Market, By current ampere, 2019-2028 (USD Million)
TABLE 156 SPAIN Data Center Busway Market, By Vertical, 2019-2028 (USD Million)
TABLE 157 TURKEY DATA CENTER BUSWAY Market, By Product Type, 2019-2028 (USD Million)
TABLE 158 TURKEY DATA CENTER BUSWAY Market, By Type, 2019-2028 (USD Million)
TABLE 159 TURKEY 3-phase 4-wire in DATA CENTER BUSWAY Market, By Implementation, 2019-2028 (USD Million)
TABLE 160 TURKEY 3-phase 5-wire in DATA CENTER BUSWAY Market, By implementation, 2019-2028 (USD Million)
TABLE 161 TURKEY DATA CENTER BUSWAY Market, By Implementation, 2019-2028 (USD Million)
TABLE 162 TURKEY DATA CENTER BUSWAY Market, By data center type, 2019-2028 (USD Million)
TABLE 163 TURKEY large data center in DATA CENTER BUSWAY Market, By implementation, 2019-2028 (USD Million)
TABLE 164 TURKEY mid-size & enterprise data center in DATA CENTER BUSWAY Market, By implementation, 2019-2028 (USD Million)
TABLE 165 TURKEY DATA CENTER BUSWAY Market, By current ampere, 2019-2028 (USD Million)
TABLE 166 TURKEY Data Center Busway Market, By Vertical, 2019-2028 (USD Million)
TABLE 167 RUSSIA DATA CENTER BUSWAY Market, By Product Type, 2019-2028 (USD Million)
TABLE 168 RUSSIA DATA CENTER BUSWAY Market, By Type, 2019-2028 (USD Million)
TABLE 169 RUSSIA 3-phase 4-wire in DATA CENTER BUSWAY Market, By Implementation, 2019-2028 (USD Million)
TABLE 170 RUSSIA 3-phase 5-wire in DATA CENTER BUSWAY Market, By implementation, 2019-2028 (USD Million)
TABLE 171 RUSSIA DATA CENTER BUSWAY Market, By Implementation, 2019-2028 (USD Million)
TABLE 172 RUSSIA DATA CENTER BUSWAY Market, By data center type, 2019-2028 (USD Million)
TABLE 173 RUSSIA large data center in DATA CENTER BUSWAY Market, By implementation, 2019-2028 (USD Million)
TABLE 174 RUSSIA mid-size & enterprise data center in DATA CENTER BUSWAY Market, By implementation, 2019-2028 (USD Million)
TABLE 175 RUSSIA DATA CENTER BUSWAY Market, By current ampere, 2019-2028 (USD Million)
TABLE 176 RUSSIA Data Center Busway Market, By Vertical, 2019-2028 (USD Million)
TABLE 177 BELGIUM DATA CENTER BUSWAY Market, By Product Type, 2019-2028 (USD Million)
TABLE 178 BELGIUM DATA CENTER BUSWAY Market, By Type, 2019-2028 (USD Million)
TABLE 179 BELGIUM 3-phase 4-wire in DATA CENTER BUSWAY Market, By Implementation, 2019-2028 (USD Million)
TABLE 180 BELGIUM 3-phase 5-wire in DATA CENTER BUSWAY Market, By implementation, 2019-2028 (USD Million)
TABLE 181 BELGIUM DATA CENTER BUSWAY Market, By Implementation, 2019-2028 (USD Million)
TABLE 182 BELGIUM DATA CENTER BUSWAY Market, By data center type, 2019-2028 (USD Million)
TABLE 183 BELGIUM large data center in DATA CENTER BUSWAY Market, By implementation, 2019-2028 (USD Million)
TABLE 184 BELGIUM mid-size & enterprise data center in DATA CENTER BUSWAY Market, By implementation, 2019-2028 (USD Million)
TABLE 185 BELGIUM DATA CENTER BUSWAY Market, By current ampere, 2019-2028 (USD Million)
TABLE 186 BELGIUM Data Center Busway Market, By Vertical, 2019-2028 (USD Million)
TABLE 187 rest of europe DATA CENTER BUSWAY Market, By Product Type, 2019-2028 (USD Million)
TABLE 188 asia-pacific DATA CENTER BUSWAY Market, By Country, 2019-2028 (USD Million)
TABLE 189 ASIA-PACIFIC DATA CENTER BUSWAY Market, By Product Type, 2019-2028 (USD Million)
TABLE 190 ASIA-PACIFIC DATA CENTER BUSWAY Market, By Type, 2019-2028 (USD Million)
TABLE 191 ASIA-PACIFIC 3-phase 4-wire in DATA CENTER BUSWAY Market, By Implementation, 2019-2028 (USD Million)
TABLE 192 ASIA-PACIFIC 3-phase 5-wire in DATA CENTER BUSWAY Market, By implementation, 2019-2028 (USD Million)
TABLE 193 ASIA-PACIFIC DATA CENTER BUSWAY Market, By Implementation, 2019-2028 (USD Million)
TABLE 194 ASIA-PACIFIC DATA CENTER BUSWAY Market, By data center type, 2019-2028 (USD Million)
TABLE 195 ASIA-PACIFIC large data center in DATA CENTER BUSWAY Market, By implementation, 2019-2028 (USD Million)
TABLE 196 ASIA-PACIFIC mid-size & enterprise data center in DATA CENTER BUSWAY Market, By implementation, 2019-2028 (USD Million)
TABLE 197 ASIA-PACIFIC DATA CENTER BUSWAY Market, By current ampere, 2019-2028 (USD Million)
TABLE 198 ASIA-PACIFIC Data Center Busway Market, By Vertical, 2019-2028 (USD Million)
TABLE 199 CHINA DATA CENTER BUSWAY Market, By Product Type, 2019-2028 (USD Million)
TABLE 200 CHINA DATA CENTER BUSWAY Market, By Type, 2019-2028 (USD Million)
TABLE 201 CHINA 3-phase 4-wire in DATA CENTER BUSWAY Market, By Implementation, 2019-2028 (USD Million)
TABLE 202 CHINA 3-phase 5-wire in DATA CENTER BUSWAY Market, By implementation, 2019-2028 (USD Million)
TABLE 203 CHINA DATA CENTER BUSWAY Market, By Implementation, 2019-2028 (USD Million)
TABLE 204 CHINA DATA CENTER BUSWAY Market, By data center type, 2019-2028 (USD Million)
TABLE 205 CHINA large data center in DATA CENTER BUSWAY Market, By implementation, 2019-2028 (USD Million)
TABLE 206 CHINA mid-size & enterprise data center in DATA CENTER BUSWAY Market, By implementation, 2019-2028 (USD Million)
TABLE 207 CHINA DATA CENTER BUSWAY Market, By current ampere, 2019-2028 (USD Million)
TABLE 208 CHINA Data Center Busway Market, By Vertical, 2019-2028 (USD Million)
TABLE 209 INDIA DATA CENTER BUSWAY Market, By Product Type, 2019-2028 (USD Million)
TABLE 210 INDIA DATA CENTER BUSWAY Market, By Type, 2019-2028 (USD Million)
TABLE 211 INDIA 3-phase 4-wire in DATA CENTER BUSWAY Market, By Implementation, 2019-2028 (USD Million)
TABLE 212 INDIA 3-phase 5-wire in DATA CENTER BUSWAY Market, By implementation, 2019-2028 (USD Million)
TABLE 213 INDIA DATA CENTER BUSWAY Market, By Implementation, 2019-2028 (USD Million)
TABLE 214 INDIA DATA CENTER BUSWAY Market, By data center type, 2019-2028 (USD Million)
TABLE 215 INDIA large data center in DATA CENTER BUSWAY Market, By implementation, 2019-2028 (USD Million)
TABLE 216 INDIA mid-size & enterprise data center in DATA CENTER BUSWAY Market, By implementation, 2019-2028 (USD Million)
TABLE 217 INDIA DATA CENTER BUSWAY Market, By current ampere, 2019-2028 (USD Million)
TABLE 218 INDIA Data Center Busway Market, By Vertical, 2019-2028 (USD Million)
TABLE 219 AUSTRALIA DATA CENTER BUSWAY Market, By Product Type, 2019-2028 (USD Million)
TABLE 220 AUSTRALIA DATA CENTER BUSWAY Market, By Type, 2019-2028 (USD Million)
TABLE 221 AUSTRALIA 3-phase 4-wire in DATA CENTER BUSWAY Market, By Implementation, 2019-2028 (USD Million)
TABLE 222 AUSTRALIA 3-phase 5-wire in DATA CENTER BUSWAY Market, By implementation, 2019-2028 (USD Million)
TABLE 223 AUSTRALIA DATA CENTER BUSWAY Market, By Implementation, 2019-2028 (USD Million)
TABLE 224 AUSTRALIA DATA CENTER BUSWAY Market, By data center type, 2019-2028 (USD Million)
TABLE 225 AUSTRALIA large data center in DATA CENTER BUSWAY Market, By implementation, 2019-2028 (USD Million)
TABLE 226 AUSTRALIA mid-size & enterprise data center in DATA CENTER BUSWAY Market, By implementation, 2019-2028 (USD Million)
TABLE 227 AUSTRALIA DATA CENTER BUSWAY Market, By current ampere, 2019-2028 (USD Million)
TABLE 228 AUSTRALIA Data Center Busway Market, By Vertical, 2019-2028 (USD Million)
TABLE 229 JAPAN DATA CENTER BUSWAY Market, By Product Type, 2019-2028 (USD Million)
TABLE 230 JAPAN DATA CENTER BUSWAY Market, By Type, 2019-2028 (USD Million)
TABLE 231 JAPAN 3-phase 4-wire in DATA CENTER BUSWAY Market, By Implementation, 2019-2028 (USD Million)
TABLE 232 JAPAN 3-phase 5-wire in DATA CENTER BUSWAY Market, By implementation, 2019-2028 (USD Million)
TABLE 233 JAPAN DATA CENTER BUSWAY Market, By Implementation, 2019-2028 (USD Million)
TABLE 234 JAPAN DATA CENTER BUSWAY Market, By data center type, 2019-2028 (USD Million)
TABLE 235 JAPAN large data center in DATA CENTER BUSWAY Market, By implementation, 2019-2028 (USD Million)
TABLE 236 JAPAN mid-size & enterprise data center in DATA CENTER BUSWAY Market, By implementation, 2019-2028 (USD Million)
TABLE 237 JAPAN DATA CENTER BUSWAY Market, By current ampere, 2019-2028 (USD Million)
TABLE 238 JAPAN Data Center Busway Market, By Vertical, 2019-2028 (USD Million)
TABLE 239 INDONESIA DATA CENTER BUSWAY Market, By Product Type, 2019-2028 (USD Million)
TABLE 240 INDONESIA DATA CENTER BUSWAY Market, By Type, 2019-2028 (USD Million)
TABLE 241 INDONESIA 3-phase 4-wire in DATA CENTER BUSWAY Market, By Implementation, 2019-2028 (USD Million)
TABLE 242 INDONESIA 3-phase 5-wire in DATA CENTER BUSWAY Market, By implementation, 2019-2028 (USD Million)
TABLE 243 INDONESIA DATA CENTER BUSWAY Market, By Implementation, 2019-2028 (USD Million)
TABLE 244 INDONESIA DATA CENTER BUSWAY Market, By data center type, 2019-2028 (USD Million)
TABLE 245 INDONESIA large data center in DATA CENTER BUSWAY Market, By implementation, 2019-2028 (USD Million)
TABLE 246 INDONESIA mid-size & enterprise data center in DATA CENTER BUSWAY Market, By implementation, 2019-2028 (USD Million)
TABLE 247 INDONESIA DATA CENTER BUSWAY Market, By current ampere, 2019-2028 (USD Million)
TABLE 248 INDONESIA Data Center Busway Market, By Vertical, 2019-2028 (USD Million)
TABLE 249 SINGAPORE DATA CENTER BUSWAY Market, By Product Type, 2019-2028 (USD Million)
TABLE 250 SINGAPORE DATA CENTER BUSWAY Market, By Type, 2019-2028 (USD Million)
TABLE 251 SINGAPORE 3-phase 4-wire in DATA CENTER BUSWAY Market, By Implementation, 2019-2028 (USD Million)
TABLE 252 SINGAPORE 3-phase 5-wire in DATA CENTER BUSWAY Market, By implementation, 2019-2028 (USD Million)
TABLE 253 SINGAPORE DATA CENTER BUSWAY Market, By Implementation, 2019-2028 (USD Million)
TABLE 254 SINGAPORE DATA CENTER BUSWAY Market, By data center type, 2019-2028 (USD Million)
TABLE 255 SINGAPORE large data center in DATA CENTER BUSWAY Market, By implementation, 2019-2028 (USD Million)
TABLE 256 SINGAPORE mid-size & enterprise data center in DATA CENTER BUSWAY Market, By implementation, 2019-2028 (USD Million)
TABLE 257 SINGAPORE DATA CENTER BUSWAY Market, By current ampere, 2019-2028 (USD Million)
TABLE 258 SINGAPORE Data Center Busway Market, By Vertical, 2019-2028 (USD Million)
TABLE 259 MALAYSIA DATA CENTER BUSWAY Market, By Product Type, 2019-2028 (USD Million)
TABLE 260 MALAYSIA DATA CENTER BUSWAY Market, By Type, 2019-2028 (USD Million)
TABLE 261 MALAYSIA 3-phase 4-wire in DATA CENTER BUSWAY Market, By Implementation, 2019-2028 (USD Million)
TABLE 262 MALAYSIA 3-phase 5-wire in DATA CENTER BUSWAY Market, By implementation, 2019-2028 (USD Million)
TABLE 263 MALAYSIA DATA CENTER BUSWAY Market, By Implementation, 2019-2028 (USD Million)
TABLE 264 MALAYSIA DATA CENTER BUSWAY Market, By data center type, 2019-2028 (USD Million)
TABLE 265 MALAYSIA large data center in DATA CENTER BUSWAY Market, By implementation, 2019-2028 (USD Million)
TABLE 266 MALAYSIA mid-size & enterprise data center in DATA CENTER BUSWAY Market, By implementation, 2019-2028 (USD Million)
TABLE 267 MALAYSIA DATA CENTER BUSWAY Market, By current ampere, 2019-2028 (USD Million)
TABLE 268 MALAYSIA Data Center Busway Market, By Vertical, 2019-2028 (USD Million)
TABLE 269 SOUTH KOREA DATA CENTER BUSWAY Market, By Product Type, 2019-2028 (USD Million)
TABLE 270 SOUTH KOREA DATA CENTER BUSWAY Market, By Type, 2019-2028 (USD Million)
TABLE 271 SOUTH KOREA 3-phase 4-wire in DATA CENTER BUSWAY Market, By Implementation, 2019-2028 (USD Million)
TABLE 272 SOUTH KOREA 3-phase 5-wire in DATA CENTER BUSWAY Market, By implementation, 2019-2028 (USD Million)
TABLE 273 SOUTH KOREA DATA CENTER BUSWAY Market, By Implementation, 2019-2028 (USD Million)
TABLE 274 SOUTH KOREA DATA CENTER BUSWAY Market, By data center type, 2019-2028 (USD Million)
TABLE 275 SOUTH KOREA large data center in DATA CENTER BUSWAY Market, By implementation, 2019-2028 (USD Million)
TABLE 276 SOUTH KOREA mid-size & enterprise data center in DATA CENTER BUSWAY Market, By implementation, 2019-2028 (USD Million)
TABLE 277 SOUTH KOREA DATA CENTER BUSWAY Market, By current ampere, 2019-2028 (USD Million)
TABLE 278 SOUTH KOREA Data Center Busway Market, By Vertical, 2019-2028 (USD Million)
TABLE 279 THAILAND DATA CENTER BUSWAY Market, By Product Type, 2019-2028 (USD Million)
TABLE 280 THAILAND DATA CENTER BUSWAY Market, By Type, 2019-2028 (USD Million)
TABLE 281 THAILAND 3-phase 4-wire in DATA CENTER BUSWAY Market, By Implementation, 2019-2028 (USD Million)
TABLE 282 THAILAND 3-phase 5-wire in DATA CENTER BUSWAY Market, By implementation, 2019-2028 (USD Million)
TABLE 283 THAILAND DATA CENTER BUSWAY Market, By Implementation, 2019-2028 (USD Million)
TABLE 284 THAILAND DATA CENTER BUSWAY Market, By data center type, 2019-2028 (USD Million)
TABLE 285 THAILAND large data center in DATA CENTER BUSWAY Market, By implementation, 2019-2028 (USD Million)
TABLE 286 THAILAND mid-size & enterprise data center in DATA CENTER BUSWAY Market, By implementation, 2019-2028 (USD Million)
TABLE 287 THAILAND DATA CENTER BUSWAY Market, By current ampere, 2019-2028 (USD Million)
TABLE 288 THAILAND Data Center Busway Market, By Vertical, 2019-2028 (USD Million)
TABLE 289 PHILIPPINES DATA CENTER BUSWAY Market, By Product Type, 2019-2028 (USD Million)
TABLE 290 PHILIPPINES DATA CENTER BUSWAY Market, By Type, 2019-2028 (USD Million)
TABLE 291 PHILIPPINES 3-phase 4-wire in DATA CENTER BUSWAY Market, By Implementation, 2019-2028 (USD Million)
TABLE 292 PHILIPPINES 3-phase 5-wire in DATA CENTER BUSWAY Market, By implementation, 2019-2028 (USD Million)
TABLE 293 PHILIPPINES DATA CENTER BUSWAY Market, By Implementation, 2019-2028 (USD Million)
TABLE 294 PHILIPPINES DATA CENTER BUSWAY Market, By data center type, 2019-2028 (USD Million)
TABLE 295 PHILIPPINES large data center in DATA CENTER BUSWAY Market, By implementation, 2019-2028 (USD Million)
TABLE 296 PHILIPPINES mid-size & enterprise data center in DATA CENTER BUSWAY Market, By implementation, 2019-2028 (USD Million)
TABLE 297 PHILIPPINES DATA CENTER BUSWAY Market, By current ampere, 2019-2028 (USD Million)
TABLE 298 PHILIPPINES Data Center Busway Market, By Vertical, 2019-2028 (USD Million)
TABLE 299 rest of asia-pacific DATA CENTER BUSWAY Market, By Product Type, 2019-2028 (USD Million)
TABLE 300 Middle East and Africa DATA CENTER BUSWAY Market, By Country, 2019-2028 (USD Million)
TABLE 301 MIDDLE EAST AND AFRICA DATA CENTER BUSWAY Market, By Product Type, 2019-2028 (USD Million)
TABLE 302 MIDDLE EAST AND AFRICA DATA CENTER BUSWAY Market, By Type, 2019-2028 (USD Million)
TABLE 303 MIDDLE EAST AND AFRICA 3-phase 4-wire in DATA CENTER BUSWAY Market, By Implementation, 2019-2028 (USD Million)
TABLE 304 MIDDLE EAST AND AFRICA 3-phase 5-wire in DATA CENTER BUSWAY Market, By implementation, 2019-2028 (USD Million)
TABLE 305 MIDDLE EAST AND AFRICA DATA CENTER BUSWAY Market, By Implementation, 2019-2028 (USD Million)
TABLE 306 MIDDLE EAST AND AFRICA DATA CENTER BUSWAY Market, By data center type, 2019-2028 (USD Million)
TABLE 307 MIDDLE EAST AND AFRICA large data center in DATA CENTER BUSWAY Market, By implementation, 2019-2028 (USD Million)
TABLE 308 MIDDLE EAST AND AFRICA mid-size & enterprise data center in DATA CENTER BUSWAY Market, By implementation, 2019-2028 (USD Million)
TABLE 309 MIDDLE EAST AND AFRICA DATA CENTER BUSWAY Market, By current ampere, 2019-2028 (USD Million)
TABLE 310 MIDDLE EAST AND AFRICA Data Center Busway Market, By Vertical, 2019-2028 (USD Million)
TABLE 311 SOUTH AFRICA DATA CENTER BUSWAY Market, By Product Type, 2019-2028 (USD Million)
TABLE 312 SOUTH AFRICA DATA CENTER BUSWAY Market, By Type, 2019-2028 (USD Million)
TABLE 313 SOUTH AFRICA 3-phase 4-wire in DATA CENTER BUSWAY Market, By Implementation, 2019-2028 (USD Million)
TABLE 314 SOUTH AFRICA 3-phase 5-wire in DATA CENTER BUSWAY Market, By implementation, 2019-2028 (USD Million)
TABLE 315 SOUTH AFRICA DATA CENTER BUSWAY Market, By Implementation, 2019-2028 (USD Million)
TABLE 316 SOUTH AFRICA DATA CENTER BUSWAY Market, By data center type, 2019-2028 (USD Million)
TABLE 317 SOUTH AFRICA large data center in DATA CENTER BUSWAY Market, By implementation, 2019-2028 (USD Million)
TABLE 318 SOUTH AFRICA mid-size & enterprise data center in DATA CENTER BUSWAY Market, By implementation, 2019-2028 (USD Million)
TABLE 319 SOUTH AFRICA DATA CENTER BUSWAY Market, By current ampere, 2019-2028 (USD Million)
TABLE 320 SOUTH AFRICA Data Center Busway Market, By Vertical, 2019-2028 (USD Million)
TABLE 321 SAUDI ARABIA DATA CENTER BUSWAY Market, By Product Type, 2019-2028 (USD Million)
TABLE 322 SAUDI ARABIA DATA CENTER BUSWAY Market, By Type, 2019-2028 (USD Million)
TABLE 323 SAUDI ARABIA 3-phase 4-wire in DATA CENTER BUSWAY Market, By Implementation, 2019-2028 (USD Million)
TABLE 324 SAUDI ARABIA 3-phase 5-wire in DATA CENTER BUSWAY Market, By implementation, 2019-2028 (USD Million)
TABLE 325 SAUDI ARABIA DATA CENTER BUSWAY Market, By Implementation, 2019-2028 (USD Million)
TABLE 326 SAUDI ARABIA DATA CENTER BUSWAY Market, By data center type, 2019-2028 (USD Million)
TABLE 327 SAUDI ARABIA large data center in DATA CENTER BUSWAY Market, By implementation, 2019-2028 (USD Million)
TABLE 328 SAUDI ARABIA mid-size & enterprise data center in DATA CENTER BUSWAY Market, By implementation, 2019-2028 (USD Million)
TABLE 329 SAUDI ARABIA DATA CENTER BUSWAY Market, By current ampere, 2019-2028 (USD Million)
TABLE 330 SAUDI ARABIA Data Center Busway Market, By Vertical, 2019-2028 (USD Million)
TABLE 331 U.A.E. DATA CENTER BUSWAY Market, By Product Type, 2019-2028 (USD Million)
TABLE 332 U.A.E. DATA CENTER BUSWAY Market, By Type, 2019-2028 (USD Million)
TABLE 333 U.A.E. 3-phase 4-wire in DATA CENTER BUSWAY Market, By Implementation, 2019-2028 (USD Million)
TABLE 334 U.A.E. 3-phase 5-wire in DATA CENTER BUSWAY Market, By implementation, 2019-2028 (USD Million)
TABLE 335 U.A.E. DATA CENTER BUSWAY Market, By Implementation, 2019-2028 (USD Million)
TABLE 336 U.A.E. DATA CENTER BUSWAY Market, By data center type, 2019-2028 (USD Million)
TABLE 337 U.A.E. large data center in DATA CENTER BUSWAY Market, By implementation, 2019-2028 (USD Million)
TABLE 338 U.A.E. mid-size & enterprise data center in DATA CENTER BUSWAY Market, By implementation, 2019-2028 (USD Million)
TABLE 339 U.A.E. DATA CENTER BUSWAY Market, By current ampere, 2019-2028 (USD Million)
TABLE 340 U.A.E. Data Center Busway Market, By Vertical, 2019-2028 (USD Million)
TABLE 341 EGYPT DATA CENTER BUSWAY Market, By Product Type, 2019-2028 (USD Million)
TABLE 342 EGYPT DATA CENTER BUSWAY Market, By Type, 2019-2028 (USD Million)
TABLE 343 EGYPT 3-phase 4-wire in DATA CENTER BUSWAY Market, By Implementation, 2019-2028 (USD Million)
TABLE 344 EGYPT 3-phase 5-wire in DATA CENTER BUSWAY Market, By implementation, 2019-2028 (USD Million)
TABLE 345 EGYPT DATA CENTER BUSWAY Market, By Implementation, 2019-2028 (USD Million)
TABLE 346 EGYPT DATA CENTER BUSWAY Market, By data center type, 2019-2028 (USD Million)
TABLE 347 EGYPT large data center in DATA CENTER BUSWAY Market, By implementation, 2019-2028 (USD Million)
TABLE 348 EGYPT mid-size & enterprise data center in DATA CENTER BUSWAY Market, By implementation, 2019-2028 (USD Million)
TABLE 349 EGYPT DATA CENTER BUSWAY Market, By current ampere, 2019-2028 (USD Million)
TABLE 350 EGYPT Data Center Busway Market, By Vertical, 2019-2028 (USD Million)
TABLE 351 ISRAEL DATA CENTER BUSWAY Market, By Product Type, 2019-2028 (USD Million)
TABLE 352 ISRAEL DATA CENTER BUSWAY Market, By Type, 2019-2028 (USD Million)
TABLE 353 ISRAEL 3-phase 4-wire in DATA CENTER BUSWAY Market, By Implementation, 2019-2028 (USD Million)
TABLE 354 ISRAEL 3-phase 5-wire in DATA CENTER BUSWAY Market, By implementation, 2019-2028 (USD Million)
TABLE 355 ISRAEL DATA CENTER BUSWAY Market, By Implementation, 2019-2028 (USD Million)
TABLE 356 ISRAEL DATA CENTER BUSWAY Market, By data center type, 2019-2028 (USD Million)
TABLE 357 ISRAEL large data center in DATA CENTER BUSWAY Market, By implementation, 2019-2028 (USD Million)
TABLE 358 ISRAEL mid-size & enterprise data center in DATA CENTER BUSWAY Market, By implementation, 2019-2028 (USD Million)
TABLE 359 ISRAEL DATA CENTER BUSWAY Market, By current ampere, 2019-2028 (USD Million)
TABLE 360 ISRAEL Data Center Busway Market, By Vertical, 2019-2028 (USD Million)
TABLE 361 REST OF MIDDLE EAST AND AFRICA DATA CENTER BUSWAY Market, By Product Type, 2019-2028 (USD Million)
TABLE 362 SOUTH AMERICA DATA CENTER BUSWAY Market, By Country, 2019-2028 (USD Million)
TABLE 363 SOUTH AMERICA DATA CENTER BUSWAY Market, By Product Type, 2019-2028 (USD Million)
TABLE 364 SOUTH AMERICA DATA CENTER BUSWAY Market, By Type, 2019-2028 (USD Million)
TABLE 365 SOUTH AMERICA 3-phase 4-wire in DATA CENTER BUSWAY Market, By Implementation, 2019-2028 (USD Million)
TABLE 366 SOUTH AMERICA 3-phase 5-wire in DATA CENTER BUSWAY Market, By implementation, 2019-2028 (USD Million)
TABLE 367 SOUTH AMERICA DATA CENTER BUSWAY Market, By Implementation, 2019-2028 (USD Million)
TABLE 368 SOUTH AMERICA DATA CENTER BUSWAY Market, By data center type, 2019-2028 (USD Million)
TABLE 369 SOUTH AMERICA large data center in DATA CENTER BUSWAY Market, By implementation, 2019-2028 (USD Million)
TABLE 370 SOUTH AMERICA mid-size & enterprise data center in DATA CENTER BUSWAY Market, By implementation, 2019-2028 (USD Million)
TABLE 371 SOUTH AMERICA DATA CENTER BUSWAY Market, By current ampere, 2019-2028 (USD Million)
TABLE 372 SOUTH AMERICA Data Center Busway Market, By Vertical, 2019-2028 (USD Million)
TABLE 373 BRAZIL DATA CENTER BUSWAY Market, By Product Type, 2019-2028 (USD Million)
TABLE 374 BRAZIL DATA CENTER BUSWAY Market, By Type, 2019-2028 (USD Million)
TABLE 375 BRAZIL 3-phase 4-wire in DATA CENTER BUSWAY Market, By Implementation, 2019-2028 (USD Million)
TABLE 376 BRAZIL 3-phase 5-wire in DATA CENTER BUSWAY Market, By implementation, 2019-2028 (USD Million)
TABLE 377 BRAZIL DATA CENTER BUSWAY Market, By Implementation, 2019-2028 (USD Million)
TABLE 378 BRAZIL DATA CENTER BUSWAY Market, By data center type, 2019-2028 (USD Million)
TABLE 379 BRAZIL large data center in DATA CENTER BUSWAY Market, By implementation, 2019-2028 (USD Million)
TABLE 380 BRAZIL mid-size & enterprise data center in DATA CENTER BUSWAY Market, By implementation, 2019-2028 (USD Million)
TABLE 381 BRAZIL DATA CENTER BUSWAY Market, By current ampere, 2019-2028 (USD Million)
TABLE 382 BRAZIL Data Center Busway Market, By Vertical, 2019-2028 (USD Million)
TABLE 383 ARGENTINA DATA CENTER BUSWAY Market, By Product Type, 2019-2028 (USD Million)
TABLE 384 ARGENTINA DATA CENTER BUSWAY Market, By Type, 2019-2028 (USD Million)
TABLE 385 ARGENTINA 3-phase 4-wire in DATA CENTER BUSWAY Market, By Implementation, 2019-2028 (USD Million)
TABLE 386 ARGENTINA 3-phase 5-wire in DATA CENTER BUSWAY Market, By implementation, 2019-2028 (USD Million)
TABLE 387 ARGENTINA DATA CENTER BUSWAY Market, By Implementation, 2019-2028 (USD Million)
TABLE 388 ARGENTINA DATA CENTER BUSWAY Market, By data center type, 2019-2028 (USD Million)
TABLE 389 ARGENTINA large data center in DATA CENTER BUSWAY Market, By implementation, 2019-2028 (USD Million)
TABLE 390 ARGENTINA mid-size & enterprise data center in DATA CENTER BUSWAY Market, By implementation, 2019-2028 (USD Million)
TABLE 391 ARGENTINA DATA CENTER BUSWAY Market, By current ampere, 2019-2028 (USD Million)
TABLE 392 ARGENTINA Data Center Busway Market, By Vertical, 2019-2028 (USD Million)
TABLE 393 rest of south america DATA CENTER BUSWAY Market, By Product Type, 2019-2028 (USD Million)
List of Figure
FIGURE 1 Global Data center busway market: segmentation
FIGURE 2 Global Data center busway market: data triangulation
FIGURE 3 Global Data center busway market: DROC ANALYSIS
FIGURE 4 Global Data center busway market: GLOBAL VS REGIONAL MARKET ANALYSIS
FIGURE 5 Global Data center busway market: COMPANY RESEARCH ANALYSIS
FIGURE 6 Global Data center busway market: INTERVIEW DEMOGRAPHICS
FIGURE 7 Global Data center busway market: DBMR MARKET POSITION GRID
FIGURE 8 Global Data center busway market: vendor share analysis
FIGURE 9 GLOBAL Data center busway MARKET: MARKET VERTICAL COVERAGE GRID
FIGURE 10 Global Data center busway market: SEGMENTATION
FIGURE 11 Rising demand for COMPACT POWER DISTRIBUTION SYSTEMS is EXPECTED TO DRIVE Global Data center busway market IN THE FORECAST PERIOD OF 2021 to 2028
FIGURE 12 POWER DISTRIBUTION UNITS (PDUS) segment is expected to account for the largest share of Global Data center busway market in 2021 & 2028
FIGURE 13 NORTH AMERICA is expected to DOMINATE and is the fastest-growing region in THE global Data center busway market IN the forecast period of 2021 to 2028
FIGURE 14 North America is the fastest growing market for Data center busway manufacturers in the forecast period of 2021 to 2028
FIGURE 15 DRIVERS, RESTRAINTS, OPPORTUNITIES AND CHALLENGES OF global data center busway Market
FIGURE 16 Global Data center busway MARKET: BY product type, 2020
FIGURE 17 Global Data center busway MARKET: BY type, 2020
FIGURE 18 Global Data center busway MARKET: BY Implementation, 2020
FIGURE 19 Global Data center busway MARKET: BY Data Center Type, 2020
FIGURE 20 Global Data center busway MARKET: BY Current Ampere, 2020
FIGURE 21 Global Data center busway MARKET: BY Vertical, 2020
FIGURE 22 Global data center busway market: SNAPSHOT (2020)
FIGURE 23 Global data center busway market: by region (2020)
FIGURE 24 Global data center busway market: by region (2021 & 2028)
FIGURE 25 Global data center busway market: by region (2020 & 2028)
FIGURE 26 Global data center busway market: by Product type (2021-2028)
FIGURE 27 NORTH AMERICA DATA CENTER BUSWAY MARKET: SNAPSHOT (2020)
FIGURE 28 NORTH AMERICA DATA CENTER BUSWAY MARKET: by Country (2020)
FIGURE 29 NORTH AMERICA DATA CENTER BUSWAY MARKET: by Country (2021 & 2028)
FIGURE 30 NORTH AMERICA DATA CENTER BUSWAY MARKET: by Country (2020 & 2028)
FIGURE 31 NORTH AMERICA DATA CENTER BUSWAY MARKET: by product type (2021-2028)
FIGURE 32 Europe DATA CENTER BUSWAY MARKET: SNAPSHOT (2020)
FIGURE 33 Europe DATA CENTER BUSWAY MARKET: by Country (2020)
FIGURE 34 Europe DATA CENTER BUSWAY MARKET: by Country (2021 & 2028)
FIGURE 35 Europe DATA CENTER BUSWAY MARKET: by Country (2020 & 2028)
FIGURE 36 Europe DATA CENTER BUSWAY MARKET: by product type (2021-2028)
FIGURE 37 asia-pacific DATA CENTER BUSWAY MARKET: SNAPSHOT (2020)
FIGURE 38 asia-pacific DATA CENTER BUSWAY MARKET: by Country (2020)
FIGURE 39 asia-pacific DATA CENTER BUSWAY MARKET: by Country (2021 & 2028)
FIGURE 40 asia-pacific DATA CENTER BUSWAY MARKET: by Country (2020 & 2028)
FIGURE 41 asia-pacific DATA CENTER BUSWAY MARKET: by product type (2021-2028)
FIGURE 42 Middle East and Africa DATA CENTER BUSWAY MARKET: SNAPSHOT (2020)
FIGURE 43 Middle East and Africa DATA CENTER BUSWAY MARKET: by Country (2020)
FIGURE 44 Middle East and Africa DATA CENTER BUSWAY MARKET: by Country (2021 & 2028)
FIGURE 45 Middle East and Africa DATA CENTER BUSWAY MARKET: by Country (2020 & 2028)
FIGURE 46 Middle East and Africa DATA CENTER BUSWAY MARKET: by product type (2021-2028)
FIGURE 47 SOUTH AMERICA DATA CENTER BUSWAY MARKET: SNAPSHOT (2020)
FIGURE 48 SOUTH AMERICA DATA CENTER BUSWAY MARKET: by Country (2020)
FIGURE 49 SOUTH AMERICA DATA CENTER BUSWAY MARKET: by Country (2021 & 2028)
FIGURE 50 SOUTH AMERICA DATA CENTER BUSWAY MARKET: by Country (2020 & 2028)
FIGURE 51 SOUTH AMERICA DATA CENTER BUSWAY MARKET: by product type (2021-2028)
FIGURE 52 global Data Center Busway Market: company share 2020 (%)
FIGURE 53 NORTH AMERICA Data Center Busway Market: company share 2020 (%)
FIGURE 54 Europe Data Center Busway Market: company share 2020 (%)
FIGURE 55 Asia-Pacific Data Center Busway Market: company share 2020 (%)

Research Methodology
Data collection and base year analysis are done using data collection modules with large sample sizes. The stage includes obtaining market information or related data through various sources and strategies. It includes examining and planning all the data acquired from the past in advance. It likewise envelops the examination of information inconsistencies seen across different information sources. The market data is analysed and estimated using market statistical and coherent models. Also, market share analysis and key trend analysis are the major success factors in the market report. To know more, please request an analyst call or drop down your inquiry.
The key research methodology used by DBMR research team is data triangulation which involves data mining, analysis of the impact of data variables on the market and primary (industry expert) validation. Data models include Vendor Positioning Grid, Market Time Line Analysis, Market Overview and Guide, Company Positioning Grid, Patent Analysis, Pricing Analysis, Company Market Share Analysis, Standards of Measurement, Global versus Regional and Vendor Share Analysis. To know more about the research methodology, drop in an inquiry to speak to our industry experts.
Customization Available
Data Bridge Market Research is a leader in advanced formative research. We take pride in servicing our existing and new customers with data and analysis that match and suits their goal. The report can be customized to include price trend analysis of target brands understanding the market for additional countries (ask for the list of countries), clinical trial results data, literature review, refurbished market and product base analysis. Market analysis of target competitors can be analyzed from technology-based analysis to market portfolio strategies. We can add as many competitors that you require data about in the format and data style you are looking for. Our team of analysts can also provide you data in crude raw excel files pivot tables (Fact book) or can assist you in creating presentations from the data sets available in the report.